Abstract
Dual color emissivity free methodology by thermography allows to obtain 2D (two-dimensional) temperature maps by using local grey body hypotheses and narrowband filters. By using a suitable pair of filters is possible to obtain the ratio between two thermal camera input signals that depend only on the temperature and not on the emissive properties of the investigated surface. The aim of this concise review paper is to summarize and discuss the developments and applications from long- to mid-near infrared ranges and in a wide range of temperature values of the dual-color thermographic technique that has been analysed through the use of an analytical model based on the integration of Planck’s law and attenuated with the transmission curves of sensors, optics, filters, and attenuators during the last years. Moreover, the applicability to the non-stationary temperature conditions and finalized to the materials mainly used in the aerospace plasma wind tunnel (PWT) re-entry are shown.
1. Introduction
The use of infrared (IR) thermography as a radiometric technique is of great interest thanks to the capability to be a full-field, real-time, and contactless investigation method. Using radiation techniques for quantitative temperature measurements can be difficult due to the dependency of the surface radiation on the emissivity, εobj (a surface property that changes with several parameters such as the direction of radiation, temperature, and wavelength, and it is also strictly dependent on the state of the surface) [1].
During the plasma wind tunnel (PWT) tests, the thermal protection system (TPS) articles undergo thermal stresses, leading to high-temperature values (up to 2500 °C). Contactless, non-intrusive techniques are needed, and in order to predict information about the distribution of temperature over surface objects that are subject to the hypersonic plasma, proper tools have to be developed capable of solving problems such as the emissivity knowledge that, in most cases, is mainly due to the of the chemical feature variations occurring during the test and the innovativeness of the used materials. In the last years, a wide variety of techniques have been developed in order to obtain accurate and precise temperature measurements. Intrusive techniques, including the use of thermocouples, gardon gauges, pressure sensors, and non-intrusive techniques through infra-red (IR) pyrometers, spectroscopy [2], and IR cameras [3] have been used for the monitoring of the phenomena in the hypersonic motion conditions.
The use of thermocouples needs direct contact with the material for which the temperature is measured [3,4]. Moreover, the application requires a priori knowledge of the spots of interest and the detection of high temperatures. Moreover, the mechanical features of the test article can be affected by the thermocouple’s application and for this reason, they cannot always be used because they are often placed under the surfaces of the material exposed to the flow jet.
Methodologies based on thermal radiation belong to two main methods—pyrometry and thermography. The first is able to provide point-like information in terms of the object’s thermal state, while thermography can be used to detect a 2D (two-dimensional) surface map of temperature. The attention in recent years is focused on IR thermography due to features such as being a contactless, full-field, and real-time inspection method [1].
Nevertheless, for the temperature measurement of test articles in PWT, pyrometry is well known and often used, but it is characterized by the limitation to provide information relative to a limited number of target surface points. This is mainly due both to its intrinsic limitations and to the limited number of the PWT optical accesses. So, if an operator wanted to build a 2D map of the temperature of the target, by interpolating the pyrometer measurements associated with several spots, a huge number of pyrometers should be used and the result could hardly be compared in terms of spatial resolution to the ones obtained through the modern thermographic devices characterized by a resolution up to 640 × 512 pixels.
This study is a concise review paper regarding the 2D free emissivity dual-color IR methodology with the novelty to expand the technique to the unsteady conditions for different emissivity classes, in a very distinctive environment as in the aerospace field. To our knowledge, this technique has never been developed to get 2D thermographic images and is also never applied in the aerospace field. So, a state of the art of diagnostic methodology that is applied to thermal conditions compatible with the ones connected to the atmospheric re-entry has been summarized and compacted in several IR spectral ranges (medium [5,6,7], long [6], and near [7] wavelength ranges) for a deeper understanding of the readers. Moreover, as a novelty, the analyses have been performed considering an unsteady temperature scenario for a specific device (FLIR Orion 7600) and for different classes of materials in terms of their emissivity (i.e., low, medium, and high emissivity materials). The main aim consists of establishing for which material classes, the dual-color (DC) methodology can be adopted for a more precise and accurate temperature detection especially compared to the other standard techniques. The results compared with the ones from the use of standard techniques, considering the same model and the same features for IR camera, allow us to focus the benefits of the DC methodology on the basis of non-grey body materials behavior. The great potential of the dual-color thermography allows us to estimate the object’s temperature without the need to know or assume the emissivity value. The application to a thermographic system (in this context, the response curve of detectors and filters compatible with thermal cameras commercially available), gives the capability to provide two dimensional thermographic maps free from the emissivity knowledge, by applying pixel by pixel of a focal planar array (FPA) the criteria described in this work.
2. Dual-Color Theory
The thermal signal Grealj(Tobj, εobj), the infrared radiation reaching the detector of the camera for several passband filters, can be obtained by the integration of the Planck’s law for a real surface in the working spectral range of the IR camera (λ′ e λ″) and considering transmissivity functions, respectively, for the sensor (Rt(λ)), the optics (Rot(λ)), the applied filter (F(λ)), and for the attenuators (A(λ))
where λ is the wavelength of the radiation, εobj is the surface emissivity, Tobj is the surface temperature, and C1 and C2 are the first and second Planck radiation constants, respectively.
If Gbb,1(T) and Gbb,2(T) are the infrared radiations that reach the detector (considering a black body as source) associated with filters F1 and F2, we have
which is only a temperature function and the calibration curves can be obtained by calculating the ratio as
naturally, the real signal ratio between the radiation coming from a real target captured by two adjacent filters can be expressed as
SR(T) = Gbb,1(T)/Gbb,2(T).
SRreal(T) = Greal1(T)/Greal2(T)
Now if we make a grey body assumption the Equation (3) can be used also to determine the SR (signal ratio) for a real surface whether the two filters are chosen in order to remove the emissivity dependence. So, the important thing is always to evaluate the accuracy committed by the DC technique applied to the thermography for different classes of materials and non-stationary conditions by using Equations (3) and (4).
3. Materials and Method
3.1. Long Wavelength Range Analysis: Experimental Results
The first attempt on the use of the dual-color technique was performed with a long wavelength (LW) range camera (FLIR A655sc), equipped with two SPECTROGON filters applied through an external wheel in front of the camera [6]. On the left side of Figure 1, the object signal (OS; OS1 and OS2 represent the object signal that is the radiation captured by the IR sensor in W/m2sr) experimental trends as a temperature function is shown. Note that the OS corresponds to the Gbb,i in Equation (2), and the first notation (i.e., object signal, OS) is used to be coherent with the denomination of the parameter used by FLIR ResearchIR Max software that has been adopted in the performed measurements. The calibration phase was performed with the MIKRON black body [8] M305) up to 625 °C. On the right side of Figure 1, the SR (OS2/OS1) trend as temperature function has been also reported.
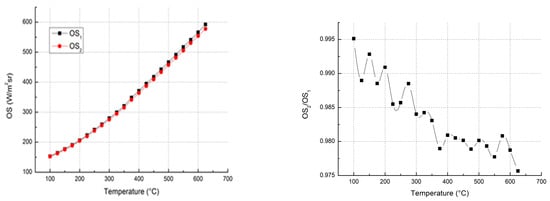
Figure 1.
(Left)—the experimental object signal (OS); OS1 = BP-10400-737, OS2 = BP-10500-775, respectively, with the center at 10.454 μm and 10.464 μm; trends versus temperature. (Right)—the experimental SR = OS2/OS1 curve [6].
With this configuration and this camera, on the right side of Figure 1, the object signals ratio is not adequate to obtain a single temperature value. In this case, the environmental temperature (Tenv = 20 °C) was negligible compared to that of the black body, and filters were located next to the camera in order to avoid reflection coming from the external environment. However, the signal ratio is affected significantly by reflection phenomena. Mathcad simulation tool has been used to obtain the reflection mean value coming from the environment. A comparison between the experimental and the theoretical data is shown in Figure 2.
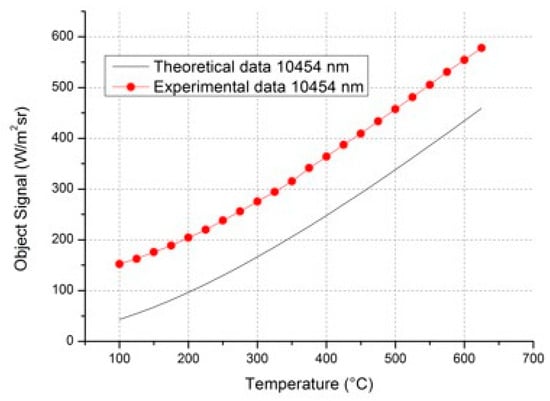
Figure 2.
Mathcad simulation and OS1 experimental comparison, see text. For a better understanding of the shift between the curves see [6].
The reflection amount evaluated through Mathcad simulation has been subtracted from the single OS for each of two filters, which in this way, makes it possible for the two signals ratio to be free from the reflection. Moreover, despite the subtracted reflection contribution, an SR experimental ratio variation is still observed (Figure 3). The discrepancies between the experimental and the Mathcad results are related to the OS variations due to the black body stability and camera sensitivity,
with this filter characteristic, it can be assumed that OS1 ≈ OS2 ≈ OS and ΔOS2 ≈ ΔOS1 ≈ ΔOS because the central wavelength are close,
and
in the temperature range between 100–650 °C and OS oscillation of ±0.5 counts on the last digit of a signal of 250 W/m2Sr (T = 400 °C) was observed. Hypothesizing a temperature invariant ratio of the ΔOS/OS with temperature, the uncertainty of the signal ratio ∆SR can be obtained and the dispersion curve can consequently be represented (Figure 3).
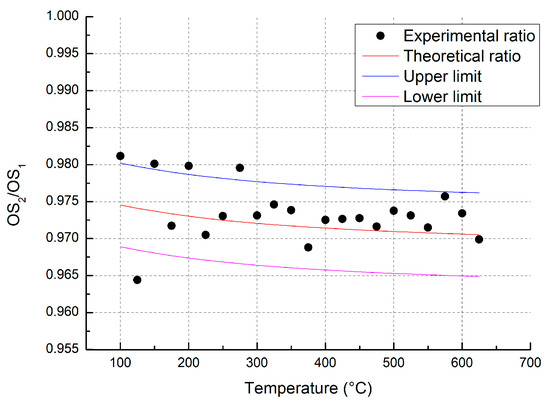
Figure 3.
Experimental SR, depleted from the reflection contribution, where a huge variability due to the black body stability and camera sensitivity is shown. The Mathcad simulation with uncertainties is shown [6].
A way to reduce the dispersion related to the OS uncertainty can be achieved through the increase of the sensitivity (e.g., slope) related to the SR curve expressed as a temperature function. The two filters’ central wavelengths, in this case, have been spaced out of one order of magnitude (up to 0.1 µm). Two filters centered at 10.400 μm and 10.500 μm were considered and in Figure 4 the ratio trend is reported.
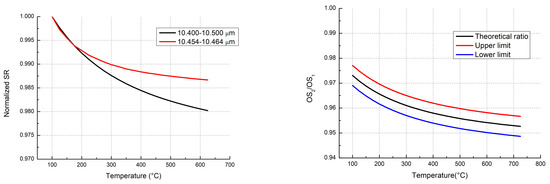
Figure 4.
On the (left) side, the simulated SR trend is shown for 10.454 μm and 10.464 μm filters and for 10.400 μm e 10.500 μm. On the (right) side, the dispersion is shown for the last couple of filters [6].
On the left side, the ratio curve is more sensitive with temperature (considering the black curve instead of the red curve), and for this trend (the black curve on the left), the dispersion of data related to OS oscillations (the right side) are not able to guarantee a determination of the temperature with acceptable accuracy. Moreover, if we tried to increase the distance between the central wavelengths of another order of magnitude, we would obtain an excessive distance to keep valid the grey body hypothesis. The performed analysis shows great limitations that do not allow the use of dual-color in the LW range (having considered a maximum filter difference of 0.1 μm). So, it is necessary to investigate the capability to use this technique in the medium wavelength (MW) spectral range.
3.2. Medium Wavelength Range Analysis: Experimental Results
In the MW range (2.5–5.1 μm), Mathcad simulations have been carried out first, for the FLIR SC5500 research (with an internal drum and a variable integration time) Stirling cooled camera, to implement the technique in such a way to choose directly both the best couple of filters and the best usable SR sensitivity [5,6]. Briefly, the SR uncertainty propagation of the camera output gives ΔSR = 0.1% and if an accuracy τ = 2% is needed on the temperature value (ΔT < τ T), it has to be satisfied for each couple of filters and T value [6] the following:
Therefore, the goodness of the couples of filters chosen (3.80–3.90 µm, 3.80–3.97 µm) has been evaluated through experimental verifications. In particular, the temperature of an aluminum plate, heated through a heating slab, was measured with a thermal camera through the DC technique and with K-type thermocouples [5,6].
The heating plate [9] was set at T = 500 °C (where the effects of reflected radiance could be neglected). In order to verify the DC methodology, a square plate with a length of 10 cm and a thickness of 0.5 cm, composed of rough aluminum alloy was used as the surface seen from the camera, as shown in Figure 5.
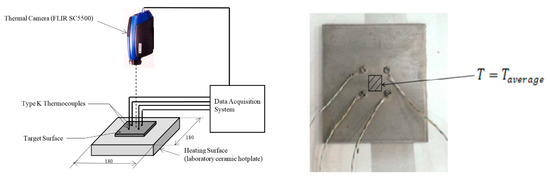
Figure 5.
(Left)—the aluminum plate scheme used for the dual-color (DC) measurement. (Right)—the aluminum plate heated by the ceramic plate [5,6].
Four thermocouples of K-chromel type (Ni–Cr) (+)/alumel (Ni–Al) (−), able to perform the measurement in a temperature range of 200–1260 °C were used to validate the experimental results as well as to calculate the target emissivity. A DC pyrometer [8] was used as a temperature regulation system with a temperature accuracy of 0.75% for the thermocouples [10]. The accuracy of the average value obtained by the four thermocouples, as shown in Table 1, is ±2% considering both the accuracy due to the K-type used and the oscillations (in terms of standard deviation) of the different measurements indicated. Data acquisition is detailed in [11]. In order to acquire the DC temperature, a FLIR SC5500 was used, on a 20 × 20 pixels square matrix centered on the central pixel of the thermal camera and calculating the average digital level (DL), i.e., the signal output that is proportional to the radiation impinging the IR sensor. The camera is provided with an internal wheel having the capability to host up to four filters, but three filters have been used in this case (3.80 µm, 3.90 µm, 3.97µm), in such a way to analyse two couples of filters 3.80–3.90 µm and 3.80–3.97 µm. The switch between them can happen in few tenths of a second. So, the ‘–’ is used to separate and to specify the two filters of the couple considered for the dual color measurements. The filter transmittance is shown in Figure 6.

Table 1.
Experimental test results column is referred, respectively, to the test number, central wavelengths of the filter couples, signal ratio values, emissivity for different filters, dual-color measurements (Tij), thermocouple measurements, and relative temperature accuracy of dual-color (Tc) with respect to the thermocouple measurements [5,6].
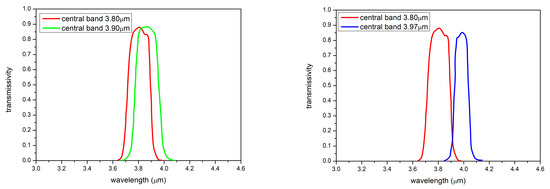
Figure 6.
On the (left), the 3.80–3.90 µm filters transmissivity curves are shown and, on the (right), the 3.80–3.97 µm filters transmissivity curves are shown [5,6].
The results, obtained through the dual-color technique, are reported in the following Table 1.
At the same wavelength (3.80 µm), a difference in emissivity value has been obtained in the two experiments and the most likely cause is the oxidation of the plate after the first experiment. For the first test (with Δλ equal to 0.17 μm), a 5% percentage accuracy was obtained. For the second experiment (with Δλ equal to 0.10 μm), an 18% percentage accuracy was obtained. In this last case, the error is mainly due to the extremely close bandwidths determining DL signals very similar to each other and though their closeness should be able to keep valid the local grey body hypothesis. The SR sensitivity is reduced and consequently the error increases.
3.3. Near-Medium Infrared Wavelength Analysis: Theoretical Results
Finally, in order to increase the sensitivity of the ratio between the signals captured at two close wavelengths, a camera with a working range starting from the near wavelength (NW) spectral range (1.5–5 μm) was chosen. It consists of a FLIR ORION SC 7600 multispectral camera operating in MW and filled out with an internal filter wheel that can rotate fast enough in such a way to consider the object thermal state unchanged, thus, meeting the requirements needed to apply the dual-color technique [7]. The validated numerical model has been used to determine a proper couple of filters in order to make the thermocamera operational in the DC technique experimental applications. In order to achieve this, a virtual camera has been built using Equations (1–4) implemented in Mathcad code.
In Figure 7, on the left side, different trends of SR with temperature for different couples of filters are reported. A Gaussian form was used to replicate the filter response curves that match with typical response curves of real narrow bandpass filters available on the market. The purple curve presents a greater slope than the others. Hence, filters that work at 2.1 µm and 2.2 µm have been chosen as the best combination for the SR sensitivity. Note that Figure 7 refers to filters centered at 2.0 µm and 2.1 µm, while the final choice consists of filters centered at 2.1 µm and 2.2 µm. In order to use these kinds of filters at high temperatures, it is necessary to couple them with an attenuator. A market survey showed that it was not easy to get attenuators below 2 µm. We found most attenuators work starting from 2 µm. An attenuator working from 2 µm does not match with the left part of the filter response function centered at 2 µm, hence in order to keep the benefits of the spectral region and the same distance between the two filters (0.1 µm), we shifted the two filters ahead of 0.1 µm, considering two filters centered at 2.1–2.2 µm. They also keep the same features in terms of signal ratio sensitivity of the couple centered at 2–2.1 µm. The more the SR varies with temperature, the more it can be associated with a single temperature value. In fact, when two wavelengths are close to each other, the SR trend becomes flat with temperature and the association to a single temperature value becomes more difficult due to oscillation of the calibration curve connected to the sensitivity. On the contrary, when the filters’ central wavelengths are too far, the grey body hypothesis fails and the ratio principle cannot be used. In addition, FLIR Orion 7600 has an internal rotatable wheel (up to 100 Hz) synchronized to the acquisition system, allowing it to work in non-stationary conditions. The calibration curve obtained for the filter couple, on the right in Figure 7, is shown in Figure 8. In this case, the curve decreases since the signal ratio has been considered as OS2/OS1, while in Figure 7, it was considered as OS1/OS2, where the subscript 1 and 2 are referred to the lower and higher wavelength, respectively.
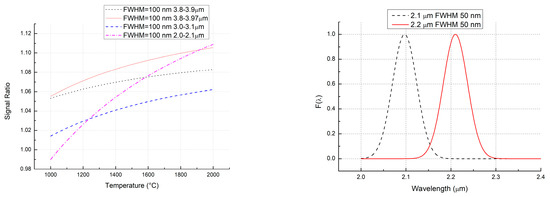
Figure 7.
(Left)—the SR trend versus T for different pairs of filters analysed. (Right)—the Gaussians of the response curves of the best filter combination.
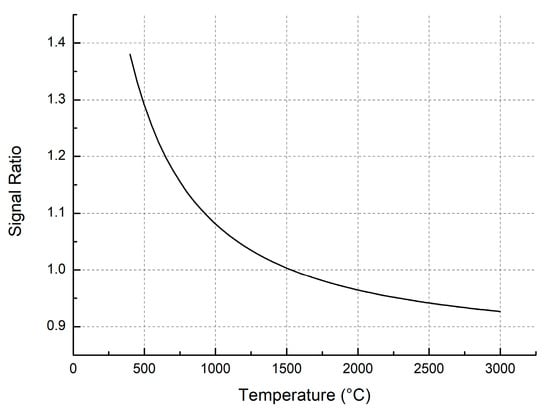
Figure 8.
SR trend versus T for the best filter combination.
3.4. Hypersonic Test Temperature Trend and Feasibility Study
Taking a curve with black squares in Figure 9 as the reference for an experimental temperature trend versus time collected during a hypersonic test (data acquired through dual-color pyrometer), a curve (interpolating the red circles in Figure 9) with a similar shape and slope of the experimental one at higher temperature values (up to 2500 °C) has been defined in order to cover heating conservative conditions using the following analytical law:
the curve is characterized by the total duration of the heating phase up to the maximum value of temperature and a slope, such as to make an evaluation of the change, in a time interval of 5 × 10⁻³ s, that corresponds to the time necessary for the wheel to capture the adjacent filters frame. At first, it is necessary to specify that despite the wheel rotation presents a 100 Hz frequency, the wheel balance during rotation and the detection synchronization is guaranteed by filters at close wavelengths positioned in a diametrically opposite wheel position [7], hence half rotation is required to acquire two adjacent frames. In this time interval, a variation in temperature of about 10−3 °C, at 2500 °C, and of about 2 °C, at 500 °C, can occur (Equation (5)). These variations are within the precision of the measurement technique that is around 1% [6]. These results lead to the conclusion that the ratio principle might be used in unsteady conditions in a hypersonic test.
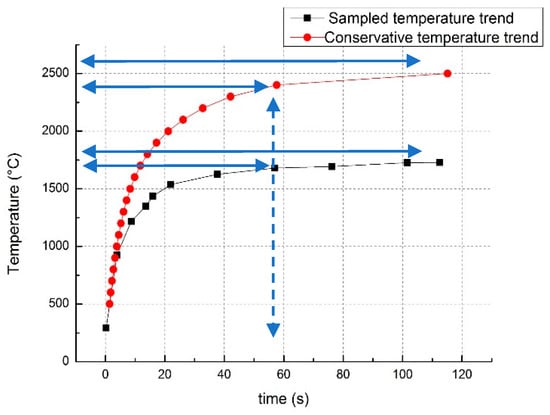
Figure 9.
Typical trend of temperature over a spot of a target subjected to hypersonic jet (black–square points). Moreover, the most critical condition, in terms of heat flux extracted numerically from the previous curve, is shown in the red-circle points, see text.
The most critical effort, however, consists in the evaluation of the accuracy due to a non-grey body hypothesis at the two adjacent wavelengths. The spectral trend of material emissivity found in the literature (right side of Figure 10) was used to make a prevision of the accuracy committed by the dual-color technique due to the non-grey body condition. Differences between the dual-color simulated results (marks) and real trend (black curve) are shown on the left of Figure 11. Percentage accuracy errors between dual-color measurement (Tdual) and real temperature value (Treal) are defined as
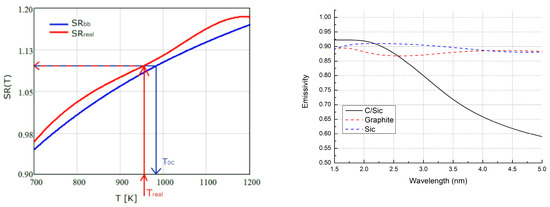
Figure 10.
(Left)—DC temperature evaluation process (TDC), see text [7]. (Right)—material emissivity trends versus wavelength found in the literature [6].
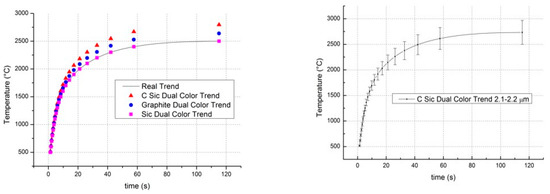
Figure 11.
Trend of temperature measured with DC technique for different materials is shown on the (left), and DC temperature trend for C/SiC material including error bars is shown on the (right).
The analysis has been performed determining the SR detected by the virtual camera, with the filter indicated as F1 (2.1 µm), F2 (2.2 µm) when the object is at temperature Treal for a black body emission and using the actual material emissivity curves, associated to the same SR detected for a black body in the same camera configuration. On the left side of Figure 10 is shown a representation of the TDC process—the Treal temperature value is used to enter in the real surface SR curve for a, SRrealF1_F2(T), and the value is then used to enter into the SR for a black body SRbbF1_F2(T) and find the correspondent TDC.
High accuracy is obtained with SiC material (0.13% at 2500 °C), and lower accuracy is obtained with C/SiC (9.3% at 2500 °C). The C/SiC curve with lower accuracy shows a trend that increases with temperature. A minimum of 3% at 500 °C and a maximum of 9.3% at 2500 °C has been revealed (right side of Figure 11). Finally, a comparison between standard thermography (single color) simulated data and dual-color simulated data for several emissivity classes of materials has been performed [7]. The results are represented in Figure 12. In particular, three classes of materials have been analysed (at low, medium, and high emissivity), enclosed in three rectangular boxes. An error band of ±5% has been associated with the real temperature, while dual-color temperature and single-color temperature (obtained with a systematic error of −40% committed over the real emissivity value) were represented by circular and triangular spots, respectively. It is possible to observe that for low emissivity materials dual-color measurements are away from the real values (they do not fall in the error band). In any case, also the single-color measurements with a systematic error are not acceptable. For medium and high emissivity classes the DC measurements fall, in the most part of cases, in the error band and they give back a better value than single-color measurements that instead fall in every case at the external of the error band.
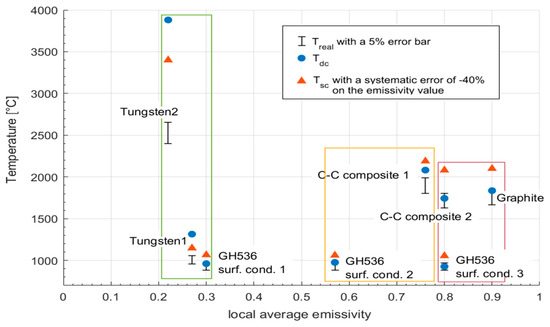
Figure 12.
Dual-color versus standard thermographic techniques performance at high temperature for different emissivity classes of materials in the near-infrared spectral range.
4. Results and Conclusions
The results have shown that long infrared ranges present limitations. The signals ratio in the LW spectral range was not very sensitive and too noisy to be properly detected by the FLIR A655sc thermal camera (both for 0.01 µm and for 0.1 µm central wavelengths distances).
The investigation continued in the mid-near infrared spectral range. The experimental analysis, obtained with the FLIR SC5500 thermal camera, showed that this novel measurement technology guarantees the surface temperature with a measurement accuracy lower than 5% when proper narrow filters with limited bandwidths were used. Finally, in order to increase the sensitivity of the signal ratio between two near wavelengths, a camera with a working range starting from the NW spectral range (i.e., Orion SC 7600 working in 1.5–5 μm) was chosen. The curves, in Figure 11, were obtained interpolating the data from the dual-color simulation using the Orion SC 7600 as reference instrumentation. The goodness of the results was assessed on the basis of how the signals ratio curve, obtained analytically for the material, approximates the signals ratio curve of the black body. Figure 12 showed a comparison of the two approaches. The results were obtained using DC (circular points) and the single color (triangular points) with −40% of uncertainty on the effective emissivity values. An error band of 5% was also reported to graphically quantify the goodness of the different approaches. The choice of the best thermographic approach depends on the degree of knowledge of emissivity curves. Therefore, the dual-color technique was preferable in applications at high temperatures, for which a relative temperature accuracy lower than 5% was obtained for medium-high emissivity (ε > 0.4) materials. It has been found that when the emissivity was higher than 15% from the real value, the DC technique was preferable with respect to the single-color (SC) technique. For low emissivity (ε < 0.4) materials, instead, the emissivity had to be higher than 40% of the real value to guarantee that the DC technique was preferable with respect to the SC technique with a DC temperature accuracy of the order of 30–40%.
Furthermore, the DC technique has to be used in applications where the emissivity of the materials is not well known, such as in the case of the test performed in the PWT facilities to verify the TPS withstanding the hypersonic plasma interactions [12,13,14,15]. Before testing the methodology in the PWT aerospace field, the Center for Isotopic Research on the Cultural and Environmental heritage (CIRCE) accelerator [16,17,18,19], upgraded both to perform accelerator mass spectrometry (AMS) up to actinides [20,21,22,23,24] and for experimental nuclear astrophysics [25,26,27,28,29,30,31,32] as other AMS systems [33], can be used for the preliminary test at temperature values reaching 1500 °C, with materials that, at the beginning of the process, are characterized by a low emissivity, and increase their emissivity value with a carbon ions implantation.
Author Contributions
Conceptualization, M.D.C. and L.S.; methodology, M.D.C. and L.S.; validation, M.D.C. and L.S.; formal analysis, M.D.C. and L.S.; investigation, M.D.C. and L.S.; data curation, M.D.C. and L.S.; writing—original draft preparation, M.D.C. and L.S.; writing—review and editing, M.D.C., L.S., A.D.V., F.D.C., M.M., U.G. and G.R.; supervision, M.D.C. All authors have read and agreed to the published version of the manuscript.
Funding
This research received no external funding.
Institutional Review Board Statement
Not applicable.
Informed Consent Statement
Not applicable.
Data Availability Statement
Not applicable.
Acknowledgments
This work was supported by CIRA project–MEtodologie Fisiche Innovative per l’Aerospazio (MEFIA)-via the PRogramma Nazionale di Ricerche Aerospaziali (PRORA-comma 2) and partly funded with the co-financing of the European Union—FESR, PON Research and Innovation 2014–2020, as part of the Generazione_E project-CUP: B96G18000560005, coordinated by the Sardinia AeroSpace District (DASS).
Conflicts of Interest
The authors declare no conflict of interest.
References
- Maldague, X.P. Theory and pracTice of Infrared Technology for Non-Destructive Testing; Wiley: Hoboken, NJ, USA, 2001; pp. 1–704. [Google Scholar]
- Savino, L.; Martucci, A.; Del Vecchio, A.; De Cesare, M. A novel physics methodology based on compact emission spectroscopy in the VNIR (0.4–0.9 μm) ranges for plasma shock layer/material temperature determinations and surface emissivity evaluations in the VNIR—LWIR (7–14 μm) ranges during atmospheric re-entry by PWT facility. Infrared Phys. Technol. 2020, 108, 103353. [Google Scholar]
- Machin, G.; Anhalt, K.; Battuello, M.; Bourson, F.; Dekker, P.; Diril, A.; Edler, F.; Elliott, C.J.; Girard, F.; Greenen, A.; et al. The European project on high temperature measurement solutions in industry (HiTeMS)—A summary of achievements. Measurement 2016, 78, 168–179. [Google Scholar] [CrossRef]
- Müller, B.; Renz, U.; Hoppe, S.; Klocke, F. Radiation thermometry at a high-speed turning process. J. Manuf. Sci. Eng. 2004, 126, 488–495. [Google Scholar] [CrossRef]
- Musto, M.; Rotondo, G.; De Cesare, M.; Del Vecchio, A.; Savino, L.; De Filippis, F. Error analysis on measurement temperature by means Dual-Color Thermography Technique. Measurement 2016, 90, 265–277. [Google Scholar] [CrossRef]
- Savino, L.; De Cesare, M.; Musto, M.; Rotondo, G.; De Filippis, F.; Del Vecchio, A.; Russo, F. Free emissivity temperature investigations by dual color applied physics methodology in the mid- and long- infrared ranges. Int. J. Therm. Sci. 2017, 117, 328–341. [Google Scholar] [CrossRef]
- Di Carolo, F.; Savino, L.; Palumbo, D.; Del Vecchio, A.; Galietti, U.; De Cesare, M. Standard thermography vs. free emissivity dual color novel CIRA physics technique in the near-mid IR ranges: Studies for different emissivity class materials from low to high temperatures typical of aerospace re-entry. Int. J. Therm. Sci. 2020, 147, 106123. [Google Scholar] [CrossRef]
- LumaSenseTechnologies. Blackbody. Available online: https://datasheets.globalspec.com/ps/5936/LumaSenseTechnologies/6807FEB5-FE3F-4444-B6E1-34AF590EE534 (accessed on 3 February 2021).
- Velp Scientifica. Available online: https://www.velp.com/en-ww/arecx-digital-ceramic-hot-plate-stirrer.aspx (accessed on 3 February 2021).
- Omega. Available online: https://www.omegaeng.cz/prodinfo/thermocouples.html (accessed on 3 February 2021).
- Dataloggerinc. Available online: https://www.dataloggerinc.com/data-acquisition-systems/thermocouple-daq-systems/ (accessed on 3 February 2021).
- De Cesare, M.; Di Leva, A.; Del Vecchio, A.; Gialanella, L. A novel recession rate physics methodology for space applications at CIRA by means of CIRCE radioactive beam tracers. J. Phys. D Appl. Phys. 2018, 51, 09LT01. [Google Scholar] [CrossRef]
- De Cesare, M.; Savino, L.; Di Leva, A.; Rapagnani, D.; Del Vecchio, A.; D’Onofrio, A.; Gialanella, L. Gamma and infrared novel methodologies in Aerospace re-entry: γ-rays crystal efficiency by GEANT4 for TPS material recession assessment and simultaneous dual color infrared temperature determination. Nucl. Instr. Meth. Phys. Res. B 2020, 479, 264–271. [Google Scholar] [CrossRef]
- Rapagnani, D.; De Cesare, M.; Alfano, D.; Buompane, R.; Cantoni, S.; Fumo, M.D.S.; Del Vecchio, A.; D’Onofrio, A.; Porzio, G.; Rufolo, G.C.; et al. Ion Beam Analysis for recession determination and composition estimate of aerospace Thermal Protection System materials. Nucl. Instr. Meth. Phys. Res. B 2020, 467, 53–57. [Google Scholar] [CrossRef]
- De Cesare, M.; Savino, L.; Ceglia, G.; Alfano, D.; Di Carolo, F.; French, A.D.; Rapagnani, D.; Gravina, S.; Cipullo, A.; Del Vecchio, A.; et al. Applied radiation physics techniques for diagnostic evaluation of the Plasma Wind and Thermal Protection System critical parameters in Aerospace re-entry. Prog. Aerosp. Sci. 2020, 112, 100550. [Google Scholar] [CrossRef]
- De Cesare, M.; De Cesare, N.; D’Onofrio, A.; Fifield, L.K.; Gialanella, L.; Terrasi, F. Mass and abundance 236U sensitivities at CIRCE. Nucl. Instrum. Methods Phys. Res. B 2015, 361, 483–487. [Google Scholar] [CrossRef]
- De Cesare, M.; De Cesare, N.; D’Onofrio, A.; Fifield, L.K.; Gialanella, L.; Terrasi, F. Uranium beam characterization at CIRCE for background and contamination determinations. Appl. Radiat. Isot. 2015, 103, 166–172. [Google Scholar] [CrossRef] [PubMed]
- Buompane, R.; De Cesare, M.; De Cesare, N.; Di Leva, A.; D’Onofrio, A.; Fifield, L.K.; Fröhlich, M.; Gialanella, L.; Marzaioli, F.; Sabbarese, C.; et al. Background reduction in 236U/238U measurements. Nucl. Instr. Meth. Phys. Res. B 2015, 361, 454–457. [Google Scholar] [CrossRef]
- De Cesare, M.; Guan, Y.; Quinto, F.; Sabbarese, C.; De Cesare, N.; D’Onofrio, A.; Gialanella, L.; Petraglia, A.; Roca, V.; Terrasi, F. Optimization of 236U AMS at CIRCE. Radiocarbon 2010, 52, 286–294. [Google Scholar] [CrossRef]
- Guan, Y.-J.; De Cesare, M.; Terrasi, F.; Quinto, F.; Sabbarese, C.; De Cesare, N. 236U AMS measurement at CIRCE. Chin. Phys. C 2010, 34, 1729–1732. [Google Scholar] [CrossRef]
- Guan, Y.-J.; Wang, H.J.; De Cesare, M.; Terrasi, F. The AMS measurement of 236U at CIRCE. Nucl. Sci. Tech. 2017, 28, 98. [Google Scholar] [CrossRef]
- Roviello, V.; De Cesare, M.; D’Onofrio, A.; Gialanella, L.; Guan, Y.J.; Roos, P.; Ruberti, D.; Sabbarese, C.; Terrasi, F. New analytical methods for the assessment of natural (238U, 232Th, 226Ra, 40K) and anthropogenic (137Cs) radionuclides as actinides (239Pu, 240Pu): The case study of the Garigliano NPP releases along the Domitia sandy beaches (Southern Italy). Catena 2020, 193, 104612. [Google Scholar] [CrossRef]
- De Cesare, M.; Tims, S.G.; Fifield, L.K. Uranium comparison by means of AMS and ICP-MS and Pu and 137Cs results around an Italian nuclear power plant. Epj Web Conf. 2015, 91, 1–5. [Google Scholar] [CrossRef]
- Petraglia, A.; Sabbarese, C.; De Cesare, M.; De Cesare, N.; Quinto, F.; Terrasi, F.; D’Onofrio, A.; Steier, P.; Fifield, L.K.; Esposito, A.M. Assessment of the radiological impact of a decommissioned nuclear power plant in Italy. Radioprotection 2012, 47, 285–297. [Google Scholar] [CrossRef]
- Rapagnani, D.; Buompane, R.; Di Leva, A.; Gialanella, L.; Busso, M.; De Cesare, M.; De Stefano, G.; Duarte, J.G.; Gasques, L.R.; Morales Gallegos, L.; et al. A supersonic jet target for the cross section measurement of the 12C(α,γ)16O reaction with the recoil mass separator ERNA. Nucl. Instr. Meth. Phys. Res. B 2017, 407, 217–221. [Google Scholar] [CrossRef]
- Di Leva, A.; Gialanella, L.; Kunz, R.; Rogalla, D.; Schürmann, D.; Strieder, F.; De Cesare, M.; De Cesare, N.; D’Onofrio, A.; Fülöp, Z.; et al. Erratum: Stellar and primordial nucleosynthesis of Be7: Measurement of He3(α,γ)Be7. Phys. Rev. Lett. 2009, 103, 159903. [Google Scholar] [CrossRef]
- Morales-Gallegos, L.; Aliotta, M.; Di Leva, A.; Gialanella, L.; Schürmann, D.; De Cesare, M.; Davinson, T.; Imbriani, G.; Romano, M.; Romoli, M. Tests of carbon targets for 12C+12C reactions at astrophysical energies. J. Phys. Conf. Ser. 2015, 578, 012002. [Google Scholar] [CrossRef]
- Romoli, M.; Morales-Gallegos, L.; Aliotta, M.; Bruno, C.G.; Buompane, R.; D’Onofrio, A.; Davinson, D.; De Cesare, M.; Di Leva, M.; Di Meo, P.; et al. Development of a two-stage detection array for low-energy light charged particles in nuclear astrophysics applications. Eur. Phys. J. A 2018, 54, 1–8. [Google Scholar] [CrossRef]
- Morales-Gallegos, L.; Aliotta, M.; Bruno, C.G.; Buompane, R.; Davinson, T.; De Cesare, M.; Di Leva, A.; D’Onofrio, A.; Duarte, G.J.; Gasques, L.R.; et al. Reduction of deuterium content in carbon targets for 12C+12C reaction studies of astrophysical interest. Eur. Phys. J. A 2018, 54, 1–8. [Google Scholar] [CrossRef]
- Buompane, R.; De Cesare, N.; Di Leva, A.; D’Onofrio, A.; Gialanella, L.; Romano, M.; De Cesare, M.; Duarte, J.G.; Fülöp, Z.; Morales-Gallegos, L.; et al. Test measurement of 7Be(p,γ)8B with the recoil mass separator ERNA. Eur. Phys. J. A 2018, 54, 1–8. [Google Scholar] [CrossRef]
- Di Leva, A.; Imbriani, G.; Buompane, R.; Gialanella, L.; Best, A.; Cristallo, S.; De Cesare, M.; D’Onofrio, A.; Duarte, J.G.; Gasques, L.R.; et al. Measurement of 1323 and 1487 keV resonances in 15N(α,γ)19F with the recoil separator ERNA. Phys. Rev. C 2017, 95, 45803. [Google Scholar] [CrossRef]
- Schürmann, D.; Di Leva, A.; Gialanella, L.; De Cesare, M.; De Cesare, N.; Imbriani, G.; D’Onofrio, A.; Romano, M.; Romoli, M.; Terrasi, F. A windowless hydrogen gas target for the measurement of 7Be(p,γ)8B with the recoil separator ERNA. Eur. Phys. J. A 2013, 49, 1–10. [Google Scholar] [CrossRef]
- De Cesare, M.; Fifield, L.K.; Weisser, D.C.; Tsifakis, D.; Cooper, A.; Lobanov, N.R.; Tunningley, T.B.; Tims, S.G.; Wallner, A. A new fast-cycling system for AMS at ANU. Nucl. Instrum. Methods Phys. Res. B 2015, 361, 475–482. [Google Scholar] [CrossRef]
Publisher’s Note: MDPI stays neutral with regard to jurisdictional claims in published maps and institutional affiliations. |
© 2021 by the authors. Licensee MDPI, Basel, Switzerland. This article is an open access article distributed under the terms and conditions of the Creative Commons Attribution (CC BY) license (http://creativecommons.org/licenses/by/4.0/).