Article

Impact of Dataset Size on Classification Performance: An Empirical Evaluation in the Medical Domain

1
Information Technology Department, College of Computer and Information Sciences, King Saud University, Riyadh 11451, Saudi Arabia
2
Management Information Systems Department, College of Business Administration, King Saud University, Riyadh 11451, Saudi Arabia
3
National Center for Cyber Security Technology, King Abdulaziz City for Science and Technology, Riyadh 11442, Saudi Arabia
4
Computer Science Department, College of Computer and Information Sciences, King Saud University, Riyadh 11451, Saudi Arabia
5
Mechanical Engineering Department, Massachusetts Institute of Technology (MIT), Cambridge, MA 02142-1308, USA
*
Author to whom correspondence should be addressed.
Appl. Sci. 2021, 11(2), 796; https://doi.org/10.3390/app11020796
Submission received: 30 November 2020 / Revised: 7 January 2021 / Accepted: 12 January 2021 / Published: 15 January 2021
(This article belongs to the Special Issue Machine Learning in Medical Applications)

Abstract

:
Dataset size is considered a major concern in the medical domain, where lack of data is a common occurrence. This study aims to investigate the impact of dataset size on the overall performance of supervised classification models. We examined the performance of six widely-used models in the medical field, including support vector machine (SVM), neural networks (NN), C4.5 decision tree (DT), random forest (RF), adaboost (AB), and naïve Bayes (NB) on eighteen small medical UCI datasets. We further implemented three dataset size reduction scenarios on two large datasets and analyze the performance of the models when trained on each resulting dataset with respect to accuracy, precision, recall, f-score, specificity, and area under the ROC curve (AUC). Our results indicated that the overall performance of classifiers depend on how much a dataset represents the original distribution rather than its size. Moreover, we found that the most robust model for limited medical data is AB and NB, followed by SVM, and then RF and NN, while the least robust model is DT. Furthermore, an interesting observation is that a robust machine learning model to limited dataset does not necessary imply that it provides the best performance compared to other models.

1. Introduction

The success of modern healthcare services, such as automated diagnosis and personalized medicine, is eminently dependent on the availability of datasets. The dataset size is considered a critical property in determining the performance of a machine learning model. Typically, large datasets lead to better classification performance and small datasets may trigger over-fitting [1,2,3]. In practice, however, collecting medical data faces many challenges due to patients’ privacy, lack of cases due to rare conditions [4], as well as organizational and legal challenges [5,6]. Moreover, in the case of available large datasets, training a model using such data requires further time and computing resources, which may not be available.
Despite the continuous debates and efforts, there is still no agreed definition of what constitutes a small dataset. For instance, Shawe-Taylor et al. [7] proposed a measurement called Probably Approximately Correct (PAC) for identifying the minimum number of necessary samples to meet the desired accuracy. Some research [8] has defined small datasets based on algorithmic information theory. The authors in [9] followed a different approach by examining previous studies that are concerned with dealing with small datasets and their sizes and accordingly defined a range for the size of small datasets.
Establishing a method to find the trend in small datasets is not only of scientific interest but also of practical importance and requires a special care when developing machine learning models. Unfortunately, classification algorithms may perform worse when trained with limited size datasets [2]. This is because small datasets typically contain less details, hence the classification model cannot generalize patterns in training data. In addition, over-fitting becomes much harder to avoid as it sometimes goes beyond training data to affect the validation set as well [3].
Classification is a challenging task by itself. It becomes more challenging when dealing with small datasets. The central cause behind this challenge relates to the limited size of training data, which leads to unreliable and biased classification model [3]. While previous studies are focusing on increasing the accuracy of the classification algorithms on limited size datasets, less effort was made to study the impact of the size property of the dataset on the performance of the classification algorithms, which makes it an open problem in the area that needs more investigation.
Several studies have emerged recently that address the issue of small datasets from different perspectives, including enhancing the performance of classification models on limited datasets [8,9,10,11] and proposing varying approaches to augment the training set [12,13,14,15,16]. For example, in the former category, authors in [8] proposed two methods for neural network (NN) training on small datasets using Fuzzy ARTMAP neural networks [10]. In [11], a novel particle swarm optimization-based virtual sample generation (PSOVSG) approach was proposed to iteratively produce the most suitable virtual samples in the search space. The performance of PSOVSG is tested against other three methods and had superior results.
In the latter category, Li et al. [12] proposed a non-parametric method for learning trend similarities between attributes and then using them to predict the respective ranges in which attribute values can be situated when other attribute values are provided. Another study [13] generated data based on the Gaussian distribution by utilizing the smoothness which states that, if two inputs are close to each other, their outputs will be close as well. In [14], the authors learned the relationship between the dataset features to generate new data attributes using the fuzzy rules. Other studies [15,16,17] have proposed the extending attribute information (EAI) method to investigate the applicability of extracting features from small datasets by applying the similarity-based algorithms using fuzzy membership function on seven different data sets. Authors in [18] proposed the sample extending attribute (SEA) method to extend a suitable quantity of attributes for improving the learning performance of small datasets and preventing the data from becoming sparse.
Research on the subject has been mostly restricted on increasing the accuracy of the classification algorithms on limited size datasets, little attention has been paid to study the impact of the dataset size on the performance of the classification algorithms. However, the proposed solutions suffer from multiple issues, such as data replicates [13], unscalability [8,10], and noise [13,19]. Similar studies to our work exist in the literature, where the main aim is to investigate the extent to which the size of the dataset can impact the classification performance in different domains such as sentiment classification [2,20], object detection [21], plant disease classification [22], and information retrieval [23]. Table 1 summarizes the most relevant related works.
This work aims to investigate the impact of dataset size on the performance of six widely-used supervised machine learning models in the medical domain. For this purpose, we carried out extensive experiments on six classification models including support vector machine (SVM), neural networks (NN), C4.5 decision tree (DT), random forest (RF), adaboost (AB), and naïve Bayes (NB) using twenty medical UCI datasets [24]. We further implemented three dataset size reduction scenarios on two large datasets, resulting in three small subsets. We then analyzed the change in performance of the models as a response to the reduction of dataset size with respect to accuracy, precision, recall, f-score, specificity, and area under the ROC curve (AUC). Statistical tests are used to assess the statistical significance of the differences in performances in different scenarios.
The rest of the paper is organized as follows. In Section 2, we describe the methodology, including the datasets, the classification models, and performance evaluation. In Section 3, we present and discuss the results. Finally, Section 4 concludes our work.

2. Methodology

As mentioned earlier, this study aims to investigate the impact of dataset’s size on the classification performance and recommend the appropriate classifier(s) for limited-size datasets. In order to achieve this goal, we followed an experimental methodology, where we selected datasets of varying sizes and grouped them into two groups: small datasets and large datasets. We extracted three small datasets randomly using sampling without replacement from each large dataset. The partitioning protocol is described in Section 2.1 below. The goal is to examine the impact of reducing the size of the same dataset on the classification performance. After preprocessing the datasets, a total of six widely-used classification models were trained on all datasets. The performance of the classifiers is evaluated with respect to accuracy, precision, recall, specificity, f-score, and AUC. In the following subsections, we will discuss the dataset selection and partitioning algorithm, the classification models, and the performance evaluation metrics.

2.1. Dataset

We selected twenty data sets from the UCI data repository [24]. The datasets were selected from medical fields where limited data are common. Table 2 shows details about the selected datasets, arranged by size, along with their number of attributes and data type. There is no explicit definition for small datasets in the literature. Therefore, in order to determine the size range for selecting small datasets in this work, we reviewed existing works that study small datasets and kept track of the size of their datasets. As shown in Table 1, the size of small datasets used in the existing works ranges from 18 to 1030 across studies [8,11,12,13,14,15,17,18]. Accordingly, the selected twenty datasets were categorized as eighteen small datasets and two large datasets.
The small datasets (DS1-DS18) consist of eighteen medical datasets. The number of instances in these small datasets ranges from 80–1040 instances, and the number of features ranges between 3–49. All small datasets are numerical or numerical with text. In the category of large datasets, there are two datasets; Skin Segmentation dataset (DS19 in Table 2) and Diabetes 130-US hospitals dataset (DS20 in Table 2). The former consists of 245,057 instances and four features of numeric datatype, while the latter has 9871 instances and 55 features of mixed numeric and text datatypes.
To study the impact of dataset size on the performance of classifiers, we constructed three small sub-datasets of increasing sizes from each large dataset using sampling without replacement, as shown in Table 3. 
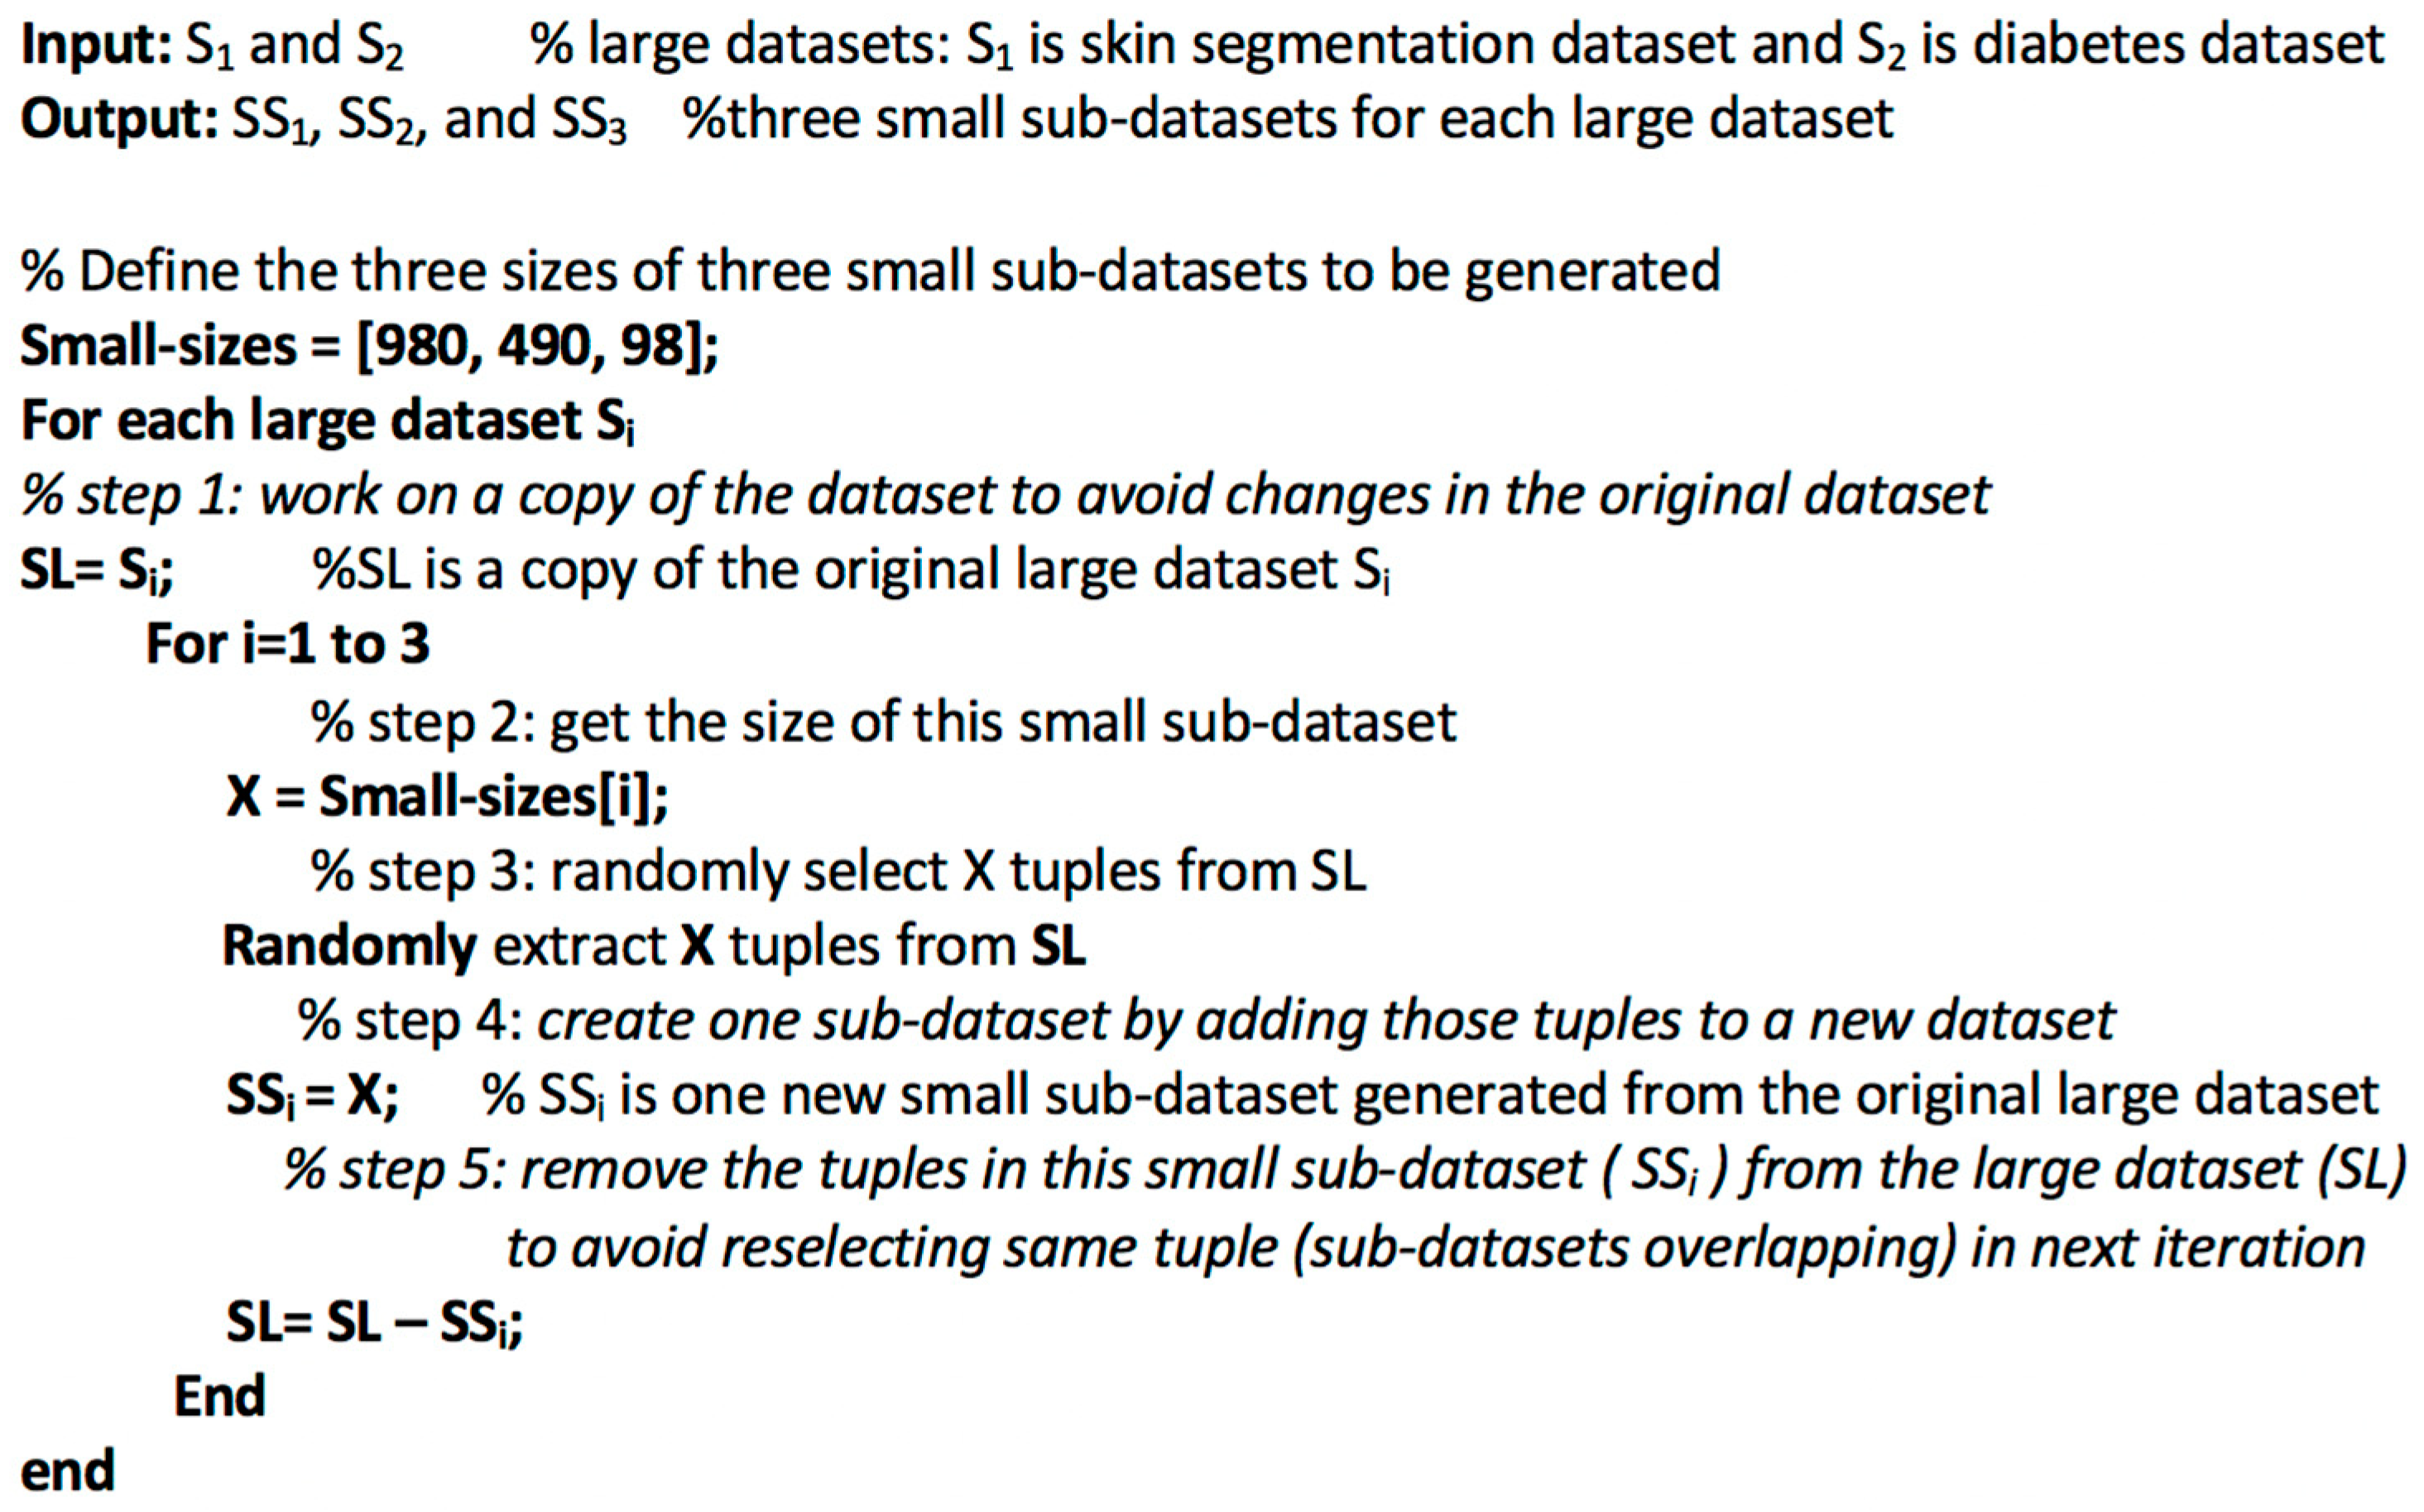
Figure 1 presents the dataset portioning algorithm. As shown in the figure, the algorithm receives two large datasets S1 and S2 and returns three small sub-datasets S1, S2, and S3 for each large dataset. It first defines the sizes of the three small sub-datasets (980, 490, and 98). These were selected from the three equal intervals (highest, middle, and lowest) of the size range of small datasets (18–1030), respectively. Next, the algorithm iterates over the large datasets S1 and S2. For each dataset, the algorithm creates a copy of the dataset (SL) to void modifying the original dataset. The algorithm then iterates over the array of small sizes in order to create the corresponding small sub-dataset SSi, where X tuples are extracted randomly without replacement to avoid overlapping between the sub-datasets. This is performed by removing the sub-dataset SSi from the large dataset SL after extraction. The iterations continue until all three sub-datasets are created for all large datasets. Data preprocessing was carried out for all datasets as necessary to deal with missing values.

2.2. Classification Models

We used six different widely-used classifiers, which include probabilistic classification using naïve Bayes (NB), decision function classification using support vector machine (SVM), neural network (NN), decision tree induction C4.5 (DT), tree ensemble random forest (RF), and ensemble adaptive boosting (AB). Below, we shed light on these classification models:
  • SVM: The objective of the SVM algorithm is to find the hyperplane in the data that gives the largest separation margin between data instances and classifies them into two classes. It can be explained based on four basic concepts, the separating hyperplane, the maximum margin hyperplane, the soft margin, and finally the kernel function [25,26].
  • NB: It is a supervised learning method based on the Bayesian theorem. Therefore, it is considered as a statistical method for classification. It works by calculating explicit probabilities for hypotheses. NB models use the method of maximum likelihood for parameter estimation. Literature showed that it often performs better in many complex real world applications. One of the features of this method is that it is robust to noise in data, and it can estimate the parameters using a small training set [25,26,27].
  • DT: A Decision Tree is constructed as a binary classification tree, based on the training data. In the tree structure, class labels are represented by leaf nodes, while the internal nodes represent the conjunction of features that assess class. There are several DT algorithms, Notable decision tree algorithms include: ID3 (Iterative Dichotomiser 3), C4.5 (successor of ID3), and CART (Classification And Regression Tree) [25,26]. In this study, the C4.5 algorithm for DT is selected for deploying the DT classification.
  • NN: It is one of the most widely-used classification models, as it is a good alternative to several traditional classification methods. One of the main advantages of NN is that it is a data-driven self-adaptive method, in that it is adjustable to the data without the need for explicit specification of the underlying model. Another feature of NN is that it represents a nonlinear model-free method [25,26,27].
  • RF: As the name implies, the RF classifier consists of a number of individual decision trees. Each of the individual decision trees in the forest is used for a majority voting of the output class, the class that has the majority of votes becomes the model’s predicted class [25].
  • AB: One of the most important “families” of ensemble methods is Boosting, and within the boosting algorithms, the adaptive boosting (AB) algorithm is one of the most important. The adaptiveness of AD comes in the form of successive weak learners and fine-tuning them in favor of those instances misclassified by previous classifiers. Some of the properties of AD is that it is sensitive to noisy data and outliers, but, in some cases, it can be less susceptible to the overfitting than other learning algorithms [28].

2.3. Performance Evaluation

In contrast to most existing efforts in literature, which used accuracy as the performance measure, we evaluate the performance of the classification models with respect to six important metrics in the medical domain, namely, accuracy, precision, recall, F-score, specificity, and AUC. Furthermore, the Mann–Whitney U test is applied to assess the statistical significance between the performance of the models in different scenarios.

3. Results

In the following sections, the experimental results are presented for the classification models with both small datasets and large datasets with their subsets. The experiments were carried out on Waikato Environment for Knowledge Analysis (WEKA) version 3.8 [29] on a Windows 10 personal computer with CPU 2.70 GHz, Core i7 processor and 8.0 GB memory (RAM). For all classification models, we used WEKA default parameter values, which are shown in Table 4. Each reported result is the average of 10-fold cross validation.

3.1. Small Datasets

The performance of the six classification models, namely AB, RF, NN, DT, NB, and SVM when trained on the eighteen small datasets is presented in Table 5 with respect to accuracy. The performance of the classification models with respect to precision, recall, specificity, f-score, and AUC are shown in Table A1, Table A2, Table A3, Table A4 and Table A5 in the Appendix A.
Several observations can be made from Table 5. First, we can observe that the average accuracy of classifiers trained on the small datasets ranges from 62% on DS18 to 99% on DS1 and DS8. Second, it can be seen from the table that the average accuracy of classifiers across the small datasets ranges from 79.28% achieved by AB to 82.78% accuracy by DT. Third, we can also see that the standard deviations across classifiers (Std. Dev. For each dataset, last column) are less than the standard deviations across datasets (Std. Dev. For each classifier, last row).
Similar trends are observed in the performance of classifiers with respect to precision, recall, specificity, f-score, and AUC in Table A1, Table A2, Table A3, Table A4 and Table A5 in the Appendix A. For instance, the average precision of classifiers in Table A1 ranges from 62.43% on DS18 to 99% on DS1 and DS8, and the average recall ranges from 61.68% on DS18 to 99.12% on DS8 (see Table A2). In addition, the average precision of classifiers across the small datasets ranges from 78.07% precision by AB to 82.21% achieved by NB. For recall, the average performance of classifiers across the small datasets ranges from 79.22% by AB to 82.73% by DT. Furthermore, we can see in Table A1, Table A2, Table A3, Table A4 and Table A5, and, similar to accuracy in Table 5, that the standard deviations across classifiers are less than the standard deviations across datasets.

3.2. Large Datasets

Figure 2 and Figure 3 show the performance of the six classification models with respect to accuracy, precision, recall, f-score, specificity, and AUC when trained on the large datasets, namely diabetes and skin segmentation, respectively, across decreasing sizes of the training set. The x-axis in the figures shows the size of the dataset, namely large dataset (LD), small dataset of size 980 (SD980), small dataset of size 490 (SD490), and small dataset of size 98 (SD98). LD indicates that the full size of the large dataset, as shown in Table 3, is used for training for both diabetes and skin segmentation datasets.
In all figures, each line chart has three segments reflecting the result in three reduction scenarios of datasets size. The first segment ranges from LD to SD980 and shows the result in the first size reduction scenario, which we refer to as the LD-SD980 scenario. This line segment presents a key result in the chart as it depicts the change in performance of a classifier trained on a large dataset (LD) when trained on a small dataset of size 980 (SD980). The second segment in the line charts stretches from SD980 to SD490. It illustrates the change in performance of a classifier in the second size reduction scenario SD980-SD490, where the size of the dataset reduces from 980 (SD980) to an even smaller dataset of size 490 (SD490). In a similar manner, the third segment in the line charts extends from SD490 to SD98. It shows the change in performance of a classifier when the size of the dataset reduces from 490 (SD490) to a smaller dataset of size 98 (SD98), which we refer to as the third scenario SD490-SD98.
Several observations can be made from these figures. First, most classifiers exhibit relatively similar trend of performance over decreasing training set size with respect to all six performance metrics. This can be seen by comparing the performance of one classifier across performance metrics. Second, there is a clear general trend of decreasing performance with respect to all metrics for almost all classifiers in all size reduction scenarios on both datasets, although the classifiers showed varying reactions to the different size reduction scenarios. The most striking observation is that the performance of the AB model increases as the diabetes dataset size decreases. Third, the best performing classifiers may vary across datasets. For instance, in the diabetes dataset (Figure 2), the best performing classifiers are SVM and NN, while, in the skin segmentation dataset (Figure 3), RF, DT, and NN perform the best. However, in both datasets, AB is the least performing classifier with respect to most performance metrics.

4. Discussion

4.1. Small Datasets

The results presented in Section 3.1 are quite revealing in several ways. First, they reveal that, depending on the problem domain, dataset size is not necessarily an obstacle to a high preforming model since the average performance of classifiers reached 99% on some small datasets. Second, since the standard deviations across classifiers are less than the standard deviations across datasets, the results indicate that, given a small dataset, classifiers perform relatively similarly, while each classifier has varying performance across the small datasets. On assessing the statistical significance of the difference between the two groups of standard deviations, we found that the difference is significant (p = 0.00076) at p < 0.05. The null hypothesis for this test asserts that the median of the two groups is identical. Taken together, these results reveal that constructing a dataset that is well representative of the original distribution, despite the size, is more important than choosing a classification model.

4.2. Large Datasets

Interestingly, the classifiers exhibited varying reactions to the different size reduction scenarios. We used a Mann–Whitney U test at p < 0.05 in order to assess the statistical significance of the differences in performances in different scenarios. In each test, we compare two groups of values that represent the performance of one model on a dataset of two sizes. Each group contains the performance of the model in ten folds. Table A6, Table A7, Table A8, Table A9, Table A10 and Table A11 in the Appendix A show the resulting p-value for all classification models in each reduction scenario, which show whether the scenario caused a significant decrease in the model performance with respect to size measures.
Statistical tests revealed that DT is the most sensitive model to the size of the dataset since its performance decreases significantly in the majority of the scenarios (~70% of scenarios in Table A8). RF and NN showed a relatively similar response to the decrease of dataset size as they show significant performance degradation in 44% and 42% of the scenarios in Table A9 and Table A7, respectively. Tree-based models are trained by splitting the data based on predictor variables to find pure subsets (i.e., instances that belong to the same class) that will be used to compute the conditional probabilities. Therefore, the model’s predictions are based on considerably smaller data than the original dataset. For NN, the model learns by adjusting a large number of weights using backpropagation. Thus, more data allows further adjustment, and hence better performance. The next model is SVM, where its performance decreases significantly in 36% of the scenarios in Table A6. As is well known, the position of the SVM hyperplane is based only on the support vectors. Consequently, the size of the dataset is irrelevant as long as the data include the support vectors. AB and NB exhibited robust performance as they decrease significantly only in 13% and 19% of the scenarios in Table A10 and Table A11, respectively. Since NB is a simple algorithm that assumes conditional independence between variables, it needs less data to train. This makes it a high-bias model, but immune to the most common issue of small training set: overfitting.
Together, these results provide important insights into dataset size and classifiers performance. First, in support to our previous observation, the overall performance of classifiers depends on the extent to which the dataset represents the original distribution rather than its size. Second, it is clear from our experiments and statistical tests that the most robust model for small medical datasets appears to be AB and NB, followed by SVM, and then NN and RF, while the least robust model is DT. Third, on comparing the classifiers performance on small datasets (Table 5 and Table A1, Table A2, Table A3, Table A4, Table A5) and their performance in the three reduction scenarios of datasets size (Table A6, Table A7, Table A8, Table A9, Table A10 and Table A11 and Figure 2 and Figure 3), an interesting observation can be made: a robust machine learning model to dataset size reduction does not necessary imply that it provides the best performance compared to other models. This is evident by the observation that AB and NB were the most robust models to dataset size reduction, but they had the least average accuracy on the small datasets in Table 5, compared to other models. In addition, as explained in Section 3.2, AB was the least performing classifier with respect to most performance metrics in both large datasets.

5. Conclusions

Recent years have witnessed an increased interest in modern healthcare services, such as automated diagnosis and personalized medicine. However, the success of such services is eminently dependent on the availability of datasets. Collecting medical data may face many challenges such as patients’ privacy and lack of data for rare conditions. This work aims to investigate the impact of dataset size on the performance of six widely-used supervised machine learning models in the medical domain. For this purpose, we carried out extensive experiments on six classification models including SVM, NN, DT, RF, AB, and NB using twenty medical UCI datasets [24]. We further implemented three dataset size reduction scenarios on two large datasets, resulting in three small subsets. We then analyzed the change in performance of the models as a response to the reduction of dataset size with respect to accuracy, precision, recall, f-score, specificity, and AUC. Statistical tests are used to assess the statistical significance of the differences in performances in different scenarios.
Several interesting conclusions can be made. First, the overall performance of classifiers depends on the extent to which a dataset represents the original distribution rather than its size. Second, the most robust model for limited medical data is AB and NB, followed by SVM, and then RF and NN, while the least robust model is DT. Third, a robust machine learning model to limited dataset does not necessarily imply that it provides the best performance compared to other models. Our results are in agreement with previous studies [2]. A natural progression of this research would be to investigate the minimum dataset size that each classifier needs in order to maximize its performance.

Author Contributions

Conceptualization, H.A.-B. and H.K.; Data curation, A.B.D. and N.A.; Formal analysis, D.A., H.A.-B., and A.S.; Funding acquisition, H.K.; Investigation, A.A.; Methodology, D.A., H.A.-B. and H.K.; Software, A.B.D. and N.A.; Supervision, D.A. and H.K.; Validation, A.A., A.S., and H.K.; Visualization, A.A., A.S., and A.A.E.; Writing—original draft, D.A., H.A.-B., A.B.D. and N.A.; Writing—review and editing, A.A. and H.K. All authors have read and agreed to the published version of the manuscript.

Funding

This research received no external funding.

Institutional Review Board Statement

Not applicable.

Informed Consent Statement

Not applicable.

Data Availability Statement

Publicly available datasets were analyzed in this study. This data can be found here: [https://archive.ics.uci.edu/ml/datasets.php].

Acknowledgments

This research was supported by a grant from Researchers Supporting Unit, Project number (RSP-2020/204), King Saud University, Riyadh, Saudi Arabia.

Conflicts of Interest

The authors declare no conflict of interest. The funders had no role in the design of the study; in the collection, analyses, or interpretation of data; in the writing of the manuscript, or in the decision to publish the results.

Appendix A

Table A1. Precision of classifiers trained on small datasets.
Classifiers
DatasetsABRFNNDTNBSVMAvg.Std. Dev.
DS199.00%99.00%99.00%99.00%99.00%99.00%99.00%0.000
DS283.10%79.20%82.40%83.60%82.80%79.80%81.82%0.017
DS394.90%94.30%94.60%96.40%93.60%96.80%95.10%0.011
DS461.10%66.50%67.20%63.00%79.60%71.19%68.10%0.061
DS585.11%75.50%77.40%75.50%76.20%72.40%77.02%0.039
DS667.00%65.29%94.00%88.00%86.30%89.00%81.60%0.112
DS769.80%64.90%69.90%69.00%71.50%65.30%68.40%0.025
DS899.00%99.00%99.00%99.00%99.70%100.00%99.28%0.004
DS981.00%77.80%79.90%73.30%83.00%78.00%78.83%0.030
DS1068.50%82.80%71.50%72.60%71.60%73.10%73.35%0.045
DS1162.50%72.80%67.30%65.00%67.80%68.70%67.35%0.032
DS1275.00%74.10%65.50%69.10%66.20%66.60%69.42%0.038
DS1341.66%94.40%96.40%95.30%94.50%63.10%80.89%0.211
DS1499.00%99.00%94.30%99.00%99.10%91.40%96.97%0.030
DS1584.80%82.60%89.30%77.10%85.00%85.00%83.97%0.037
DS1684.90%84.60%79.50%81.00%72.50%80.00%80.42%0.041
DS1790.00%93.70%88.00%93.70%83.60%88.00%89.50%0.035
DS1858.90%57.20%61.20%69.20%67.80%60.30%62.43%0.045
Avg.78.07%81.26%82.02%81.60%82.21%79.32%
Std. Dev.0.1570.1280.1240.1250.1110.123
Table A2. Recall of classifiers trained on small datasets.
Classifiers
DatasetsABRFNNDTNBSVMAvg.Std. Dev.
DS199.00%99.00%99.00%99.00%98.90%99.00%98.98%0.000
DS283.10%79.20%82.20%83.40%82.50%79.30%81.62%0.016
DS394.90%94.80%94.90%96.10%88.50%96.00%94.20%0.024
DS470.30%69.40%69.80%65.50%55.70%71.30%67.00%0.050
DS585.10%83.80%81.10%84.50%78.50%84.90%82.98%0.022
DS664.50%65.80%79.50%84.20%85.40%86.00%77.57%0.084
DS773.20%67.30%72.90%71.90%74.80%73.50%72.27%0.022
DS899.00%99.00%99.00%99.00%99.70%99.00%99.12%0.002
DS982.90%80.70%78.40%74.70%66.50%79.60%77.13%0.050
DS1073.70%80.80%73.20%73.70%67.20%76.80%74.23%0.038
DS1163.20%72.90%66.50%65.80%68.40%69.00%67.63%0.028
DS1275.00%74.10%65.50%69.00%60.30%66.40%68.38%0.047
DS1340.60%94.30%96.20%95.30%94.30%64.20%80.82%0.197
DS1499.00%99.00%94.20%99.00%99.00%91.30%96.92%0.028
DS1588.00%86.00%90.00%85.00%88.00%88.00%87.50%0.015
DS1685.60%85.60%81.10%82.20%76.70%78.90%81.68%0.030
DS1790.00%93.30%87.80%93.30%83.30%87.80%89.25%0.032
DS1858.80%57.50%58.80%67.50%67.50%60.00%61.68%0.039
Avg.79.22%82.36%81.67%82.73%79.73%80.61%
Std. Dev.0.1540.1230.1200.1180.1320.115
Table A3. F-score of classifiers trained on small datasets.
Classifiers
DatasetsABRFNNDTNBSVMAvg.Std. Dev.
DS199.00%99.00%99.00%99.00%98.90%99.00%98.98%0.000
DS283.10%79.20%82.20%83.30%82.50%79.20%81.58%0.017
DS394.90%94.50%94.70%96.20%90.40%96.30%94.50%0.020
DS460.90%67.30%68.00%64.00%55.80%83.00%66.50%0.084
DS591.00%78.30%78.90%78.30%77.20%78.20%80.32%0.048
DS679.70%79.00%92.00%87.00%85.40%87.00%85.02%0.045
DS770.40%65.90%70.50%69.80%70.30%71.00%69.65%0.017
DS899.00%99.00%99.00%99.00%99.70%99.00%99.12%0.003
DS981.00%78.00%79.10%74.00%69.80%80.00%76.98%0.039
DS1069.80%75.90%72.20%73.10%68.80%68.80%71.43%0.026
DS1162.60%72.80%66.70%65.70%67.20%68.80%67.30%0.031
DS1275.00%74.00%65.50%69.00%58.70%66.40%68.10%0.055
DS1358.00%94.30%96.20%95.30%94.30%58.40%82.75%0.174
DS1499.00%99.00%94.30%99.00%99.00%91.40%96.95%0.030
DS1585.30%83.90%89.60%80.90%91.00%91.00%86.95%0.038
DS1685.10%84.30%80.00%81.40%73.70%83.00%81.25%0.038
DS1790.00%93.30%87.80%93.30%83.20%87.80%89.23%0.035
DS1858.80%57.30%58.80%67.70%67.60%60.10%61.72%0.043
Avg.80.14%81.94%81.92%82.00%79.64%80.47%
Std. Dev.0.1380.1210.1240.1220.1360.124
Table A4. Specificity of classifiers trained on small datasets.
Classifiers
DatasetsABRFNNDTNBSVMAvg.Std. Dev.
DS199.00%99.00%99.00%99.00%98.90%99.00%98.98%0.000
DS283.00%79.10%82.30%83.10%82.70%79.60%81.63%0.016
DS364.60%54.30%58.40%79.10%74.40%89.40%70.03%0.122
DS430.70%45.80%47.40%43.20%79.70%28.70%45.92%0.167
DS514.90%17.00%27.20%16.00%26.70%14.90%19.45%0.054
DS679.30%79.80%95.70%96.00%96.60%95.70%90.52%0.078
DS743.70%41.60%45.20%44.80%40.40%26.50%40.37%0.064
DS899.00%99.00%99.00%99.00%99.70%99.00%99.12%0.003
DS948.30%41.00%62.00%42.20%81.90%20.40%49.30%0.191
DS1034.70%39.80%46.20%49.30%56.10%28.30%42.40%0.093
DS1157.70%70.10%65.80%62.20%61.20%65.40%63.73%0.039
DS1274.30%72.90%64.80%68.70%64.90%66.20%68.63%0.038
DS1384.90%98.80%99.20%99.10%98.90%92.60%95.58%0.053
DS1499.00%99.00%94.50%99.00%98.50%91.00%96.83%0.031
DS1526.40%26.10%55.50%11.60%12.00%12.00%23.93%0.155
DS1665.30%57.60%52.50%56.70%35.90%21.10%48.18%0.150
DS1789.80%93.90%88.10%93.90%82.40%88.10%89.37%0.039
DS1857.20%54.80%61.10%69.10%66.80%58.90%61.32%0.051
Avg.63.99%64.98%69.11%67.33%69.87%59.82%
Std. Dev.0.2580.2600.2190.2780.2610.325
Table A5. AUC of classifiers trained on small datasets.
Classifiers
DatasetsABRFNNDTNBSVMAvg.Std. Dev.
DS199.00%99.00%99.00%99.00%99.90%99.00%99.15%0.00
DS289.50%86.70%88.30%86.90%90.00%79.40%86.80%0.04
DS392.20%96.30%91.20%81.70%85.60%92.70%89.95%0.05
DS467.70%73.80%72.70%58.50%72.70%50.00%65.90%0.09
DS549.00%66.40%56.00%50.20%64.20%49.90%55.95%0.07
DS676.00%95.40%94.50%92.00%95.90%94.70%91.42%0.07
DS766.50%67.30%65.80%60.90%64.90%50.00%62.57%0.06
DS8100.00%99.00%99.00%99.00%99.00%99.00%99.17%0.00
DS983.30%84.80%81.50%59.20%84.90%50.00%73.95%0.14
DS1069.50%66.30%68.40%52.80%64.20%52.50%62.28%0.07
DS1170.20%77.90%68.70%64.60%74.30%67.20%70.48%0.04
DS1279.60%81.60%74.90%70.10%73.50%66.30%74.33%0.05
DS1376.80%99.90%99.70%97.20%98.80%93.50%94.32%0.08
DS1499.00%99.00%99.10%99.00%99.90%91.20%97.87%0.03
DS1569.00%69.20%65.80%43.40%49.70%50.00%57.85%0.10
DS1680.90%77.60%75.20%66.20%70.10%50.00%70.00%0.10
DS1796.50%97.60%92.60%92.30%93.50%87.90%93.40%0.03
DS1861.50%60.20%54.80%59.40%72.70%59.50%61.35%0.05
Avg.79.23%83.22%80.40%74.02%80.77%71.27%
Std. Dev.0.140.130.150.190.150.20
Table A6. p-values for different size reduction scenarios using the SVM model; bold values are significant.
SVMSize Reduction Scenarios
LD-SD980SD980-SD490SD490-SD98
DiabetesSkin SegmentationDiabetesSkin SegmentationDiabetesSkin Segmentation
Performance MetricAccuracy0.014260.312070.072150.189430.058210.46414
Precision0.072150.468120.105650.046480.047460.5
Recall0.018310.312070.23270.149170.047460.46414
Specificity0.018310.022750.337240.055920.072150.44828
F score0.010720.484050.337240.028720.047460.3707
AUC0.018310.09510.264350.015390.047460.4721
Table A7. p-values for different size reduction scenarios using the NN model; bold values are significant.
NNSize Reduction Scenarios
LD-SD980SD980-SD490SD490-SD98
DiabetesSkin SegmentationDiabetesSkin SegmentationDiabetesSkin Segmentation
Performance MetricAccuracy0.046480.001350.200450.460170.058210.46017
Precision0.001690.001350.117020.416830.047460.26435
Recall0.002890.001350.416830.460170.037540.37828
Specificity0.00090.33360.181410.337240.058210.10565
F score0.001690.001350.181410.337240.058210.26435
AUC0.000690.008420.135670.397430.033620.04363
Table A8. p-values for different size reduction scenarios using the DT model; bold values are significant.
DTSize Reduction Scenarios
LD-SD980SD980-SD490SD490-SD98
DiabetesSkin SegmentationDiabetesSkin SegmentationDiabetesSkin Segmentation
Performance MetricAccuracy0.001070.041820.0150.301530.072150.05821
Precision0.001220.000140.00440.428580.049470.01618
Recall0.001690.001690.0150.378280.072150.05821
Specificity0.001220.000140.00570.452240.049470.03144
F score0.001220.000140.00440.428580.049470.01618
AUC0.000640.000090.016590.424650.055920.00494
Table A9. p-values for different size reduction scenarios using the RF model; bold values are significant.
RFSize Reduction Scenarios
LD-SD980SD980-SD490SD490-SD98
DiabetesSkin SegmentationDiabetesSkin SegmentationDiabetesSkin Segmentation
Performance MetricAccuracy0.000470.046480.186730.460170.123020.05821
Precision0.000310.000690.047460.261090.208970.07215
Recall0.000470.002190.186730.460170.123020.05821
Specificity0.000310.000690.076360.50.127140.03362
F score0.000310.000690.047460.315610.151510.0505
AUC0.000090.000690.070780.072150.022220.10565
Table A10. p-values for different size reduction scenarios using the AB model; bold values are significant.
ABSize Reduction Scenarios
LD-SD980SD980-SD490SD490-SD98
DiabetesSkin SegmentationDiabetesSkin SegmentationDiabetesSkin Segmentation
Performance MetricAccuracy0.022750.329970.355690.47210.444330.04182
Precision0.00240.409050.363930.261090.452240.01951
Recall0.022750.329970.355690.47210.444330.06057
Specificity0.1190.080760.206110.45620.448280.02275
F score0.1190.261090.264350.424650.322760.06671
AUC0.070780.337240.173610.45620.312070.08379
Table A11. p-values for different size reduction scenarios using the NB model; bold values are significant.
NBSize Reduction Scenarios
LD-SD980SD980-SD490SD490-SD98
DiabetesSkin SegmentationDiabetesSkin SegmentationDiabetesSkin Segmentation
Performance MetricAccuracy0.011010.070780.385910.284340.151510.22759
Precision0.006950.057350.337240.347590.312070.09496
Recall0.011010.072460.385910.302390.151510.15418
Specificity0.001390.058550.363930.233490.274250.01985
F score0.002890.151000.312070.189950.127140.08590
AUC0.012870.098350.214760.051550.151510.09496

References

  1. Sordo, M.; Zeng, Q. On sample size and classification accuracy: A performance comparison. In Biological and Medical Data Analysis; Springer: Berlin/Heidelberg, Germany, 2005; pp. 193–201. [Google Scholar]
  2. Prusa, J.; Khoshgoftaar, T.M.; Seliya, N. The effect of dataset size on training tweet sentiment classifiers. In Proceedings of the 2015 IEEE 14th International Conference on Machine Learning and Applications (ICMLA), Miami, FL, USA, 9–11 December 2015; pp. 96–102. [Google Scholar]
  3. Rahman, M.S.; Sultana, M. Performance of Firth-and logF-type penalized methods in risk prediction for small or sparse binary data. BMC Med. Res. Methodol. 2017, 17, 33. [Google Scholar] [CrossRef] [PubMed] [Green Version]
  4. Marcoulides, G.A. Discovering Knowledge in Data: An Introduction to Data Mining, Daniel T. Larose. J. Am. Stat. Assoc. 2005, 100, 1465. [Google Scholar] [CrossRef]
  5. Wieczorek, G.; Antoniuk, I.; Kurek, J.; Świderski, B.; Kruk, M.; Pach, J.; Orłowski, A. BCT Boost Segmentation with U-net in TensorFlow. Mach. Graph. Vis. 2019, 28, 25–34. [Google Scholar]
  6. Floca, R. Challenges of Open Data in Medical Research. In Opening Science; Bartling, S., Friesike, S., Eds.; Springer: Cham, Switzerland, 2014. [Google Scholar] [CrossRef] [Green Version]
  7. Shawe-Taylor, J.; Anthony, M.; Biggs, N.L. Bounding sample size with the Vapnik-Chervonenkis dimension. Discret. Appl. Math. 1993, 42, 65–73. [Google Scholar] [CrossRef] [Green Version]
  8. Andonie, R. Extreme data mining: Inference from small datasets. Int. J. Comput. Commun. Control 2010, 5, 280–291. [Google Scholar] [CrossRef] [Green Version]
  9. Dris, A.B.; Alzakari, N.; Kurdi, H. A Systematic Approach to Identify an Appropriate Classifier for Limited-Sized Data Sets. In Proceedings of the 2019 International Symposium on Networks, Computers and Communications (ISNCC), Istanbul, Turkey, 18–20 June 2019; pp. 1–6. [Google Scholar]
  10. Andonie, R.; Sasu, L. Fuzzy artmap with input relevances. IEEE Trans. Neural Netw. 2006, 17, 929–941. [Google Scholar] [CrossRef] [PubMed]
  11. Chen, Z.S.; Zhu, B.; He, Y.L.; Yu, L.A. A PSO based virtual sample generation method for small sample sets: Applications to regression datasets. Eng. Appl. Artif. Intell. 2017, 59, 236–243. [Google Scholar] [CrossRef]
  12. Li, D.-C.; Lin, W.-K.; Lin, L.-S.; Chen, C.-C.; Huang, W.-T. The attribute-trend similarity method to improve learning performance for small datasets. Int. J. Prod. Res. 2017, 55, 1898–1913. [Google Scholar] [CrossRef]
  13. Yang, J.; Yu, X.; Xie, Z.-Q.; Zhang, J.-P. A novel virtual sample generation method based on gaussian distribution. Knowl. Based Syst. 2011, 24, 740–748. [Google Scholar] [CrossRef]
  14. Chen, H.-Y.; Li, D.-C.; Lin, L.-S. Extending sample information for small data set prediction. In Proceedings of the 2016 5th IIAI International Congress on Advanced Applied Informatics (IIAI-AAI), Kumamoto, Japan, 10–14 July 2016; pp. 710–714. [Google Scholar]
  15. Li, D.-C.; Liu, C.-W. Extending attribute information for small data set classification. IEEE Trans. Knowl. Data Eng. 2012, 24, 452–464. [Google Scholar] [CrossRef]
  16. Mao, R.; Zhu, H.; Zhang, L.; Chen, A. A new method to assist small data set neural network learning. In Proceedings of the Sixth International Conference on Intelligent Systems Design and Applications, Jinan, China, 16–18 October 2006; pp. 17–22. [Google Scholar]
  17. Patil, R.S.; Kshirsagar, D.B. Dataset Classification by Extending Attribute Information for Improving Classification Accuracy. Int. J. Innov. Trends Eng. Res. 2017, 2, 1–7. [Google Scholar]
  18. Lin, L.S.; Li, D.C.; Chen, H.Y.; Chiang, Y.C. An attribute extending method to improve learning performance for small datasets. Neurocomput 2018, 286, 75–87. [Google Scholar] [CrossRef]
  19. Coqueret, G. Approximate NORTA simulations for virtual sample generation. Expert Syst. Appl. 2017, 73, 69–81. [Google Scholar] [CrossRef]
  20. Choi, Y.; Lee, H. Data properties and the performance of sentiment classification for electronic commerce applications. Inf. Syst. Front. 2017, 19, 993–1012. [Google Scholar] [CrossRef] [Green Version]
  21. Zhu, X.; Vondrick, C.; Fowlkes, C.C.; Ramanan, D. Do we need more training data? Int. J. Comput. Vis. 2016, 119, 76–92. [Google Scholar] [CrossRef] [Green Version]
  22. Barbedo, J.G. Impact of dataset size and variety on the effectiveness of deep learning and transfer learning for plant disease classification. Comput. Electron. Agric. 2018, 153, 46–53. [Google Scholar] [CrossRef]
  23. Linjordet, T.; Balog, K. Impact of Training Dataset Size on Neural Answer Selection Models. In Lecture Notes in Computer Science, Proceedings of the European Conference on Information Retrieval, Cologne, Germany, 14 April 2019; Springer: Cham, Switzerland, 2019; pp. 828–835. [Google Scholar]
  24. Blake, C.L.; Merz, C.J. UCI Repository of Machine Learning Databases; Department of Information and Computer Science, University of California: Irvine, CA, USA, 1998; Volume 55, Available online: https://archive.ics.uci.edu/ml/datasets.php (accessed on 17 January 2020).
  25. Kusonmano, K.; Netzer, M.; Pfeifer, B.; Baumgartner, C.; Liedl, K.R.; Graber, A. Evaluation of the impact of dataset characteristics for classification problems in biological applications. In Proceedings of the International Conference on Bioinformatics and Biomedicine, Venice, Italy, 26 October 2009; Volume 3, pp. 966–990. [Google Scholar]
  26. Ruparel, N.H.; Shahane, N.M.; Bhamare, D.P. Learning from Small Data Set to Build Classification Model: A Survey. Proc. IJCA Int. Conf. Recent Trends Eng. Technol. 2013, 4, 23–26. [Google Scholar]
  27. Zhang, G.P. Neural networks for classification: A survey. IEEE Trans. Syst. Man Cybern. Part C 2000, 30, 451–462. [Google Scholar] [CrossRef] [Green Version]
  28. Zhang, Y.; Xin, Y.; Li, Q.; Ma, J.; Li, S.; Lv, X.; Lv, W. Empirical study of seven data mining algorithms on different characteristics of datasets for biomedical classification applications. BioMed. Eng. OnLine 2017, 16, 125. [Google Scholar] [CrossRef] [PubMed] [Green Version]
  29. Eibe, F.; Hall, M.; Witten, I.; Pal, J. The weka workbench. In Online Appendix for Data Mining: Practical Machine Learning Tools and Techniques; Morgan Kaufmann Publishers Inc.: San Francisco, CA, USA, 2016. [Google Scholar]
Figure 1. Dataset partitioning algorithm.
Applsci 11 00796 g001
Figure 2. Performance of classifiers with respect to (a) accuracy, (b) precision, (c) recall, (d) f-score, (e) specificity, (f) AUC when trained on diabetes dataset and its small subsets.
Applsci 11 00796 g002
Figure 3. Performance of classifiers with respect to (a) accuracy, (b) precision, (c) recall, (d) f-score, (e) specificity, (f) AUC when trained on skin segmentation dataset and its small subsets.
Applsci 11 00796 g003
Table 1. Comparison of related works.
Ref.Purpose/GoalNo. of DatasetsDataset Size Range
[8]Enhance the performance of models on limited datasets1176
[11]Enhance the performance of models on limited datasets2NA
[12]Augment training set instances2(19–30)
[13]Augment training set instances3(66–90)
[14]Extend training set features130
[15]Extend training set features7(18–768)
[17]Extend training set features8(18–768)
[18]Extend training set features4(19–1030)
[20]Study the impact of dataset size in sentiment classification domain4(4000–10,000)
[2]Study the impact of dataset size in sentiment classification domain7(1000–243,000)
[21]Study the impact of dataset size in object detection domain2(1218–81,075)
[22]Study the impact of dataset size in plant disease classification domain11383
[23]Study the impact of dataset size in information retrieval domain2(857–8651)
This workStudy the impact of dataset size in medical domain20(80–245,057)
Table 2. Datasets description.
Dataset
Notation
Dataset NameSizeAttributesData Type
DS1Parkinson Speech Dataset with Multiple Types of Sound Recordings104026Numeric + Text
DS2Mammographic Mass-severity8306Numeric
DS3Cervical cancer (Risk Factors)-Biopsy66836Numeric
DS4ILPD (Indian Liver Patient)58310Numeric + Text
DS5Thoracic Surgery47017Numeric + Text
DS6Ecoli Data Set3368Numeric + Text
DS7Haberman’s Survival3063Numeric
DS8(Autistic Spectrum Disorder Screening Data for Children) ASD Data for Children29221Numeric + Text
DS9SPECTF Heart26744Numeric
DS10Breast Cancer Wisconsin (Prognostic)19832Numeric
DS11HCC Survival15549Numeric
DS12Breast Cancer Coimbra11610Numeric
DS13Breast Tissue-col2(class)10610Numeric + Text
DS14Autistic Spectrum Disorder Screening Data for Adolescent10421Numeric + Text
DS15Fertility10010Numeric + Text
DS16Immunotherapy908Numeric
DS17Cryotherapy907Numeric
DS18Caesarian Section Classification805Numeric
DS19Skin Segmentation245,0574Numeric
DS20Diabetes 130-US hospitals987155Numeric + Text
Table 3. Large Datasets and their subsets.
Dataset NotationDataset NameSize
DS19Skin Segmentation245,057
DS19.1Skin Segmentation (Subset 1)980
DS19.2Skin Segmentation (Subset 2)490
DS19.3Skin Segmentation (Subset 3)98
DS20Diabetes 130-US hospitals9871
DS20.1Diabetes 130-US hospitals (Subset 1)980
DS20.2Diabetes 130-US hospitals (Subset 2)490
DS20.3Diabetes 130-US hospitals (Subset 3)98
Table 4. Classification models parameter values.
Classification ModelParameter Values
ABBatch size = 100
Classifier = decision stump
numIterations = 10
seed = 1
weight threshold = 100
NBBatch size = 100
SVMBatch size = 100
Kernel = Polynomial
C = 1
Random seed = 1
Tolerance parameter =0.001
NNHidden layers = (attributes + classes)/2
Learning rate = 0.3
Seed = 0
DTBatch size = 100
Binary split = false
Confidence factor = 0.25
MinNumObj = 2
Seed = 1
RFBatch size = 100
numIterations = 100
seed = 1
Table 5. Accuracy of classifiers trained on small datasets.
Classifiers
DatasetsABRFNNDTNBSVMAvg.Std. Dev.
DS199.00%99.00%99.00%99.00%99.00%99.00%99.00%1.110 × 10⁻¹⁶
DS283.00%79.00%82.00%83.00%83.00%79.00%81.50%0.018
DS395.00%95.00%95.00%96.00%89.00%96.00%94.33%0.024
DS470.00%69.00%70.00%66.00%56.00%71.00%67.00%0.052
DS585.00%84.00%81.00%85.00%79.00%85.00%83.17%0.023
DS665.00%66.00%80.00%84.00%85.00%86.00%77.67%0.088
DS773.00%67.00%73.00%72.00%75.00%74.00%72.33%0.026
DS899.00%99.00%99.00%99.00%99.00%99.00%99.00%1.110 × 10⁻¹⁶
DS983.00%81.00%78.00%75.00%67.00%80.00%77.33%0.052
DS1074.00%81.00%73.00%74.00%67.00%77.00%74.33%0.042
DS1163.00%73.00%67.00%66.00%68.00%69.00%67.67%0.030
DS1275.00%74.00%66.00%69.00%60.00%66.00%68.33%0.051
DS1341.00%94.00%96.00%95.00%94.00%64.00%80.67%0.210
DS1499.00%99.00%94.00%99.00%99.00%91.00%96.83%0.032
DS1588.00%86.00%90.00%85.00%88.00%88.00%87.50%0.016
DS1686.00%86.00%81.00%82.00%77.00%79.00%81.83%0.033
DS1790.00%93.00%88.00%93.00%83.00%88.00%89.17%0.034
DS1859.00%58.00%59.00%68.00%68.00%60.00%62.00%0.043
Avg.79.28%82.39%81.72%82.78%79.78%80.61%
Std. Dev.0.1530.1230.1180.1170.1310.115
Publisher’s Note: MDPI stays neutral with regard to jurisdictional claims in published maps and institutional affiliations.

