Abstract
Distribution and deposition of cylindrical nanoparticles in a turbulent pipe flow are investigated numerically. The equations of turbulent flow including the effect of particles are solved together with the mean equations of the particle number density and the probability density function for particle orientation including the combined effect of Brownian and turbulent diffusion. The results show that the distribution of the particle concentration on the cross-section becomes non-uniform along the flow direction, and the non-uniformity is reduced with the increases of the particle aspect ratio and Reynolds number. More and more particles will align with their major axis near to the flow direction, and this phenomenon becomes more obvious with increasing the particle aspect ratio and with decreasing the Reynolds number. The particles in the near-wall region are aligned with the flow direction obviously, and only a slight preferential orientation is observed in the vicinity of pipe’s center. The penetration efficiency of particle decreases with increasing the particle aspect ratio, Reynolds number and pipe length-to-diameter ratio. Finally, the relationship between the penetration efficiency of particle and related synthetic parameters is established based on the numerical data.
1. Introduction
Transport of particles through pipes has the advantages of small space occupied, no backhaul, no pollution, flexible setting, long distance transport and so on. Therefore, the transport of particles has been widely used in various industries such as machinery manufacturing, metallurgy, power generation, material engineering, pharmaceutical and food production. The transport of particles is usually accompanied by the process of particle deposition upon the wall surface. It is crucial to reduce the particle deposition in order to improve the conveying efficiency of particles. The mechanism of nanoparticle deposition on a wall is complicated because it is related to the thermophoretic force [1], inertial force of particle, gravitational force [2], Brownian and turbulent diffusion [3].
In the past several decades the transport and deposition of particles in the pipe turbulent flow have been studied a lot for the spherical particles, but very few for non-spherical particles. Actually, the major amount of particles is non-spherical in shape, e.g., cylindrical particles. The transport and deposition of cylindrical particles are very complicated because particle rotation and its orientation distribution are strongly coupled with the translation motion [4]. Moreover, inhomogeneity in the spatial and orientational distribution of particles affects the turbulent flow properties. There are several published works in the literature discussing the transport and deposition of cylindrical particles. In the case of laminar flow with no turbulent diffusion, Guha [5] indicated that the deposition rate for the particles with an intermediate size was mainly dependent on the thermophoresis, turbophoresis and roughness. Tavakol et al. [6] developed a new model for predicting particle deposition and analyzed the impact of the particle aspect ratio on the deposition.
In the case of inertial cylindrical particle with no Brownian diffusion, Goldenberg et al. [7] measured the deposition velocity of particles with a diameter of 1–2 μm for different Reynolds numbers. They showed that the deposition velocity was mainly dependent on gravitation when Re ≤ 26,000, while dependent on the comprehensive effects of particle size, gravitation and turbulent fluctuations when Re > 26,000. Shapiro and Goldenberg [8] measured the deposition velocity of particles of 0.6–2.5μm in diameter for different Reynolds numbers and particle aspect ratios, and found that the aspect ratios significantly affected the deposition velocity of particles. Podgorski et al. [9] studied the particle deposition from a gas stream. They found that the deposition rate of flexible particles was the lowest, while stiff particles had the highest deposition rate. Marchioli et al. [10] studied the dispersion and deposition of particles with considering the particle inertia and hydrodynamic forces. They found that particles tended to align with the flow direction near the wall, but such a state was unstable for particles with higher inertia. The deposition rate of particles with a larger aspect ratio was higher, but particle inertia had less effect on the particle deposition in the centerline. Tavakol et al. [11] showed that the deposition rate of particles was proportional to the particle aspect ratio, and the fluctuating velocity gradient had an insignificant effect on the deposition rate. Shachar-Berman et al. [12] indicated that oscillatory breathing had an important effect on the particle deposition in the lungs.
As is shown above, the transport and deposition of cylindrical particles are related to the inertial force of particle, gravitational force, thermophoretic force, Brownian diffusion and turbulent diffusion. For the transport of cylindrical nanoparticles in a turbulent flow with no temperature gradient, the deposition of a particle is mainly resulted from the Brownian and turbulent diffusion, while the thermophoretic force, inertial force of particle and gravitational force are negligible. However, there is a lack of study on the case of deposition of cylindrical nanoparticles under the combined effect of Brownian diffusion and turbulent diffusion. Such a case can be found in the transport of cylindrical nanoparticles at higher Reynolds number flows, for example, lung cancer caused by exposure to asbestos fibrous particles in inhalation toxicology. Besides, the deposition of cylindrical nanoparticles is related to the particle spatial and orientation distributions that affect the characteristics of the turbulent flow field, which has not been found in the literature. Besides, the existence of cylindrical particles would affect the turbulent flow. Lin et al. [13] derived the modified Reynolds averaged N–S equations and the probability distribution function for the mean orientation of cylindrical particles. Gillissen et al. [14] explored fiber-induced drag reduction using N–S equations supplemented with the fiber stress tensor. Lin et al. [15] solved numerically the Reynolds averaged N–S equations with the additional stress resulting from fibers in a contraction flow. Lin and Shen [16] developed a model by deriving the equations of modified Reynolds averaged N–S, turbulence kinetic energy and dissipation rate with additional terms of the fibers. In this study, therefore, the equations of mean momentum and turbulent kinetic energy and turbulent dissipation rate of fluid including the effect of cylindrical nanoparticles are solved numerically together with the mean equations of particle number density and the probability density function for particle orientation including the combined effect of Brownian diffusion and turbulent diffusion in a fully turbulent pipe flow at higher Reynolds numbers. Then the particle distributions on a cross-section and penetration efficiencies at outlet for different parameters are calculated. Based on the numerical data, the relationship between the penetration efficiency and related synthetic parameters is established.
2. Models and Equations
2.1. Flow Laden with Cylindrical Nanoparticles
In practical applications, there are many cases in which the fluid carries solid particles. At this time, to obtain the information of fluid flow and solid particle motion, it is necessary to establish the fluid equation containing solid particles. In the present study, the flow laden with cylindrical nanoparticles in a round pipe is shown in Figure 1. The flow is incompressible and fully developed turbulent. The modified Navier–Stokes with the additional term of cylindrical nanoparticles is:
in which and are the mean velocity and pressure, respectively; ρm is the mixing density (Equation (2)); μ is the fluid viscosity; is the Reynolds stress; additional viscosity μa is related to the particle concentration, aspect ratio and orientation distribution, and is given by extending Batchelor’s theory to account for two-body interactions as shown in Equation (2) [17]; is the mean rate-of-strain tensor and and are the mean second- and fourth-order tensors of particle orientation, respectively, as shown in Equation (3) [18]. The last term on the right hand side of Equation (1) represents the effect of cylindrical nanoparticles on the flow, and the cylindrical nanoparticles are non deformable.
where ρ and ρf are the fluid and particle density, respectively; Φ is the particle volume fraction and λ is the particle aspect ratio.
where p is the particle orientation vector; pi is the unit vector and is the mean probability density function for particle orientation.
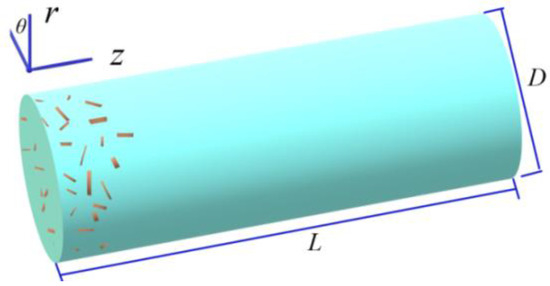
Figure 1.
Flow laden with cylindrical particles in a pipe.
2.2. Reynolds Stress
The Reynolds stress in Equation (1) is given by:
in which the eddy viscosity is μT = 0.09 ρm k2/ε, where k and ε are the turbulent kinetic energy and dissipation rate, respectively.
In order to solve Equations (1) and (4), the equations of k and ε for turbulent flow with additional terms of cylindrical nanoparticles are given [16]:
where Sk and Sε are the contribution from the cylindrical nanoparticles.
2.3. Mean Probability Density Function for Orientation of Cylindrical Nanoparticles
The equation of probability density function ψ(p) for the orientation of a cylindrical nanoparticle should be derived in advance in order to obtain the second- and fourth-order tensors of particle orientation in Equation (3). The equation of ψ(p) is [19]:
where is the gradient operator projected onto the surface of the unit sphere; is the angular velocity of particle; η = (λ2 − 1)/(λ2 + 1); is the vorticity tensor; DrI is the rotary diffusion coefficient induced by the interaction between the particles [20] and DrB is the Brownian rotary diffusion coefficient [21]:
where T is the temperature; kb is the Boltzmann constant and Lp is the particle length.
Averaging Equation (7) yields:
where αψx = 1.3(5 k2μ/3ερm)1/2 and αψp = 0.7(4 ερm/15 μ)1/2 [22] are the particle dispersion coefficients of linear and angular displacement, respectively.
2.4. Volume Fraction Φ of Cylindrical Nanoparticles
In the past research, the particle volume fraction Φ in Equation (2) is usually assumed to be a constant and in a uniform distribution. In fact the distribution of Φ is non-uniform because of particle convection and diffusion. Therefore, in order to obtain the volume fraction Φ of cylindrical nanoparticles in Equation (2), the equation of the mean number density for cylindrical nanoparticles should be solved. Considering the effect of convection and diffusion, the mean equation of mean number density for cylindrical nanoparticles is [23]:
where v is the volume of particle; vt = 0.09 k2/ε is the turbulent diffusion coefficient and DtB is the Brownian translational diffusion coefficient [21]:
can be transformed into the particle number N and volume V:
Then Φ can be calculated based on V.
2.5. Penetration Efficiency
Penetration efficiency (PE) of cylindrical nanoparticles though a pipe is inversely proportional to the deposition rate and can be defined as:
in which Vout and Vin are the particle volume at the outlet and inlet of the pipe, respectively and Vde is the particle volume of deposition to the wall:
where Aj is the area of the jth wall cell.
3. Numerical Method and Main Steps of Simulation
- (1)
- Equations (1), (2), (4)–(6) with Φ = μa = Sk = Sε = 0 are solved to get , k, ε and .
- (2)
- Equations (10)–(12) are solved to get and Φ.
- (3)
- Substitute Φ into Equation (2) to get ρm and μa.
- (4)
- Substitute , k, ε and Equation (8) into Equation (9) and solve it to get .
- (5)
- Substitute into Equation (3) to get and .
- (6)
- Substitute ρm, μa, and into Equations (1), (4)–(6) to get , k, ε and .
- (7)
- Turn to step (2) based on the new values of , k, ε and if necessary.
- (8)
- Calculate the particle volume V with Equation (12).
- (9)
- Calculate the deposited particle volume Vde with Equation (14) and penetration efficiency PE with Equation (13).
The equations in this paper are all partial differential equations and must be solved numerically. Equations (1), (4)–(6) and (10) are solved using the finite difference method. Equation (3) is integrated with the Simpson formula. The grid system consists of 70(r) × 30(θ) × 240(z) = 504,000 grid points. A grid independence test is performed by changing grid points from 60 to 80 in radial direction, 25 to 35 in circumferential and 230 to 250 in axial direction, respectively. The parameters used in the computation are: ρ = 1.205 kg/m3, μ = 1.808 × 10⁻⁵ Pa∙s, T = 293 K and kb = 1.38 × 10⁻²³ J/K.
4. Validation
In order to prove the validity of the model and numerical scheme, we compared the present numerical results of mean orientation of cylindrical particles with the experimental ones [24] in a turbulent pipe flow as shown in Figure 2 where ϕ is the angle between the particle axis and pipe’s axis, and P is the probability. We also compared the penetration efficiency as a function of particle diameter as shown in Figure 3 where both numerical and experimental results [25] are given. In Figure 2 and Figure 3, the parameters used in the numerical simulation were consistent with the experimental situation. The present numerical results could be seen to be qualitatively consistent with the experimental ones.
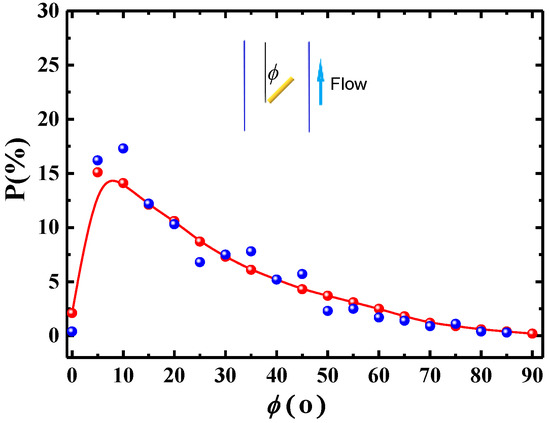
Figure 2.
Probability distribution of mean cylindrical particle orientation (λ = 8, Re = 10,000). ●: numerical results and ●: experimental results [24].
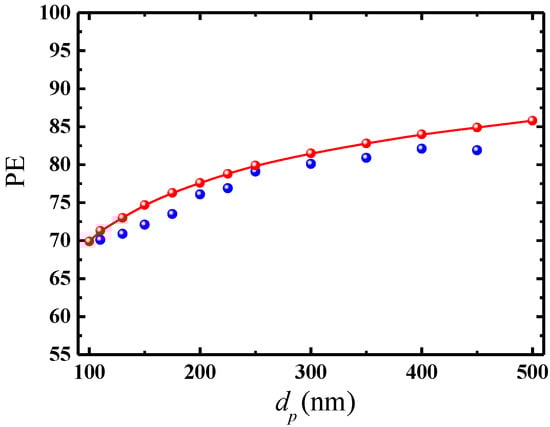
Figure 3.
Penetration efficiency as a function of particle diameter (λ = 1, Re = 5120, L/D = 375). ●: numerical results and ●: experimental results [25].
5. Results and Discussion
In the following figures, only particle distributions on the half cross-section are shown because the distributions are symmetric about the centerline of the pipe.
5.1. Distribution of Particle Volume Concentration and Orientation at Different Axial Positions
When the particles enter the tube, the particles show different distributions of the concentration and orientation at different axial positions with the development of time. The distributions of particle concentration and orientation can be obtained by solving Equations (10) and (7). The distributions of particle volume concentration on the cross-section at different axial positions are shown in Figure 4a. The uniform distribution of volume concentration on the cross-section at inlet becomes non-uniform along the flow direction because the distribution of particle number density is affected by the shear-induced force caused by the mean shear rate of the fluid, Brownian diffusion and turbulent diffusion as shown in Equations (10) and (12). The non-uniformity becomes obvious with the increase in the axial distance from the inlet. The particle volume concentration first decreased and then increased from the pipe center to the wall, and there was a minimum around r/R = 0.95. As we know, Brownian diffusion makes particles move from a high concentration area to a low concentration one, resulting in a more uniform distribution of the particle volume concentration. So, it can be deduced that the non-uniform distributions of particle volume concentration were caused by the shear-induced force and turbulent diffusion. The particles in the region around r/R ≈ 0.95 were subjected to the influence of larger shear-induced force and stronger turbulent diffusion because the mean shear rate and the turbulent diffusion coefficient νt were large (νt = 0.09 k2/ε, while turbulent kinetic energy k is large there), hence were diffused to the region near the centerline and the region close proximity to the wall where the turbulent diffusion diminished to zero and particles accumulated in the viscous sublayer with low fluid velocity.
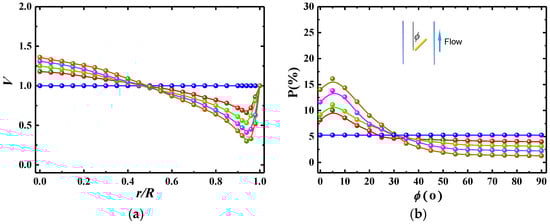
Figure 4.
Distribution of (a) particle concentration and (b) particle orientation at different axial positions (λ = 8, Re = 20,000, L/D = 200). ●: z/D = 0; ●: z/D = 50; ●: z/D = 100; ●: z/D = 150; ●: z/D = 200.
The distributions of the mean orientation of a cylindrical nanoparticle at different axial positions are shown in Figure 4b where the mean orientation angle ϕ was obtained by averaging the orientation angles on the cross-section at a fixed axial position. The particles with uniform distribution of mean orientation angle on the cross-section at inlet will change their orientation angles along the flow direction. The distributions of orientation angle become non-uniform, more and more particles aligned with their major axis near to the flow direction. As shown in Equations (13)–(15), the mean probability density function for particle orientation was affected by the Brownian diffusion, turbulent diffusion and the shear-induced force, and the former two made the distribution of particle orientation become more uniform. The shear-induced force resulted from the mean shear rate of the fluid and the overall effect can be decomposed in two torques, one making a particle rotate around the vorticity axis (i.e., axis θ as shown in Figure 1), and another causing a particle spin around the flow direction, i.e., particles tended to align according to the mean shear of the flow. The particles flowing through the pipe were always subjected to the influence of the mean shear of the flow, so align with the flow direction.
5.2. Distribution of Particle Number Concentration and Orientation at Outlet
5.2.1. Distribution of Particle Orientation
Distributions of mean particle orientation in different regions on the cross-section at outlet are shown in Figure 5 where the cross-section was divided into five regions and the mean particle orientation angle ϕ in different regions were obtained by averaging the orientation angles in the regions. We can see that more particles aligned with the flow direction by the interplay between the shear-induced force, Brownian diffusion and turbulent diffusion. The particles in the near-wall region were aligned with the flow direction obviously because the highest mean shear rate and even the largest shear-induced force appeared in the near-wall region, and only a slight preferential orientation was observed in the vicinity of pipe’s center where the mean shear rate was low. So, it can be concluded that the mean shear rate of the fluid was dominant for affecting the orientation distribution of particles comparing with the Brownian diffusion and turbulent diffusion under the parameters involved in the paper.
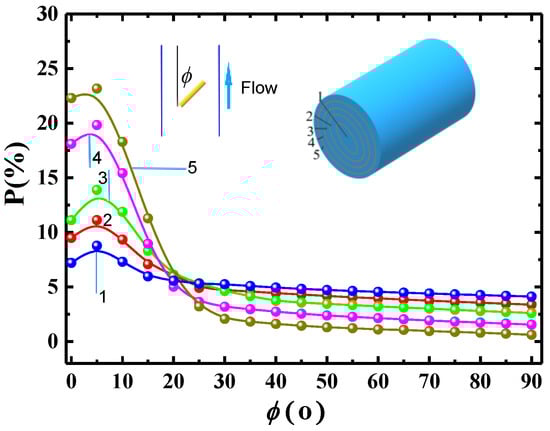
Figure 5.
Distribution of mean particle orientation in different regions on the cross-section at outlet (λ = 8, Re = 20,000, L/D = 200). ●: region 1; ●: 2; ●: 3; ●: 4; ●: 5.
5.2.2. Effect of the Particle Aspect Ratio
Figure 6 shows the distributions of particle volume concentration on the cross-section at the outlet for different particle aspect ratios. It can be seen that the distributions of particle volume concentration become more uniform with increasing the particle aspect ratio. The reason can be analyzed as follows. The evolution of particle number density as shown in Equations (10) and (11) is determined by the mean shear rate of the fluid, Brownian translational diffusion coefficient DtB and turbulent diffusion coefficient νt. The existence of particles in the flow has an effect on the turbulent kinetic energy, which increases as the particle aspect ratio increases [16] because the particles with larger aspect ratio can make a stronger momentum transfer with providing a solid link between the adjacent fluid layers. In return, the increase of turbulent kinetic energy can promote particle diffusion. Besides, as shown in Equation (11), the Brownian diffusion coefficient DtB is proportional to the particle aspect ratio, i.e., the particles are subjected to a larger Brownian diffusion when the aspect ratio is larger. Therefore, the larger the particle aspect ratio is, the stronger the Brownian diffusion and turbulent diffusion are, and the more uniform the distribution of particle volume concentration is.
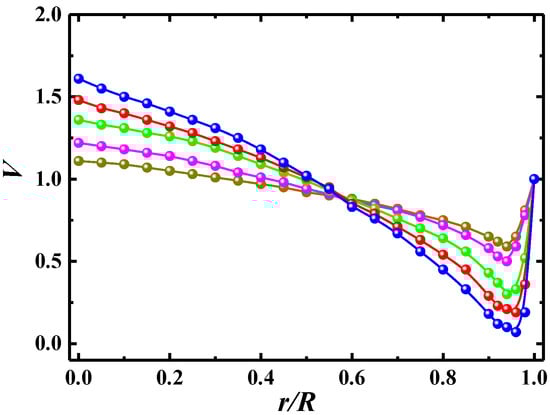
Figure 6.
Distribution of particle volume concentration for different aspect ratio at outlet (Re = 20,000, L/D = 200). ●: λ = 2; ●: λ = 4; ●: λ = 8; ●: λ = 12; ●: λ = 16.
Figure 7 shows the distributions of mean particle orientation in region 1 and 5 at outlet for different particle aspect ratios. The particles tended to align with the flow direction, and this preferential orientation is more obvious in the near-wall region and with increasing the particle aspect ratio. The mean probability density function for particle orientation is determined by the Brownian diffusion, turbulent diffusion and mean shear rate of the fluid. Firstly, the Brownian diffusion coefficient was inversely proportional to the particle aspect ratio as shown in Equation (8), so the distribution of mean particle orientation was more non-uniform for the case of a larger aspect ratio. Secondly, the turbulent dispersion coefficient αψp = 0.7(4ερnf/15μ)1/2 of angular displacement was proportional to the turbulent dissipation rate ε, which increased with increasing the particle aspect ratio [16], so the distribution of mean particle orientation was more uniform for the case of a larger aspect ratio. Thirdly, the shear-induced torque exerted on the particle was larger for the case with larger aspect ratio, which caused the particle to spin around the flow direction more effectively. The comprehensive effect of the above factors makes more particles aligned with the flow direction. As shown in Figure 7b, the difference in the distributions of mean particle orientation between the cases with a different aspect ratio was small for the large aspect ratio, which was consistent with the conclusion [26] that the orientation distribution was not sensitive to the aspect ratio for the inertial particles with an aspect ratio larger than 5.
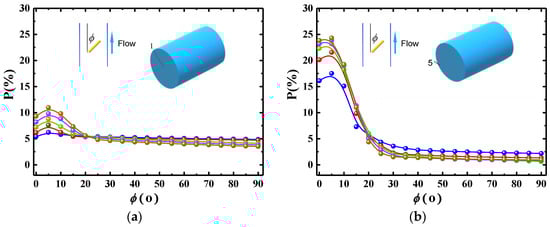
Figure 7.
Distribution of mean particle orientation in region 1 and 5 for different particle aspect ratio (Re = 20,000, L/D = 200). (a) Region 1 and (b) region 5. ●: λ = 2; ●: λ = 4; ●: λ = 8; ●: λ = 12; ●: λ = 16.
5.2.3. Effect of the Reynolds Number
The distributions of the particle volume concentration on the cross-section for different Reynolds numbers are shown in Figure 8 where the concentration distributions become more uniform with increasing the Reynolds number, i.e., the larger the Reynolds number is, the smaller the difference in particle volume concentration between the near-wall region and near-center region is. The turbulent flow is characterized by some parameters among which the most important is the Reynolds number. As the Reynolds number increased, even though the mean velocity profile on the whole cross-section and the turbulent kinetic energy in the near-center region were almost unchanged [16], the turbulent kinetic energy and induced turbulent diffusion (νt = 0.09 k2/ε) in the region around r/R ≈ 0.95 increased obviously [16], resulting in a stronger particle diffusion and making the concentration distributions become more uniform.
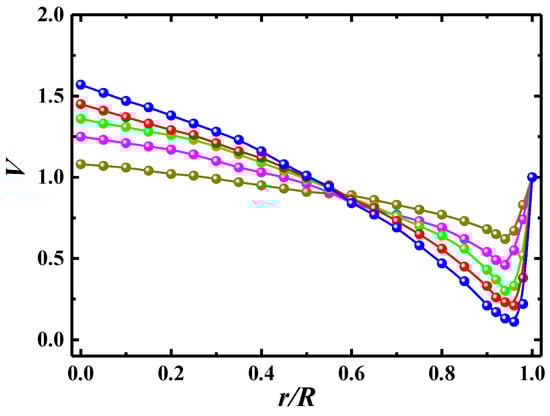
Figure 8.
Distribution of particle concentration for different Reynolds numbers at outlet (λ = 8, L/D = 200). ●: Re = 5000; ●: Re = 10,000; ●: Re = 20,000; ●: Re = 30,000; ●: Re = 40,000.
Figure 9 shows the distributions of mean particle orientation in region 1 and 5 at the outlet for different Reynolds numbers. As the Reynolds number decreased, the distributions of mean particle orientation become more non-uniform, i.e., more particles aligned with the flow direction. As we know, the larger the Reynolds number, the smaller the scale of minimum vortex, the wider the distribution of energy spectrum contained in the vortices of different scales, and less the energy contained in the large vortex related to the mean shear rate of the fluid are. Therefore, the shear-induced torque exerted on the particle by the mean shear rate of the fluid was smaller for the case with larger Reynolds number, resulting in not so many particles aligning with the flow direction.
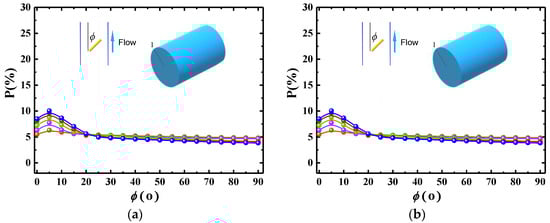
Figure 9.
Distribution of mean particle orientation in region 1 and 5 for different Reynolds numbers (λ = 8, L/D = 200). (a) Region 1 and (b) region 5. ●: Re = 5000; ●: Re = 10,000; ●: Re = 20,000; ●: Re = 30,000; ●: Re = 40,000.
5.3. Penetration Efficiency
The penetration efficiency is inversely proportional to the particle deposition velocity. In normal circumstances, the particle deposition velocity is mainly affected by the gravitational force, inertial force of particle, Brownian diffusion, turbulent diffusion and particle shape. In this paper, the gravitational force, and nanoparticles’ inertial forces were negligible. The particles follow the fluid motion, which includes the mean motion and turbulence fluctuation, and the particles near the wall deposit on the wall due to Brownian diffusion and turbulent diffusion, resulting in the reduction of particle penetration efficiency. Therefore, the effects of Brownian diffusion, turbulent diffusion and particle shape on the deposition velocity and penetration efficiency should be explored. For the cylindrical nanoparticles, the shape was reflected by the aspect ratio.
In order to compare the numerical results of penetration efficiency with experimental ones, we calculated the penetration efficiency of cylindrical nanoparticles with aspect ratio λ = 1 and compared with the experimental result of spherical particles [27] as shown in Figure 10 where Sch is the Schmidt number and PE is the penetration efficiency. The experiment was performed in a tube of 1 m length and 4.8 mm inner diameter, and WOx particles with diameters from 3 to 17 nm were used. It can be seen that the penetration efficiency of particles with λ = 1 was lower than that of spherical particles, which indicates that the effect of particle shape was significant even for the aspect ratio close to unity.
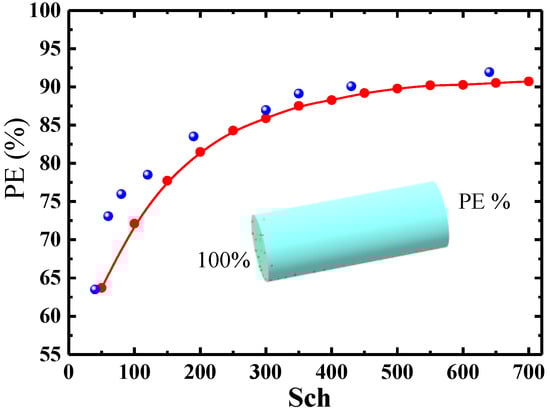
Figure 10.
Penetration efficiency as a function of Sch (Re = 10,500, L/D = 208). ●: numerical results (cylindrical particle, λ = 1) and ●: experimental result (spherical particle) [27].
5.3.1. Effect of the Particle Aspect Ratio
The relationships between the penetration efficiency and the Reynolds number for different particle aspect ratios are shown in Figure 11 where the competitive effects of Brownian diffusion, turbulent diffusion and particle aspect ratio upon the penetration efficiency are exhibited. It can be seen that the penetration efficiency was affected by the particles’ shape, i.e., aspect ratio, the penetration efficiency decreased with increasing the particle aspect ratio. Firstly, the particle volume concentration in the near-wall region increased with increasing the particle aspect ratio as shown in Figure 6, which provides the condition for more particle deposition. Secondly, there was a viscous sublayer close to the wall where the particle Brownian diffusion plays a major role for the deposition velocity. As shown in Equation (11), the Brownian diffusion was proportional to the particle aspect ratio, i.e., the particles with large aspect ratio were subjected to a stronger Brownian diffusion and possessed a large deposition velocity, resulting in a low penetration efficiency. The result given above was consistent with the conclusion that longer particles tended to deposit at higher rates in the case of inertial particle with no Brownian diffusion [10], and high deposition efficiency corresponded to the spherical particles and even higher deposition efficiency for the stiff particles [9].
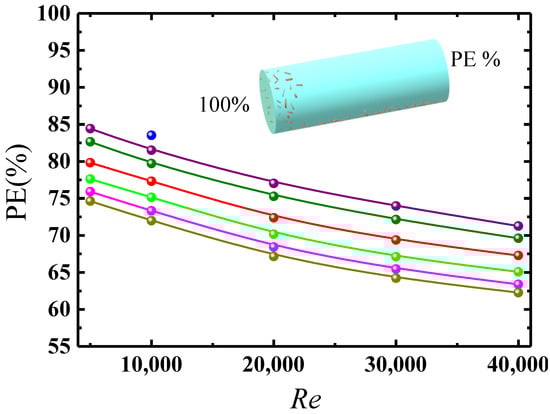
Figure 11.
Penetration efficiency as a function of Re for different aspect ratios (L/D = 200). ●:λ = 1; ●: λ = 2; ●: λ = 4; ●: λ = 8;●: λ = 12;●: λ = 16; ●: experimental result (spherical particle) [27].
5.3.2. Effect of the Particle Aspect Ratio
Figure 11 also shows that the penetration efficiency decreased as the Reynolds number increased, i.e., more particles deposited on the wall in the case with larger Reynolds number. As shown in Figure 8, the particle volume concentration in the viscous sublayer close to the wall increased with increasing the Reynolds number because the stronger turbulent diffusion associated with higher Reynolds number made more particles diffuse to the viscous sublayer, providing the condition for more particle deposition.
5.3.3. Effect of Pipe Length-to-Diameter Ratio
Figure 12 shows the penetration efficiency as a function of the pipe length-to-diameter ratio. It can be seen that the penetration efficiency decreased with increasing the pipe length-to-diameter ratio because the longer pipe was associated with the longer residence time of particles in the pipe. The longer residence time corresponded to a larger probability that particles will deposit on the wall with lower penetration efficiency.
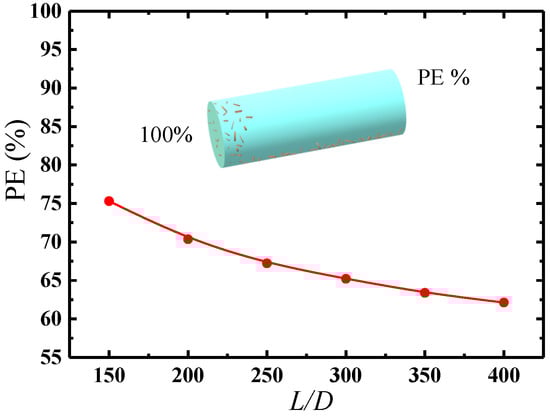
Figure 12.
Penetration efficiency as a function of pipe length-to-diameter ratio (Re = 20,000, λ = 8).
5.3.4. Relationship of Penetration Efficiency and Related Parameters
It is necessary to build a relationship between the penetration efficiency and related parameters in order to effectively characterize the penetration efficiency. As shown in Figure 11 and Figure 12, the penetration efficiency was inversely proportional to the particle aspect ratio λ, the ratio of pipe length to pipe diameter L/D and the Reynolds number (Re = Q/υD, where Q is the flow rate, υ is the fluid viscosity and D is the pipe diameter). So, we combine λ, L/D and Re into a dimensionless synthetic parameter η = D × 109/λLRe. Based on the above numerical data, we could establish the following expression of penetration efficiency PE:
Figure 13 shows the penetration efficiency as a function of the related synthetic parameter.
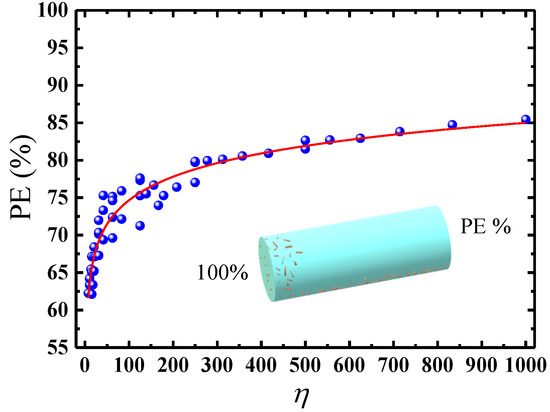
Figure 13.
Penetration efficiency as a function of related synthetic parameter. ●: numerical data and —: expression (15).
6. Conclusions
Transport and deposition of cylindrical nanoparticles in a turbulent pipe flow were studied. The equations of mean momentum and turbulent kinetic energy and turbulent dissipation rate of fluid including the effect of particles were solved together with the mean equations of particle number density and the probability density function for particle orientation including the combined effect of Brownian diffusion and turbulent diffusion. Distributions of particle volume concentration and particle orientation on the cross-section at different axial positions were given and analyzed. The penetration efficiencies for different parameters were calculated and discussed. The main conclusions were summarized as follows:
Distribution of the particle volume concentration on the cross-section becomes non-uniform along the flow direction. The particle volume concentration first decreased and then increased from the pipe center to the wall, and there was a minimum around r/R ≈ 0.95. The particles with uniform distribution of mean orientation angle on the cross-section at inlet will change their orientation angles along the flow direction. The distributions of orientation angle became non-uniform and more and more particles aligned with their major axis near to the flow direction. The particles in the near-wall region were aligned with the flow direction obviously, and only a slight preferential orientation was observed in the vicinity of the pipe’s center.
Distribution of particle volume concentrations becomes more uniform on the cross-section with increasing the particle aspect ratio and Reynolds number. The particles tend to align in the flow direction and this phenomenon becomes more obvious with the increasing particle aspect ratio and with decreasing Reynolds number. The particle orientation distribution is not sensitive to the aspect ratio for the particles with an aspect ratio larger than 5.
The penetration efficiency of cylindrical particles decreased with an increasing particle aspect ratio, Reynolds number and pipe length-to-diameter ratio. Finally, the relationship between the penetration efficiency and related synthetic parameters was established based on the numerical data.
Author Contributions
Conceptualization, J.L. and W.L.; methodology, W.L. and R.S.; software, W.L. and R.S.; validation, R.S. and W.L.; writing, W.L. and R.S.; resources, W.L. and J.L.; review, J.L. All authors have read and agreed to the published version of the manuscript.
Funding
This work was supported by the National Natural Science Foundation of China (Grant no. 91852102).
Institutional Review Board Statement
Not applicable.
Informed Consent Statement
Not applicable.
Conflicts of Interest
There are no conflicts of interest regarding the publication of this paper.
References
- Akshat, T.M.; Misra, S.; Gudiyawar, M.Y.; Salacova, J.; Petru, M. Effect of electrospun nano-particle deposition on ther-mo-physiology of functional clothing. Part. Polym. 2019, 20, 991–1002. [Google Scholar]
- Tian, L.; Ahmadi, G.; Wang, Z.C.; Hopke, P.K. Transport and deposition of ellipsoidal particles in low Reynolds number flows. J. Aerosol Sci. 2012, 45, 1–18. [Google Scholar] [CrossRef]
- Tu, C.; Yin, Z.; Lin, J.; Bao, F. A Review of Experimental Techniques for Measuring Micro- to Nano-Particle-Laden Gas Flows. Appl. Sci. 2017, 7, 120. [Google Scholar] [CrossRef]
- Luo, Y.; Wu, T.-H.; Qi, D. Lattice-Boltzmann lattice-spring simulations of flexibility and inertial effects on deformation and cruising reversal of self-propelled flexible swimming bodies. Comput. Fluids 2017, 155, 89–102. [Google Scholar] [CrossRef]
- Guha, A. A unified Eulerian theory of turbulent deposition to smooth and rough surfaces. J. Aerosol Sci. 1997, 28, 1517–1537. [Google Scholar] [CrossRef]
- Tavakol, M.; Abouali, O.; Yaghoubi, M.; Ahmadi, G. Dispersion and deposition of ellipsoidal particles in a fully developed laminar pipe flow using non-creeping formulations for hydrodynamic forces and torques. Int. J. Multiph. Flow 2015, 75, 54–67. [Google Scholar] [CrossRef]
- Goldenberg, M.; Gallily, I.; Shapiro, M. Deposition of nonspherical particles in turbulent air flows. J. Aerosol Sci. 1990, 21, S105–S108. [Google Scholar] [CrossRef]
- Shapiro, M.; Goldenberg, M. Deposition of glass-particle particles from turbulent air-flow in a pipe. J. Aerosol Sci. 1993, 2, 65–87. [Google Scholar] [CrossRef]
- Podgórski, A.; Gradoń, L.; Grzybowski, P. Theoretical study on deposition of flexible and stiff fibrous aerosol particles on a cylindrical collector. Chem. Eng. J. Biochem. Eng. J. 1995, 58, 109–121. [Google Scholar] [CrossRef]
- Pitton, E.; Marchioli, C.; Lavezzo, V.; Soldati, A.; Toschi, F. Anisotropy in pair dispersion of inertial particles in turbulent channel flow. Phys. Fluids 2012, 24, 073305. [Google Scholar] [CrossRef]
- Tavakol, M.M.; Abouali, O.; Yaghoubi, M.; Ahmadi, G. Stochastic dispersion of ellipsoidal particles in various turbulent fields. J. Aerosol Sci. 2015, 80, 27–44. [Google Scholar] [CrossRef]
- Shachar-Berman, L.; Ostrovski, Y.; De Rosis, A.; Kassinos, S.; Sznitman, J. Transport of ellipsoid particles in oscillatory shear flows: Implications for aerosol deposition in deep airways. Eur. J. Pharm. Sci. 2018, 113, 145–151. [Google Scholar] [CrossRef] [PubMed]
- Lin, J.Z.; Gao, Z.Y.; Zhou, K.; Chan, T.L. Mathematical modeling of turbulent fiber suspension and successive iteration solu-tion in the channel flow. Appl. Math. Modeling 2006, 30, 1010–1020. [Google Scholar] [CrossRef]
- Gillissen, J.J.J.; Boersma, B.J.; Mortensen, P.H. On the performance of the moment approximation for the numerical com-putation of fiber stress in turbulent channel flow. Phys. Fluids 2007, 19, 035102. [Google Scholar] [CrossRef]
- Lin, J.; Zhang, S.; Olson, J.A. Effect of fibers on the flow property of turbulent fiber suspensions in a contraction. Fibers Polym. 2007, 8, 60–65. [Google Scholar] [CrossRef]
- Lin, J.; Shen, S. A theoretical model of turbulent fiber suspension and its application to the channel flow. Sci. China Ser. G Phys. Mech. Astron. 2010, 53, 1659–1670. [Google Scholar] [CrossRef]
- Mackaplow, M.B.; Shaqfeh, E.S.G. A numerical study of the rheological properties of suspensions of rigid, non-Brownian fibres. J. Fluid Mech. 1996, 329, 155. [Google Scholar] [CrossRef]
- Advani, S.G.; Tucker, C.L. The use of tensors to describe and predict particle orientation in short particle composites. J. Rheol. 1987, 31, 751–784. [Google Scholar] [CrossRef]
- Cintra, J.S.; Tucker, C.L. Orthotropic closure approximations for flow-induced particle orientation. J. Rheol. 1995, 39, 1095–1122. [Google Scholar] [CrossRef]
- Folgar, F.; Tucker, C.L., III. Orientation behaviour of fibres in concentrated suspensions. J. Reinf. Plast. Compos. 1984, 3, 98–119. [Google Scholar] [CrossRef]
- Li, G.; Tang, J.X. Diffusion of actin filaments within a thin layer between two walls. Phys. Rev. E 2004, 69, 061921. [Google Scholar] [CrossRef] [PubMed]
- Olson, J.A. The motion of fibres in turbulent flow, stochastic simulation of isotropic homogeneous turbulence. Int. J. Multiph. Flow 2001, 27, 2083–2103. [Google Scholar] [CrossRef]
- Friedlander, S.K.; Marlow, W.H. Smoke, Dust and Haze: Fundamentals of Aerosol Behavior. Phys. Today 1977, 30, 58–59. [Google Scholar] [CrossRef]
- Bernstein, O.; Shapiro, M. Direct determination of the orientation distribution function of cylindrical particles immersed in laminar and turbulent shear flows. J. Aerosol Sci. 1994, 25, 113–136. [Google Scholar] [CrossRef]
- Lin, J.; Yin, Z.; Gan, F.; Yu, M. Penetration efficiency and distribution of aerosol particles in turbulent pipe flow undergoing coagulation and breakage. Int. J. Multiph. Flow 2014, 61, 28–36. [Google Scholar] [CrossRef]
- Krushkal, E.M.; Gallily, I. On the orientation distribution function of non-spherical particles in a general shear flow-ii the turbulent case. J. Aerosol Sci. 1988, 19, 197–211. [Google Scholar] [CrossRef]
- Ghaffarpasand, O.; Drewnick, F.; Hosseiniebalam, F.; Gallavardin, S.; Fachinger, J.; Hassanzadeh, S.; Borrmann, S. Penetra-tion efficiency of nanometer-sized particles in tubes under turbulent flow conditions. J. Aerosol Sci. 2012, 50, 11–25. [Google Scholar] [CrossRef]
Publisher’s Note: MDPI stays neutral with regard to jurisdictional claims in published maps and institutional affiliations. |
© 2021 by the authors. Licensee MDPI, Basel, Switzerland. This article is an open access article distributed under the terms and conditions of the Creative Commons Attribution (CC BY) license (http://creativecommons.org/licenses/by/4.0/).