
A Comparison of Anthropometric and Performance Profiles between Elite and Sub-Elite Hurling Players

 , , and
Abstract
1. Introduction
2. Materials and Methods
2.1. Experimental Approach to the Problem
2.2. Subjects
2.3. Anthropometry
2.4. Performance
2.5. Statistical Analysis
3. Results
3.1. Anthropometric
3.2. Performance
4. Discussion
5. Conclusions
Author Contributions
Funding
Institutional Review Board Statement
Informed Consent Statement
Acknowledgments
Conflicts of Interest
References
- Reilly, T.; Collins, K. Science and the Gaelic sports: Gaelic football and hurling. Eur. J. Sport Sci. 2008, 8, 231–240. [Google Scholar] [CrossRef]
- Young, D.; Beato, M.; Mourot, L.; Coratella, G. Match-Play Temporal and Position-Specific Physical and Physiological Demands of Senior Hurlers. J. Strength Cond. Res. 2020, 34, 1759–1768. [Google Scholar] [CrossRef] [PubMed]
- Malone, S.; Hughes, B.; Reilly, D.K.C.T.; Akubat, I. Methods of Monitoring Training Load and Their Association with Changes Across Fitness Measures in Hurling Players. J. Strength Cond. Res. 2020, 34, 225–234. [Google Scholar] [CrossRef]
- Reilly, D.K.C.T.; McRobert, A.; Morton, J.P.; Sullivan, D.O.; Doran, D.A. The Work-Rate of Elite Hurling Match-Play. J. Strength Cond. Res. 2018, 32, 805–811. [Google Scholar] [CrossRef]
- Young, D.; Coratella, G.; Malone, S.; Collins, K.; Mourot, L.; Beato, M. The match-play sprint performance of elite senior hurlers during competitive games. PLoS ONE 2019, 14, e0215156. [Google Scholar] [CrossRef] [PubMed]
- Mullane, M.; Turner, A.; Bishop, C. Strength and Conditioning Considerations for Hurling. Strength Cond. J. 2018, 40, 72–84. [Google Scholar] [CrossRef]
- Kelly, R.A.; Reilly, D.K.C.T. The Seasonal Variations in Anthropometric and Performance Characteristics of Elite Intercounty Gaelic Football Players. J. Strength Cond. Res. 2018, 32, 3466–3473. [Google Scholar] [CrossRef]
- Shovlin, A.; Roe, M.; Malone, S.; Reilly, D.K.C.T. Positional Anthropometric and Performance Profile of Elite Gaelic Football Players. J. Strength Cond. Res. 2018, 32, 2356–2362. [Google Scholar] [CrossRef]
- Young, D.; Mourot, L.; Coratella, G. Match-play performance comparisons between elite and sub-elite hurling players. Sport Sci. Health 2018, 14, 201–208. [Google Scholar] [CrossRef]
- Reilly, D.K.C.T. Anthropometric and Performance Characteristics of Elite Hurling Players. J. Athl. Enhanc. 2014, 3. [Google Scholar] [CrossRef]
- Doran, D.A.; Donnelly, J.P.; Reilly, T. Kinanthropometric and performance characteristics of Gaelic games players. In Kinanthropometry VIII; Routledge: London, UK, 2003. [Google Scholar]
- Reilly, T.; Doran, D. Science and Gaelic football: A review. J. Sports Sci. 2001, 19, 181–193. [Google Scholar] [CrossRef] [PubMed]
- Doran, D.A.; Mc Geever, S.; Collins, K.D.; Quinn, C.; McElhone, R.; Scott, M. The Validity of Commonly Used Adipose Tissue Body Composition Equations Relative to Dual Energy X-ray Absorptiometry (DXA) in Gaelic Games Players. Int. J. Sports Med. 2013, 35, 95–100. [Google Scholar] [CrossRef] [PubMed]
- McIntyre, M.C. A comparison of the physiological profiles of elite Gaelic footballers, hurlers, and soccer players. Br. J. Sports Med. 2005, 39, 437–439. [Google Scholar] [CrossRef] [PubMed]
- Coneyworth, P.; Ward, N.; Turner, A.N. A field-based fitness testing battery for Rugby League. Prof. Strength Cond. 2012, 25, 4–9. [Google Scholar]
- Brick, N.; O’Donoghue, P. Fitness Profiles of Elite Players in Hurling and Three Football Codes: Soccer, Rugby Union and Gaelic Football. In Science and Football V; Araújo, D., Cabri, J., Reilly, T., Eds.; Routledge: London, UK, 2005; p. 172. [Google Scholar]
- Malone, S.; Hughes, B.; Reilly, D.K.C.T. The Influence of Exercise-to-Rest Ratios on Physical and Physiological Performance during Hurling-Specific Small-Sided Games. J. Strength Cond. Res. 2019, 33, 180–187. [Google Scholar] [CrossRef]
- Thomas, C.; Comfort, P.; Jones, P.A.; Dos’Santos, T. Strength and Conditioning for Netball. Strength Cond. J. 2017, 39, 10–21. [Google Scholar] [CrossRef]
- Bangsbo, J.; Iaia, F.M.; Krustrup, P. The Yo-Yo Intermittent Recovery Test. Sports Med. 2008, 38, 37–51. [Google Scholar] [CrossRef]
- Deprez, D.; Coutts, A.J.; Lenoir, M.; Fransen, J.; Pion, J.; Philippaerts, R.M.; Vaeyens, R. Reliability and validity of the Yo-Yo intermittent recovery test level 1 in young soccer players. J. Sports Sci. 2014, 32, 903–910. [Google Scholar] [CrossRef]
- Reilly, T.; Brooks, G.A. Exercise and the Circadian Variation in Body Temperature Measures. Endoscopy 1986, 7, 358–362. [Google Scholar] [CrossRef]
- Marfell-Jones, M.; Stewart, A.; de Ridder, J. International Standards for Anthropometric Assessment; International Society for the Advancement of Kinanthropometry: Wellington, New Zealand, 2012. [Google Scholar]
- Atkinson, G.; Reilly, T.; Marfell-Jones, M. What is this thing called measurement error? In Kinathropometry VIII, Proceeding of the 8th International Conference of Kinathropometry, Manchester, UK, 19–23 July 2002; Reilly, T., Marfell-Jones, M., Eds.; Routledge: London, UK, 2013; pp. 3–13. [Google Scholar]
- Bosco, C.; Luhtanen, P.; Komi, P. A simple method for measurement of mechanical power in jumping. Eur. J. Appl. Physiol. 1983, 50, 273–282. [Google Scholar] [CrossRef]
- Sayers, S.P.; Harackiewicz, D.V.; Harman, E.A.; Frykman, P.N.; Rosenstein, M.T. Cross-validation of three jump power equations. Med. Sci. Sports Exerc. 1999, 31, 572–577. [Google Scholar] [CrossRef] [PubMed]
- Malone, S.; Hughes, B.; Reilly, D.K.C.T. Are small-sided games an effective training methodology for improving fitness in hurling players? A comparative study of training methodologies. Int. J. Sports Sci. Coach. 2017, 12, 685–694. [Google Scholar] [CrossRef]
- Cohen, J. Statistical Power Analysis for the Behavioral Sciences, 2nd ed.; Lawrence Erlbaum: Mahwah, NJ, USA, 1988. [Google Scholar]
- Davies, R.W.; Toomey, C.M.; Mc Cormack, W.; Hughes, K.; Cremona, A.; Jakeman, P. Body composition analysis of inter-county Gaelic athletic association players measured by dual energy X-ray absorptiometry. J. Sports Sci. 2016, 34, 1015–1020. [Google Scholar] [CrossRef] [PubMed]
- Davies, R.W.; Toomey, C.M.; Mc Cormack, W.; O’Neill, C.; Hughes, K.; Jakeman, P. Seasonal changes in body composition of inter-county Gaelic Athletic Association hurlers. J. Sports Sci. 2016, 35, 2427–2432. [Google Scholar] [CrossRef]
- Bilsborough, J.C.; Greenway, K.; Livingston, S.; Cordy, J.; Coutts, A.J. Changes in Anthropometry, Upper-Body Strength, and Nutrient Intake in Professional Australian Football Players during a Season. Int. J. Sports Physiol. Perform. 2016, 11, 290–300. [Google Scholar] [CrossRef]
- Cullen, B.D.; Cregg, C.J.; Kelly, D.T.; Hughes, S.M.; Daly, P.G.; Moyna, N.M. Fitness Profiling of Elite Level Adolescent Gaelic Football Players. J. Strength Cond. Res. 2013, 27, 2096–2103. [Google Scholar] [CrossRef]
- Ackland, T.; Lohman, T.G.; Sundgot-Borgen, J.; Maughan, R.J.; Meyer, N.L.; Stewart, A.D.; Müller, W. Current Status of Body Composition Assessment in Sport. Sports Med. 2012, 42, 227–249. [Google Scholar] [CrossRef]
- Suchomel, T.J.; Nimphius, S.; Stone, M.H. The Importance of Muscular Strength in Athletic Performance. Sports Med. 2016, 46, 1419–1449. [Google Scholar] [CrossRef]
- Malone, S.; Hughes, B.; Doran, D.A.; Reilly, D.K.C.T.; Gabbett, T.J. Can the workload–injury relationship be moderated by improved strength, speed and repeated-sprint qualities? J. Sci. Med. Sport 2019, 22, 29–34. [Google Scholar] [CrossRef]
- Gabbett, T.J. The training-injury prevention paradox: Should athletes be training smarter and harder? Br. J. Sports Med. 2016, 50, 273–280. [Google Scholar] [CrossRef]
- Durandt, J.; Tee, J.; Prim, S.K.; Lambert, M. Physical Fitness Components Associated with Performance in a Multiple-Sprint Test. Int. J. Sports Physiol. Perform. 2006, 1, 150–160. [Google Scholar] [CrossRef] [PubMed]
- Sirotic, A.C.; Coutts, A.J. Physiological and performance test correlates of prolonged, high-intensity, inter-mittent running performance in moderately trained women team sport athletes. J. Strength Cond. Res. 2007, 21, 138–144. [Google Scholar] [CrossRef] [PubMed]
- Veale, J.P.; Pearce, A.J.; Carlson, J.S. The Yo-Yo Intermittent Recovery Test (Level 1) to discriminate elite junior Australian football players. J. Sci. Med. Sport 2010, 13, 329–331. [Google Scholar] [CrossRef]
- Muñoz, C.S.; Molina, J.J.M.; Cañas, J.; Courel-Ibáñez, J.; Sánchez-Alcaraz, B.J.; Zabala, M. Anthropometric and Physical Fitness Profiles of World-Class Male Padel Players. Int. J. Environ. Res. Public Health 2020, 17, 508. [Google Scholar] [CrossRef] [PubMed]
- Schousboe, J.T.; Shepherd, J.A.; Bilezikian, J.P.; Baim, S. Executive Summary of the 2013 International Society for Clinical Densitometry Position Development Conference on Bone Densitometry. J. Clin. Densitom. 2013, 16, 455–466. [Google Scholar] [CrossRef]


| Anthropometric Characteristics | Level | Full-Back | Half-Back | Midfield | Half-Forward | Full-Forward |
|---|---|---|---|---|---|---|
| Height (cm) | Elite | 179.6 ± 3.7 (176.4, 182.7) | 183.7 ± 5.9 (180.8, 186.6) | 183.5 ± 4.4 (180.2, 186.8) | 181.8 ± 6.3 (179.0, 184.6) | 180.7 ± 5.5 (177.8, 183.6) |
| Sub-elite | 182.0 ± 6.4 (179.1, 184.9) c | 182.0 ± 4.1 (179.6, 184.5) c | 187.8 ± 6.3 (185.0, 190.6) abde | 180.6 ± 4.8 (178.0, 183.1) c | 180.7 ± 5.1 (177.9, 183.5) c | |
| Body mass (kg) | Elite | 84.1 ± 6.7 (80.1, 88.1) | 86.2 ± 4.1 (82.6, 89.9) * | 88.2 ± 4.4 (84.0, 92.3) | 81.6 ± 5.8 (78.1, 85.1) | 87.5 ± 8.6 (83.9, 91.2) |
| Sub-elite | 80.4 ± 7.5 (76.8, 84.1) | 81.2 ± 5.6 (78.1, 84.3) | 85.8 ± 8.9 (82.2, 89.3) d | 78.7 ± 6.6 (75.5, 81.9) c | 83.7 ± 6.6 (80.2, 87.3) | |
| Sum of 7 skinfolds (mm) | Elite | 50.7 ± 8.7 (41.4, 60.1) * | 54.6 ± 16.0 (46.0, 63.2) ** | 52.1 ± 8.3 (42.2, 61.9) * | 49.1 ± 8.3 (40.8, 57.4) ** | 55.4 ± 18.4 (46.7, 64.0) ** |
| Sub-elite | 71.3 ± 15.0 (62.7, 80.0) b | 91.2 ± 25.4 (83.9, 98.5) ac | 66.3 ± 13.1 (58.0, 74.6) bde | 85.2 ± 15.2 (77.7, 92.7) c | 84.0 ± 13.4 (75.7, 92.3) c | |
| Adiposity (%AT) | Elite | 9.7 ± 1.0 (8.6, 10.7) | 10.0 ± 2.3 (9.0, 11.0) ** | 9.8 ± 1.2 (8.7, 10.9) | 9.3 ± 1.6 (8.4, 10.2) ** | 9.8 ± 1.8 (8.9, 10.8) ** |
| Sub-elite | 11.1 ± 1.4 (10.1, 12.0) | 12.7 ± 2.7 (11.9, 13.5) c | 10.8 ± 1.4 (9.9. 11.8) b | 12.5 ± 1.8 (11.7, 13.4) | 12.2 ± 1.1 (11.3, 13.1) | |
| Fat-free mass (kg) | Elite | 75.9 ± 5.6 (72.2, 79.6) | 77.6 ± 4.5 (74.2, 81.0) * | 79.5 ± 4.2 (75.7, 83.4) | 74.0 ± 5.4 (70.7, 77.3) * | 79.0 ± 8.1 (75.6, 82.4) * |
| Sub-elite | 71.5 ± 6.5 (68.1, 74.9) | 70.9 ± 5.3 (68.0, 73.8) | 76.6 ± 8.7 (73.3, 79.8) d | 68.9 ± 6.0 (65.9, 71.8) c | 73.6 ± 6.0 (70.3, 76.8) | |
| Performance Characteristics | ||||||
| CMJ height (cm) | Elite | 45.1 ± 5.1 (41.0, 49.2) ** | 43.5 ± 4.0 (39.8, 47.3) ** | 45.0 ± 3.7 (40.7, 49.3) ** | 42.2 ± 4.4 (38.6, 45.8) ** | 43.6 ± 7.8 (39.9, 47.4) ** |
| Sub-elite | 27.9 ± 7.8 (24.2, 31.7) | 31.3 ± 6.1 (28.1, 34.5) | 30.2 ± 9.7 (26.6, 33.9) | 29.7 ± 7.5 (26.4, 32.9) | 30.0 ± 8.4 (26.4, 33.7) | |
| CMJ PP (W) | Elite | 4492 ± 416 (4197, 4787) ** | 4494 ± 270 (4222, 4765) ** | 4673 ± 370 (4363, 4983) ** | 4199 ± 267 (3937, 4460) ** | 4559 ± 753 (4287, 4830) ** |
| Sub-elite | 3284 ± 535 (3012, 3555) | 3524 ± 386 (3293, 3755) | 3666 ± 654 (3404, 3928) | 3311 ± 552 (3073, 3548) | 3561 ± 490 (3299, 3823) | |
| CMJ RPP (W·kg−1) | Elite | 53.5 ± 3.8 (50.5, 56.4) ** | 52.2 ± 2.9 (49.4, 54.9) ** | 53.0 ± 2.4 (49.9, 56.1) ** | 51.6 ± 3.5 (49.0, 54.2) ** | 51.9 ± 5.4 (49.2, 54.6) ** |
| Sub-elite | 40.9 ± 5.7 (38.2, 43.6) | 43.4 ± 4.4 (41.1, 45.7) | 42.8 ± 6.5 (40.2, 45.4) | 42.0 ± 6.0 (39.6, 44.4) | 42.7 ± 5.9 (40.0, 46.3) | |
| Acceleration—5 m (s) | Elite | 1.10 ± 0.06 (0.96, 1.23) | 1.09 ± 0.04 (0.97, 1.21) * | 1.11 ± 0.09 (0.96, 1.25) | 1.08 ± 0.09 (0.96, 1.20) | 1.11 ± 0.11 (0.98, 1.23) |
| Sub-elite | 1.21 ± 0.30 (1.08, 1.33) | 1.29 ± 0.32 (1.18, 1.39) | 1.19 ± 0.32 (1.07, 1.31) | 1.14 ± 0.25 (1.03, 1.25) | 1.22 ± 0.29 (1.10, 1.34) | |
| Acceleration—10 m (s) | Elite | 1.81 ± 0.05 (1.67, 1.95) | 1.83 ± 0.07 (1.70, 1.96) * | 1.84 ± 0.08 (1.69, 1.98) | 1.82 ± 0.05 (1.70, 1.95) | 1.84 ± 0.05 (1.71, 1.96) |
| Sub-elite | 1.93 ± 0.30 (1.80, 2.06) | 2.02 ± 0.32 (1.91, 2.13) | 1.91 ± 0.32 (1.79, 2.04) | 1.91 ± 0.28 (1.79, 2.02) | 1.95 ± 0.33 (1.82, 2.07) | |
| Acceleration—20 m (s) | Elite | 3.08 ± 0.12 (2.93, 3.22) | 3.13 ± 0.08 (2.99, 3.26) * | 3.14 ± 0.14 (2.99, 3.29) | 3.11 ± 0.09 (2.98, 3.24) | 3.10 ± 0.10 (2.97, 3.23) |
| Sub-elite | 3.20 ± 0.29 (3.06, 3.33) | 3.34 ± 0.32 (3.22, 3.45) | 3.18 ± 0.34 (3.05, 3.31) | 3.19 ± 0.30 (3.07, 3.31) | 3.20 ± 0.31 (3.07, 3.32) | |
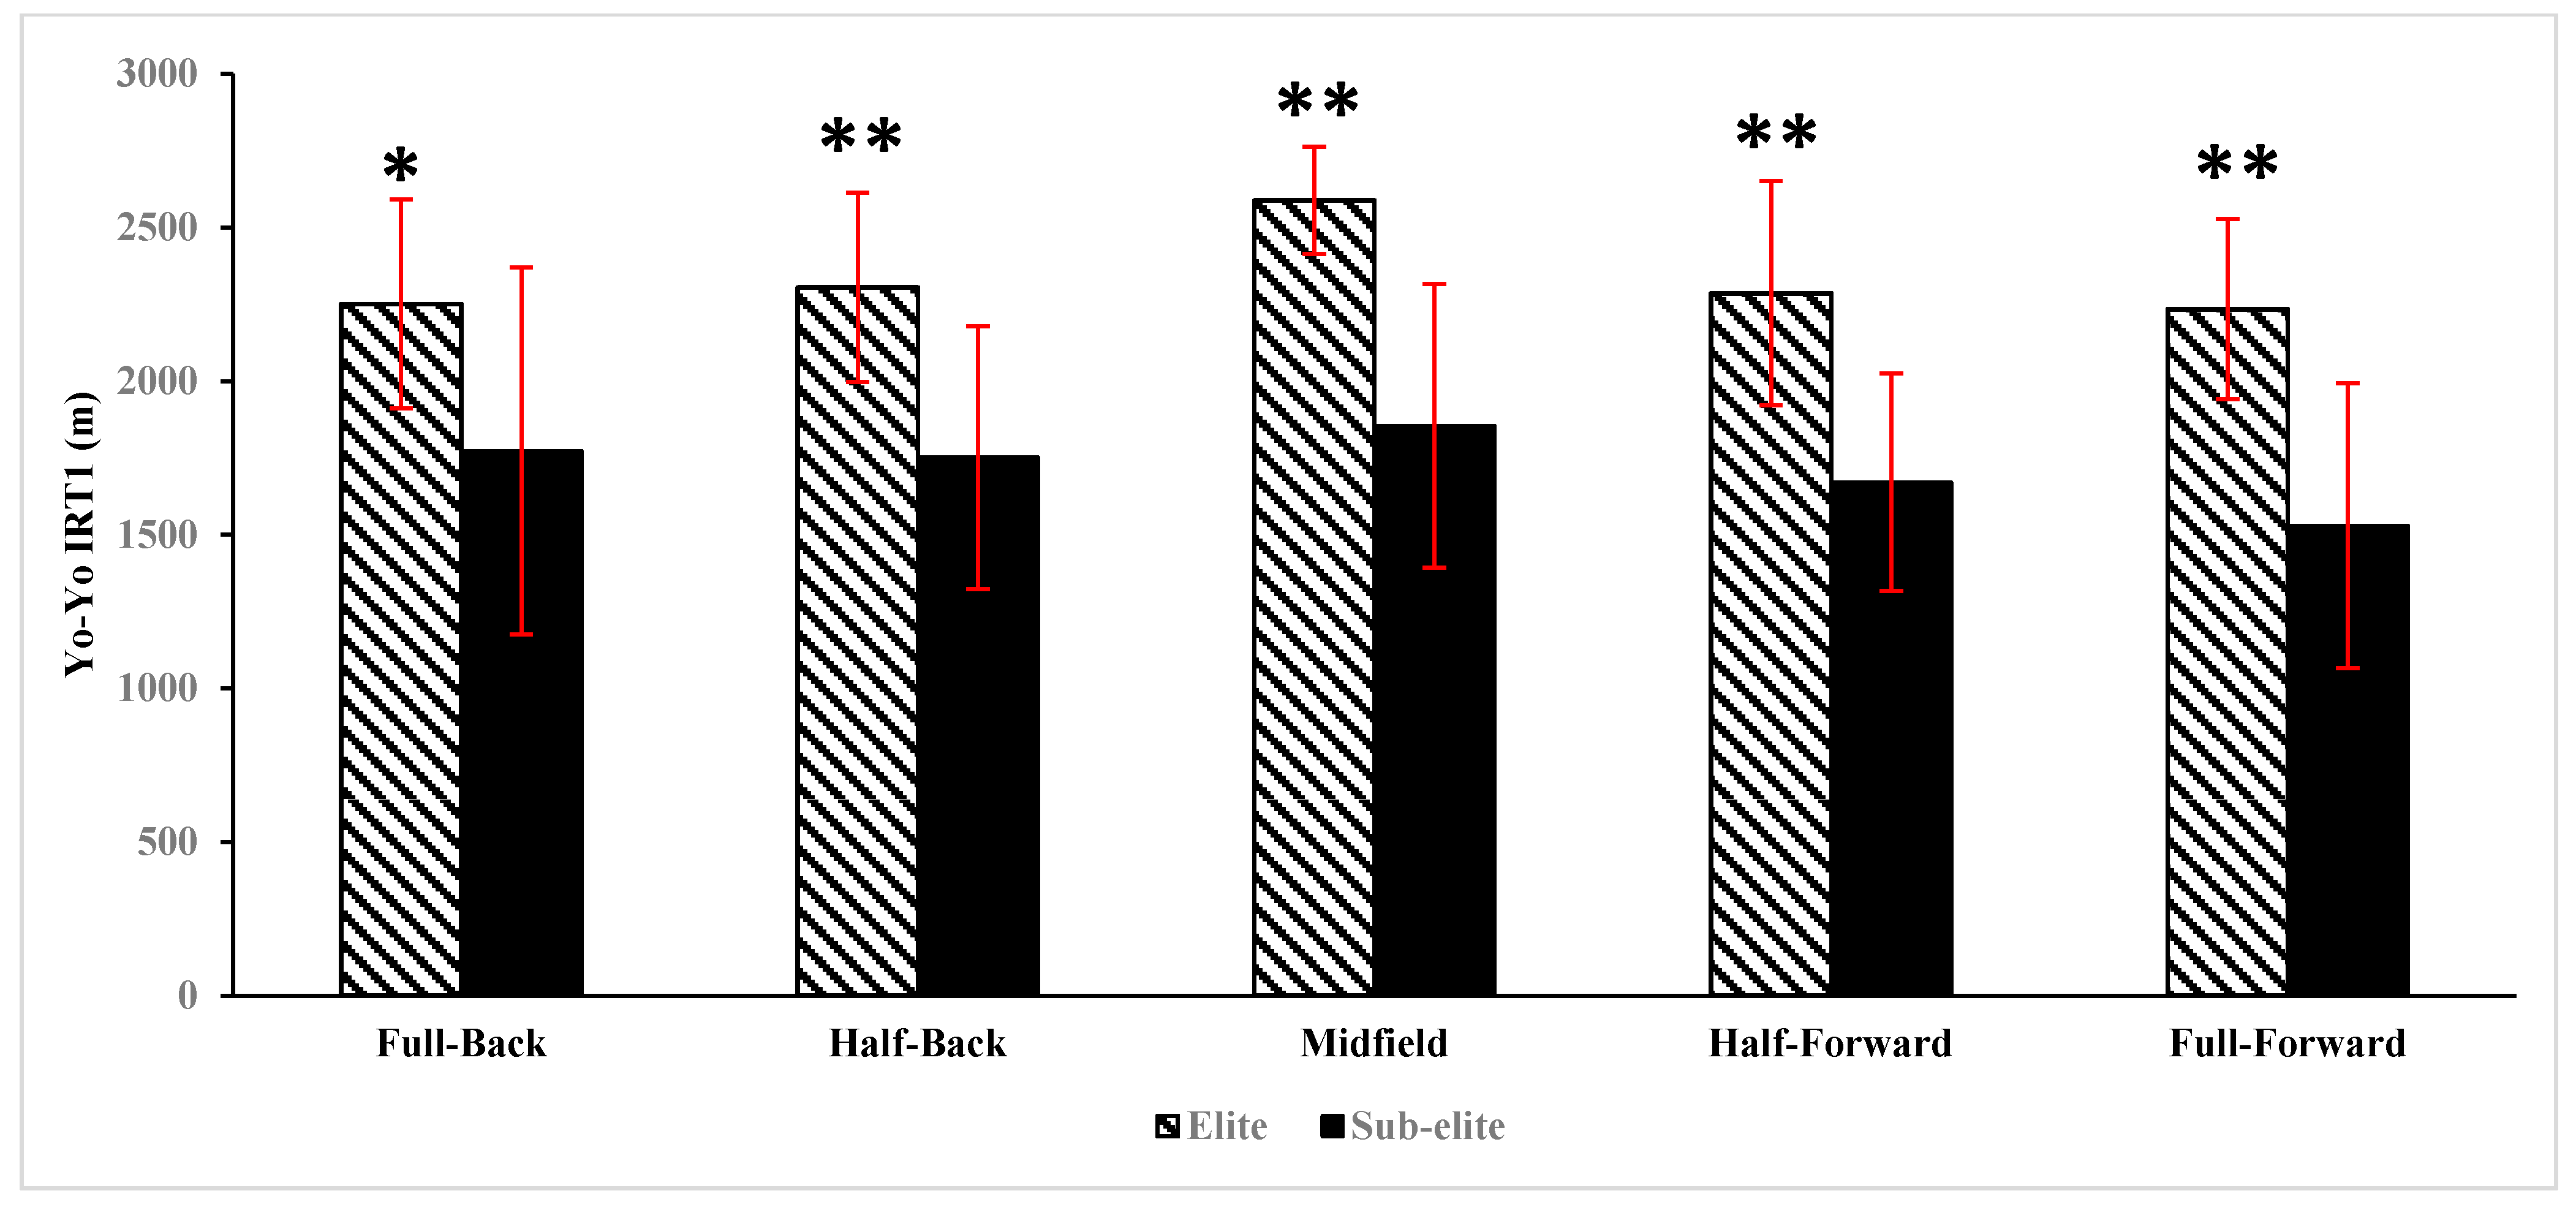
| Yo-Yo IRT1 (m) | Elite | 2251 ± 339 (2013, 2489) * | 2305 ± 308 (2085, 2524) ** | 2588 ± 174 (2338, 2838) ** | 2286 ± 364 (2075, 2497) ** | 2234 ± 293 (2015, 2453) ** |
| Sub-elite | 1772 ± 597 (1553, 1991) | 1751 ± 427 (1565, 1937) | 1854 ± 461 (1643, 2065) | 1671 ± 354 (1479, 1862) | 1529 ± 464 (1317, 1740) |
Publisher’s Note: MDPI stays neutral with regard to jurisdictional claims in published maps and institutional affiliations. |
© 2021 by the authors. Licensee MDPI, Basel, Switzerland. This article is an open access article distributed under the terms and conditions of the Creative Commons Attribution (CC BY) license (http://creativecommons.org/licenses/by/4.0/).
Share and Cite
Keane, J.; Malone, S.; Keogh, C.; Young, D.; Coratella, G.; Collins, K. A Comparison of Anthropometric and Performance Profiles between Elite and Sub-Elite Hurling Players. Appl. Sci. 2021, 11, 954. https://doi.org/10.3390/app11030954
Keane J, Malone S, Keogh C, Young D, Coratella G, Collins K. A Comparison of Anthropometric and Performance Profiles between Elite and Sub-Elite Hurling Players. Applied Sciences. 2021; 11(3):954. https://doi.org/10.3390/app11030954
Chicago/Turabian StyleKeane, John, Shane Malone, Ciarán Keogh, Damien Young, Giuseppe Coratella, and Kieran Collins. 2021. "A Comparison of Anthropometric and Performance Profiles between Elite and Sub-Elite Hurling Players" Applied Sciences 11, no. 3: 954. https://doi.org/10.3390/app11030954
APA StyleKeane, J., Malone, S., Keogh, C., Young, D., Coratella, G., & Collins, K. (2021). A Comparison of Anthropometric and Performance Profiles between Elite and Sub-Elite Hurling Players. Applied Sciences, 11(3), 954. https://doi.org/10.3390/app11030954