Article

Sub/Super-Synchronous Oscillation Oriented Dominant Controller Parameters Stability Region Based on Gerschgorin Disk Theorem

1
School of Electrical Engineering and Automation, Wuhan University, Wuhan 430072, China
2
State Grid Jinhua Electric Power Company, Jinhua 321000, China
3
Southern Power Grid Guangzhou Electric Power Company, Guangzhou 510060, China
4
Power Grid Engineering Corporation, Central Southern China Electric Power Design Institute, Wuhan 430071, China
5
Hubei Electric Power Research Institute of State Grid, Wuhan 430077, China
*
Author to whom correspondence should be addressed.
Appl. Sci. 2021, 11(3), 1205; https://doi.org/10.3390/app11031205
Submission received: 21 December 2020 / Revised: 22 January 2021 / Accepted: 25 January 2021 / Published: 28 January 2021
(This article belongs to the Special Issue Future Distribution Network Solutions)

Abstract

:
Since the development of renewable power generation, Sub/Super-Synchronous Control Interac-tion (SSCI), has attracted wide attention. Sub/super-synchronous oscillation (SSO) belongs to the category of small signal stability, and its characteristics are closely related to the operation mode and controller parameters in power grid. The operation mode of renewable power system changes frequently, a method to construct controller parameter stability region (PSR) is proposed for online assessment of the matching degree of controller parameters in power grid under current operation mode. Based on Gerschgorin disk theorem (GDT), eigenvalue distribution range of the system state matrix is estimated, thus the feasible value set of the controller parameter is deduced through small signal stability criterion. The stability margin evaluation index is proposed for guiding the prevention and control of SSO. Specifically, the preconditions of the application of the GDT on the PSR construction are discussed, and a construction method of transition matrix is proposed for the PSR construction. Furthermore, to reduce the conservativeness of PSR, an extension method for PSR is given. Finally, the validity of the proposed method is verified by a realistic benchmark. The efficiency of the proposed method is highlighted by comparing with the point-wise eigenvalue calculation of the state matrix.

1. Introduction

The generator shafting damage accidents in Mohave Power Plant, which were reported in the 1970s, caused people to pay attention to the Sub-synchronous Oscillation (SSO) issue, which is mainly caused by the unreasonable series compensation capacitance of the transmission lines. In recent years, with the global development of renewable power generation and integration technology, because the support of relevant national policies, the stability issue caused by the grid-connected operation of renewable power station further extends the connotation from Sub-synchronous Oscillation (SSO) to Sub/super-synchronous Oscillation (SSO). The analysis results show that the converter control systems of renewable power generation units and direct current transmission or distribution systems have significant impacts on the oscillation phenomenon [1,2]. At the same time, the oscillation has no connection with the torsional oscillation of shafting. This kind of SSO phenomenon is called Sub-synchronous Control Interaction (SSCI) [3,4,5].
The research directions of the existing journal articles are mainly focused on modeling and monitoring analysis, stability analysis of the renewable power system, and controller design for SSCI research [6,7,8]. Frequency and damping are the key parameters from a system stability point of view. Prony, Hankel total least squares, eigen realization, and matrix pencil are four commonly used time-domain parametric methods to determine the modal parameters in online and offline environments [6]. The term “frequency scan analysis” has been widely used in the industry to evaluate the risk of SSCI in any system. However, the frequency scan is only suitable for SSCI analysis at the planning stage or during the expansion of generation or transmission projects [7]. The Nyquist and reactance-crossover analysis methods can provide information (e.g., frequency and damping) on the unstable oscillation modes. Nonetheless, these methods are unable to provide critical insight into the interaction phenomenon, such as the origin and path of oscillation, and the participation level of certain system components [7]. Such information is critical to properly assess the risk of SSCI and devise effective risk alleviation or mitigation strategies [9]. Stability analysis based on precise models of impedance networks is also partially studied [10]. The impedance method has obvious advantages in system modeling, which can be identified by external characteristics without the need for internal parameters of equipment. In addition, the impedance model is connected according to a topological structure and has a clear physical explanation, which is conducive to mechanism research. However, the impedance model of the whole power system including both the renewable power base and HVDC transmission system under different operation statuses is still in the research and development stage. The whole-system impedance model under different operation statuses is the foundation for the analysis of the interactions between controllers in a renewable power base (source side) and an HVDC transmission system (grid side) on the studied SSO/SupSO modes. Aiming at the SSCI issue, [11] proposes that the mismatch of controller parameters among different controllers which are located on the power generation side and power grid side may induce SSCI issues, and damping coupling exists among oscillation modes. It is necessary to optimize the controller parameters or establish the parameter stability region (PSR) to evaluate the rationality and match degree of the control parameter set.
One the one hand, although parameter optimization [12] can improve system stability, this technique is usually used offline due to its high computational complexity; in particular, a large eigenvalue-calculation-duration parameter optimization. On the other hand, the stability region technique can be applied online to quickly and intuitively judge the system operation status, providing guidance for the reasonable selection of parameters and refreshing controller parameters according to the current operation mode. Considering variable operation modes of renewable power grids, the stability region technique is highly effective for the prevention and control of the SSO issue caused by the mismatch of parameters between the power generation side and grid side controllers or between power generation side controllers and power networks. However, due to the high dimension of the state matrix of whole renewable power systems, the PSR is hard to form rapidly for online evaluation based on the point-wise method because of the time-consuming eigenvalue calculation.
At present, there is little research on the establishment of the SSO-oriented dominant control PSR. Aiming at the dilemma of PSR online construction based on point-wise accurate eigenvalue calculation, an estimation method of eigenvalues’ distribution range based on Gerschgorin disk theorem (GDT) offers a practicable direction. In the field of control engineering, the sufficient conditions for the dynamic system stability are deduced by combining Lyapunov stability theory and GDT in the literature [13,14,15]. This process can avoid eigenvalue calculation and improve analysis efficiency. Reference [16] exerts the above idea into the small signal stability analysis of the power system further, in which the basic disk theorem is used only for the fast verification of parameter adjustment schemes, without proposing the concept of PSR. According to [17], the extended disk theorem is utilized to establish the PSR for harmonic resonance and high-frequency wide-band oscillation prevention. Compared with the point-wise eigenvalue calculation method, that the rapidity of constructing harmonic PSR by using the extended disk theorem, and the simplicity without eigenvalues calculations, are highlighted. However, the possibility of the online prevention and control of SSO still needs further investigation and research.
Aiming at the prevention and control of the SSO issue in a renewable power grid, and rapid online assessment of the controller parameters’ matching degree between power generation and grid under the current operation mode, a novel method to construct controller PSR is proposed in Section 2. Based on GDT, the eigenvalue distribution range of the system state matrix containing controller parameter variables is rapidly estimated, instead of the time-consuming direct calculation of eigenvalues, and then the PSR is deduced according to the small signal stability criterion and corresponding stability constraints on the obtained eigenvalue distribution range. On the basis of PSR, the stability margin evaluation index is proposed to rapidly evaluate the distance between the controller parameter set and the boundary of the PSR, providing guidance for the reasonable selection and online refreshing of the controller parameters under the current operation mode for the prevention and control of SSO, so as to secure the safe and stable operation of the high-proportion renewable power grid. Specifically, the preconditions of the application of the GDT on the PSR construction are discussed in detail, and a construction method for the transition matrix based on the system state matrix is proposed in Section 3. The transition matrix is used for the PSR construction instead of applying the system state matrix directly, to overcome its limitations. Furthermore, to reduce the conservativeness of the PSR, a method for extending the PSR is also given. The efficiency of the proposed method is highlighted by comparing the proposed method and the point-wise eigenvalue calculation of the state matrix from a time-consuming perspective in Section 4, which demonstrates its potential for online application.

2. A Method of Parameter Stability Region Construction and Stability Margin Evaluation Based on Gerschgorin Disk Theorem

2.1. Gerschgorin Disk Theorem

The definition of Gerschgorin disk [18]
A = ( a i j ) n × n
R i = j = 1 j i n | a i j | = | a i 1 | + + | a i ( i 1 ) | + | a i ( i + 1 ) | + + | a i n | ( i = 1 , 2 , , n )
The circular regions on a complex plane, shown as (1) in the following, are named after the i-th Gerschgorin disk of the matrix A, and Ri is the radius of Gerschgorin disk Gi. Gerschgorin disk theorem can be illustrated in Figure 1.
G i = { z | | z a i i | R i , z C } ( i = 1 , 2 , , n )
As Figure 1 shows, each Gerschgorin disk means the possible location of the corresponding eigenvalue of the matrix A = ( a i j ) n × n . The center of the i-th disk is the diagonal element aii; its radius is the sum of the modulus of the non-diagonal elements in i-th row, which can be calculated as Equation (1).
Gerschgorin Disk Theorem:
The n eigenvalues of the matrix ACn×n locate in the union of relevant n Gerschgorin disks. λi ∈∪ Gi, λi is the i-th eigenvalue of the matrix A, where I = 1, ⋯, n. Abbreviate this as the disk theorem.

2.2. Parameter Stability Region Construction Method

Once the system state matrix is obtained by linearizing operation according to its current operation mode, and the elements of the state matrix, especially the diagonal elements, are functions of the parameters of the controllers that dominate the dynamic characteristics. To ensure the rapid construction of PSR, a novel method is proposed. Based on GDT, the eigenvalue distribution range of the system state matrix containing controller parameter variables is rapidly estimated, substituting direct eigenvalue calculation. Then, the feasible range of the controller parameters is backward-deduced according to the small signal stability criterion; thus, the stability region of controller parameters is obtained.
According to Lyapunov stability condition [13] for small signal stability, the system is stable when all eigenvalues of the state matrix are on the left side of the imaginary axis. When all disks of the state matrix, which encircle all eigenvalues, are on the left side of the imaginary axis, the corresponding system obviously satisfies the Lyapunov stability condition. Therefore, if the elements of the state matrix are functions of the controller parameters, the stability constraints of the parameters can be obtained according to the positions and distance between the Gerschgorin disk corresponding to the parameter-containing state matrix and the imaginary axis of the complex plane, that is, the corresponding stability region of the controller parameters can be backward-deduced via the intersection of the stability constraints of the parameters.
Specifically, the following two stability conditions are required to construct the PSR according to GDT. Firstly, the centers of Gerschgorin disks of state matrix A are all located in the left side of the imaginary axis. Secondly, the distances between the centers of the Gerschgorin disks and the imaginary axis are larger than their corresponding radiuses of the Gerschgorin disks. Supposing that the matrix element is a function of the parameter x, then the stability constraints are shown in the following
{ Re ( a i i ( x ) ) < 0 R i ( x ) | Re ( a i i ( x ) ) | , ( i = 1 , 2 , , n )
where Re means taking the real part, aii is the i-th diagonal element of matrix A and the corresponding center of the Gerschgorin disk, n is the dimension of the matrix.
It is worth noting that this method to construct the PSR is relatively conservative because Equation (4) is a sufficient condition for stability rather than a necessary and sufficient condition. Therefore, an extension method of the PSR is introduced in the following to reduce the conservatism of the PSR.
The boundary points of the PSR in the direction of the focused parameter extension are selected to re-form the eigenvector matrix, and the extended PSR can be obtained by repeating the formation process of the PSR mentioned above and then superposing all the PSRs. Obviously, the conservativeness of the PSR can be reduced by expanding the PSR several times, forming the extended PSR. As computational complexity also increases correspondingly, the conservatism and the computational complexity of the PSR need to be balanced for practical online application.

2.3. Stability Margin Evaluation Indexes

Once a PSR is obtained, the stability margin evaluation indexes of controller parameters for SSO prevention and control are proposed as follows
F ( X ) = ( s = 1 K d s ) / d b
d s = | a s 1 X 1 + a s 2 X 2 + + a s n X n + b s | a s 1 2 + a s 2 2 + + a s n 2
where s = 1~K represents the s-th fitting hyperplane that constitutes the PSR, respectively, and its hyperplane expression is a s 1 X 1 + a s 2 X 2 + + a s n X n + b s = 0 , X = (X1, … Xn) are the dominant controller parameters of the PSR. ds is the distance from the operating point of the dominant controller parameter set to the s-th fitting hyperplane. db is used as the evaluation benchmark of other parameter points. For the PSR, db is the value of Σ s = 1 K d s calculated at the parameter equilibrium point (the controller parameters when starting PSR construction).
If the parameter set is inside the PSR, then the closer the controller parameters are to the center of the PSR, the greater the index is, and the closer to the PSR boundary, the smaller the index is. If the index F is greater than 1, it shows that the parameter set is farther away from the boundary, and when the index F is less than 1, it shows that the parameter set is closer to the boundary, and system small signal stability decreases, so as to provide guidance for the reasonable selection and online refreshing of the controller parameters according to the current operation mode, fulfilling the prevention and control of SSO, thus securing the safe and stable operation of the high-proportion renewable power grid.

3. Preconditions of Gerschgorin Disk Theorem’s Application on Parameter Stability Region and the Construction Method of Transition Matrix

Based on the analysis in Section 2, the GDT guarantees that the eigenvalues of a matrix are located in the disks corresponding to the matrix, and the PSR can be constructed based on the stability constraints on the Gerschgorin disks. However, according to the stability constraints during PSR construction, the centers of the Gerschgorin disks must be on the left side of the imaginary axis, that is, the diagonal elements of the system state matrix must be negative, which is a tough condition and is hardly satisfied in the normal operation of the actual power system. To meet the above requirements and increase the feasibility of online rapid construction of the PSR, a method to structure the transition matrix is proposed, and the approach to construct the PSR with system transition matrix containing parameter variables instead of the system state matrix is given.
The detailed procedure is as follows.
Assuming that under the initial value of the parameter set (a0, b0), the state matrix is A0. The eigenvalues and eigenvectors of the matrix are calculated once, and the eigenvalue diagonal matrix is recorded as D0 and the right eigenvector matrix is recorded as P; D0 and P are known.
When the parameter set changes (denoted as (a, b)), the eigenvalue diagonal matrix D of the new state matrix A is as follows
D = [ λ 1 λ 2 λ n ]
where λ 1 λ n are eigenvalues ( λ 1 λ n are unknown) of the matrix A, the right eigenvector matrix is recorded as X, X = [ x 1 , x 2 , , x n ] (which is unknown), and xi is a column vector.
For the matrix A, there are the following relations
A · [ x 1 , x n ] = [ x 1 , x n ] · D
i.e.,
A = [ x 1 , x n ] · D · [ x 1 , x n ] 1
The matrix A is multiplied by P−1 on the left and then by P on the right.
P 1 AP = P 1 [ x 1 , x n ] · D · [ x 1 , x n ] 1 P = B
Let P 1 = [ x 1 , x n ] 1 P , which means the matrix B can also be expressed as B = P 1 1 D P 1 , and B is named after the transition matrix.
The right eigenvector matrix X is equal to P at the initial set of parameters (a0, b0), and, currently, P1 is a unit diagonal matrix. The eigenvalues of B are equal to A, thus B is exactly the eigenvalue diagonal matrix of A.
It is worth noting that, on the one hand, A is stable in the neighborhood of the initial set of parameters, which means its eigenvalues λ 1 λ n are all non-negative, but the diagonal elements of A may still exist non-negative elements; thus, the preconditions for applying GDT to the PSR construction cannot be satisfied. However, matrix B at the initial parameters is the same as the eigenvalue diagonal matrix D of matrix A, the Gerschgorin disks of B are distributed as a set of points, the radius of each disk is 0 and the center of each disk is the eigenvalue. In the neighborhood of the initial parameter set, the eigenvalues of A vary, and B is approximately equal to the diagonal matrix of the eigenvalues of A. As long as system A is stable, the eigenvalues of A are all negative; in other words, the diagonal elements of the B matrix are negative, satisfying the precondition for the application of GDT to structure PSR. On the other hand, it can be further proved that the eigenvalues of A are located in the disks of B in the neighborhood of the initial parameter set; thus, the disks of B can be used to constrain the eigenvalues of A. Therefore, when the disks of B are located on the left side of the imaginary axis, the eigenvalues of A are also located on the left side of the imaginary axis. In consequence, the PSR can be constructed via the method in Section 2 by replacing state matrix A with the corresponding system transition matrix B containing parameter variables.
Although there is one more eigenvalue calculation used to apply system transition matrix B for the PSR construction compared with the state matrix, the unsatisfied precondition that the diagonal elements of the initial system state matrix A must be negative is eliminated, and the application scope of the PSR construct method is expanded. The superiority of the computational efficiency of the proposed method, compared with the point-wise eigenvalue calculation to construct PSR, increases its potential for online application to prevent and control SSO issues.

4. Case Study of the Construction of the Sub/Super-Synchronous Oscillation-Oriented Dominant Controller Parameters Stability Region

4.1. Case Introduction and Analysis of Dominant Controller Parameters

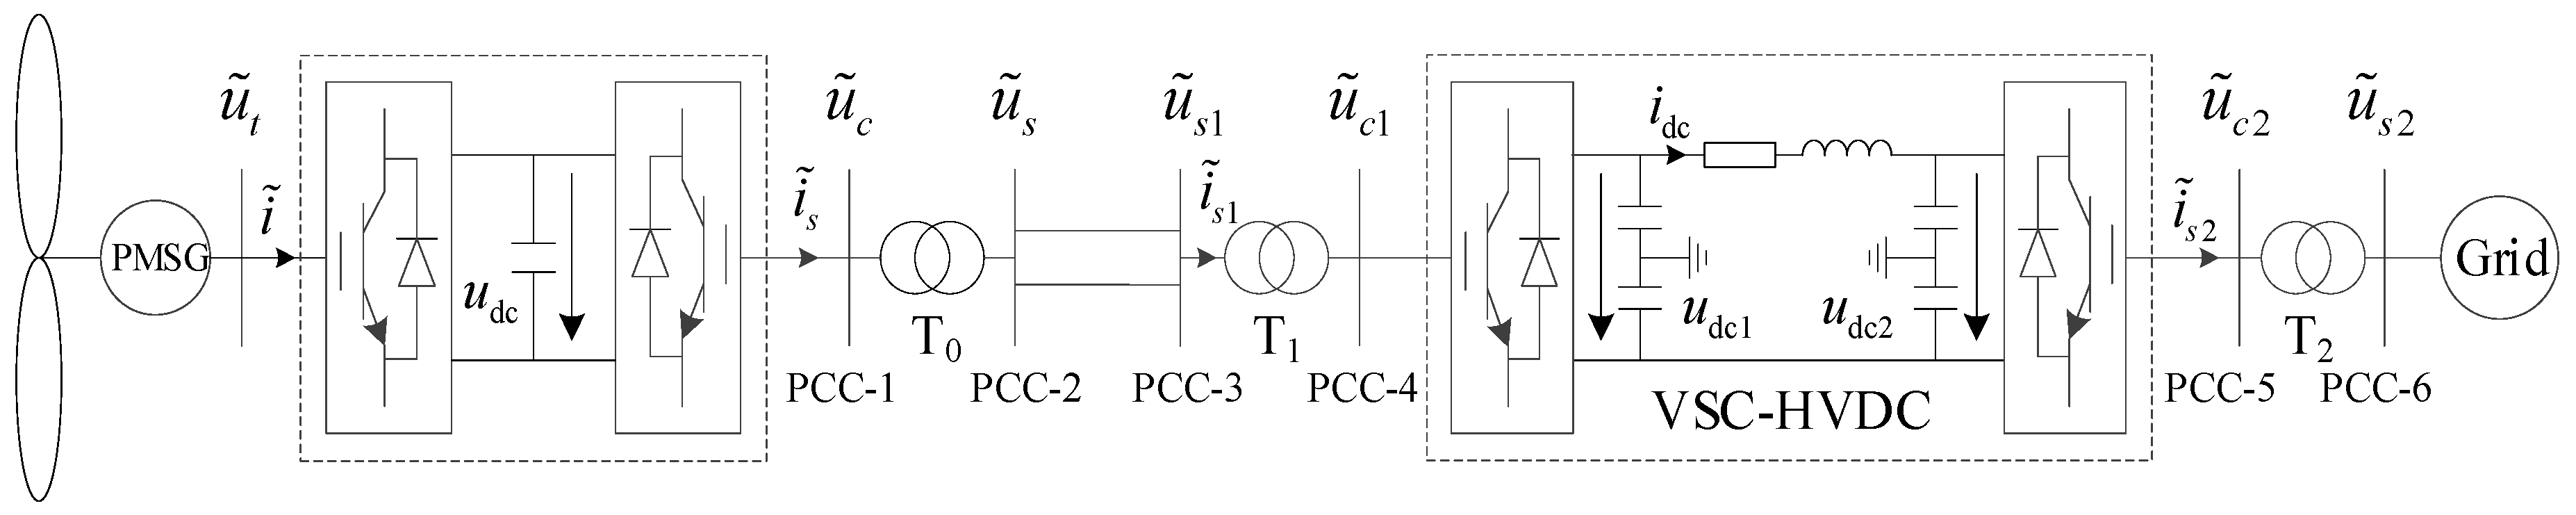
A Drive Permanent Magnet Synchronous Generator (D-PMSG) via Voltage Source Converter-based High-Voltage Direct Current (VSC-HVDC) renewable power grid is used as the benchmark. Its topology is shown in Figure 2. The simplified model is representative of a collection of multiple renewable power plants into a base and then through the HVDC transmission system, in order to illustrate the application and value of the proposed method.
In this benchmark, the operating parameters and controller parameters are set as follows.
In this paper, a “0.69 kV, 12 MW” D-PMSG is used to represent the D-PMSG-based wind farm. The parameters of D-PMSG, VSC-HVDC and their detailed derivation process are referred to [11]. Wind speed is 12 m/s; pitch angle β is 0. The machine side controller (MSC) d-axis reference current id_ref is 0; the grid side controller (GSC) reactive power reference value Qs_ref is 0; the DC voltage reference value udc_ref is 1.0 p.u. The reactive power reference value of sending end controller (SEC) Qs1_ref is 0.36 p.u, the DC voltage reference value udc1_ref is 1.0 p.u., the active power reference value of receiving end controller (REC) Ps2_ref is 0.85 p.u., and the reactive power reference value Qs2_ref is 0.13 p.u. The grid-connected distance of the wind farm, which means the distance between grid-side bus of D-PMSG us and sending-side bus of VSC-HVDC us1, is 10 km.
The initial parameters of MSC, GSC, SEC and REC are set in the following.
The MSC parameters kp1, ki1, kp2, ki2, kp3, ki3 are 0.1, 20, 2.1, 10.2, 0.15, 100.2, respectively. The GSC parameters hp1, hi1, hp2, hi2, hp3, hi3 are 1.1, 100, 1.0, 1.3, 1.1, 2000, respectively. The SEC parameters bp1, bi1, bp2, bi2, bp3, bi3, bp4, bi4 are 0.2, 60, 0.6, 6.1, 51, 30, 0.6, 60 respectively. The REC parameters cp1, ci1, cp2, ci2, cp3, ci3, cp4, ci4 are 0.65, 50, 1.2, 6.1, 0.65, 30, 0.62, 6.7 respectively. The subscripts p and i of the controller parameters represent the proportional and integral coefficients, respectively.
The state variables of the system are as follows.
{ X = [ X PMSG , X PMSG Ctrl , X HVDC , X HVDC Ctrl ] T X PMSG = [ Δ ω 1 , Δ ω 2 , Δ δ 1 , Δ δ 2 , Δ i d , Δ i q , Δ u dc , Δ i s d , Δ i s q ] X PMSG Ctrl = [ Δ w 1 , Δ w 2 , Δ w 3 , Δ x 1 , Δ x 2 , Δ x 3 ] X HVDC = [ Δ u dc 1 , Δ i dc , Δ u dc 2 , Δ i s 2 d , Δ i s 2 q ] X HVDC Ctrl = [ Δ y 1 , Δ y 2 , Δ y 3 , Δ y 4 , Δ z 1 , Δ z 2 , Δ z 3 , Δ z 4 ]
Based on the above state variables, the 28-order state matrix is obtained, and the eigenvalues corresponding to the oscillation modes are obtained and shown in Table 1.
The corresponding frequencies and damping ratios of each mode are shown in Table 2.
Because controller parameters have little influence on Low-Frequency Oscillation (LFO) and High-Frequency Oscillation (HFO) modes, this paper focuses on the Sub-Synchronous Oscillation (SSO)/Super-Synchronous Oscillation (SupSO) modes.
The participating factors of each oscillation mode can be obtained, and the analysis suggests that the controller parameters, i.e., the d-axis outer-loop proportional coefficient hp1, the integral coefficient hi1 and the q-axis proportional coefficient hp3, the integral coefficient hi3 of GSC, and the d-axis outer-loop proportional coefficient bp1 and the integral coefficient bi1 of SEC affect both the SSO-1 and SupSO mode. In other words, there is damping coupling between the SSO-1 and SupSO mode. When adjusting the parameters of these controllers, there are complex effects on the dynamic performance of the coupled modes. For this reason, this paper establishes a PSR to provide guidance for the adjustment of these coupled parameters.
The strongly correlated state variables corresponding to the SSO/SupSO modes are as follows:
SSO-1: ∆udc, ∆x1, ∆x3, ∆y4;
SSO-2: ∆iq, ∆w3;
SupSO: ∆udc, ∆isd, ∆isq.
The original 28-order state matrix is reduced by reserving the above strongly correlated state variables. In consequence, the 8-order state matrix is obtained, whose eigenvalues of the modes after order reduction process are in Table 3.
The frequency and damping ratio of each oscillation mode are shown in Table 4.
Comparing Table 2 with Table 4, the mode frequency and damping ratio of the SSO modes are similar to those before order reduction, which means the order reduction process is successful.

4.2. Construction of Parameter Stability Region

According to the results of the participation factor analysis, hp1, hi1, hp3, hi3, bp1, bi1 are all dominant variables, and the PSR is constructed according to the above six variables, on principle. For the sake of visual clarity, the q-axis proportional coefficient hp3 of GSC of D-PMSG and the d-axis outer-loop proportional coefficient bp1 of SEC of VSC-HVDC, which are the controller parameters that represent the coupling in the renewable power base (source side) and HVDC transmission system (grid side), respectively, and affect the studied SSO/SupSO with relatively high sensitivity according to the sensitivity calculation, are taken as dominant variables for PSR construction to demonstrate the method proposed in this paper, so as to visually display the two-dimensional PSR on the plane, which is more intuitive. Besides this, the PSR can be built via other strongly correlated dominant variables. The method does not construct the PSR for each SSO mode individually, but for multiple SSO modes together.
The functional relationships of each matrix element with respect to hp3 and bp1 are approximated, and are shown in Appendix A. It can be seen that the controller parameters hp3 and bp1 mainly affect the elements of columns 2–8 in rows 2, 4 and 8, and all of them are functions of hp3 and bp1.
The set of parameters hp3 = 1.1, bp1 = 0.2 is substituted into the state matrix A, shown in Table A1 and Table A2, and then the 8-order numerical state matrix is obtained, then the corresponding right eigenvector matrix P is obtained by the initial eigenvalue calculation. A transition matrix B (P−1AP) is formed via Equation (10).
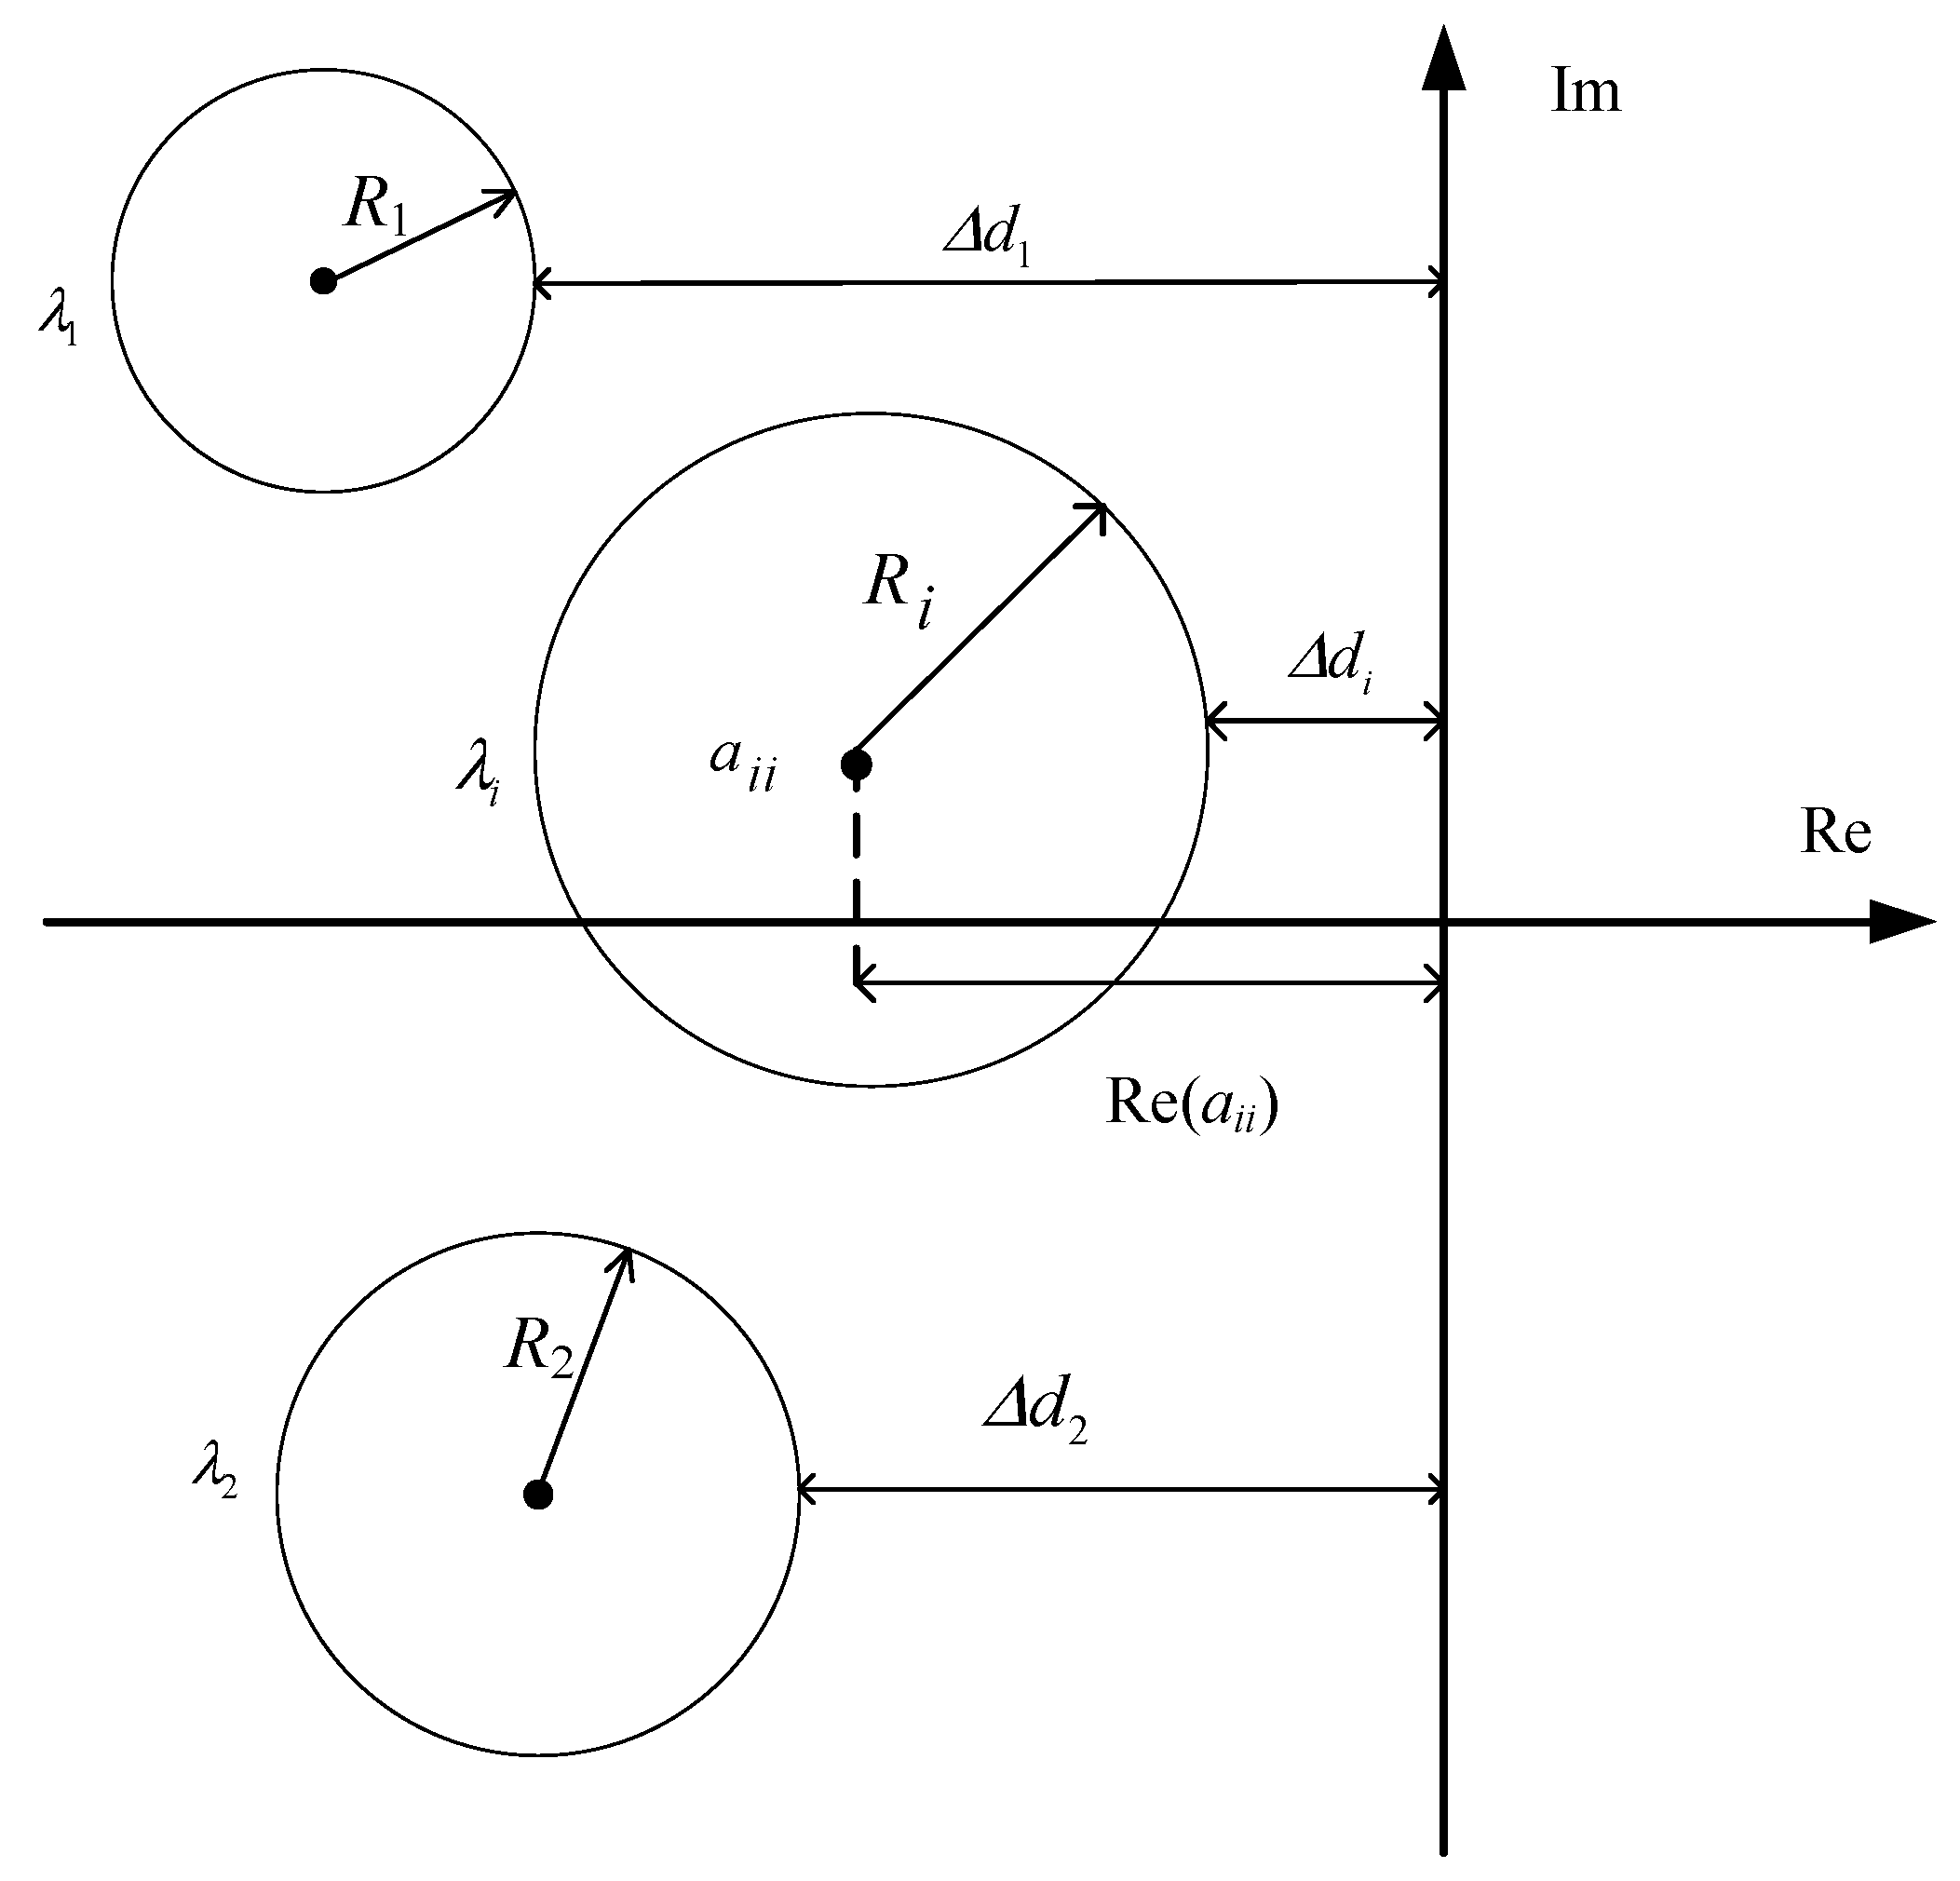
According to Equations (2) and (3), the stability constraints to be satisfied for the PSR are obtained as follows.
Constraint of the center of disk
Re ( b i i ) 0 , i = 1 ~ n
where bii is the diagonal element of the matrix B, and n is the matrix dimension.
Constraints for the distance from the center of a disk to the imaginary axis and radius
R i | Re ( b i i ) | = | j = 1 , j i n b i j | | Re ( b i i ) | 0 , i = 1 ~ n
where Ri is the radius of the i-th disk and bij is the non-diagonal element of the matrix B.
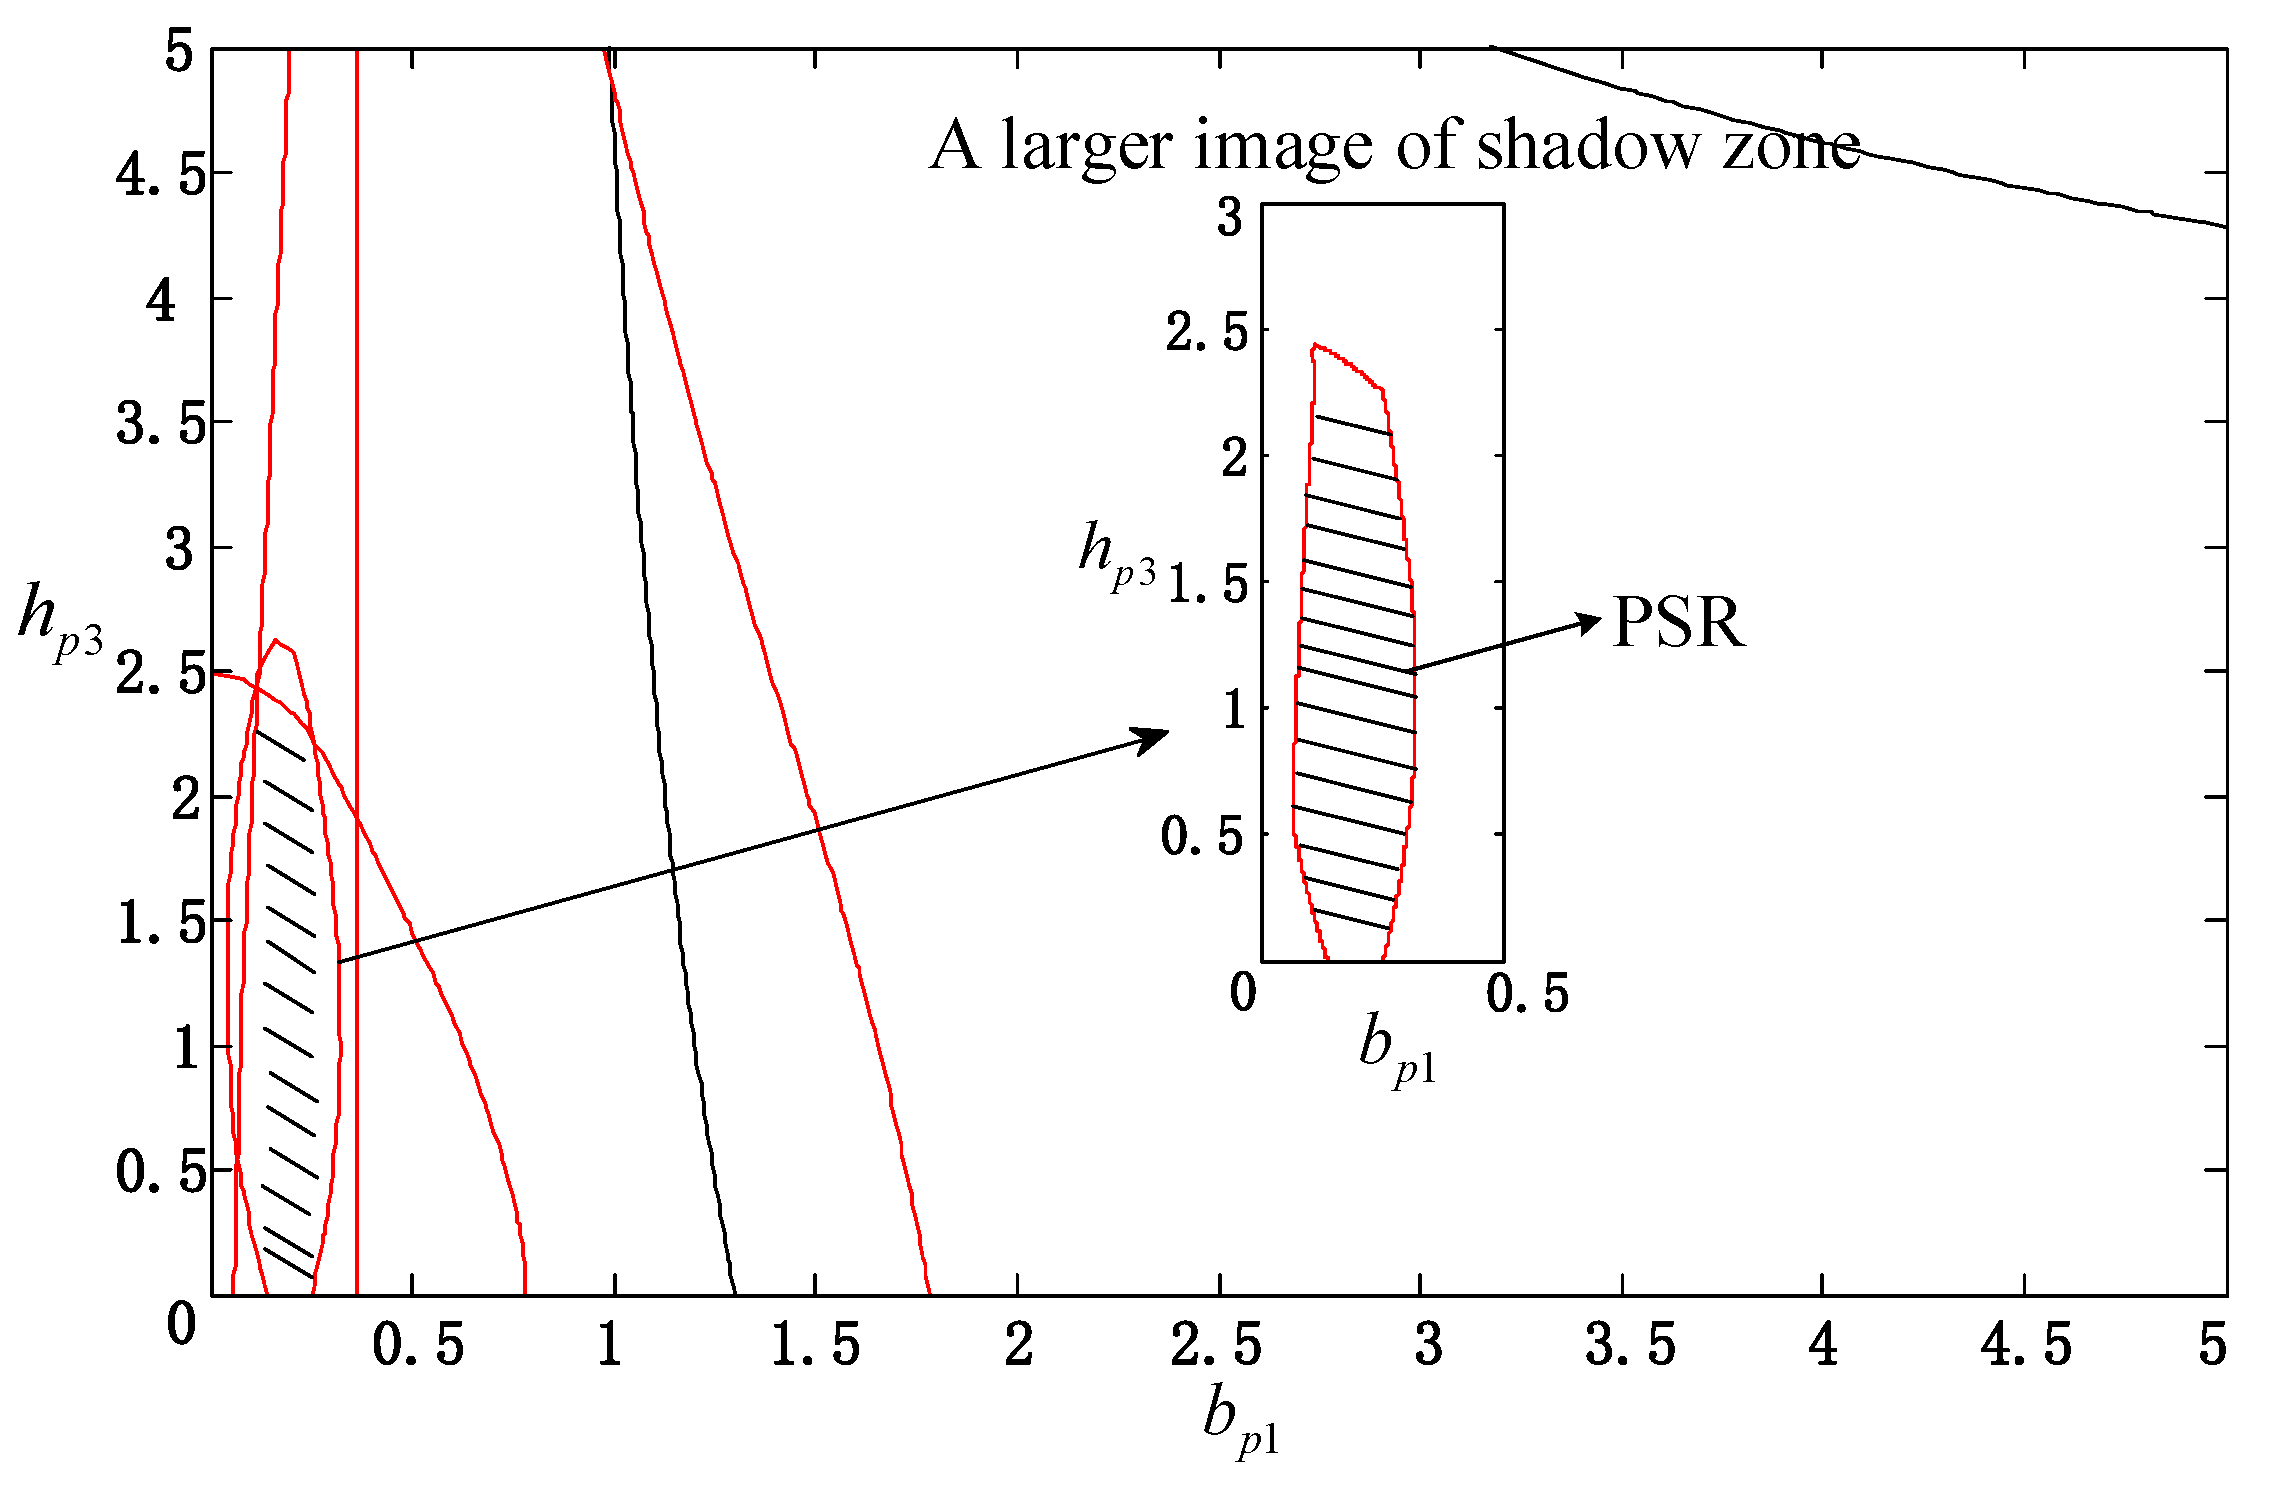
The intersection of hp3-bp1 parameter sets which satisfy the above stability constraints forms the PSR, and its boundary can be obtained by taking the equal sign in Equations (12) and (13).
The PSR of hp3-bp1 obtained via the above constraints is shown as the shadowed area in Figure 3.
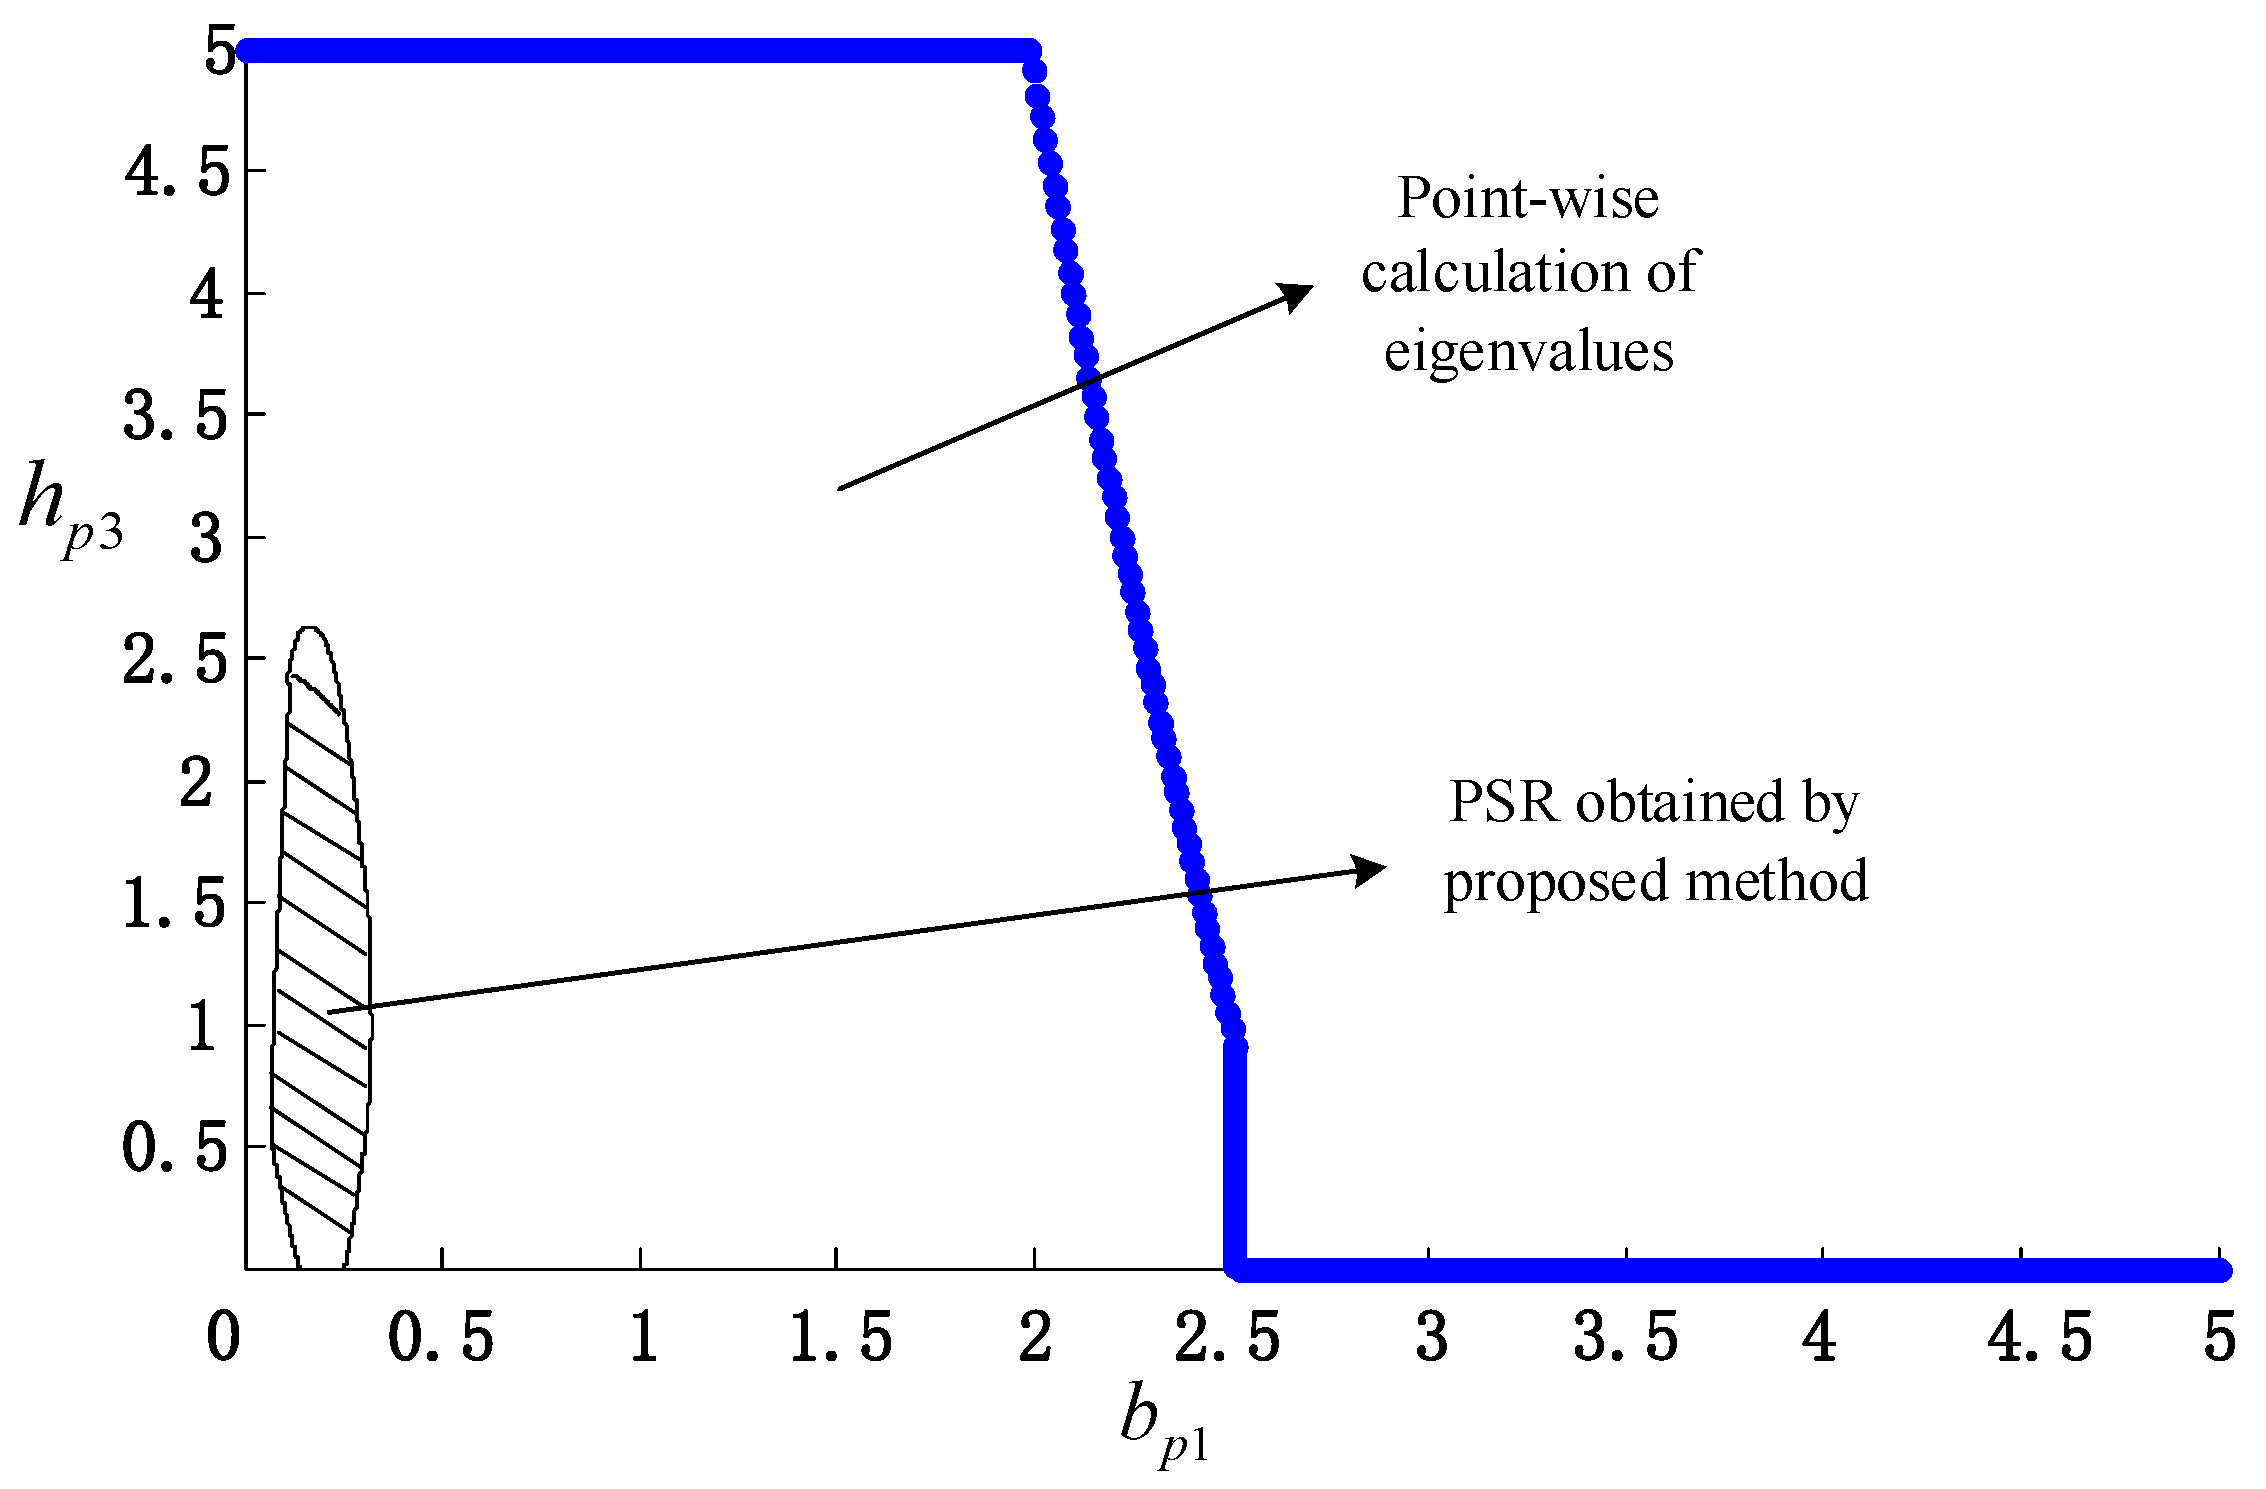
The PSR obtained by point-wise calculation of eigenvalues is also given here for comparison (where hp3 is 0–5, bp1 is 0–5, and the interval is 0.01). The compared results are shown in Figure 4.
In Figure 4, the PSR obtained by the point-wise calculation of eigenvalues is surrounded by the blue line and the coordinate axis, and the black shadowed area is the PSR obtained by the proposed method. It can be seen that the PSR obtained by the proposed method is located inside the point-wise PSR, which illustrates the effectiveness of the proposed method. However, on the other hand, it reflects the relative conservatism of the proposed method, which is analyzed in Section 2.2.
The system state matrix is related to the system operating status (power flow). When the operation mode of the power system is different, the system state matrix varies subsequently, and the PSR need to be re-constructed according to the updated system state matrix in the exact same method.
The basis of system dynamic analysis and PSR construction is the system state matrix, whose elements are functions of controller parameters in the system. However, not every controller parameter is strongly related to the system oscillation mode, and the accuracy of these parameters does not have an important influence on the analysis of dynamic characteristics and the construction of PSR. Therefore, it is unnecessary to know the accurate value of each controller in the whole renewable power system; if there are unknown non-dominant controller parameters, the default values can be used instead of accurate actual values. For the important dominant controller parameters, which can be selected to construct the PSR, the scope or feasible areas of the dominant controller parameters are decided by the PSR. The exact value is not required during the PSR construction process, but needed for the PSR-based stability margin evaluation. For unknown parameters that have a great influence on dynamic characteristics, parameters can be obtained by online identification of WAMS in the practical system.

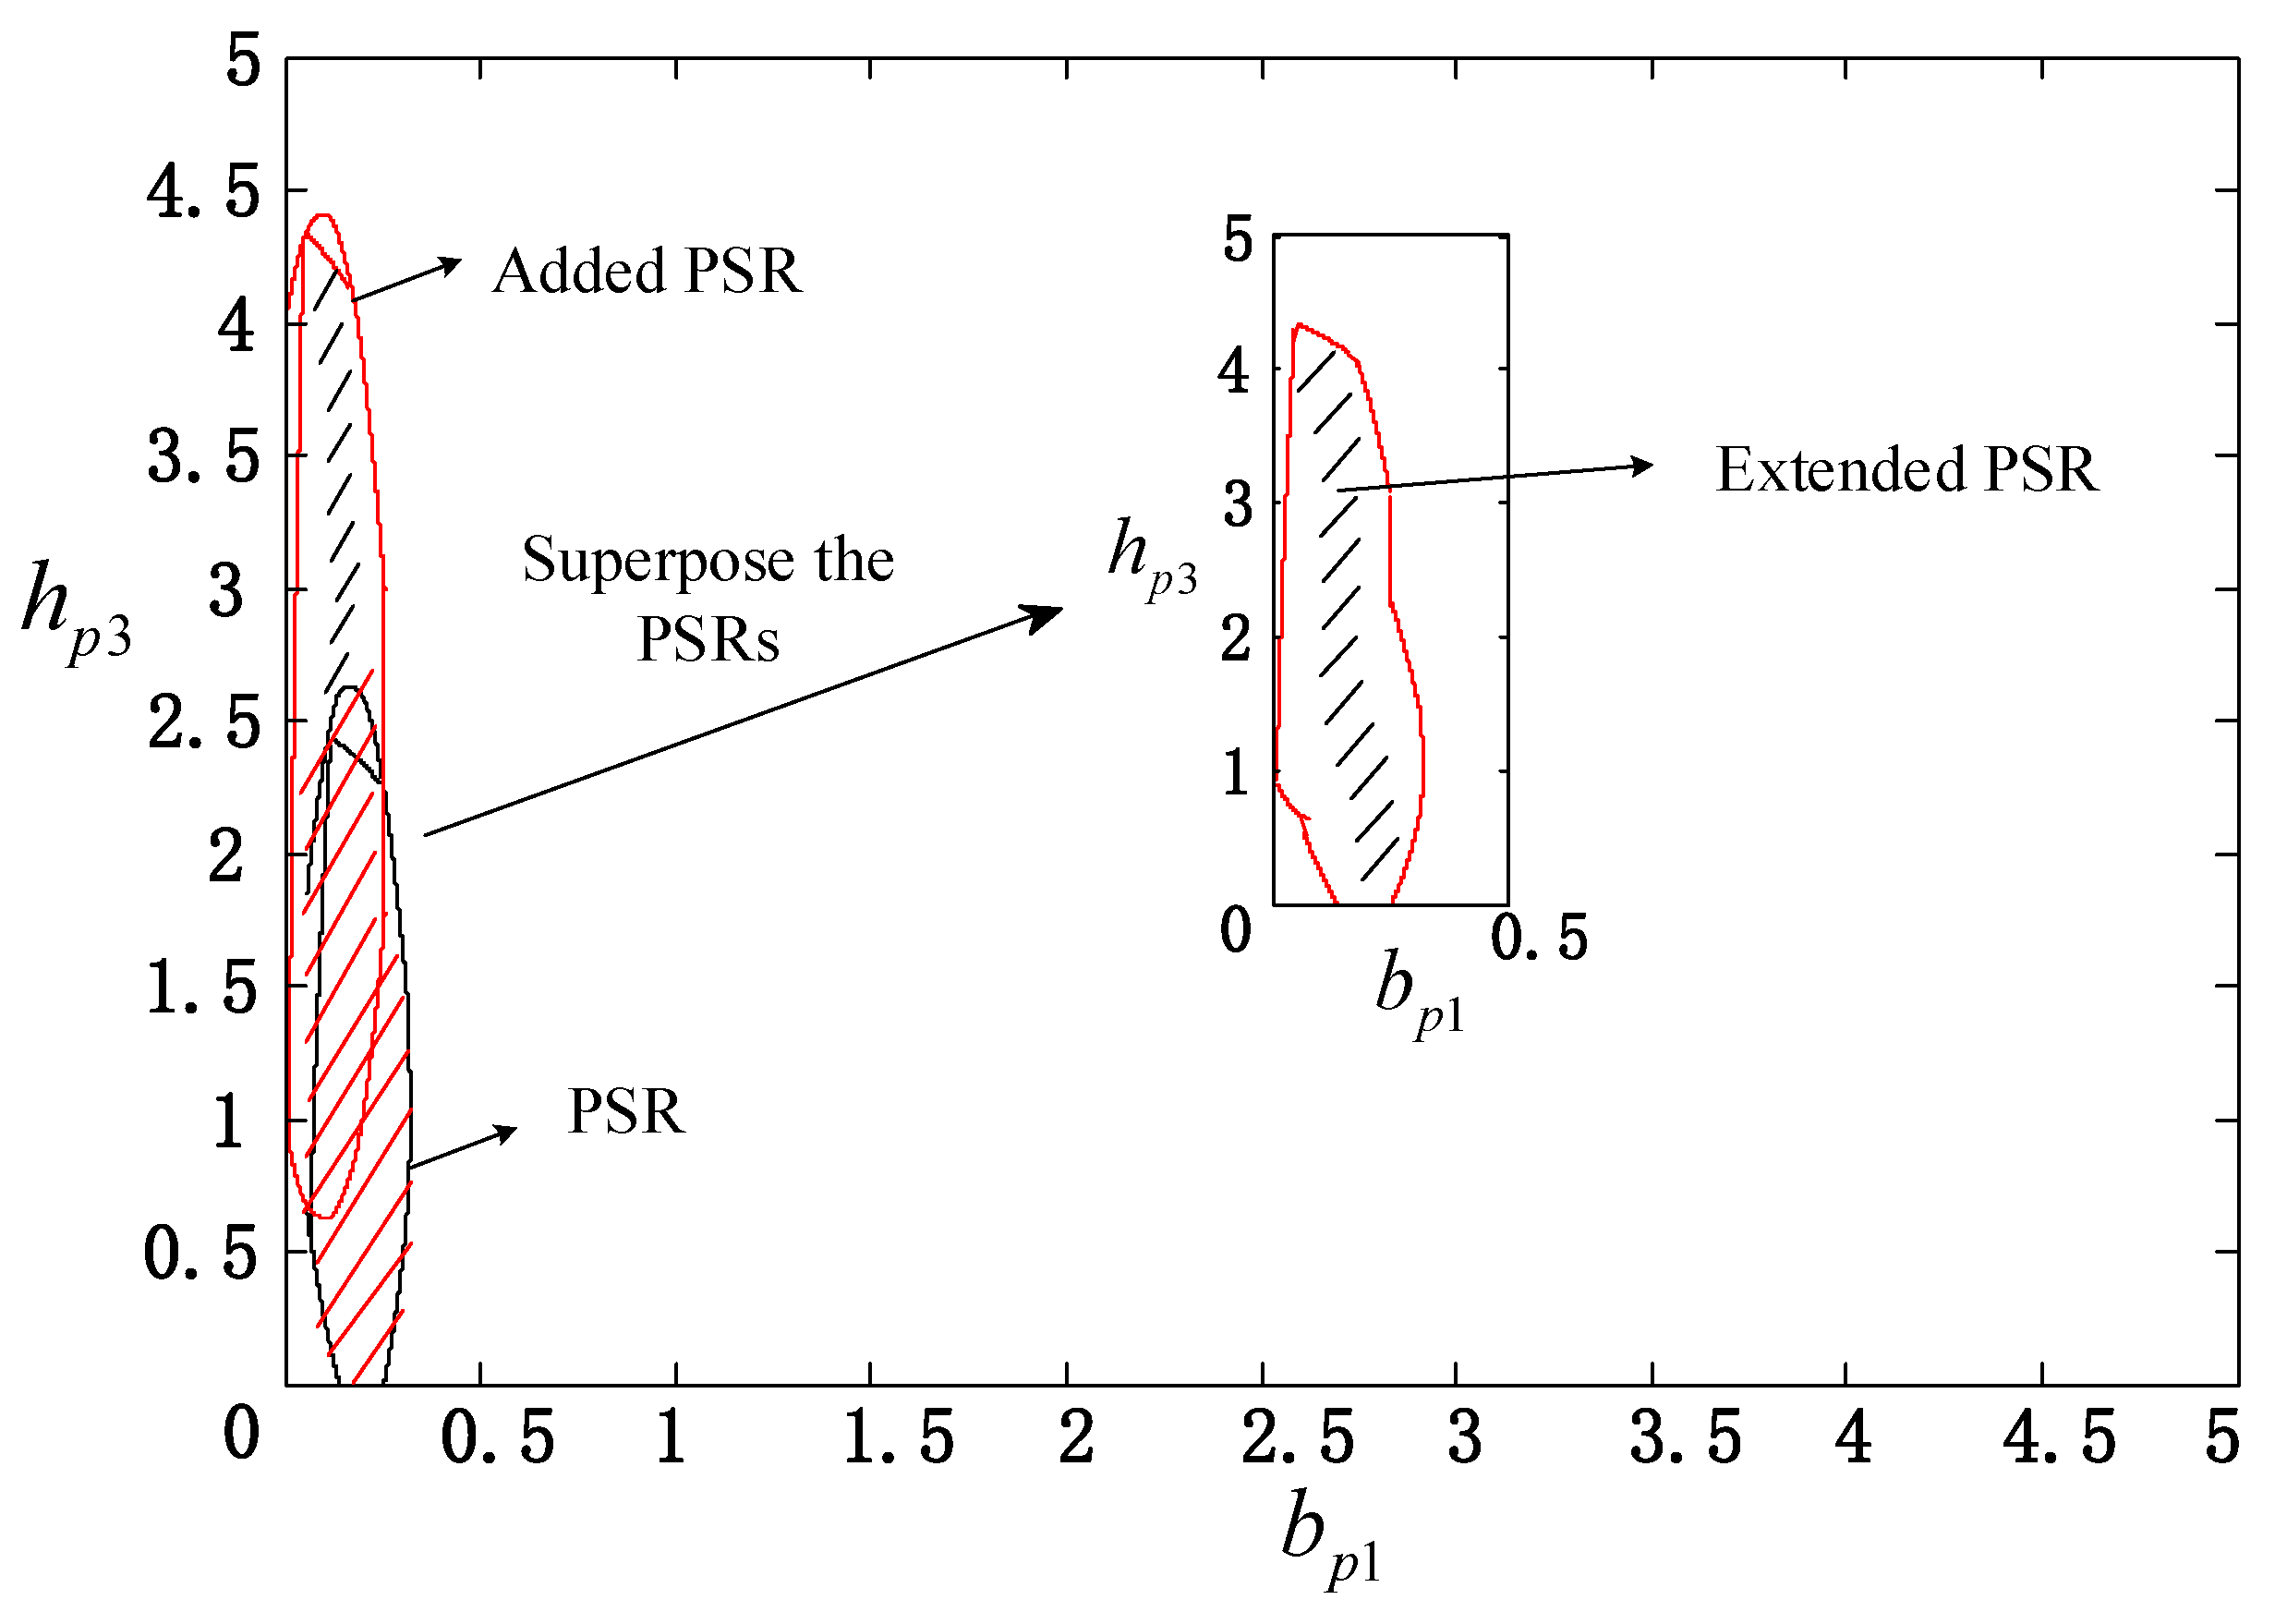
4.3. The Extension of Parameter Stabiliy Region

In order to reduce the conservatism of the PSR obtained by the proposed method, the PSR can be extended by the method introduced in Section 2.2. In the PSR shown in Figure 3, the set of parameters (hp3 = 2.41, bp1 = 0.12) is the boundary point of the PSR obtained, a PSR area is added via extension, which is the shadow area in Figure 5. The added PSR area is merged with the PSR in Figure 3 to form the extended PSR, which is the shadow part in Figure 6. This process can be further fulfilled to extend the PSR area. Obviously, conservativeness of the PSR is effectively reduced, and the results are shown in Figure 6.
For stability margin evaluation, the benchmark db is firstly obtained for the parameter equilibrium point (hp3 = 1.1, bp1 = 0.2), which is 1.5861. Then, the index for any parameter set can be obtained. Take the PSR in Figure 2, for example: for the parameter set (hp3 = 2, bp1 = 0.2) inside the PSR, the index is F = 0.6757, which is less than 1, indicating that the parameter set (hp3 = 2, bp1 = 0.2) is closer to the PSR boundary and the small signal stability is not desirable, compared with the parameter equilibrium point (hp3 = 1.1, bp1 = 0.2). It can be said that the stability margin evaluation index can reflect the stability margin quantitatively and provide visual guidance for SSO prevention and control.

4.4. The Comparision of Computational Complexity

The computational complexity is compared to demonstrate the superiority of the proposed method. The method of obtaining PSR by point-wise calculation of eigenvalues is called method 1, and the proposed method is called method 2. The consuming times are obtained via a desktop with Intel Core i5-4590, CPU at 3.30 GHz 8.00 GB, Windows 7 operation system plus MATLAB R2014a, where hp3 is 0–5, bp1 is 0–5 and the intervals are 0.01 and 0.001, respectively, for the point-wise eigenvalue method.
In the case of the 0.01 interval, the times taken for each method are in Table 5.
In the case of the 0.001 interval, the times taken for each method are in Table 6.
Table 5 and Table 6 show that the computational complexity of method 2 increases very slowly, while that of method 1 increases rapidly with the increase in accuracy. The greater the accuracy, the more obvious the advantage of method 2, which demonstrates the merit of the proposed method in computational efficiency and its potential for online application.

5. Conclusions

Aiming at the prevention and control of the SSO issue in renewable power grids and rapid online assessment of the matching of controller parameters between power generation side and grid side under the current operation mode, a novel method to construct controller PSR is proposed. Based on GDT, the eigenvalue distribution range of the system state matrix containing controller parameter variables is rapidly estimated, instead of the time-consuming direct calculation of eigenvalues, and then the PSR is deduced according to the small signal stability criterion and corresponding stability constraints on the obtained eigenvalue distribution range. On the basis of PSR, the stability margin evaluation index is proposed to rapidly evaluate the distance between the controller parameter set and the boundary of the PSR, providing guidance for the reasonable selection and online refreshing of the controller parameters under the current operation mode for the prevention and control of SSO, so as to secure the safe and stable operation of the high-proportion renewable power grid. Specifically, the preconditions of the application of the GDT on the PSR construction are discussed in detail, and a construction method of transition matrix is proposed based on a system state matrix. The transition matrix is used for the PSR construction instead of applying the system state matrix directly to overcome its limitations. Furthermore, to reduce the conservativeness of the PSR, a method for extension of the PSR is also given. The validity and correctness of the proposed methods are verified via a DPMSG-HVDC benchmark. The efficiency of the proposed method is highlighted by comparing the proposed method and the point-wise eigenvalue calculation of the state matrix from a time-consuming perspective, which demonstrates its potential for online application.
This paper mainly focuses on the PSR construction method and its application procedure; the further research directions are in following:
  • The method of rapid PSR construction’s application to the impedance model;
  • The application of the proposed PSR method in a practical large-scale renewable power system;
  • The mechanism for the constructed PSR, which is more robust to the unknown control parameters and uncertainties;
  • Detailed investigations into whether and how wind-farm output fluctuates affect the PSR of different benchmarks are currently taking place. The progress is expected to be reported is a separate submission.

Author Contributions

Conceptualization, T.L. and S.K.; methodology, Y.S., R.C. and B.C.; validation, T.L. and S.K.; investigation, Q.L., S.L.; resources, H.D.; data curation, S.K.; writing—original draft preparation, S.K. and T.L.; writing—review and editing, T.L. and S.K.; visualization, S.K.; supervision, T.L.; project administration, T.L.; funding acquisition, T.L. All authors have read and agreed to the published version of the manuscript.

Funding

This work is supported by the National Key R&D Program of China (2017YFB0902000) and State Grid Corporation Headquarters Science and Technology Project (SGXJ0000KXJS1700841).

Institutional Review Board Statement

Not applicable.

Informed Consent Statement

Not applicable.

Data Availability Statement

Not applicable.

Acknowledgments

This research received no external support.

Conflicts of Interest

The authors declare no conflict of interest.

Appendix A

The functional relationships of each matrix element with respect to hp3 and bp1.
Table A1. The functional relations of 1–4 Column elements of matrix A with respect to hp3 and bp1.
−24.649000
41.132bp1 × (−5.255) + 73.573−bp1 × (3.669) + 70.9251.32 × bp1 + hp3 × (0.167 × bp1 + 6.392) + 113.79
0−1725.05−1569.00
0−[bp1 × (649.87) + 6983.68]−bp1 × (453.50) − 3944.29bp1 × (257.1) + hp3 × (bp1 × (32.64) − 1.5) − 605.61
−1.0000
0−100
000−1.0002
0bp1 × (3.035) + 33.301bp1 × (2.118) + 18.17−bp1 × (1.201) + hp3 × (bp1 × (0.152) + 1.674) − 2.084
Table A2. The functional relations of 5–8 Column elements of matrix A with respect to hp3 and bp1.
16,264000
−5218.8bp1 × (477.94) − 6788.57−bp1 × (527.92) − 12787.47−bp1 × (4.595) − 217.67
015682000
0bp1 × (59073.7) + 634868.7bp1 × (−65255.7) + 3019.26bp1 × (−568.02) + 26.24
0000
0000
00.00450.02260
0−bp1 × (275.94) − 3027.35bp1 × (304.79) + 3346.44bp1 × (2.653) − 98.02

References

  1. Liu, H.; Xie, X.; Zhang, C.; Li, Y.; Liu, H.; Hu, Y. Quantitative SSR Analysis of Series-Compensated DFIG-based wind farms Using Aggregated RLC Circuit Model. IEEE Trans. Power Syst. 2017, 32, 474–483. [Google Scholar] [CrossRef]
  2. Liu, W.; Xie, X.; Liu, H.; He, J. Mechanism and Characteristic Analyses of Sub-synchronous Oscillations Caused by the Interactions between Direct-drive Wind Turbines and Weak AC Power Systems. J. Eng. 2017, 2017, 1651–1656. [Google Scholar] [CrossRef]
  3. Chowdhury, M.A.; Mahmud, M.A.; Shen, W.; Pota, H.R. Nonlinear controller design for series-compensated DFIG-Based wind farms to mitigate subsynchronous control Interaction. IEEE Trans. Energy Convers. 2017, 32, 707–719. [Google Scholar] [CrossRef]
  4. Wang, L.; Xie, X.; Jiang, Q.; Liu, X. Centralised solution for subsynchronous control interaction of doubly fed induction generators using voltage-sourced converter. IET Gener. Transm. Distrib. 2015, 9, 2751–2759. [Google Scholar] [CrossRef]
  5. Liu, H.; Xie, X.; He, J.; Xu, T.; Yu, Z.; Wang, C.; Zhang, C. Subsynchronous interaction between Direct-Drive PMSG based wind farms and weak AC networks. IEEE Trans. Power Syst. 2017, 32, 4708–4719. [Google Scholar] [CrossRef]
  6. Meegahapola, L.G.; Bu, S.; Wadduwage, D.P.; Chung, C.Y.; Yu, X. Review on Oscillatory Stability in Power Grids with Renewable Energy Sources: Monitoring, Analysis, and Control using Synchrophasor Technology. IEEE Trans. Ind. Electron. 2020, 68, 519–531. [Google Scholar] [CrossRef]
  7. Shair, J.; Xie, X.; Liu, W.; Li, X.; Li, H. Modeling and stability analysis methods for investigating subsynchronous control interaction in large-scale wind power systems. Renew. Sustain. Energy Rev. 2021, 135, 110420. [Google Scholar] [CrossRef]
  8. Liu, W.; Xie, X.; Shair, J.; Li, X. A Nearly Decoupled Admittance Model for Grid-tied VSCs under Variable Operating Conditions. IEEE Trans. Power Electron. 2020, 35, 9380–9389. [Google Scholar] [CrossRef]
  9. Xie, X.; Zhan, Y.; Shair, J.; Ka, Z.; Chang, X. Identifying the Source of Subsynchronous Control Interaction via Wide-Area Monitoring of Sub/Super-Synchronous Power Flows. IEEE Trans. Power Deliv. 2019, 35, 2177–2185. [Google Scholar] [CrossRef]
  10. Zhang, C.; Molinas, M.; Rygg, A.; Cai, X. Impedance-Based Analysis of Interconnected Power Electronics Systems: Impedance Network Modeling and Comparative Studies of Stability Criteria. IEEE J. Emerg. Sel. Top. Power Electron. 2019, 8, 2520–2533. [Google Scholar] [CrossRef] [Green Version]
  11. Li, S.; Lin, T.; Sheng, Y.; Xu, X. On damping coupling of SSO/SupSO modes and oscillation suppression strategy for large scale renewable source generation connected power grids. In Proceedings of the 8th Renewable Power Generation Conference (RPG 2019), Shanghai, China, 24–25 October 2019. [Google Scholar]
  12. Chen, B.; Lin, T.; Chen, R.; Zhang, J.; Xu, X. Coordinative Optimization of Multi-Channel PSS and TCSC Damping Controller to Suppress the Low frequency and Subsynchronous Oscillation. In Proceedings of the 2016 Power & Energy Society General Meeting, Boston, MA, USA, 17–21 July 2016; pp. 1–5. [Google Scholar]
  13. Sharma, B.B.; Kar, I.N. Distributed control of a class of interconnected systems in a string. IET Control Theory Appl. 2011, 5, 963–975. [Google Scholar] [CrossRef]
  14. Turksoy, K.; Bayrak, E.S.; Quinn, L.; Littlejohn, E.; Cinar, A. Guaranteed stability of recursive multi-input-single-output time series models. In Proceedings of the 2013 American Control Conference, Washington, DC, USA, 17–19 June 2013; pp. 77–82. [Google Scholar]
  15. Lee, C.H. D-stability of continuous time-delay systems subjected to a class of highly structured perturbations. IEEE Trans. Autom. Control 1995, 40, 1803–1807. [Google Scholar]
  16. Nazari, M.H.; Ilic, M.; Lopes, J.P. Small-signal stability and decentralized control design for electric energy systems with a large penetration of distributed generators. Control Eng. Pract. 2012, 20, 823–831. [Google Scholar] [CrossRef] [Green Version]
  17. Lin, T.; Chen, R.; Yu, G.; Bi, R.; Xu, X. Extended Gersgorin theorem-based parameter feasible domain to prevent harmonic resonance in power grid. Energies 2017, 10, 1612. [Google Scholar] [CrossRef] [Green Version]
  18. Lancaster, P.; Tismenetsky, M. The Theory of Matrices with Application; Academic Press: New York, NY, USA, 1985. [Google Scholar]
Figure 1. Gerschgorin disk theorem schematic.
Applsci 11 01205 g001
Figure 2. The Drive Permanent Magnet Synchronous Generator (D-PMSG) via Voltage Source Converter-based High-Voltage Direct Current (VSC-HVDC) grid-connection system model.
Applsci 11 01205 g002
Figure 3. The parameter stability region (PSR) of hp3-bp1 (parameter equilibrium point: hp3 = 1.1, bp1 = 0.2).
Applsci 11 01205 g003
Figure 4. The PSR obtained by point-wise calculation of eigenvalues and proposed method.
Applsci 11 01205 g004
Figure 5. The PSR of hp3-bp1 (parameter equilibrium point: hp3 = 2.41, bp1 = 0.12).
Applsci 11 01205 g005
Figure 6. The extended PSR of hp3-bp1.
Applsci 11 01205 g006
Table 1. Eigenvalues corresponding to oscillation modes.
SSO-1SSO-2SupSO
−162.806 + j87.342−12.323 + j126.933−497.152 + j378.435
−162.806 − j87.342−12.323 − j126.933−497.152 − j378.435
Table 2. Frequency and damping ratio corresponding to oscillation modes.
ModeSSO-1SSO-2SupSO
frequency (Hz)13.900920.202160.2298
Damping ratio0.88120.09660.7957
Table 3. The eigenvalues of the modes after order reduction.
SSO-1SSO-2SupSO
−151.3742 + j83.1829−12.3246 + j126.9336−498.8908 + j373.1220
−151.3742 − j83.1829−12.3246 − j126.9336−498.8908 − j373.1220
Table 4. Frequency and damping ratio corresponding to oscillation modes after order reduction.
ModeSSO-1SSO-2SupSO
Frequency (Hz)13.2420.2059.38
Damping ratio0.87640.09660.8008
Table 5. Time-consuming comparison under 0.01 parameter interval.
MethodMethod 1Method 2
time-consuming(s)19.760.5691
Table 6. Time-consuming comparison under 0.001 parameter interval.
MethodMethod 1Method 2
time-consuming(s)2119.22.2411
Publisher’s Note: MDPI stays neutral with regard to jurisdictional claims in published maps and institutional affiliations.

