Article

Temperature Sensing with Nd3+ Doped YAS Laser Microresonators

by
Daniel Walo-Martín
1,
Franzette Paz-Buclatin
1,*,
Susana Ríos
1,
Inocencio R. Martín
1,2,
Leopoldo L. Martin
1,
Airán Ródenas
1,3,
Vladimir N. Sigaev
4,
Vitaliy I. Savinkov
4 and
Georgiy Y. Shakhgildyan
4
1
Departamento de Física, Universidad de La Laguna, Apdo. 456, E-38200 San Cristóbal de La Laguna, Spain
2
Instituto Universitario de Materiales y Nanotecnología (IMN), Universidad de La Laguna, Apdo. 456, E-38200 San Cristóbal de La Laguna, Spain
3
Instituto Universitario de Estudios Avanzados (IUdEA), Universidad de La Laguna, Apdo. 456, E-38200 San Cristóbal de La Laguna, Spain
4
Department of Glass and Glass Ceramics, D. Mendeleev University of Chemical Technology, Miusskaya Sq., 9, 125047 Moscow, Russia
*
Author to whom correspondence should be addressed.
Appl. Sci. 2021, 11(3), 1117; https://doi.org/10.3390/app11031117
Submission received: 29 December 2020 / Revised: 21 January 2021 / Accepted: 22 January 2021 / Published: 26 January 2021
(This article belongs to the Special Issue Laser Spectroscopy)

Abstract

:

Featured Application

The investigated YAS glass microspheres doped with Nd3+ ions have great potential as remote optical temperature sensors. Moreover, they are suitable for the development of laser devices with low power thresholds.

Abstract

Yttria–alumina–silica (YAS) glass microspheres doped with Nd3+ ions were excited with a 532 nm continuous laser in order to study the dependency of the wavelength of the whispering gallery mode (WGM) peaks on the temperature of the sample. This was possible due to a previous calibration of the 808 nm and 890 nm emission bands of the Nd:YAS glass sample for different temperatures using the fluorescence intensity ratio (FIR) technique. A maximum sensitivity of 15 × 10−6 K−1 and a temperature resolution limit of 0.2 K were obtained for the microsphere sensor. Moreover, laser emission at 1064 nm was observed by continuous pumping at 532 nm, and a power threshold of 100 mW was determined. Upconversion emissions of Nd3+ were also studied by exciting the sample at 808 nm.

1. Introduction

Optically active ions present luminescent properties that provide information regarding the characteristics of the host material lattice. Particularly, fluorescent chemical elements, quantum dots, or proteins are commonly used to study the host material [1,2]. Among them, trivalent lanthanide ions are widely used, because they present various fluorescent transitions throughout the UV to mid-IR electromagnetic range and they can be employed in different dielectric media such as inorganic glasses and crystals, or even in intracellular medium [3,4].
Yttria–alumina–silica (YAS) glass microspheres have an interesting application for in situ cancer radiotherapy, in which they are used as carriers of yttrium isotope [5]. This is possible due to the excellent chemical durability of YAS glasses. Other remarkable properties of these glasses include a high transformation temperature (about 900 °C) that is independent of the composition, high strength, optical transparency throughout the visible spectrum, and high electrical resistivity. Furthermore, the structure of YAS glasses make them favorable to be used as laser gain media for high concentrations of rare-earth dopant [6], and in all-fiber mode [7].
In recent years, nanotechnological advances have led to the development of new methods for measuring temperature [8]. A new generation of optical sensors have been developed that take advantage of the variations in the emission spectrum of the material (intensity, wavelength, lifetime, band shape) due to changes in temperature [8].
Some trivalent lanthanide ions show changes in the intensity of thermally coupled emission bands due to a temperature change [9,10]. These changes are due to thermal population redistributions between two energy levels that are coupled to the same lower energy level [11]. This effect is studied using the fluorescence intensity ratio (FIR) technique, which compares the fluorescent intensities of two emission bands of a material at different temperatures. Therefore, several optical temperature sensors based on this technique have been developed using lanthanide ions with energy levels close to each other [11,12,13,14,15]. Although the FIR technique allows for simple and robust device designs, it cannot typically deliver temperature resolution at the sub-degree level.
A straight method to enhance thermal resolution by at least an order of magnitude is embedding the active ions in a microcavity, such as a microsphere, featuring resonant modes called whispering gallery modes (WGM) [15]. Microspheres can host high-quality factor resonances, which means that they confine high-energy-density resonant modes [16]. Small nanoscale changes in the surface physical parameters of the microsphere (radius and refractive index) induce a shift in the resonant wavelength of the WGM. If these variations are the result of temperature changes, the WGM can be used to estimate the temperature with high precision. If the microsphere is thus doped with optically active ions emitting at the WGM wavelength, the resonant modes can be observed via the increased emission probability of the active ions due to the Purcell effect, resulting in sharp and narrow peaks [17].

2. Theoretical Background

2.1. Fluorescence Intensity Ratio (FIR)

The FIR technique is based on the variation of the relative luminescence of two radiative transitions with temperature. Through this technique, a calibration can be performed that can be used to estimate the temperature of a given sample from its emission spectrum.
For this technique to be efficient, the energy levels to be studied must have an energy gap between 200 cm−1 and 2000 cm−1 [16]. For Nd3+, the energy levels 4F5/2 and 4F3/2 comply with this requirement (shown in Figure 1).
For a three-level system, labelled 1, 2, and 3, in thermal equilibrium, the relative population of the levels energetically close, labelled 2 and 3 (see Figure 1), follows a Boltzmann-type distribution. Accordingly, the ratio of the intensities from these levels is given by [11,13]
R a t i o = I 31 I 21 = A 31 g 3 h ν 3 A 21 g 2 h ν 2 e x p E 32 k B T = B   e x p E 32 k B T
where Ai1 is the spontaneous emission rate from the ith level to level 1, g3 and g2 are the (2J + 1) degeneracies of the levels, h is the Planck’s constant, υi is the angular frequency of the transition, E32 is the energy gap between the two levels, and kB is the Boltzmann constant.

2.2. Whispering Gallery Modes (WGM)

In a geometrical approximation, the light circles the interior of the sphere through multiple total internal reflections returning in phase to the origin point. The resonance condition of a given wavelength λ inside of a microsphere of radius Rλ is approximately described by the following equation:
2 π n e f f R = l λ
where l is the mode number and neff is the effective refractive index of the sphere.
Equation (2) allows the evaluation of the WGM resonances inside the sphere by taking into account only the sphere parameters. Small perturbations in size or refractive index of the sphere cause a shift in the resonant wavelength. This allows the study of the external conditions of the microsphere causing the difference in its properties. These changes in the parameters of the microsphere can be produced by variations in pressure, chemical composition of the surrounding media, or temperature. In order to know the relationship of the resonant wavelength with temperature, the derivative of Equation (2) with respect to the temperature is calculated:
d λ d T = λ 1 n δ n δ T + 1 R δ R δ T = α + β λ
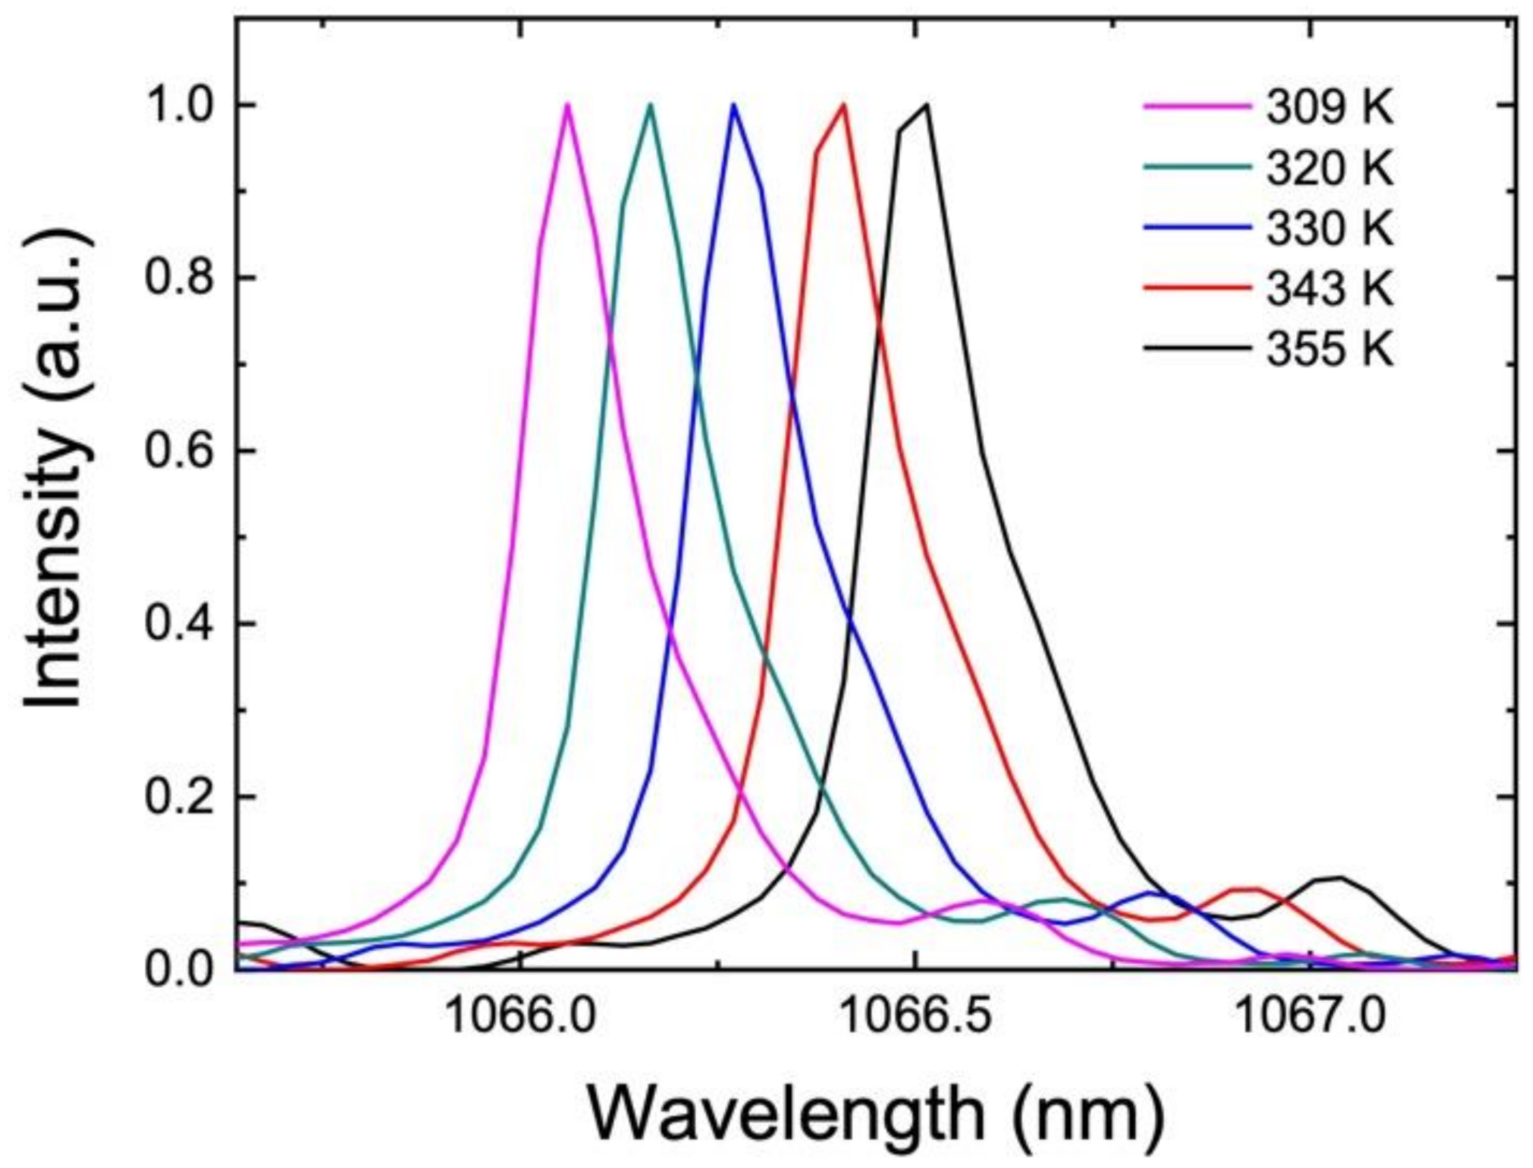
where α is the thermo-optic coefficient (α = 1/n δn/δT) and β the thermal expansion coefficient (β = 1/R δR/δT). The signs of these coefficients are known to be generally positive in glasses [18]. Therefore, it is to be expected that the peaks will shift to the red region of the spectra as the temperature increases, as can be seen in Figure 2.

2.3. Thermal Sensors

FIR technique and WGM displacement are techniques that can be used to develop thermal sensors. In order to characterize the performance of a thermal sensor, two parameters need to be introduced: relative sensitivity and resolution. The relative sensitivity, S, represents the variation of the measured parameter, MP, with temperature relative to its magnitude:
S = 1 M P d M P d T
According to this definition, it is straightforward to calculate the sensitivity for the aforementioned methods using Equations (1) and (2), through the following expressions:
  S F I R = 1 R d R d T = E 32 K B T 2
S W G M = 1 λ d λ d T = 1 n δ n δ T + 1 R δ R δ T = α + β
Equation (5) must be carefully analyzed because it can lead to misinterpretations. It suggests that using pairs of energy levels with larger energy differences increases the FIR sensitivity. However, for large energy differences, the energy levels have no temperature correlation, and this technique is not valid as explained before. It also suggests that the sensitivity is enhanced at low temperatures, but this implies extremely low upper-level populations, corresponding to excessively low emission intensities, so the ratio of intensities is determined with undesirable uncertainty.
In addition, the temperature resolution of the FIR technique and WGM can be estimated taking into account the resolution of the instrument and the temperature sensitivity of the technique using the following expressions [19]:
Δ T min F I R = Δ R R   S F I R
Δ T min W G M = Δ λ m i n λ S W G M

3. Materials and Methods

3.1. Microsphere Production

The microspheres used in this experiment were produced from Nd3+ YAS glass (YAS: Nd3+) with the following composition (mol%): 13.4 Y2O3, 37.2 Al2O3, 46.5 SiO2, and 2.9 Nd2O3 using the melt quenching method in a platinum crucible. This glass was synthesized using high-purity raw materials containing trace amounts of impurities such as rare-earth metals (Sm, Eu, Gd, Tb, Dy, Ho, Tm), as well as other elements (V, Fe, Ca, Co, Mg, Mn, Ni, Cu, Na, Ti). According to the raw materials’ data sheet all impurities were on the level of a few ppm. The composition of the synthesized glass was examined through laser-induced breakdown spectroscopy using an LEA-S500 elemental analyzer from SOL Instruments. While the detection limit of this method varies for each element, it is at least 100 ppm. The intensities of all the spectral lines corresponding to the above-mentioned impurities were at the background level. Therefore, it is proposed that no additional impurities were introduced to the glass during the melting process. The bulk glass sample was reduced to small particles and separated attending to grain size by wet sieving. The powder was then exposed to plasma and the surface tension pulled the molten glass into a sphere that was rapidly quenched [20]. Microspheres with diameters of 30 µm to 50 µm were used in this study.

3.2. Temperature Calibration

The emission spectrum response to the temperature of the YAS:Nd3+ doped glass was obtained using the experimental set-up described in Reference [9]. The sample was located inside a tubular horizontal furnace, where the excitation of the Nd3+ ions was carried out from one side of the furnace with a 532 nm continuous wave diode pumped solid state laser (DPSSL) at 8 mW to avoid optically heating the sample. The luminescence from the sample was collected from the opposite side of the furnace and was analyzed with a high-resolution CCD spectrograph (Andor SR-3031-B CCD Newton DU920N manufactured in Ireland). A high pass filter was placed in the emission collection side to eliminate the excitation beam. The heating was performed at a rate of 1 K min−1 from room temperature to 473 K. The temperature calibration was obtained employing the FIR technique on the emission spectra.

3.3. Optical Measurements

The emission spectra of YAS:Nd3+ microspheres were measured using a modified confocal microluminescence setup, detailed in Reference [10], with a 20× microscope objective of NA = 0.4. To obtain the fluorescent emission of the sample, a continuous wave 532 nm DPSSL was used to excite the Nd3+ ions in the microsphere, and the emission was detected by a CCD spectrograph. The center of the microsphere was chosen as the excitation zone and the surface as the detection zone [10]. The selection of the excitation area was performed by means of the XYZ translational stage with the aid of the television screen images, while the detection region was selected with the mirror.
The upconversion emission of the sample was also studied by replacing the excitation source with a Spectra-Physics 3900S (manufactured in California, USA) continuous wave titanium–sapphire laser tuned to 808 nm. A minimum excitation power density of 6.4 kW/cm2 was necessary to observe the upconversion emissions under these experimental conditions.
Microspheres with a diameter between 30 and 50 μm were studied. The spectra showing WGM were recorded for increasing values of the laser pumping power to study the microsphere laser emission, WGM peak shift, and upconversion emission.
Measurement of the temporal evolution of the luminescence were carried out by exciting the bulk glass sample with an EKSPLA NT 342/3/UVE optical parametric oscillator laser (manufactured in Vilnius, Lithuania) that provides 10 ns pulses at a 10 Hz repetition rate. The emission of the sample was focused on the entry slit of a Triax 180 monochromator, and detected with a coupled photomultiplier specific for visible measurements. A TEKTRONIX-2430A digital oscilloscope (manufactured in Japan) was used to register the signal.
The absorption spectrum of the bulk sample of YAS: Nd3+ glass in the range from 200 to 1000 nm was measured with the Cary 5000 spectrophotometer (manufactured in Malaysia) to obtain the value of the energy gap between the thermally coupled levels of neodymium, E32.

4. Results and Discussion

4.1. Emission Spectrum of Nd3+

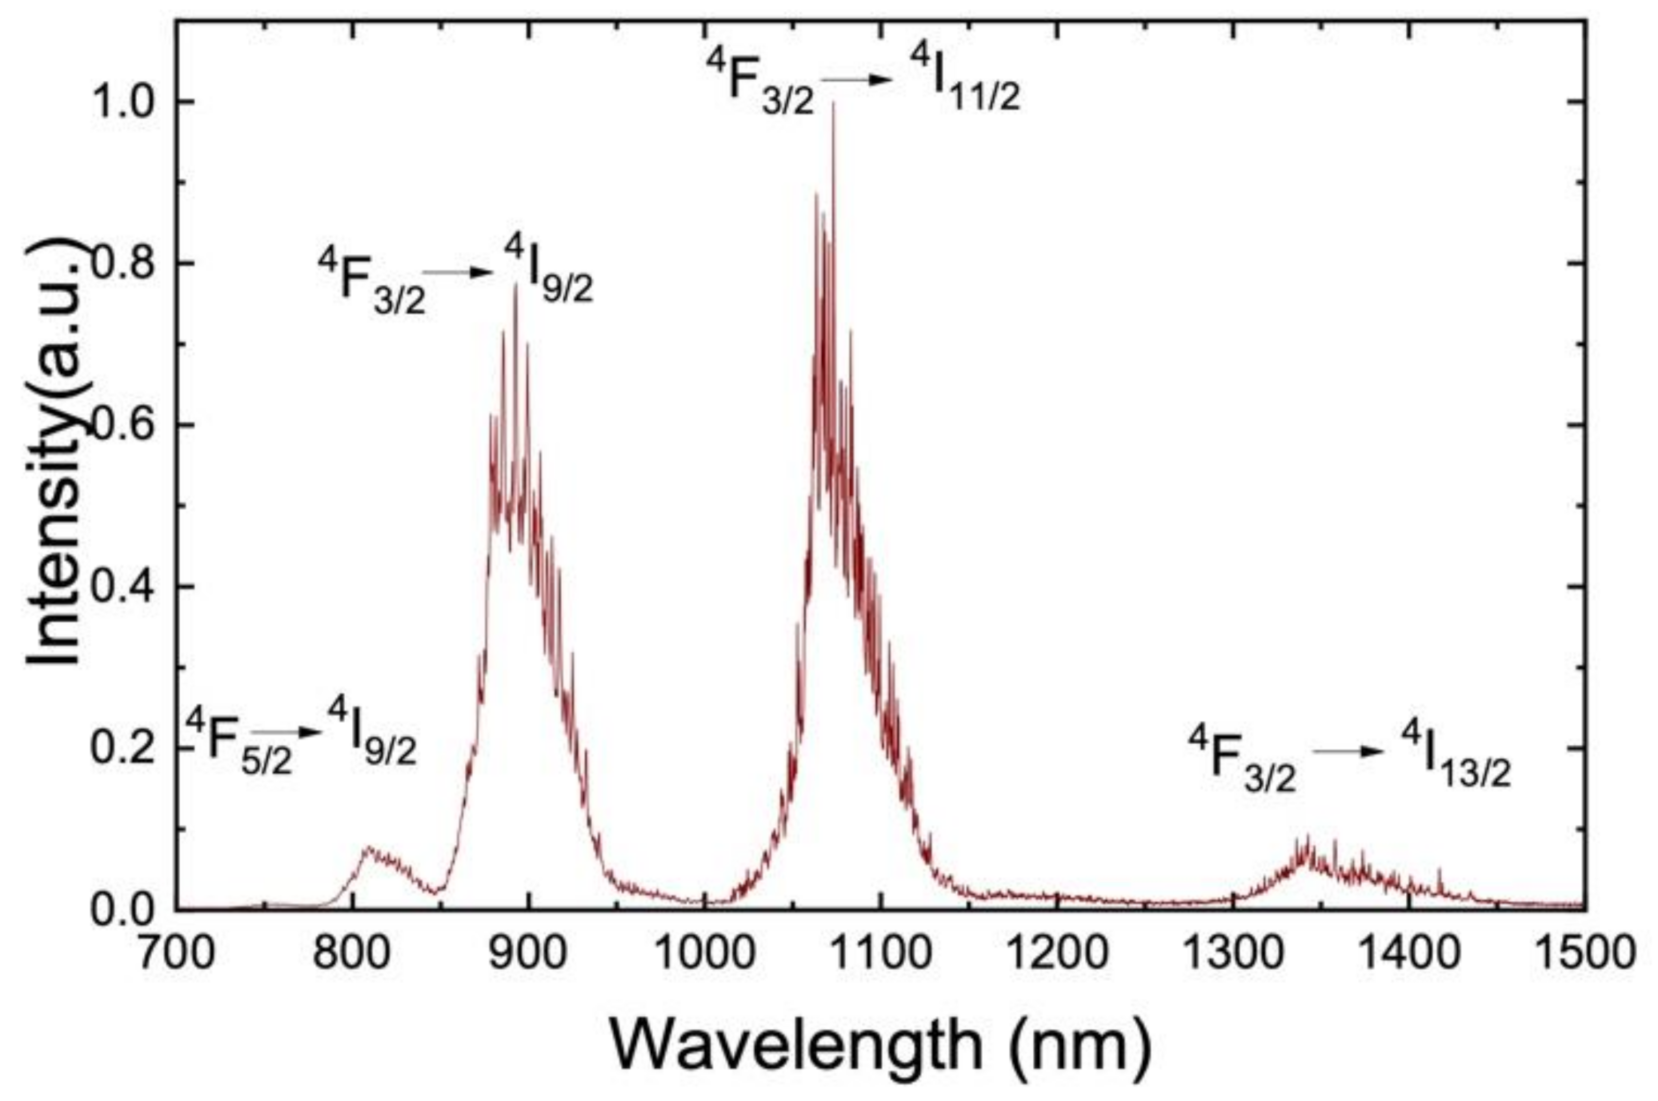
When the Nd3+ doped YAS microsphere was excited under 532 nm laser action, the spectrum plotted in Figure 3 was obtained. The excitation was carried out in the center of the microsphere and the detection was located near its surface; hence, sharp peaks appear superimposed on the typical Nd3+ emission spectrum due to the WGM resonances. In this spectrum, the 4F5/24I9/2 (810 m) and 4F3/24I9/2 (890 nm) transitions, used for the thermal calibration, the 4F3/24I11/2 transition (1064 nm), and the 4F3/24I13/2 transition (1320 nm) are shown.

4.2. Temperature Calibration

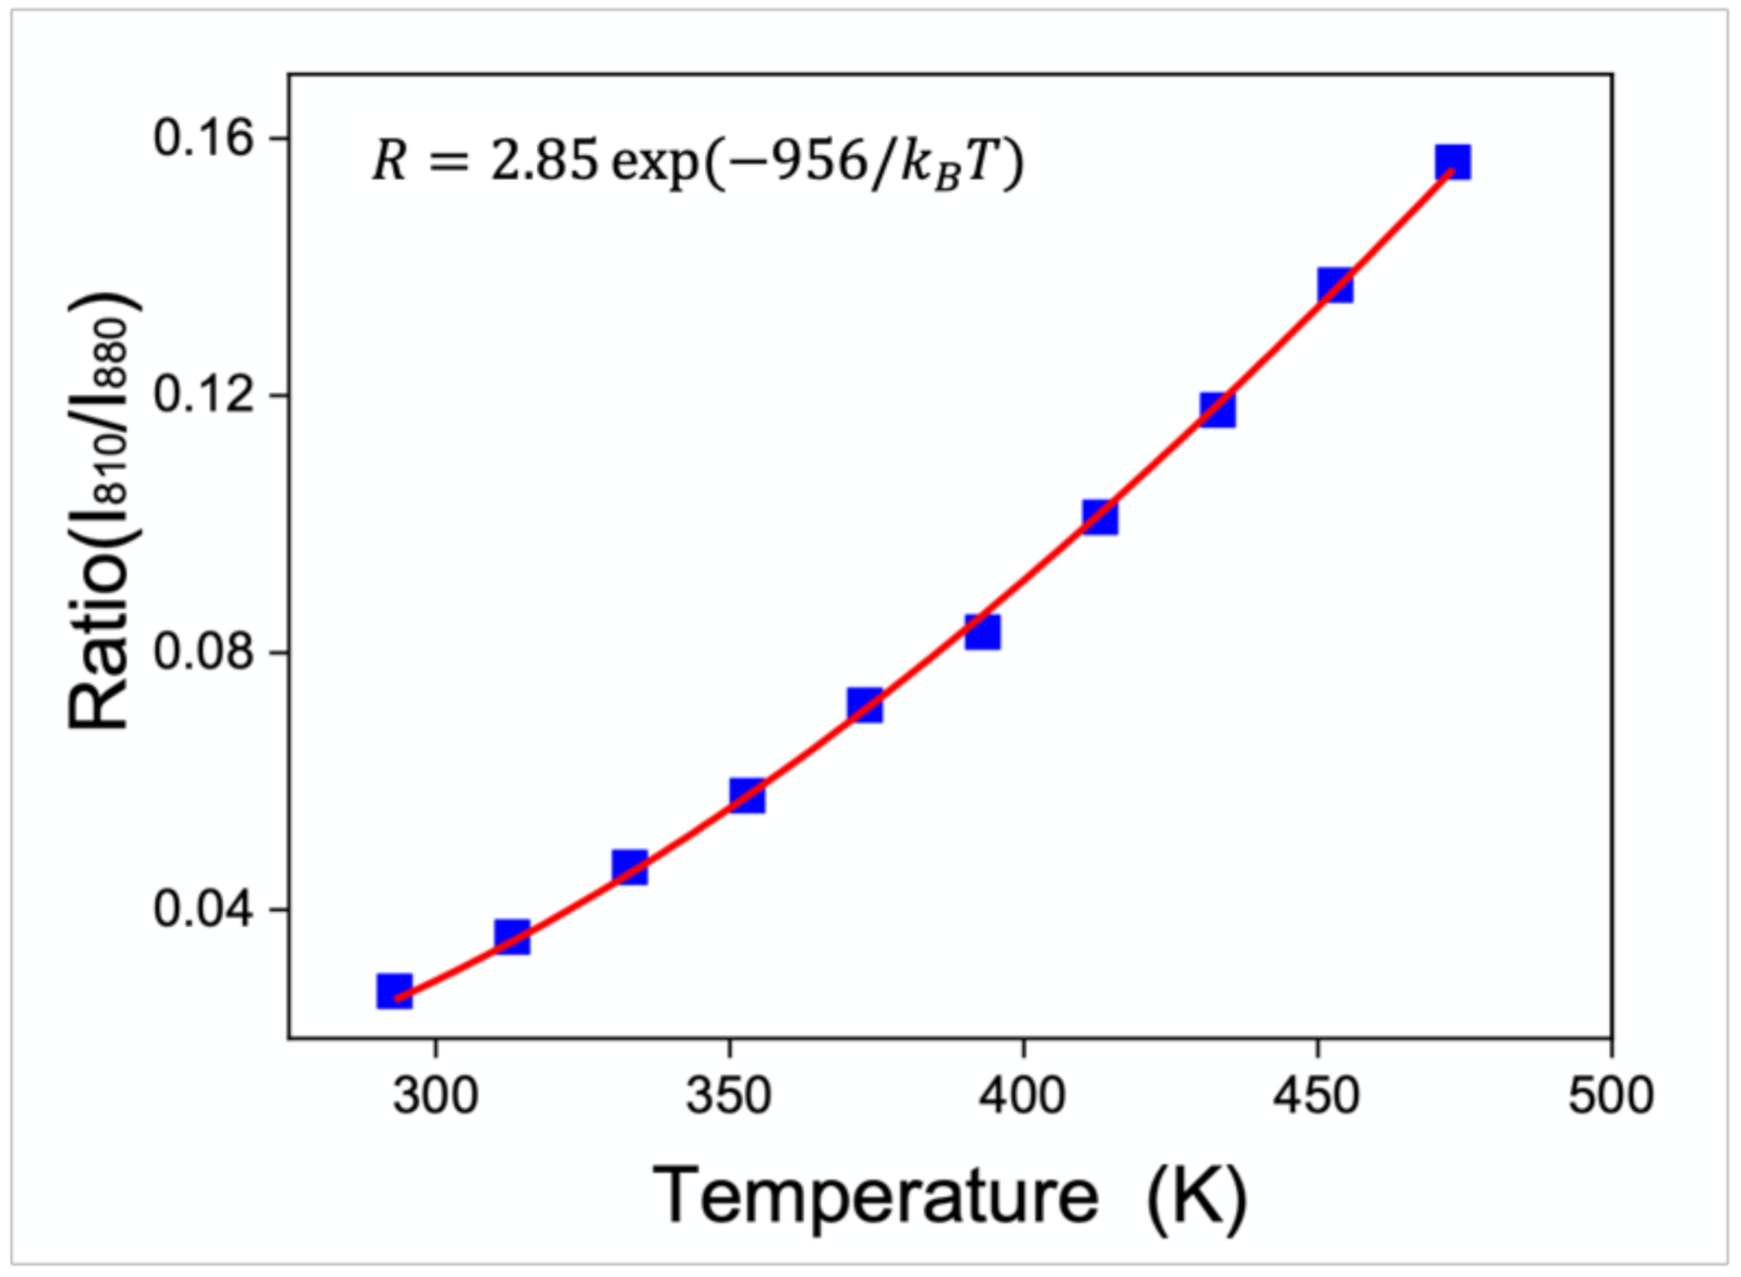
To be able to determine the temperature of the microspheres, a temperature calibration of the bulk sample was previously performed using the FIR technique. Since the 4F5/2 and 4F3/2 energy levels of Nd3+ ions are very close to each other, the 4F5/24I9/2 (810 nm) and 4F3/24I9/2 (880 nm) transitions are thermally coupled, and their populations follow a Boltzmann distribution law; hence, the ratio of the intensities of these emissions follows the temperature dependence given by Equation (1).
The experimental values obtained for the intensity ratio of the emission bands of the bulk sample are plotted in Figure 4 and fitted to Equation (1), obtaining a value of 956 cm−1 for the energy gap E32 and a pre-exponential parameter B with a value of 2.85. The value for the energy gap is similar to the value of 1053 cm−1 obtained by calculating the energy difference between the maximums of the bands in the absorption spectrum of the sample (see Supplementary Figure S1).
In order to characterize the performance of the FIR technique, the sensitivity was calculated applying Equation (5). A maximum value of SFIR = 1.6 × 10⁻² K−1 at the lowest temperature in the measured range was obtained. This yields to a temperature resolution in the order of 3 K using Equation (7) if an error of 5% in the calculation of the ratio is assumed. This error is due to the inaccuracy of the calculated areas because of the overlap between the thermalized bands.
Using this calibration, the temperature of the microspheres were obtained in the incoming results by calculating the ratio of the intensities of the emission bands from the thermally coupled levels. This was possible because the microspheres were made of the same material as the bulk sample used for the temperature calibration, and hence the 810 nm and 880 nm emission bands of Nd3+ ions in the microspheres presented the same changes with temperature.

4.3. Displacement of the WGM

The emission spectrum shown in Figure 3 was obtained for different laser powers. As a consequence, two different effects related to the laser heating of the microsphere were observed. The first one was the difference of the ratio of the intensities from the 4F5/2 and the 4F3/2 to 4I9/2 emissions due to the thermal redistribution of population. This made it possible to obtain the temperature of the microsphere using the thermal calibration obtained in the previous section, under the assumption that the WGM resonances do not affect the overall shape of the emission band.
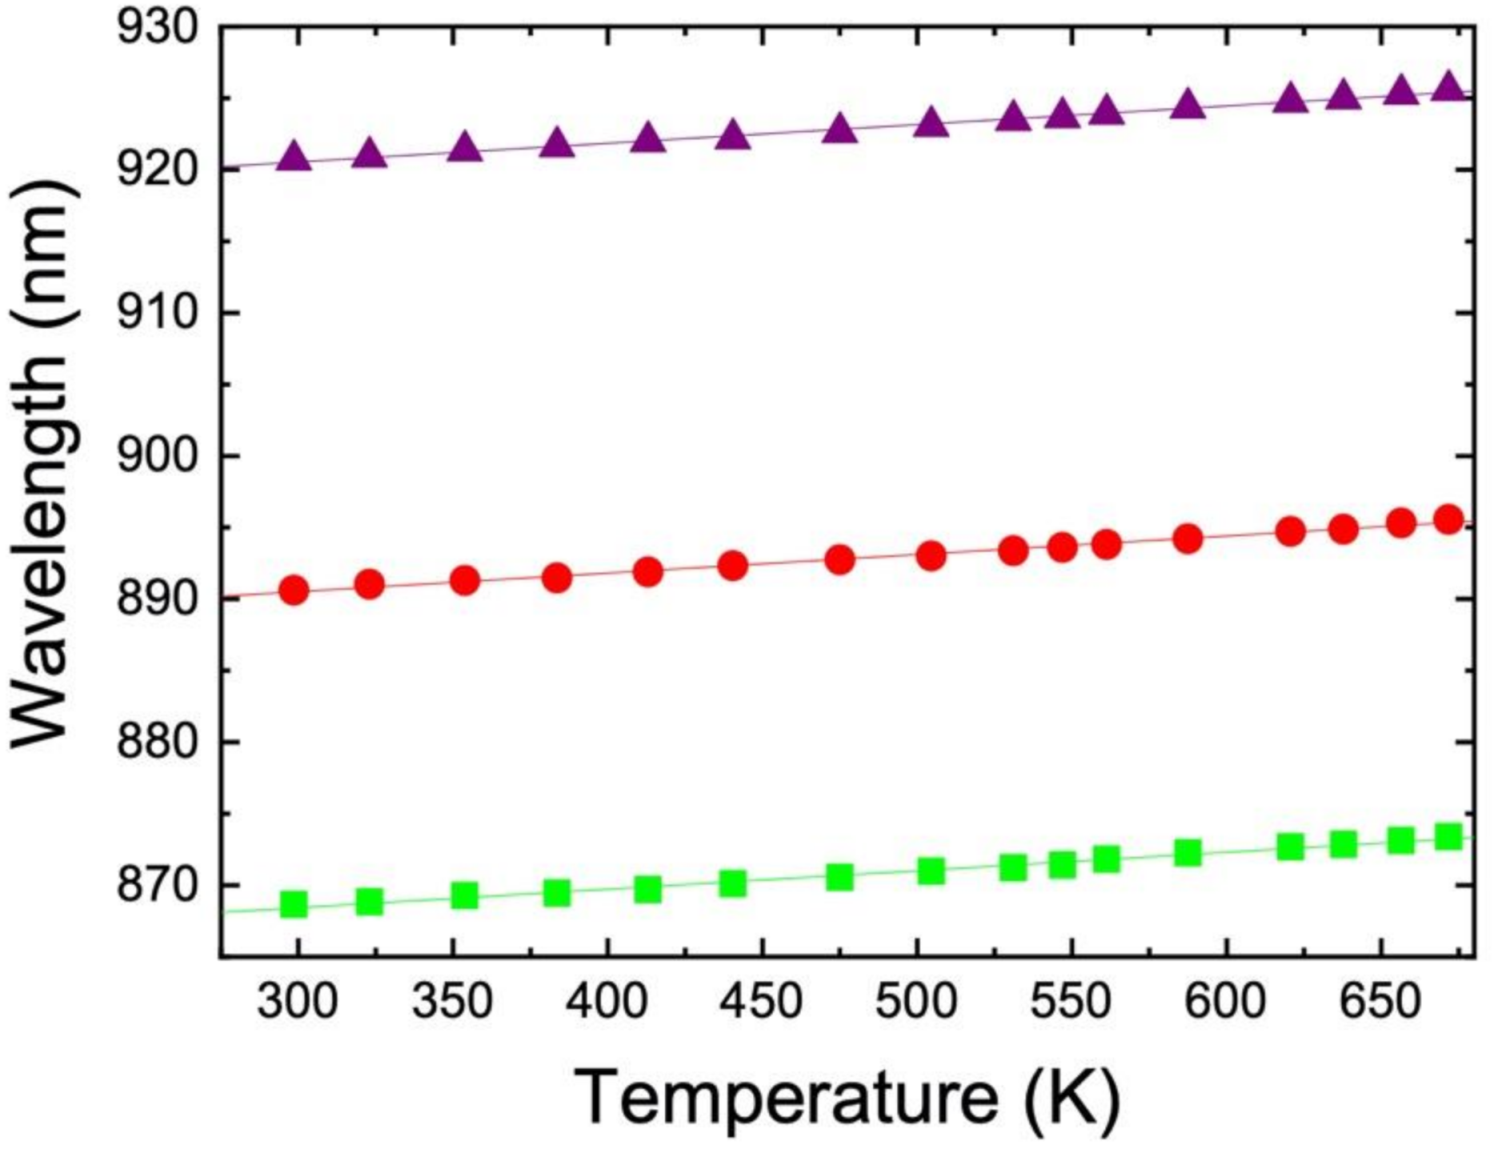
The second one was the redshift of the WGM. Thereby, a study of the displacement of the WGM as a function of temperature could be performed. The shift of the resonances could be explained as follows: due to laser heating, the volume of the sphere and the refraction index increased, and as a consequence, the wavelengths of the WGMs changed according to Equation (3). As expected, a linear red shift of the wavelength of the WGM was observed, as shown in Figure 5.
From the measurements of the wavelength displacements corresponding to the maxima of three WGM resonances, plotted in Figure 5, an average displacement rate of 12.9 pm/K was obtained for the 890 nm band. Higher values of the shifts were obtained for the peaks in the 1300 nm band, averaging 17.5 pm/K.
To compare this method with the FIR technique, the sensitivity of the wavelength displacement was calculated using Equation (6), and a maximum relative sensitivity of 15 × 10−6 K−1 was obtained at the lowest temperature in the measured range.
The WGM limit of resolution of the resonant wavelength is about 1% of its linewidth [21,22]. The narrowest linewidth observed in the emission spectra of the microspheres was about 0.3 nm in the 1300 nm band. Using these values in Equation (8), the temperature resolution is in the order of 0.2 K. Therefore, the resolution of the WGM technique is one order of magnitude higher than that of the FIR technique.

4.4. Laser Emission

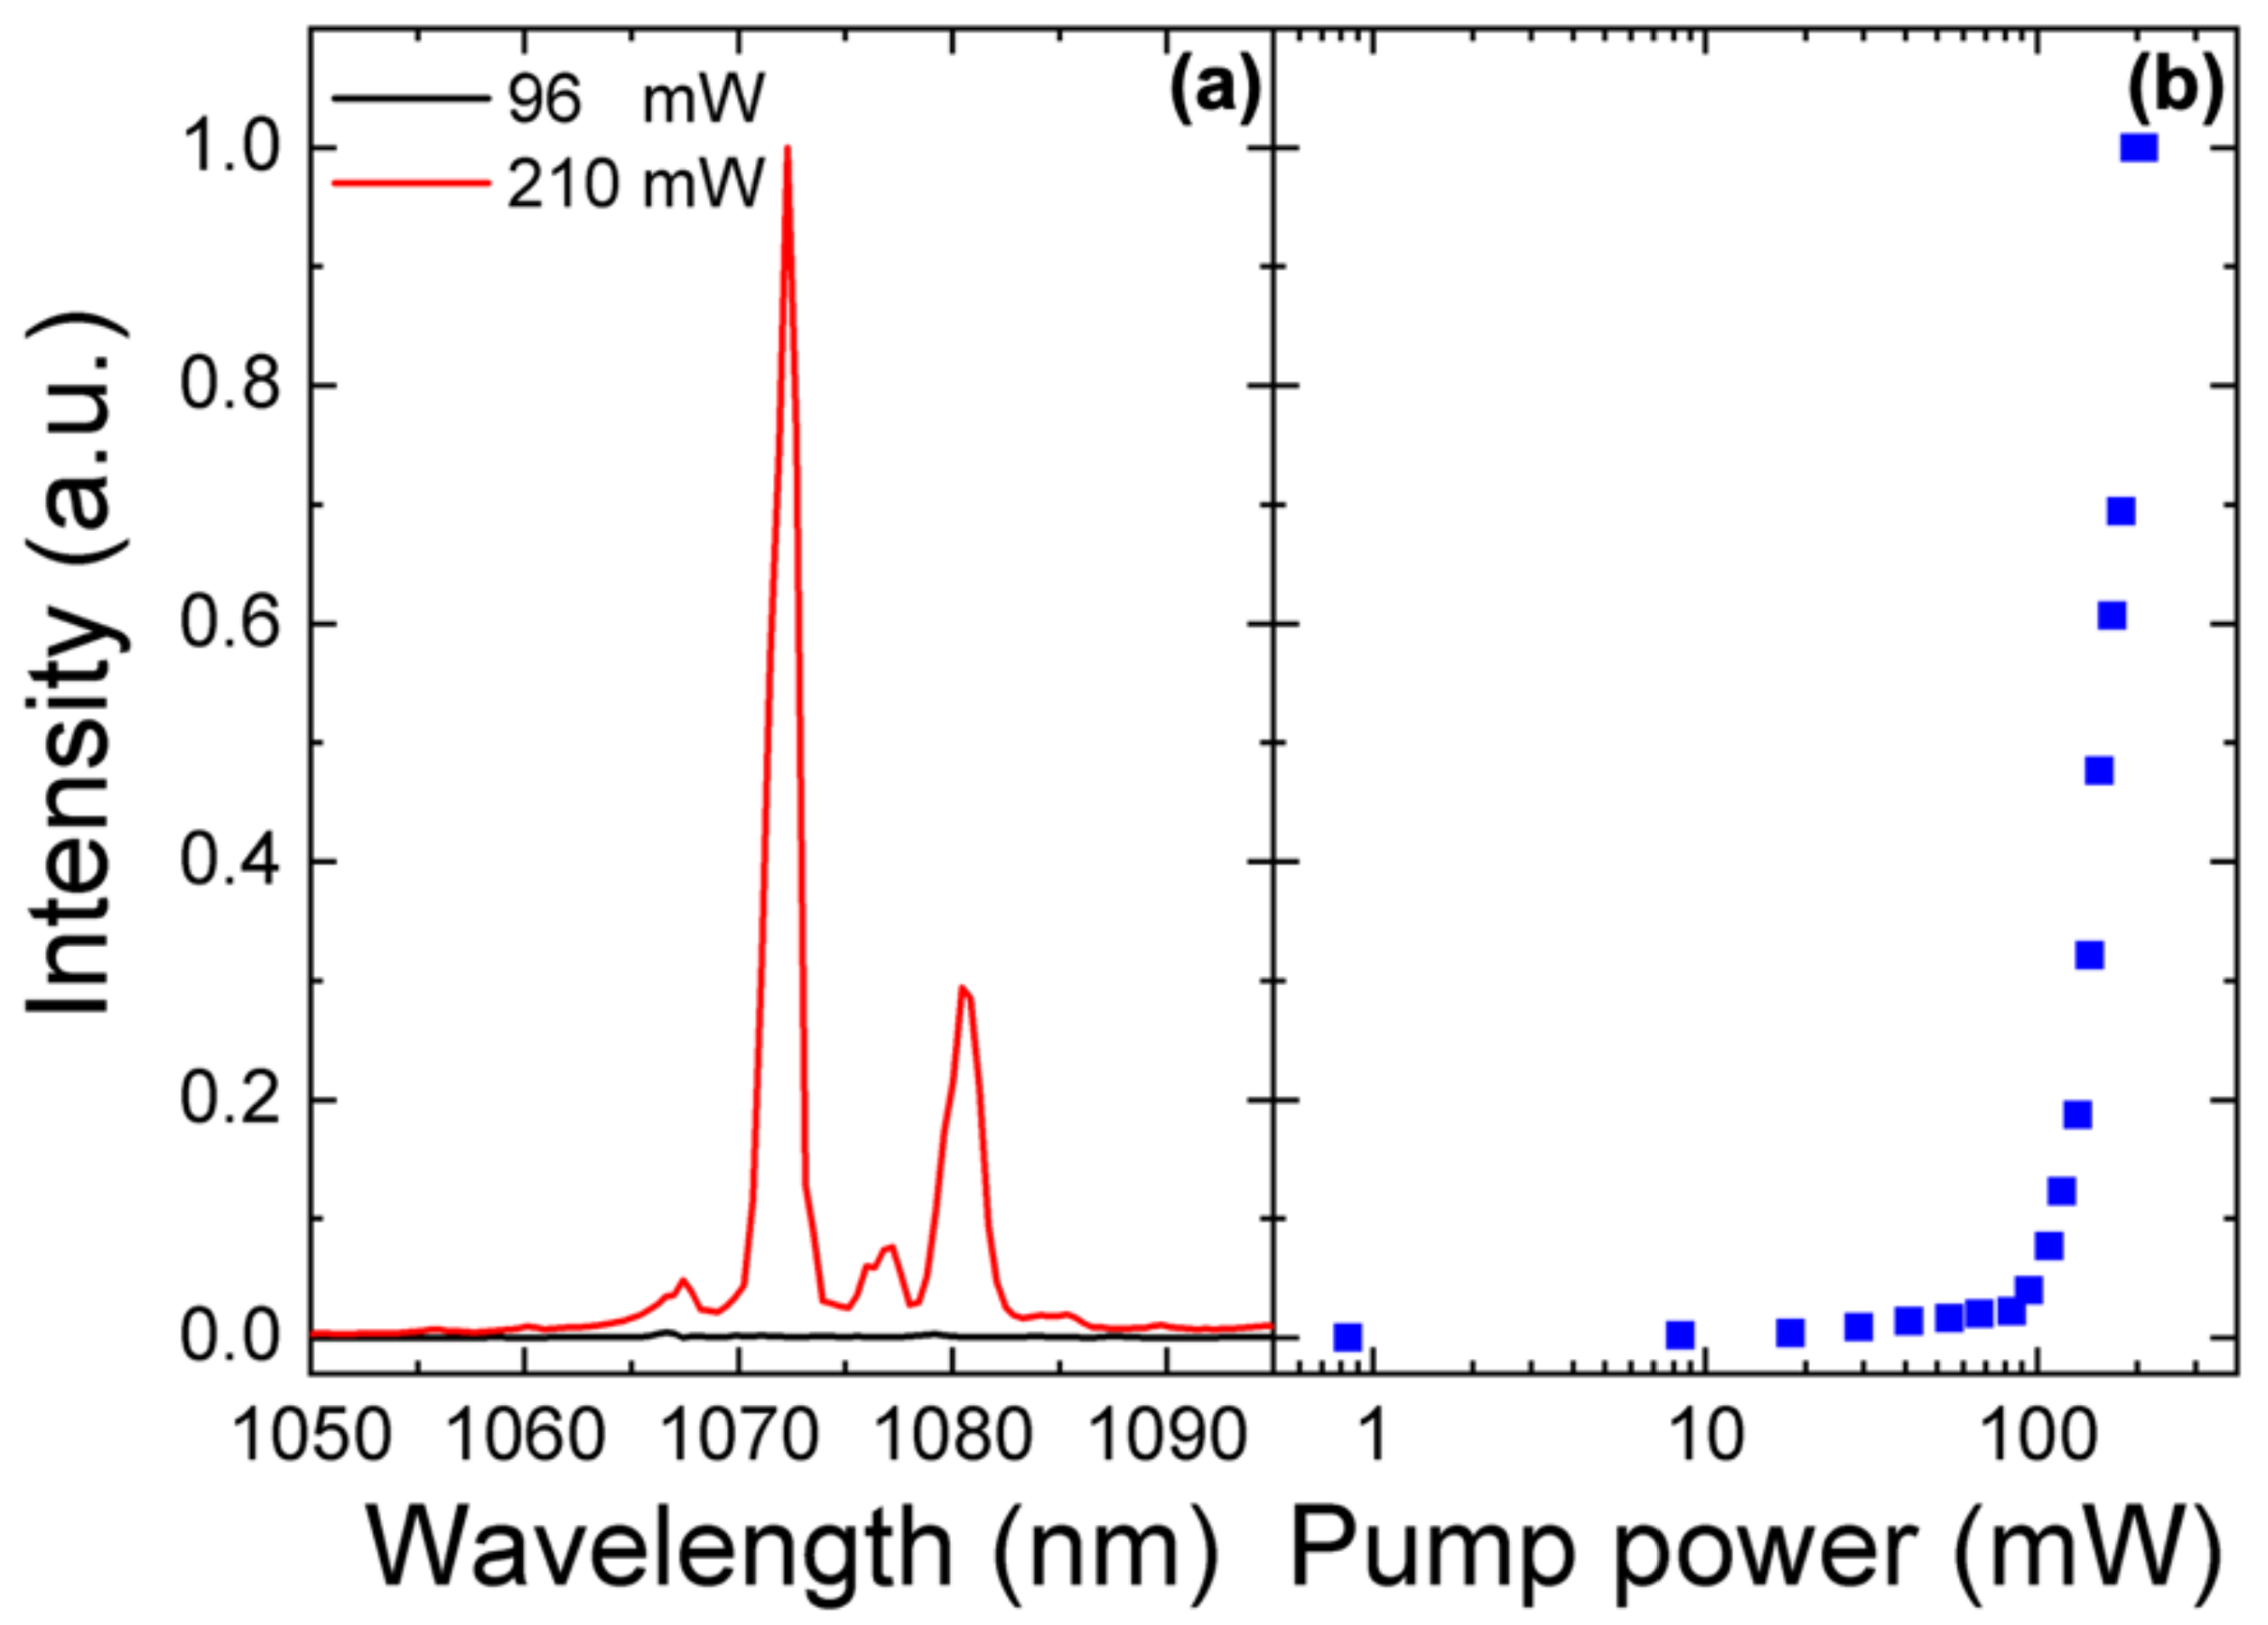
Neodymium behaves as a four-level system because it has two non-radiative and one radiative transition in the 4F5/24F3/24I11/24I9/2 de-excitation process. When population inversion occurs (i.e., the number of ions in the 4F3/2 level is larger than in the 4I11/2 level), and the resonator internal gain is greater than the passive losses, the 4F3/24I11/2 transition produces multimode laser emission at the 1064 nm band, as observed in Figure 6a.
By analyzing the behavior of the most intense peak (1072 nm) as a function of the pumping power (shown in Figure 6b), the laser threshold power was determined to be 100 mW.
It is possible to reduce the laser threshold by changing the wavelength of the pumping laser to 808 nm. Neodymium ions absorb more efficiently at this wavelength than the 532 nm employed. Moreover, the 808 nm radiation directly connects the 4I9/2 and 4F5/2 levels, decreasing the losses due to non-radiative de-excitation mechanisms. A decrease of at least about 34% in the laser threshold is estimated.

4.5. Upconversion

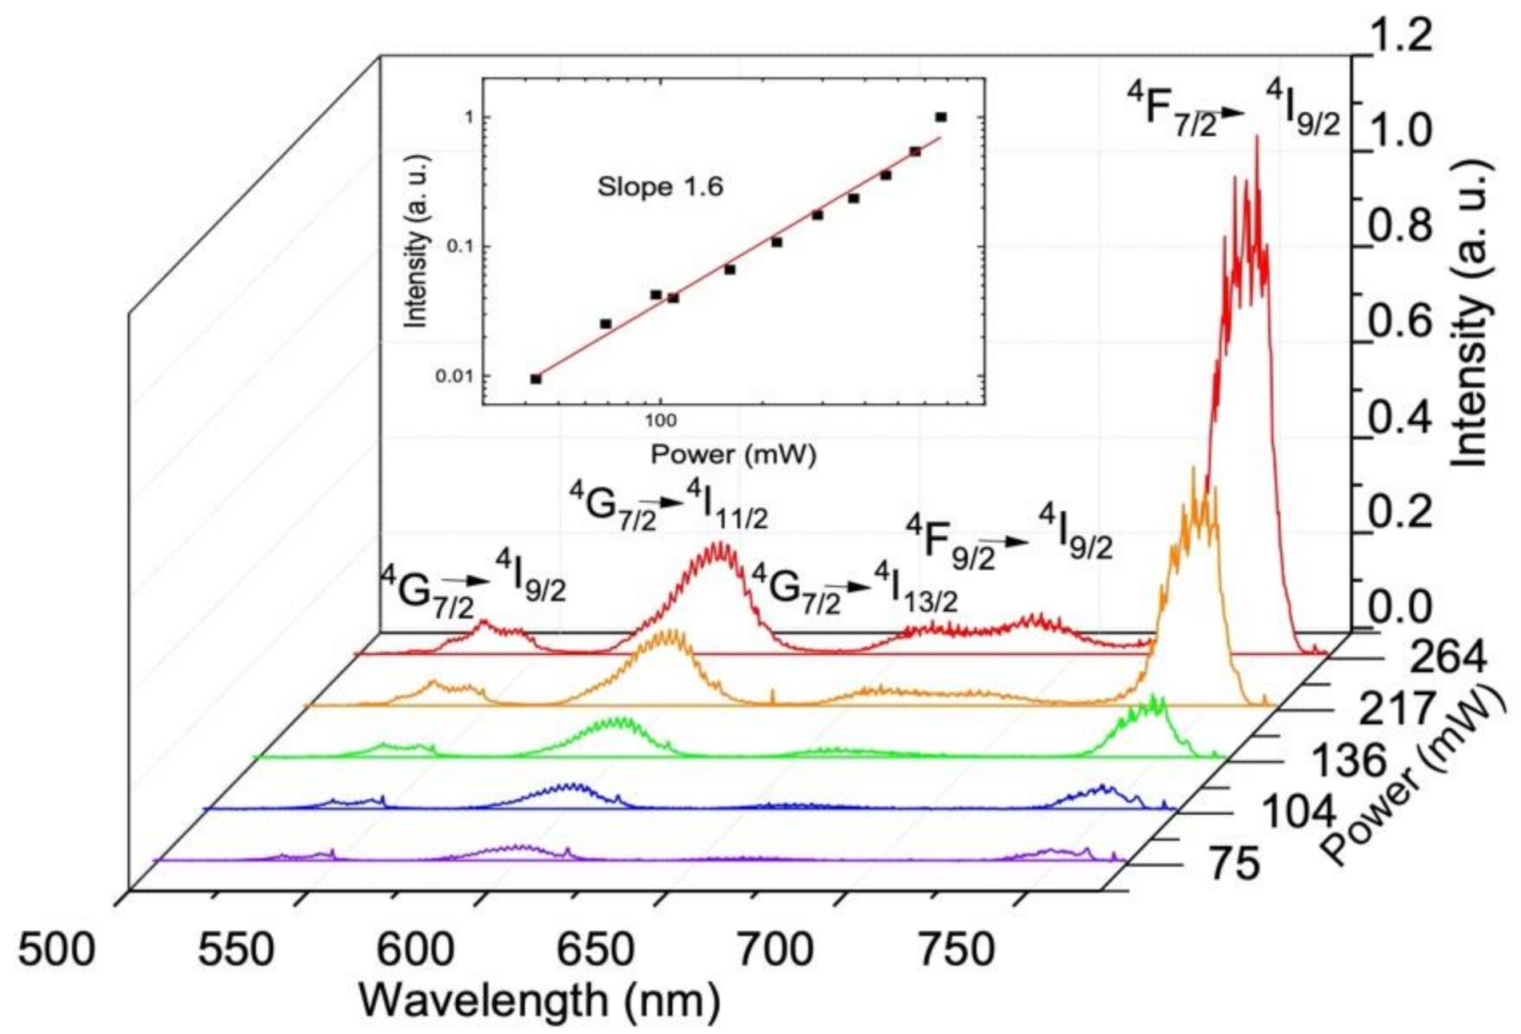
Photon upconversion (UC) is the process whereby the absorption of two or more photons produces the emission of a photon with a shorter wavelength than the wavelength of the excitation photons. To observe the upconversion emission, the microspheres were excited with a continuous wave 808 nm laser. This emission is shown in Figure 7. The first three bands correspond to transitions from the 4G7/2 level to the 4I9/2, 4I11/2, and 4I13/2 levels, respectively. The 4G7/24I13/2 emission band is overlapped with the 4F9/24I9/2 emission band. The last emission band corresponds to the 4F7/24I9/2 and is cut due to the presence of a 750 nm short-pass filter.
The intensities of the last two bands increase at higher rates than the shorter wavelength bands. This shows that these levels are not being populated by the same mechanisms as the other bands. Attending to the increase of intensity with the pumping power, it is observed that these bands are being populated by thermal redistribution mechanisms following a Boltzmann distribution as shown in the latter section. The laser heating of the sample is also expected to reduce the upconversion efficiency due to the increase in non-radiative relaxation mechanisms.
A plot of the intensity of the upconversion emission for the 4G7/24I11/2 band as a function of the intensity of the excitation source in a logarithmic scale is shown in the inset of Figure 7. A straight line with a slope of 1.6 has been obtained from the fit. This result indicates that two infrared photons of 808 nm wavelength are required to produce the upconversion emission.
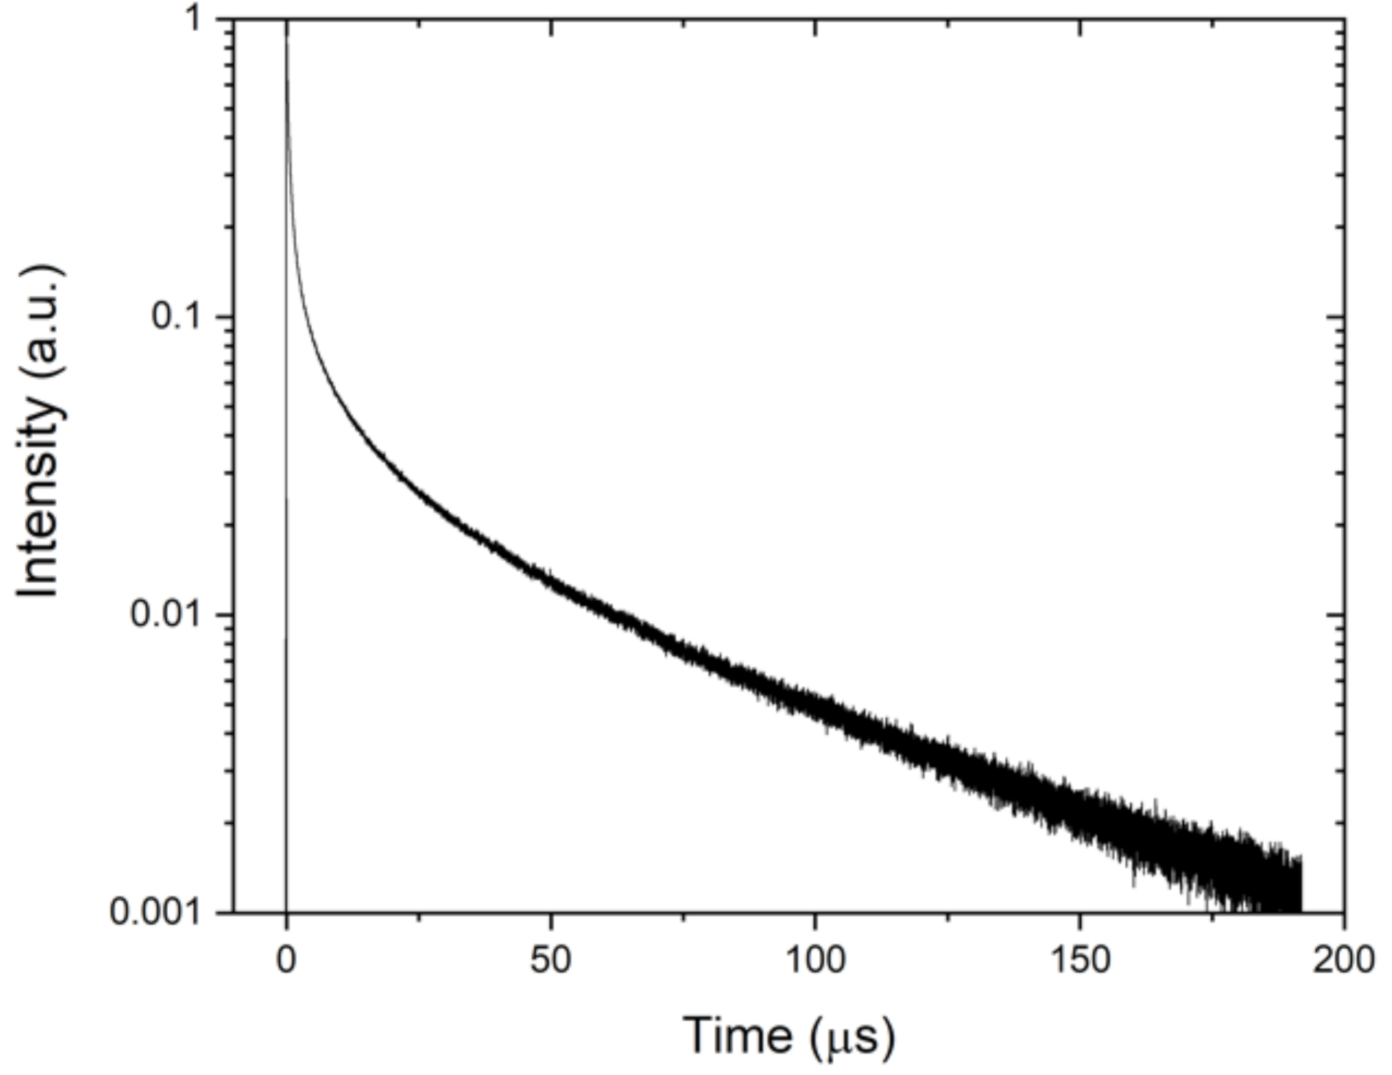
Upconversion emission can be obtained mainly via two distinct mechanisms: energy transfer upconversion (ETU) and excited state absorption (ESA) [23]. If it is by the ETU process, the population of the upper level increases, even if there is no external radiation, as the atoms from the intermediate level are promoted, and slowly decreases once the maximum is reached. On the other hand, if the upconversion is obtained by ESA, the intensity of the emission quickly decays when there is no external radiation. The upconversion mechanism that produces the emissions from 4G7/2 is illustrated in Figure 1. The ESA process involves the subsequent absorption of two photons of a single Nd3+ ion such that the following promotion occurs: 4I9/24F3/22D5/2. This is followed by a non-radiative multiphonon relaxation to the 4G7/2 level. Meanwhile, the ETU process involves the absorption of photons by different Nd3+ ions giving rise to an ion in the 4G7/2 through the non-radiative energy transfer between these ions. One of the possible ETU mechanisms is illustrated in Figure 1, while other examples can be found in Reference [24]. In order to understand the upconversion mechanism occurring in the sample, the temporal evolution of the 530 nm band under the excitation of an 808 nm pulsed laser was measured, as shown in Figure 8. It shows an instantaneous increase with a rise time of 20 ns, a similar value to the response time of the acquisition setup described in Section 3.3, and a decay with a fast and a slow component. The fast component is due to the natural decay rate of the 4G7/2 level, and the slow component is due to the decay rate of the 4F3/2 level, which is twice that of the 4G7/2 level [25]. An exponential decay fit of the experimental curve from 0.02 to 1.5 µs for the fast component and from 50 µs onwards for the slow component were performed: I = 0.922   exp   t / 0.54 and I = 0.0298   exp   t / 56 , respectively. This gives a value of short-lifetime component of 0.54 µs and a long-lifetime component of 56 µs. A mixture of ESA and ETU is therefore proposed as the upconversion mechanism in this sample.

5. Conclusions

The FIR technique was employed on the 808 nm and 890 nm emissions of the YAS: Nd3+ doped bulk glass to obtain a temperature calibration with the intensity ratios. An energy gap of 956 cm−1 was obtained from the fit, in good agreement with the gap obtained from the absorption spectrum (E32 = 1053cm−1). This technique provided a maximum value for the sensitivity of 1.60 ×10⁻² K−1 and a temperature resolution limit of 3 K. On the other hand, the heating effects in a microsphere due to the laser source at 532 nm were studied by observing the displacement of the WGM peaks and determining the temperature using the FIR temperature calibration previously obtained. A maximum sensitivity value of 15 × 10−6 K−1 and a temperature resolution limit of 0.2 K were obtained. This shows that the WGM displacement technique is an order of magnitude more accurate than the FIR technique. Moreover, with the microsphere acting as both a resonant cavity and a gain medium, laser emission was also observed under continuous pump in the emission band of 4F3/24I11/2 (1064 nm) of Nd3+ ions, and a threshold power of 100 mW was determined. Furthermore, under 808 nm laser excitation, upconversion emissions were also observed on the microspheres. The emission bands were identified as 4G7/24I9/2 (530 nm), 4G7/24I11/2 (579 nm), 4G7/24I13/2 (675 nm), 4F9/24I9/2 (690 nm), and 4F7/24I9/2 (750 nm). It was found that the first three bands were upconversion transitions requiring two photons, while the other two were being populated by thermalization effects. Finally, the measurement of the temporal evolution of the upconversion emission showed that a mixture of ESA and ETU mechanisms are necessary to produce these upconversion processes.

Supplementary Materials

The following are available online at https://www.mdpi.com/2076-3417/11/3/1117/s1, Figure S1: Absorption spectrum of YAS:Nd3+.

Author Contributions

Conceptualization, S.R. and I.R.M.; methodology, D.W.-M., F.P.-B., I.R.M., and L.L.M.; validation, D.W.-M., S.R., and I.R.M.; investigation, D.W.-M., F.P.-B., A.R., and I.R.M.; resources, I.R.M., V.N.S., V.I.S., and G.Y.S.; data curation, D.W.-M., F.P.-B., and I.R.M.; writing—original draft preparation, D.W.-M. and F.P.-B.; writing—review and editing, F.P.-B., I.R.M., L.L.M., and A.R.; project administration, I.R.M.; funding acquisition, I.R.M., L.L.M., A.R., and V.N.S. All authors have read and agreed to the published version of the manuscript.

Funding

This research was funded by the Russian Science Foundation (Grant No. 19-19-00613), the Spanish MINECO (MAT2015-71070-REDC, MAT2016-75586-C4-4-P, FIS2016-77319-C2-1-R, PID2019-106383GB-C44, and PID2019-107335RA-I00), and EU-FEDER funds. L.L.M. and A.R. acknowledge support from the Spanish Juan de la Cierva program (IJCI-2016-30498) and the Spanish Ramón y Cajal program (RYC-2017-21618), respectively.

Conflicts of Interest

The authors declare no conflict of interest.

References

  1. Jensen, E.C. Use of fluorescent probes: Their effect on cell biology and limitations. Anat. Rec. Adv. Integr. Anat. Evol. Biol. 2012, 295, 2031–2036. [Google Scholar] [CrossRef]
  2. Medintz, I.L.; Uyeda, H.T.; Goldman, E.R.; Mattoussi, H. Quantum dot bioconjugates for imaging, labelling and sensing. Nat. Mater. 2005, 4, 435–446. [Google Scholar] [CrossRef]
  3. Bünzli, J.-C.G. Lanthanide luminescence for biomedical analyses and imaging. Chem. Rev. 2010, 110, 2729–2755. [Google Scholar] [CrossRef]
  4. Horrocks, W.D.; Sudnick, D.R. Lanthanide ion luminescence probes of the structure of biological macromolecules. Acc. Chem. Res. 1981, 14, 384–392. [Google Scholar] [CrossRef]
  5. Hyatt, M.J.; Day, D.E. Glass properties in the yttria-alumina-silica system. J. Am. Ceram. Soc. 1987, 70, C-283–C-287. [Google Scholar] [CrossRef]
  6. Jander, P.; Brocklesby, W.S. Spectroscopy of yttria-alumina-silica glass doped with thulium and erbium. IEEE J. Quantum Electron. 2004, 40, 509–512. [Google Scholar] [CrossRef] [Green Version]
  7. Zhang, Y.; Qian, G.; Xiao, X.; Tian, X.; Ding, X.; Ma, Z.; Yang, L.; Guo, H.; Xu, S.; Yang, Z.; et al. The preparation of yttrium aluminosilicate (YAS) glass fiber with heavy doping of Tm3+ from polycrystalline YAG ceramics. J. Am. Ceram. Soc. 2018, 101, 4627–4633. [Google Scholar] [CrossRef]
  8. Jaque, D.; Vetrone, F. Luminescence nanothermometry. Nanoscale 2012, 4, 4301–4326. [Google Scholar] [CrossRef]
  9. Pérez-Rodríguez, C.; Martín, L.L.; León-Luis, S.F.; Martín, I.R.; Kumar, K.K.; Jayasankar, C.K. Relevance of radiative transfer processes on Nd3+ doped phosphate glasses for temperature sensing by means of the fluorescence intensity ratio technique. Sens. Actuators B Chem. 2014, 195, 324–331. [Google Scholar] [CrossRef]
  10. Martín, L.L.; Haro-González, P.; Martín, I.R.; Navarro-Urrios, D.; Alonso, D.; Pérez-Rodríguez, C.; Jaque, D.; Capuj, N.E. Whispering-gallery modes in glass microspheres: Optimization of pumping in a modified confocal microscope. Opt. Lett. 2011, 36, 615–617. [Google Scholar] [CrossRef]
  11. Wade, S.A. Temperature measurement using rare earth doped fibre fluorescence. Victoria 1999. Available online: https://www.researchgate.net/publication/45786919_Temperature_measurement_using_rare_earth_doped_fibre_fluorescence (accessed on 29 December 2020).
  12. Wade, S.A.; Collins, S.F.; Baxter, G.W. Fluorescence intensity ratio technique for optical fiber point temperature sensing. J. Appl. Phys. 2003, 94, 4743. [Google Scholar] [CrossRef]
  13. Collins, S.F.; Baxter, G.W.; Wade, S.A.; Sun, T.; Grattan, K.T.V.; Zhang, Z.Y.; Palmer, A.W. Comparison of fluorescence-based temperature sensor schemes: Theoretical analysis and experimental validation. J. Appl. Phys. 1998, 84, 4649–4654. [Google Scholar] [CrossRef]
  14. Yutian, W.; Likun, G. Rare earth doped optical fibers for temperature sensing utilizing ratio-based technology. J. Rare Earths 2006, 24, 171–174. [Google Scholar] [CrossRef]
  15. Vahala, K.J. Optical microcavities. In Proceedings of the 2005 European Quantum Electronics Conference, EQEC ’05, Munich, Germany, 12–17 June 2005. [Google Scholar]
  16. Matsko, A.B.; Savchenkov, A.A.; Strekalov, D.; Ilchenko, V.S.; Maleki, L. Review of applications of whispering-gallery mode resonators in photonics and nonlinear optics. IPN Prog. Rep. 2005, 42. Available online: http://engineering.nyu.edu/mechatronics/Control_Lab/Padmini/WGMLitSurvey/WGMReview.pdf (accessed on 29 December 2020).
  17. Zhu, J.; Özdemir, Ş.K.; Yilmaz, H.; Peng, B.; Dong, M.; Tomes, M.; Carmon, T.; Yang, L. Interfacing whispering-gallery microresonators and free space light with cavity enhanced Rayleigh scattering. Sci. Rep. 2015, 4, 6396. [Google Scholar] [CrossRef] [Green Version]
  18. Sanditov, D.S.; Sydykov, B.S. Modulus of elasticity and thermal expansion coefficient of glassy solids. Phys. Solid State 2014, 56, 1006–1008. [Google Scholar] [CrossRef]
  19. Ma, Q.; Rossmann, T.; Guo, Z. Temperature sensitivity of silica micro-resonators. J. Phys. D Appl. Phys. 2008, 41. [Google Scholar] [CrossRef]
  20. Atroshchenko, G.N.; Sigaev, V.N. Glassy microspheres and their applications in nuclear medicine (review). Glas. Ceram. 2016, 72, 397–404. [Google Scholar] [CrossRef]
  21. Vollmer, F.; Arnold, S. Whispering-gallery-mode biosensing: Label-free detection down to single molecules. Nat. Methods 2008, 5, 591–596. [Google Scholar] [CrossRef]
  22. Arnold, S.; Ramjit, R.; Keng, D.; Kolchenko, V.; Teraoka, I. MicroParticle photophysics illuminates viral bio-sensing. Faraday Discuss. 2008, 137, 65–83. [Google Scholar] [CrossRef]
  23. Méndez-Ramos, J.; Abril, M.; Martín, I.R.; Rodríguez-Mendoza, U.R.; Lavín, V.; Rodríguez, V.D.; Núñez, P.; Lozano-Gorrín, A.D. Ultraviolet and visible upconversion luminescence in Nd3+-doped oxyfluoride glasses and glass ceramics obtained by different preparation methods. J. Appl. Phys. 2006, 99, 113510. [Google Scholar] [CrossRef]
  24. Som, T.; Karmakar, B. Green and red fluorescence upconversion in neodymium-doped low phonon antimony glasses. J. Alloy. Compd. 2009, 476, 383–389. [Google Scholar] [CrossRef]
  25. Gamelin, D.R.; Gudel, H.U. Upconversion Processes in Transition Metal and Rare Earth Metal Systems, In Transition Metal and Rare Earth Compounds; Springer: Berlin, Germany, 2001; pp. 1–56. [Google Scholar]
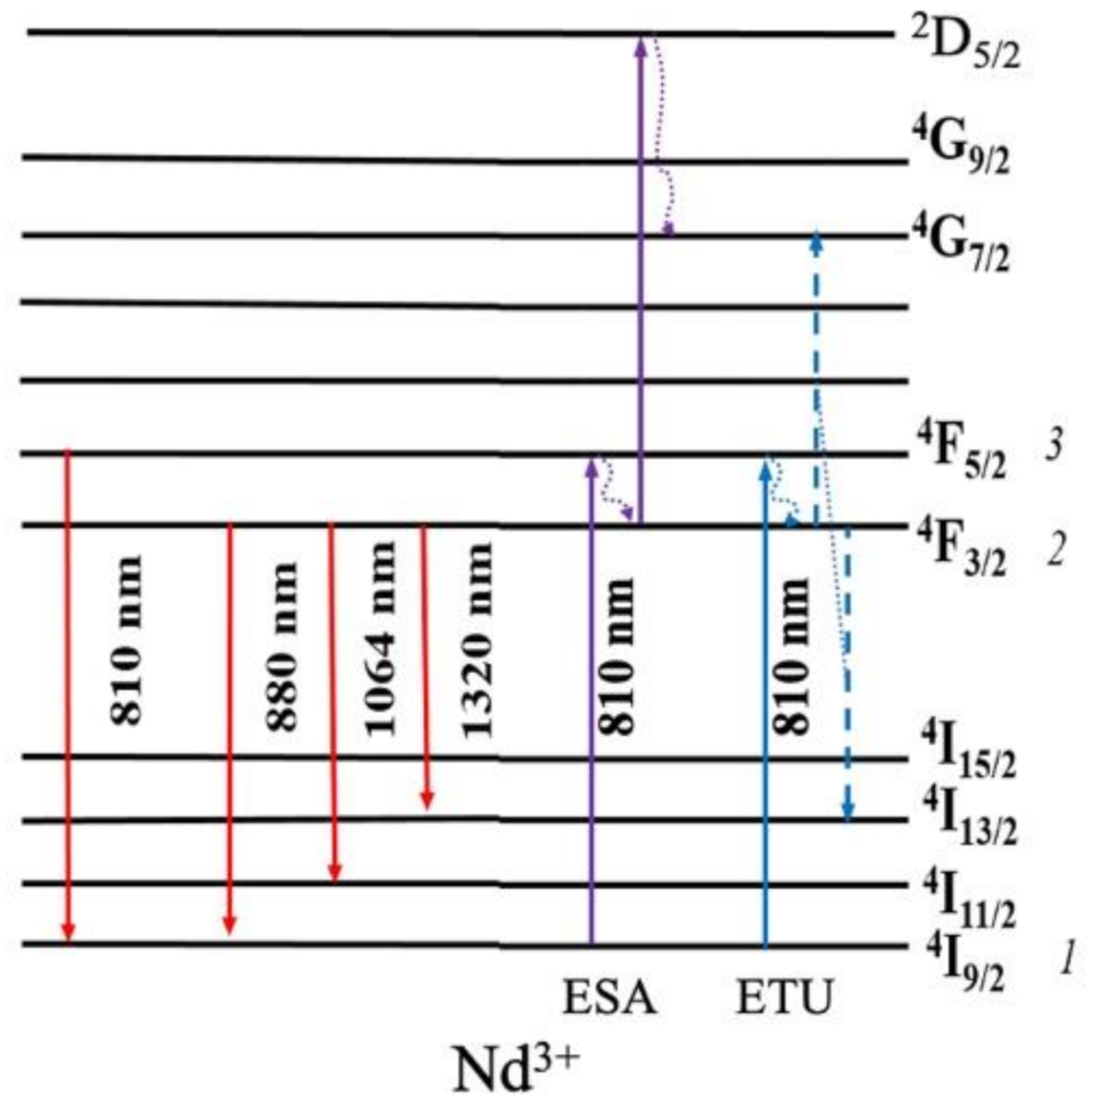
Figure 1. Schematic energy level diagram of Nd3+ ions indicating the near-infrared emissions obtained under visible excitation and the different upconversion mechanisms for the 4G7/2 emissions.
Applsci 11 01117 g001
Figure 2. Wavelength displacement of a whispering gallery mode (WGM) resonance at different temperatures in the emission spectrum of YAS:Nd3+.
Applsci 11 01117 g002
Figure 3. Spectra showing the whispering gallery modes overlapped with the Nd3+ emission under 532 nm laser excitation and 119 mW pump power and sample temperature at 399 K.
Applsci 11 01117 g003
Figure 4. Experimental values of the ratio of the intensities between the thermalized bands of Nd3+ obtained from the bulk sample inside an electrical furnace (blue squares), and fitted curve to Equation (1) (solid red line).
Applsci 11 01117 g004
Figure 5. Displacement of three WGM peaks as a function of temperature.
Applsci 11 01117 g005
Figure 6. (a) Emission spectra of a YAS:Nd3+ microsphere at pump powers below the laser threshold (black line) and above the threshold (red line); (b) intensity of the 1072 laser emission at different pump powers.
Applsci 11 01117 g006
Figure 7. Upconversion emission spectra of Nd3+ ions inside a microsphere obtained at different pump powers. WGM resonances appear superimposed on these emissions. Inset: dependence of the upconversion emission at 579 nm with the excitation power.
Applsci 11 01117 g007
Figure 8. Temporal evolution of the upconversion emission of 530 nm of Nd3+ ions.
Applsci 11 01117 g008
Publisher’s Note: MDPI stays neutral with regard to jurisdictional claims in published maps and institutional affiliations.