1. Introduction
Identification of the requested well-being of dairy herd as well as recognition of heat requires application of modern measuring methods [
1]. In addition to the above, it is worth mentioning that this process is subject to research and constant cognition, which is presented widely in the literature that is available [
1,
2,
3]. The physiological condition of a given animal depends on numerous external factors and can change as an animal grows old. There are numerous examples and evidence showing that there are substantial gaps in the environmental conditions of dairy herd in the systems of animal breeding that are currently offered and created by humans [
4,
5,
6,
7]. The given systems are diversified in comparison with the automated milking houses where cattle are kept in the building all year round in contrast with extensive areas of complexes where animals are outside animal houses all year round [
8,
9].
Proper diagnosis of the onset of heat, essential in the process of breeding dairy herds, allows to determine the right time of insemination—it is a key factor deciding about the results of reproduction. The systems try to improve the degree of cattle reproduction, which is often related to unnoticed or improper recognition of heat [
10,
11,
12].
Currently, there are numerous methods, which allow detection of heat condition, based on behaviorism or bio-technical methods. They are characterized by various probabilities of heat detection and they vary according to price. Among the bio-technical methods, on account of intense development of information technologies, one can observe an increased interest in the solution based on using pedometers (each animal in the herd is equipped with one such device). We can also observe attempts to use information from pedometers, to a greater extent, not only in a signaling context. At present, the systems that are offered and that are based on bio-technical methods and pedometers, which are available on the market, among other things, are the systems called GYUHO and AfiAct II [
13]. The first of them, offered by Japanese company Fujitsu, published in 2013, uses—apart from the aforementioned devices—a cloud compute engine. The application, which is part of the system, processes data from pedometers and then generates reports on the basis of these data that are sent via email to users. A slightly different information infrastructure is used by the other system AfiAct II, which is based on more modern pedometers known under the name AfiTag. The application called Windows Forms, which sends messages both in the form of email and sms, is responsible for processing data in this solution. According to the producer, cases in which heat is not properly detected constitute less than 10% of all the cases of heat detection. At present, motion detectors in the form of earrings, used to identify animal condition, are also available [
14]. However, it should be highlighted that these are dedicated constructions, so they are not of a universal nature, in contrast with beacons.
Another important aspect is the relation between atmospheric conditions, environmental conditions, and animal behavior [
15,
16,
17]. Research to date as well as observations show relations between motor activity of animals and temperature of the environment. According to different authors, deterioration of animal well-being, as a result of too high temperature, occurs when temperature of the environment exceeds the following:
However, the literature suggests that one should take into consideration not only temperature but also relative humidity in the air when defining the criterion of heat stress occurrence [
18]. In order to do that, the so called THI (temperature humidity index) parameter was constructed [
18]. On the basis of the research, the limiting value of this parameter was determined, which is 72, and each time this value is exceeded, one can observe the occurrence of heat stress in cattle.
Heat stress mainly results in the decrease of milk performance among milk cows. Depending on the value of THI coefficient, the decrease of milk performance of 20% to 50% can be observed when the THI coefficient exceeds the limiting value. Another disadvantageous results of heat stress are deterioration of calving rate and shortening the period of heat [
8,
19].
Another important aspect of undertaking this research topic was reference to the current directions of prioritizing organization development within the scope of supporting the processes of making strategic decisions with data available in digital format. Many times, this process is accompanied by discovering new regularities, which can be of cognitive nature. For quite some time, the use of numerous applications, supporting the functioning of agricultural enterprises, is becoming more and more common. Information potential that can be observed in the collected databases can be used, among other things, in decision-making process and cognitive process. However, it requires carrying out a lot of tasks, not fully determined, which leads to creation of data warehouses, among other things. On the basis of experiences from big organizations, it is clearly seen that the use of data warehouses is substantial added value. The current basis for building data warehouses were and still are users expectations, very often formulated in the form of questions, to which they would like to receive answers in a relatively short amount of time [
20].
By virtue of the above, in the authors’ view, replacing pedometers, and using data warehouses and microcomputers at the same time, seems to be a justified direction of perfecting these bio-technical methods. This solution offers much wider measuring possibilities via registering other physical quantities. In addition to the above, this solution ensures economical competitiveness at the same time [
21,
22]. Therefore, it seems justified to develop a new information technology solution, as well as a method based on beacons, which are rather universal devices, with the use of data warehouses, allowing the identification of behavior and the physiological state of milk cattle, the method which would be competitive in comparison with the existing solutions, especially in terms of price.
Micro-controllers equipped with BLE transmitters (Bluetooth Low Energy), known under the name of iBeacons or beacons, possessing the necessary potential for use, are inside the authors’ range of interest [
23].
That is why the basic aim of the research work is to devise a new information technology solution as well as the method based on beacons, which are universal tools, which together with data warehouses, allow identification of behavior and physiological condition of dairy cattle. This methods, which uses data coming from weather stations and weather service websites at the same time, would be competitive in comparison with the existing solutions.
2. Materials and Methods
2.1. Location and Animals
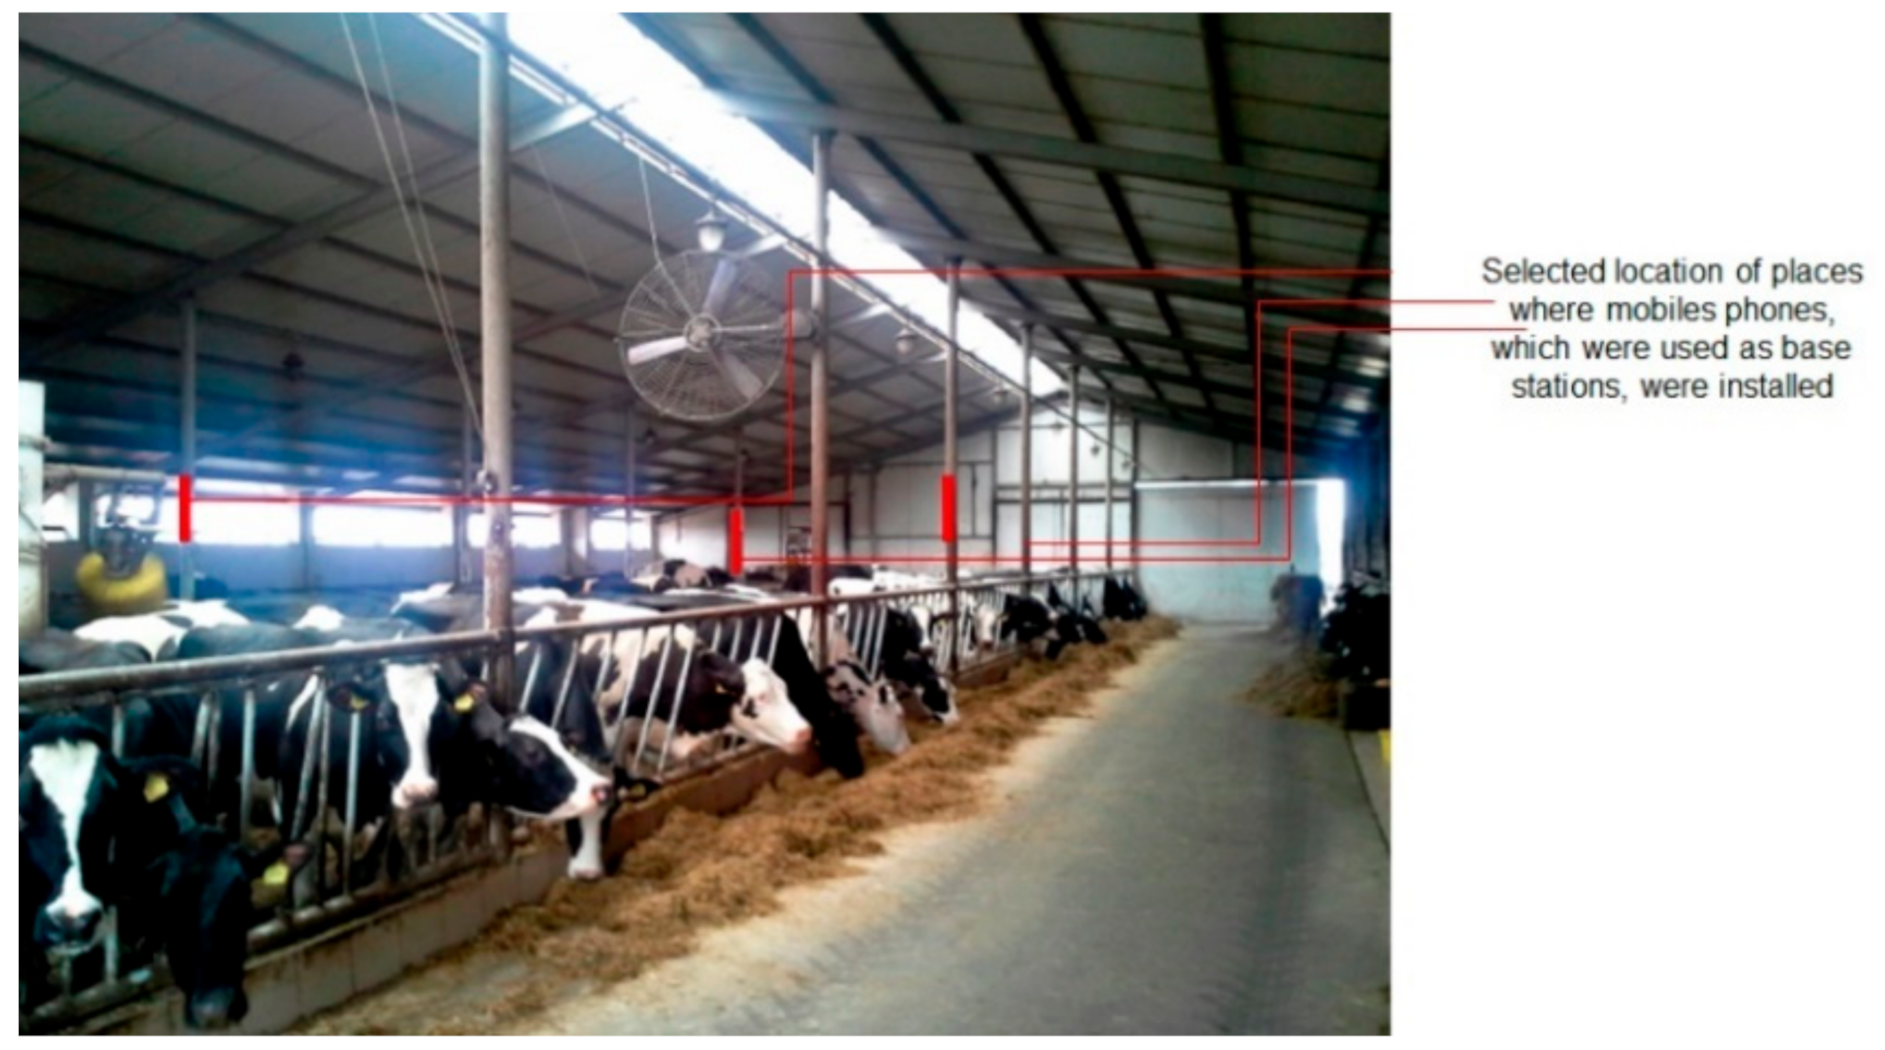
The research aimed at verification of the offered method, was conducted on the dairy-farm located in the village Zamysłów in the district of Stęszew in the county of Poznań. The farm consists of a cowshed characterized by free stalls. The building has a separated milking hall, in which milking takes place twice a day. Ten young cows (up to their third calving) were chosen randomly from the herd consisting of 50 HF milk cows (
Figure 1).
The animals were equipped with the beacons, which were attached to the collars with a protective pouch. Prior to conducting the research, places where smartphones were to be located had been mapped out. The smartphones acted as the receivers of signals sent by beacons. Another step was extension of technical infrastructure of the cowshed. Special attention was paid to ensuring continuous power supply to the base stations in order to guarantee continuous registration of signals coming from the beacons. During the initial tests, cellular network coverage and internet availability were verified. A decision was made to use direct data transfer via LTE/3G cellular network.
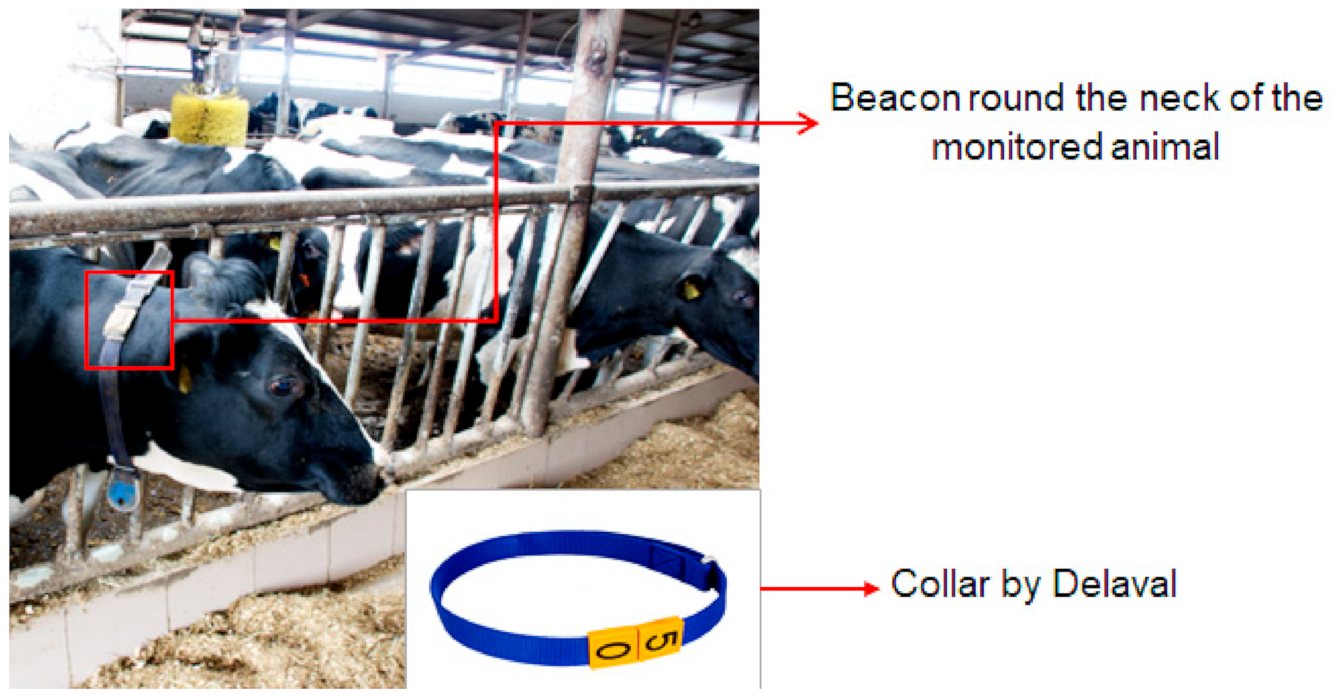
The (see
Figure 2) above picture shows the way beacons were attached to the collar. In order to ensure the same position of each beacon attached to the collar, special protective pouches with band clips were used. This way, it was possible to ensure a proper position of beacon in each pouch, which were then attached to the collars.
2.2. Data Acquisition
Data acquisition in the proposed solution is related to the two main sources of data. The first and the most important source is measurements taken from the beacons (
Figure 3). The second source, which is of equal status with the first source, is weather data, which is collected parallel with the measurements, from the network via independent software. Weather data that were used in creating an analytical base were shared via the selected internet service. Using the programming tool API, shared with the service:
http://api.openweathermap.org, a simple application was created, in the form of a script that allowed the transfer of those data. The script was started up automatically, every 5 min. As a result of its activity, we received weather data, which were the effect of processing measurements coming from weather stations located near the dairy farm. The basis for searching them were geographical coordinates determining the location of the dairy farm. Information shared via the aforementioned API is delivered in the popular format called JSON. The processed data were recorded in MySQL database, which supported this format. During the construction of this system in conformity with the first scenario, the 2014 version of SQL Server did not support this type of data.
2.3. The Concept and Infrastructure of the Created System
The information system that was designed and then created and that realizes the aim of the work, integrates different technologies. The first elements of the discussed system are beacons, units generating and sending data in definite time intervals. Signals that are sent are registered by smartphones, equipped with proper, original software, written for the individual needs of this paper. It uses libraries delivered by the producer of beacons. Data that are registered are saved in files on smartphone. Other elements of the system are the consequence of adopting two separate scenarios of their further processing. The first was based on Microsoft technologies, which was abandoned due to unsatisfactory efficiency tests. The time of data processing turned out to be too long. Technologies comprising the first scenario, apart from the solutions presented earlier are the following:
In the second scenario, a sufficient efficiency was ensured by applying Google Cloud and Google Docs technologies. In this case data were sent from smartphones to cloud calculator and were stored in Cloud Storage, and then were transferred to analytical bases designed and set up on BigQuery platform:
Estimote Beacons, Sticker model with Nordic chip.
Cellular phones—with original application.
Plane of data integration—original application.
Analytical database—original diagram
Integrated layer of data presentation.
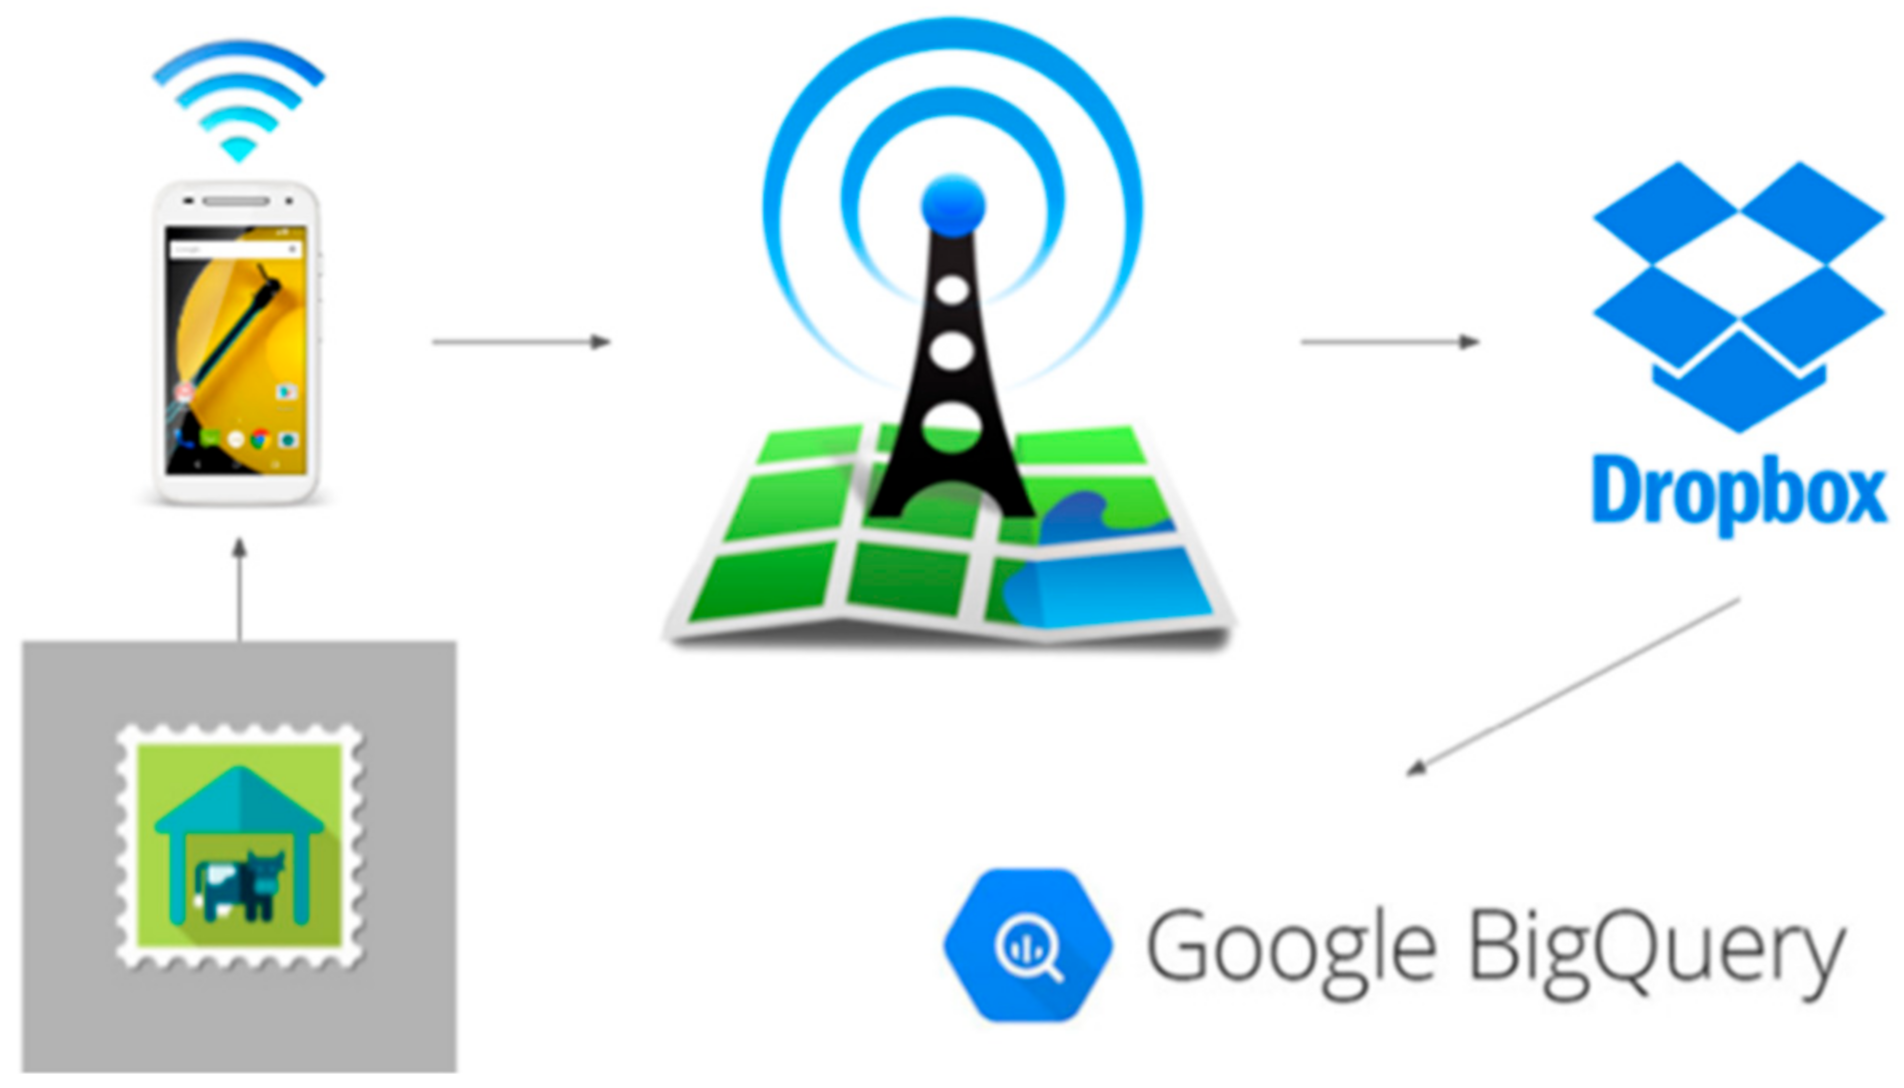
The presented concept is of multilayer nature, which presents technologies and action on high level of generality. A couple of layers, performing various functions and utilizing other technologies, form the architecture of the created system (
Figure 4):
The first of the mentioned layers is responsible for data acquisition. It is created both with equipment and software. The process of data acquisition begins when the application is activated in the cellular phone. They collect data from the beacons, which are within its range. Each beacon sends data, every single second in the “broadcast” format, which are registered in the receiving station in the CSV format (Comma separated values) on the microSD card. In order to simplify data management, the size of files was reduced. This aim was achieved via recording data in a single file covering only one hour of research. Next measurements were registered in the following files.
The limited memory size of the base station as well as security reasons meant that we favored using the Dropbox platform, which together with the created application, forms another layer. It ensures both data synchronization and safe data storage. Synchronizing files with data located on Dropbox platform and in receiving stations is a cyclical process at a 3-min interval. All files stored on the Dropbox platform have history of version. The above allows to restore any file condition in which a given file was stored in the last 30 days. This mechanism also protects us from losing data in case of lack of internet connection.
The use of beacons, as new data providers, used in the process of identification of behavior and physiological condition of dairy cattle involved devising the concept system, including both hardware and software solutions [
3]. The key elements creating the proposed system together with infrastructure were illustrated (see
Figure 2). The measurements of physical quantities were done with beacons, attached to the collars of the selected animals. The data, after partial processing by the inbuilt beacon software, were sent in the form of radio signals with the transmission bands of 2.4 GHz, in specified intervals. The beacons chosen by the authors (Estimote), equipped with sensors, would send the following data:
The beacon’s identifier.
Temperature in degrees centigrade.
Acceleration divided into three components in the direction of axis X, Y and Z.
Binary information determining the state of the device (motion or lack of motion).
Specifically aggregated duration of a given beacon’s state, including motion or lack of motion.
The aforementioned information encrypted in the radio signals was received by the base stations equipped with receivers Bluetooth 4.0. Having in mind economical issues, a decision was made to use Motorola smartphones, model Moto E (2nd generation) Android system 5.0. The above devices met the basic technical requirements, which allowed rengceivi signals in the standard Bluetooth 4.0, while at the same time ensuring the possibility of programming them with proper libraries. The aggregated data in the form of csv files were successively subject to synchronization on Dropbox platform. The reason for this operation were, on the one hand, the limited capacity of SD cards in the smartphones, and on the other hand, that it was dictated by data protection. They were one of the data sources powering data warehouse. The creation of this information existence was carried out based on two scenarios using different technologies. The created data warehouses became the key tool used to make analysis and evaluation of usefulness of the proposed solution.
2.4. Base Station Software
The smartphones that were used in the research had to be equipped with proper original software in order to function as the base stations. The application was to realize general functions that were determined:
Receiving signals from BLE transmitters.
Registering given information from smartphone.
Filing system of data in csv format on SD card.
Data synchronization on DropBox platform.
The signaled functionality was then applied on the level of modeling in UML notation. The implementation of application called Cow Behavior Listener involved the use of Java language in the environment Android Studio version 1.2.2. and the use of dedicated SDK (
Software Development Kit). This dedicated kit of programming tools resulted from the cheapest BLE, with which smartphones were equipped. When constructing software, the libraries, which were to ensure cooperation with Dropbox platform, were used [
22,
24]. The developed application with simplified interface, running in the background, informed the user about operations that were conducted.
Configuration possibilities of the developed application CBL include the following:
Entering phone name—the system was designed in such a way so as to make scaling possible. It meant that we could increase the number of both BLE devices and receivers. Phone identifier consisting of model name and number assigned to a given model was used to determine animal position. In the research we used telephones marked as motoe1, motoe2, motoe3. This telephone marking corresponded with catalogue name in Dropbox system, where data were collected and synchronized.
Determining catalogue, in which data were recorded on SD card.
The basis for functioning of the discussed application is recording measurements made by beacons (
Figure 4), which determine the following:
Binary information, saying if a beacon is in motion (on the basis of accelerometer).
Unique identifier of a beacon (alphanumeric value).
Beacon’s temperature, expressed in the Celsius Scale.
Acceleration component towards axis X.
Acceleration component towards axis Y.
Acceleration component towards axis Z.
Battery condition (descriptive value: full, unknown, flat or discharged).
Number of seconds determining duration of beacon in a given condition (motion, lack of motion)
and recording of quantities calculated on the basis of base stations, which include:
Power of the received signal in Dbm.
Approximate estimated distance on the basis of the power of the the received signal (descriptive value: very close, close, not far away, far away).
On account of differentiated signal suppression, its power was not used in the process of animals’ location. User could also influence, to a certain extent, the way the application worked by modifying the configuration of text files. The real problem to solve was the huge number of data. It was the consequence of the number of beacons that were used as well as of the huge frequency of measurement. It was accompanied by the limited storage capacity of SD cards. Because of that it was decided to collect data in csv files, which contained only an hour-long measurement. During this process, a task aimed at synchronizing files on Dropbox platform was cyclically started. The final complete synchronization was a signal to delete the files on smartphone, making disc space for the new set of data.
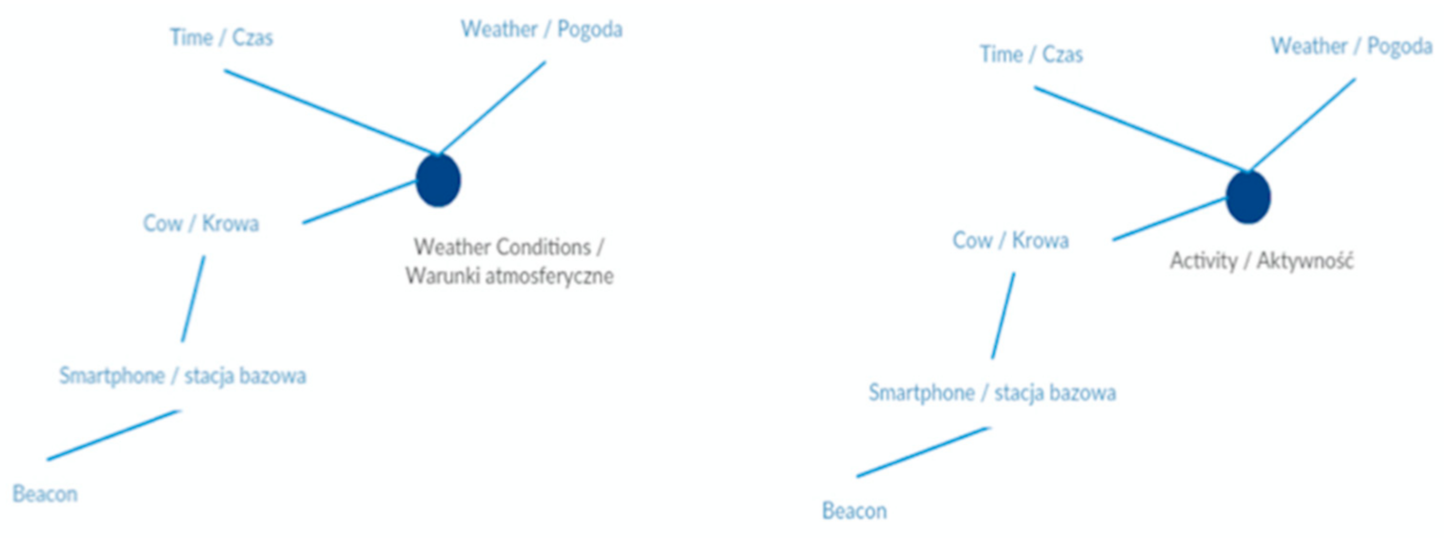
Data that was acquired, later fed the analytical base. Creating data warehouses included the stage of conceptual modeling, carried out with proper/appropriate notation. The model structure in the form of the table of facts illustrated in the form of blue dots and dimensions described in words was illustrated below (see
Figure 5).
These models were the basis for creating proper tables, firstly on the level of Microsoft tools, and secondly on BigQuery platform. The structures that were obtained, filled with data, were the source of query. They were constructed in different way depending on the technology that was selected. In case of Microsoft technology, which was abandoned, MDX language was used, and the data warehouse that was built on the Google platform was subject to query with SQL language.
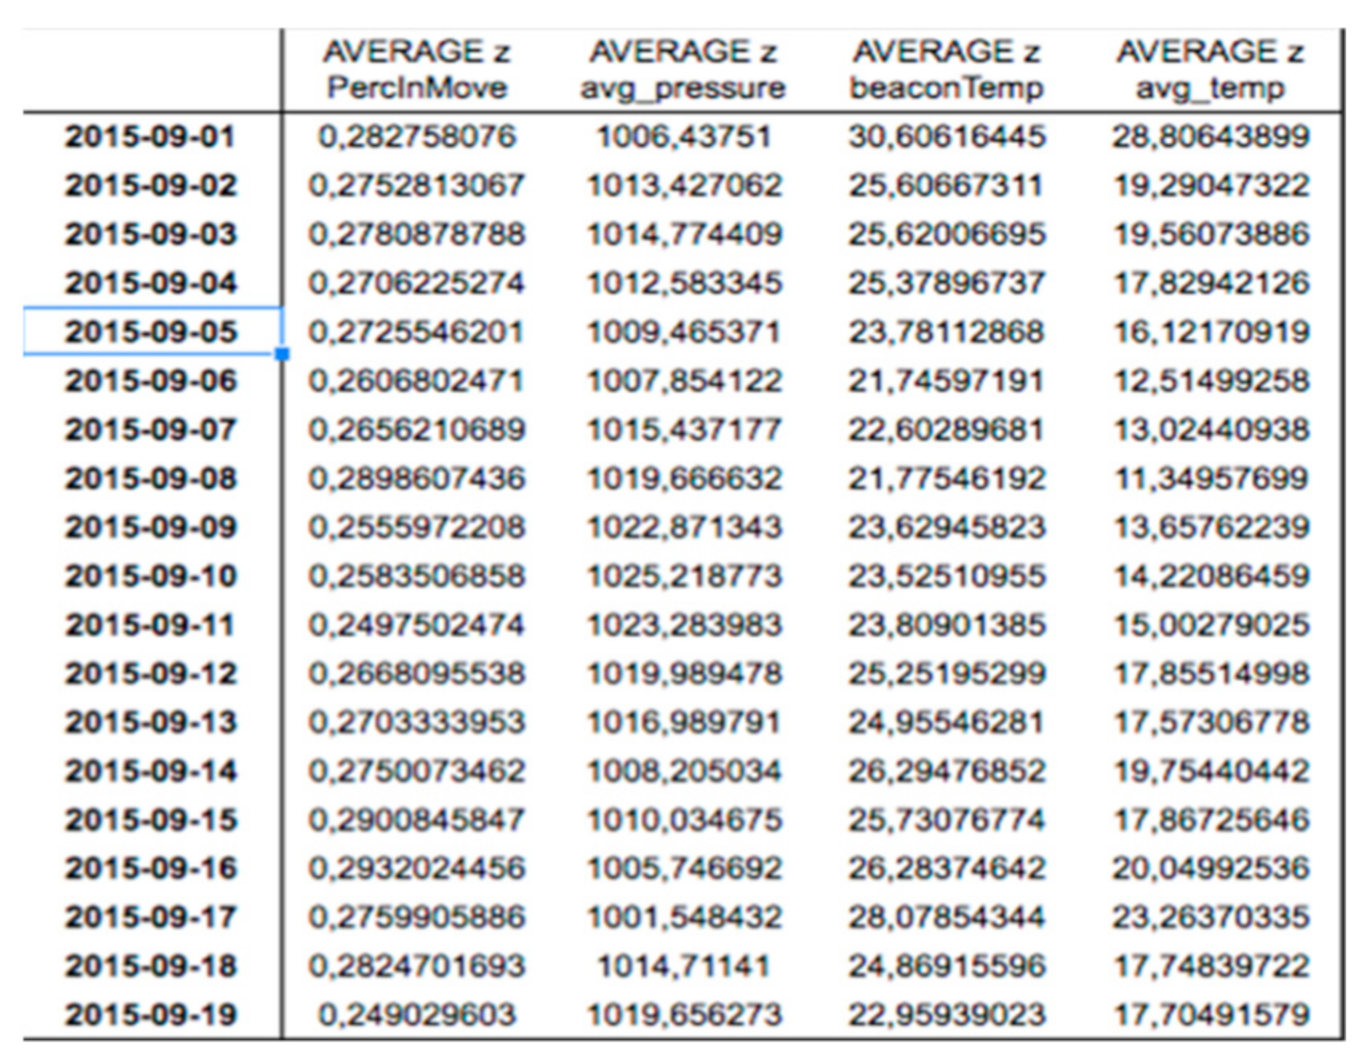
Figure 6 illustrates the aggregates that were obtained and that are available in spreadsheet, which are the result of data warehouse query, based on BigQuery platform.
3. Results and Discussion
3.1. Motor Activity versus Weather Conditions
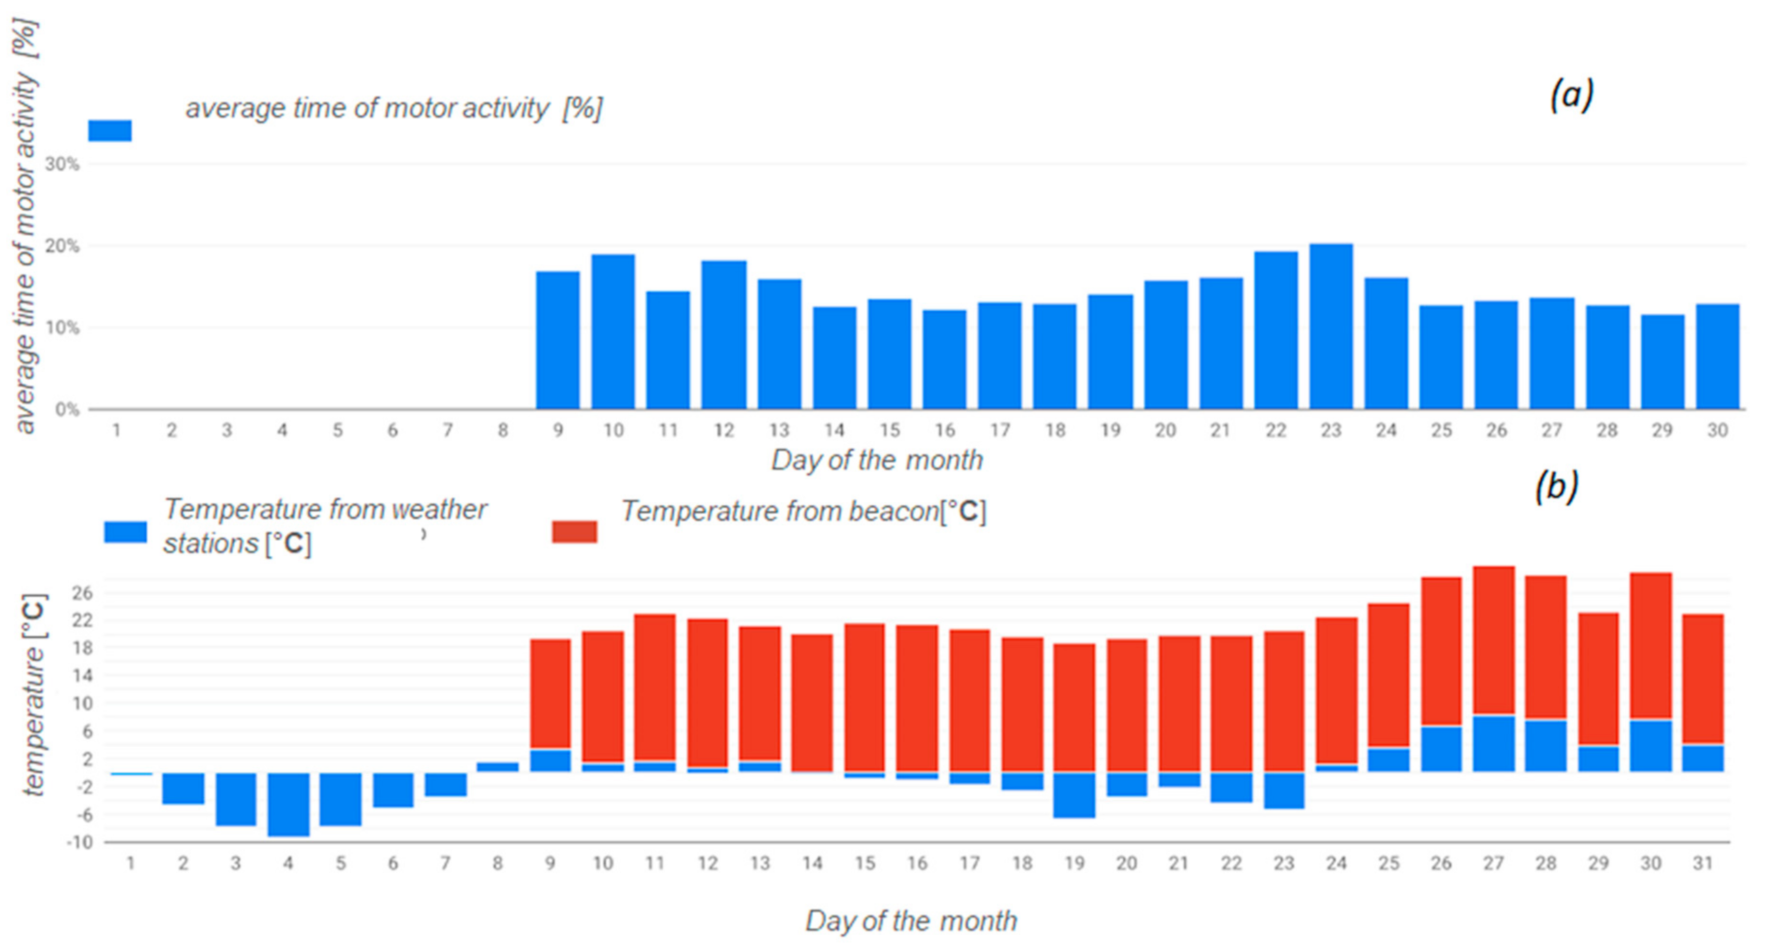
The created system, whose key element is data warehouse, also acquires data about weather conditions from weather stations. Therefore, the system records two types of temperature. The first measurement comes from weather stations, which describes atmospheric conditions outdoor, and the second is deciphered directly from the beacons. When determining the influence of surrounding temperature on cattle behavior, it is necessary to determine the
THI coefficient. Its value, which is below 72, determined on the basis of temperature and relative humidity, informs us about lack of heat stress. Coefficient was calculated on the basis of the following empirical formula on the basis of
Tdb °C (dry thermometer) and relative humidity
RH [
18]:
We can observe proportional relationship between temperature and motor activity of cows, which is well illustrated (see
Figure 7). Increase in motor activity together with increase in temperate was also noted in longer period of time on the basis of the research in the years 2015 and 2016. Motor activity connected with the research conducted in 2015 in September was at 27%, and in January and February oil 2016 it was at 21%. When processing data, a relative daily humidity in September 2015 was also included. Thanks to it, it was possible to calculate THI value. It was possible to determine periods, during which animals were in heat stress, which is shown (see
Figure 5 and
Figure 6).
3.2. Internal Positioning of Animals
An interesting functionality offered by the proposed method, of course only in case of free stalls cowsheds, is the possibility of internal positioning of animals. Due to the beacons and the number of base stations that were used in this given case, we can only recognize approximate areas of animal position over time. These data in combination with better location of dens can deliver more information about hierarchy in herd and relations between cows.
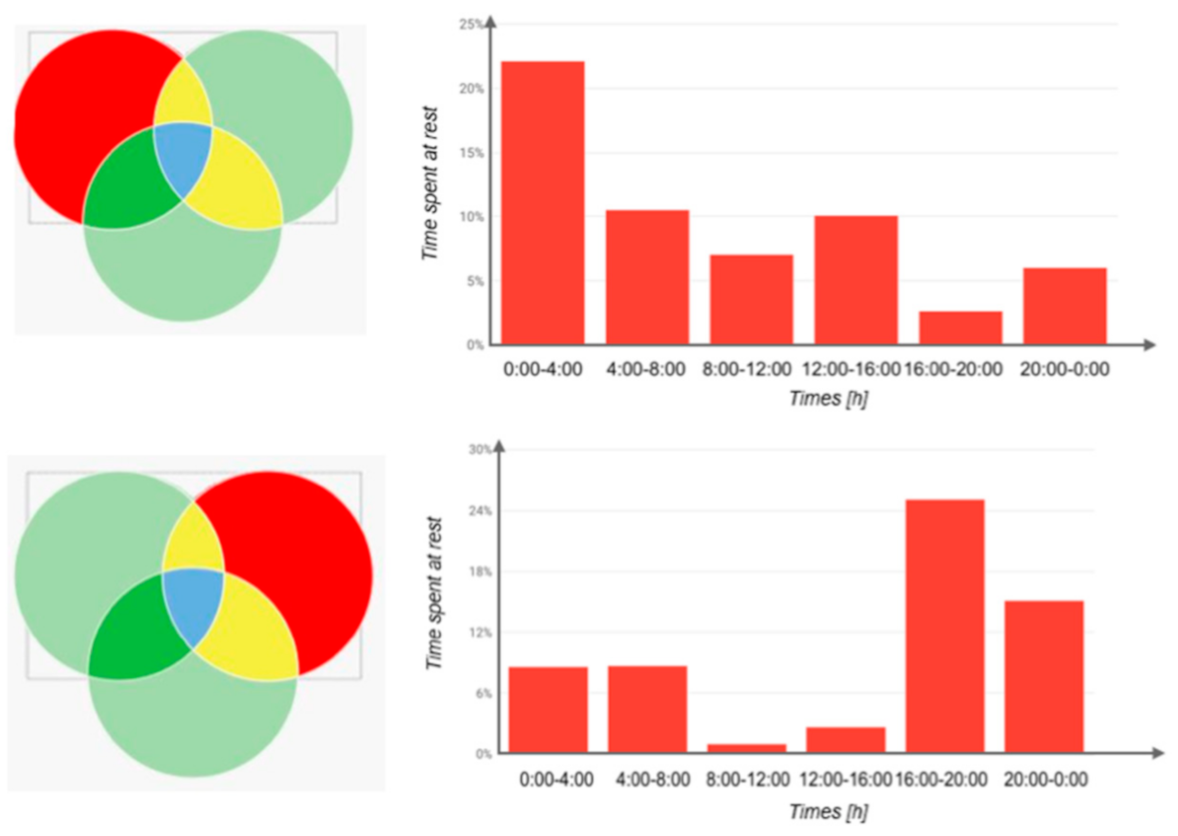
On the basis of the aggregated data from data warehouses paired with the base stations receiving signal from beacon, one can determine the approximate map of areas of staying of a given animal in time
Figure 8.
Not only does the aforementioned figure present areas where a given animal stays but also shows pictograms determining the percentage time of staying in a given location. For the needs of the analysis, twenty-four hours were divided into 4 h periods. Monitoring changes of location of a given animal together with its activity, especially during night, becomes useful in recognizing the symptoms of stress related to separating from offsprings, which concerns cows immediately after calving. This situation can lead to aggressive behaviors [
25].
3.3. Daily Activity
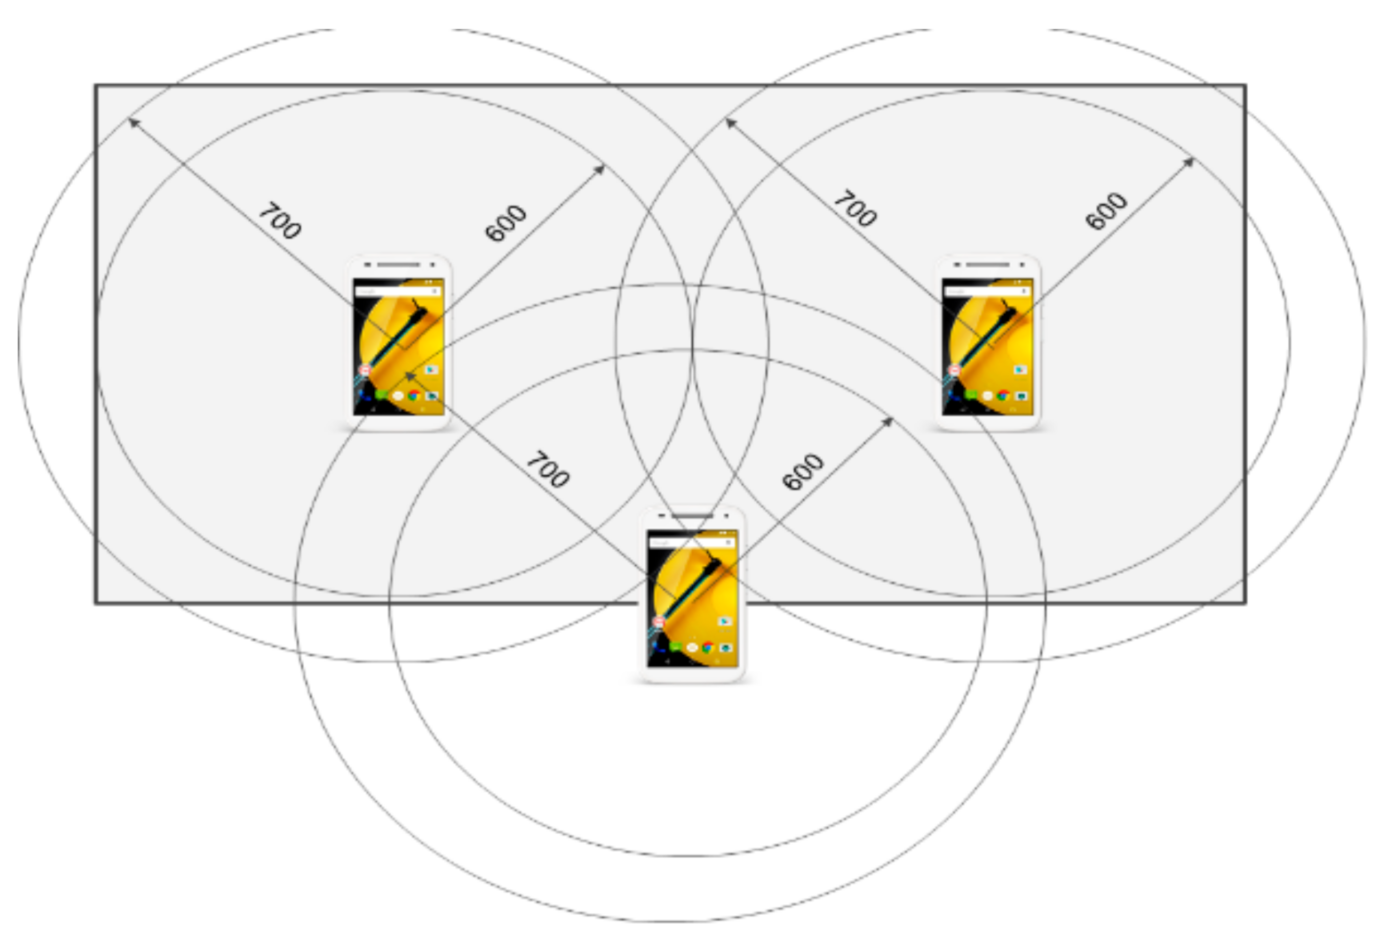
The research aimed at verification and validation of the proposed solution, were realized on the dairy farm, equipped with a multi-stall cowshed. The reason for choosing this form of cattle breeding was, among the things, the coverage of signal sent by beacons, received by the base stations. The animals that were chosen randomly (young cows, after a maximum of two calvings), were equipped with special collars with beacons attached to them, which is well illustrated. The infrastructure of the cowshed was extended by placing smartphones there, whose location was to ensure signal registration coming from each beacon, in the situation when a given animal stays in any part of the den or feeding area. Additionally, an attempt was made to maximize the area, in which signals were simultaneously registered by the three base stations, which was to serve as the way of internal identification of a given animal. The elaborated research was realized in two cycles in 2015 and in 2016. The result of the research was 120 GB of data on a hard disc.
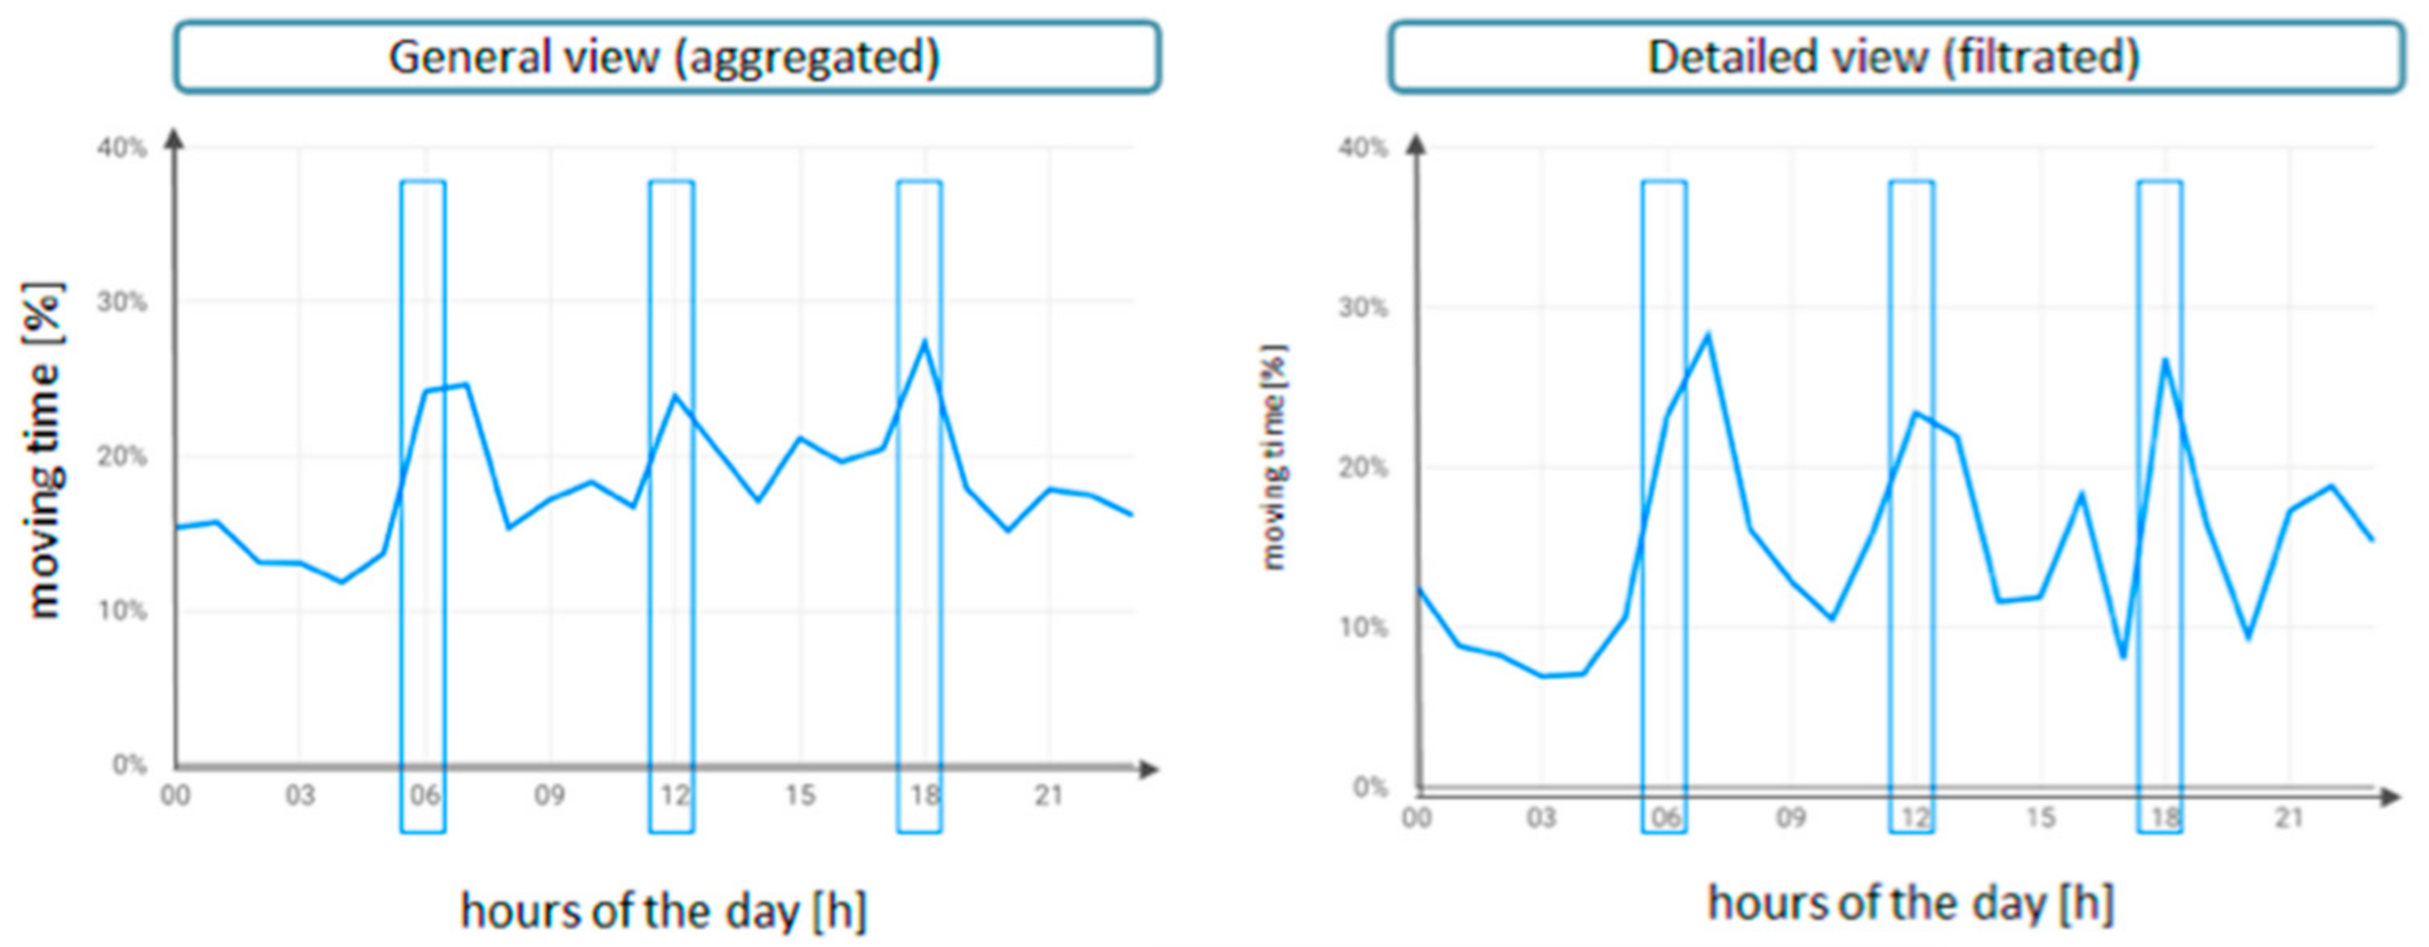
Data processing and their further analysis were realized with the specially designed data warehouses. The essential measurement registered by the system both from the testing point of view and from the perspective of identifying behavior and physiological condition of cows, was a beacon’s motor activity, which reflected motor activity of a given animal. Beacon provided information about acceleration quantity and derivational information, which represented specifically reacted period of motor activity or lack of any activity including the period of ten seconds. Taking into account the fact that twenty-four-hour activity of cows is moderately well described in the literature, it made a solid foundation in the process of verifying and validating the proposed method. The average values of period of motor activity of cows that were achieved, were determined for an hour long time frame. Those values were then used to make a twenty-four hour characteristics of motor activity of animals, which is presented (see
Figure 9). The figure was additionally expanded by designation of time frames, in which the animals were milked or fed.
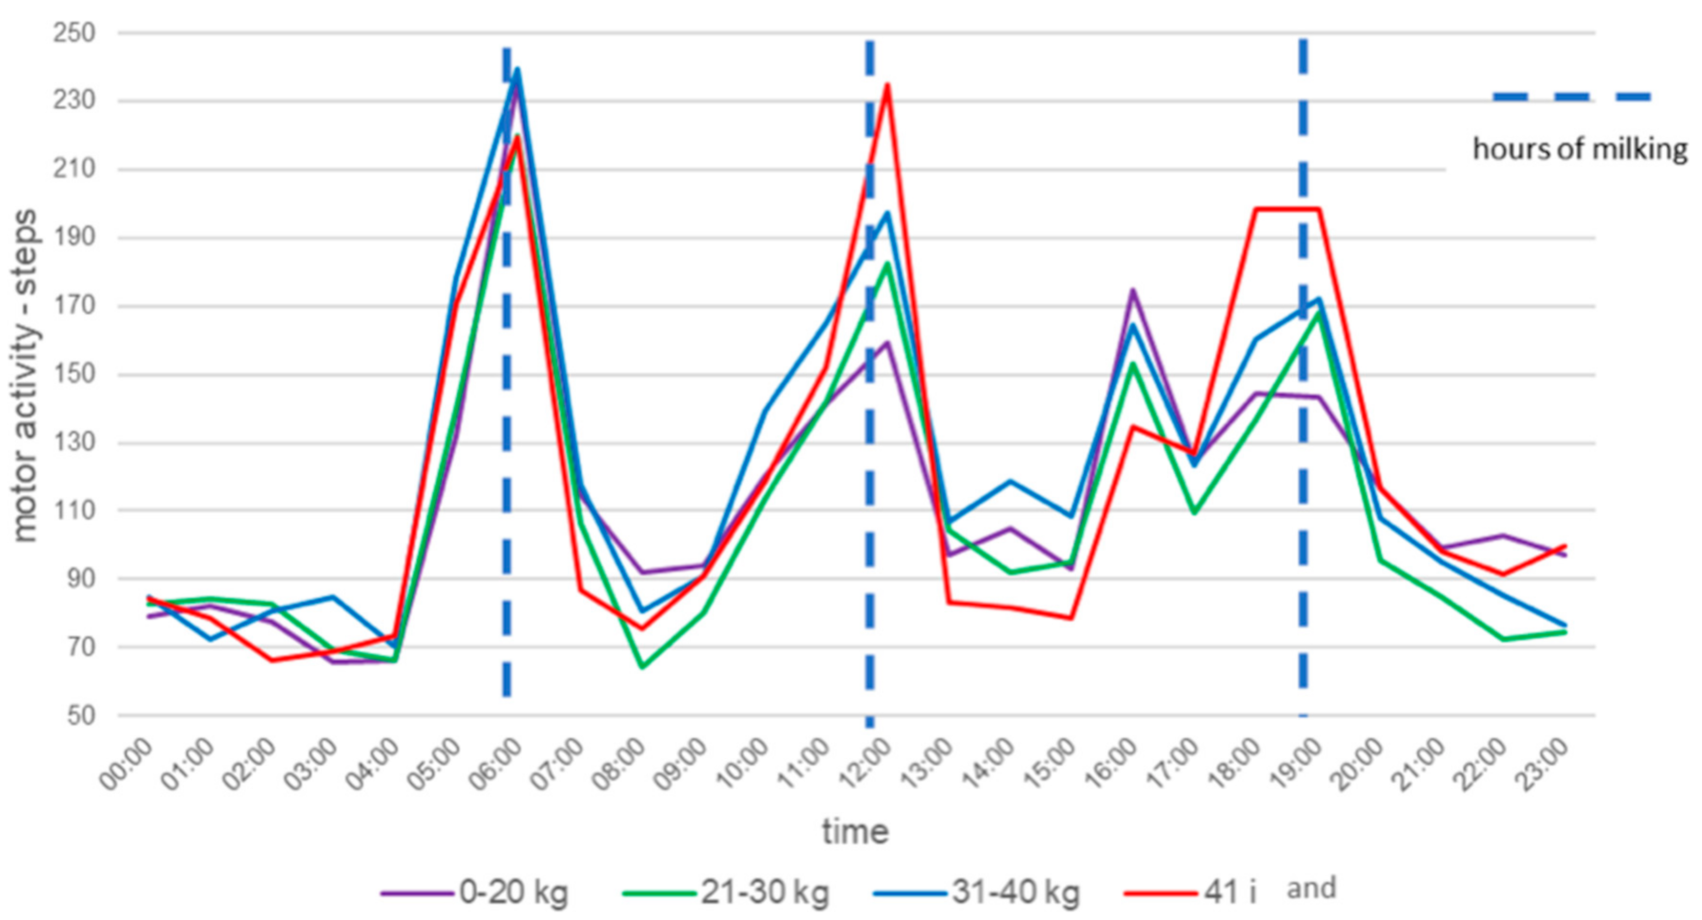
The twenty-four-hour characteristics of motor activity of cows that were achieved indicated the increased motor activity during the period of milking and feeding. They corresponded with the characteristics that were achieved on the basis of data coming from the system using pedometers, see
Figure 10 [
13,
26,
27].
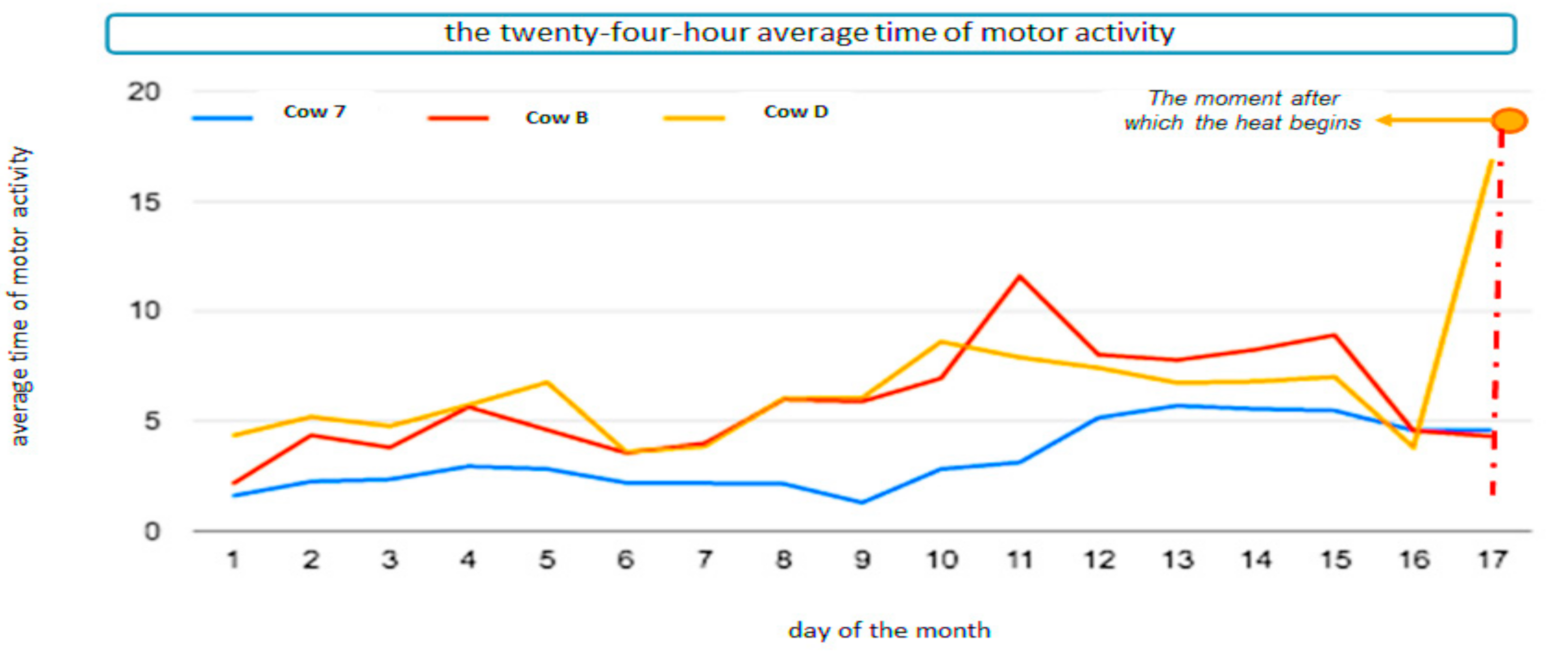
The changes in motor activity were also the basis for identifying physiological condition, namely heat. As a result of the research that were done and the analyses that were made with the proposed system, it turned out that the twenty-four-hour motor activity of a given cow in heat was 2.5 times higher than the previous values and three times higher than the rest of the animals that were subject to measurement (see
Figure 11).
The similarity of the twenty-four hour characteristics of motor activity of cows together with the possibility of recognizing heat in cows, clearly indicated that beacons in combination with the proper information system could be an alternative to the solutions based on pedometers. However, one should take note of one shortcoming of the presented solution, which was possible to eliminate, namely limiting failure of beacons.
4. Conclusions
The concept presented by the authors as well as the realization of the information system used to identify behavior and physiological condition of dairy cattle, making untypical use of microcomputers called beacons, seemed to be competitive solutions in comparison with the ones that were currently available and whose functioning was also based on beacons. It was confirmed by research and analyses that were mainly related to the changes of motor activity of cows recorded on the twenty-four hour characteristics and registered during the period of heat. Despite several imperfections that were noticed whose removal should not pose a serious problem, the potential of the proposed solution, by virtue of measurement of a greater amount of physical quantities combined with possibility of using other sources of data, feeding data warehouses, seems to be ahead of the the existing solutions.
To sum up:
The new method of identification of behavior and physiological condition that was offered consisted of a complex information system, cooperating with beacons, which were used as measurement devices and data warehouses. The detailed device and software elements have not been applied so far and have not been subject to research in the discussed area.
The twenty-four-hour characteristics of motor activity of cows that were obtained as a result of the research, allowing to identify herd behaviors, with information coming from beacons and registered in data warehouses, seemed to be similar to characteristics coming from the systems cooperating with pedometers.
The created system, characterized by a wider range of information coming from beacons, cooperating with base stations, generated better possibilities from the perspective of identifying behaviors and physiological condition of dairy cattle. We gain, among other things, the possibilities of following approximate location of animals. The possibility of associating activity with weather information, which makes proper interpretation of changes in animal behavior easy, is also of considerable significance.


