Article

Monolithic 3D Inverter with Interface Charge: Parameter Extraction and Circuit Simulation

1
Department of Electrical, Electronic and Control Engineering, Hankyong National University, Anseong 17579, Korea
2
Group for Green Energy Nano Convergence Technology, Korea Institute of Industrial Technology, 6, Cheomdangwagi-ro 208beon-gil, Buk-gu, Gwangju 61012, Korea
3
Georgia Institute of Technology, School of Electrical and Computer Engineering, Atlanta, GA 30308, USA
4
ICT and Robotics Engineering and IITC, Hankyong National University, 327, Jungang-ro, Anseong-si 17579, Korea
*
Author to whom correspondence should be addressed.
Appl. Sci. 2021, 11(24), 12151; https://doi.org/10.3390/app112412151
Submission received: 19 November 2021 / Revised: 11 December 2021 / Accepted: 13 December 2021 / Published: 20 December 2021
(This article belongs to the Special Issue Device Modeling for TCAD and Circuit Simulation)

Abstract

:
We have simulated a monolithic three-dimensional inverter (M3DINV) structure by considering the interfacial trap charges generated thermally during the monolithic three-dimensional integration process. We extracted the SPICE model parameters from M3DINV structures with two types of inter-layer dielectric thickness TILD (=10,100 nm) using the extracted interface trap charge distribution of the previous study. Logic circuits, such as inverters (INVs), ring oscillators (ROs), a 2 to 1 multiplexer (MUX), and D flip-flop and 6-transistor static random-access memory (6T SRAM) containing M3DINVs, were simulated using the extracted model parameters, and simulation results both with and without interface trap charges were compared. The extracted model parameters reflected current reduction, threshold voltage increase, and subthreshold swing (SS) degradation due to the interface trap charge. HSPICE simulation results of the fanout-3 (FO3) ring oscillator considering the interface trap charges showed a 20% reduction in frequency and a 30% increase in propagation delay compared to those without the interface trap charges. The propagation delays of the 2 × 1 MUX and D flip-flop with the interface trap charges were approximately 78.2 and 39.6% greater, respectively, than those without the interface trap charges. The retention static noise margin (SNM) of the SRAM increased by 16 mV (6.4%) and the read static noise margin (SNM) of SRAM decreased by 43 mV (35.8%) owing to the interface trap charge. The circuit simulation results revealed that the propagation delay increases owing to the interface trap charges. Therefore, it is necessary to fully consider the propagation delay of the logic circuit due to the generated interface trap charges when designing monolithic 3D integrated circuits.

1. Introduction

Three-dimensional (3D) integration technology has been studied as a solution to the physical limitations of maintaining the road map predicted by Moore’s Law [1,2]. Compared to other 3D integration technologies, monolithic 3D integration (M3DI) enables very small inter-layer via to minimize the connection between the device and interconnection. Via in nm can significantly reduce the delay caused by interconnection [3]. M3DI is a 3D integration technology that sequentially fabricates two or more device layers instead of combining two processed substrates using through-silicon via (TSV). Due to sequential integration, low-temperature (<650 °C) processes must be applied to fabricate the upper layer device to ensure the quality of previous layers. Recently, LETI’s CoolCubeTM technology has succeeded in lowering the process temperature to below 650 °C [4,5]. However, even when a low-temperature process is applied, the silicon and oxide film interfaces of the previously fabricated layers are damaged by heat [6]. The generated interface trap charges make the threshold voltage and the current level of the device and the subthreshold swing (SS) worse. Subthreshold swing is amount of change in voltage according to current below the threshold voltage. When fabricating a circuit with M3DI, the effects of interface trap charges and electrical coupling due to inter-layer dielectric (ILD) distances should be considered. Previous studies investigated electrical coupling with the distance of the ILD when the interface trap charge was ignored [7,8,9,10,11] and extracted SPICE parameters of the monolithic 3D inverter (M3DINV) for the circuit design simulation [12]. However, for a realistic circuit design simulation, it is necessary to extract the SPICE model parameters considering the interface trap charge.
In this study, we introduced parameter extraction of SPICE model parameters of the top and bottom transistors in the M3DINV considering the interface trap charge distribution [13] extracted from the experimental data of the M3DINV [14] with inter-layer dielectric thickness (TILD) of 10 (coupling) and 100 nm (non-coupling). To verify the validity of the extracted SPICE model parameters of the M3DINV, technology computer-aided design (TCAD) and TCAD mixed-mode simulation were performed. The components of logic circuits, such as inverters, ring oscillators, 2 × 1 multiplexer (MUX), and D flip-flop and 6-transistor static random-access memory (6T SRAM), consisting of M3DINVs, were simulated using the extracted model parameters, and the simulation results, both with and without interface trap charges, were compared.

2. Interface Trap Charges in M3DINV

Figure 1 shows the M3DINV structure and the locations of the interface trap charges that can be generated during its fabrication. The M3DINV used in the simulation consists of N-type and P-type MOSFETs on the top and bottom layers, respectively [13,14]. Doping concentration of the MOSFET’s source/drain, lightly-doped doping (LDD), and the channel are 1021, 1018, and 1015 cm−3, respectively. The gate length and gate oxide thickness were simulated with a length of 30 nm and a thickness of 1 nm. SiO2 was used for the gate oxide, ILD, and Box. The thicknesses of the ILD were 10 and 100 nm. In the TCAD simulation, the device simulator ATLAS [15] manufactured by Silvaco was used. The models used for device simulation were Lombardi CVT mobility, Shockley-Read-Hall Recombination, AUGER recombination, and Fermi-Dirac statistics. The extracted interface trap charge distribution was used for the simulation.
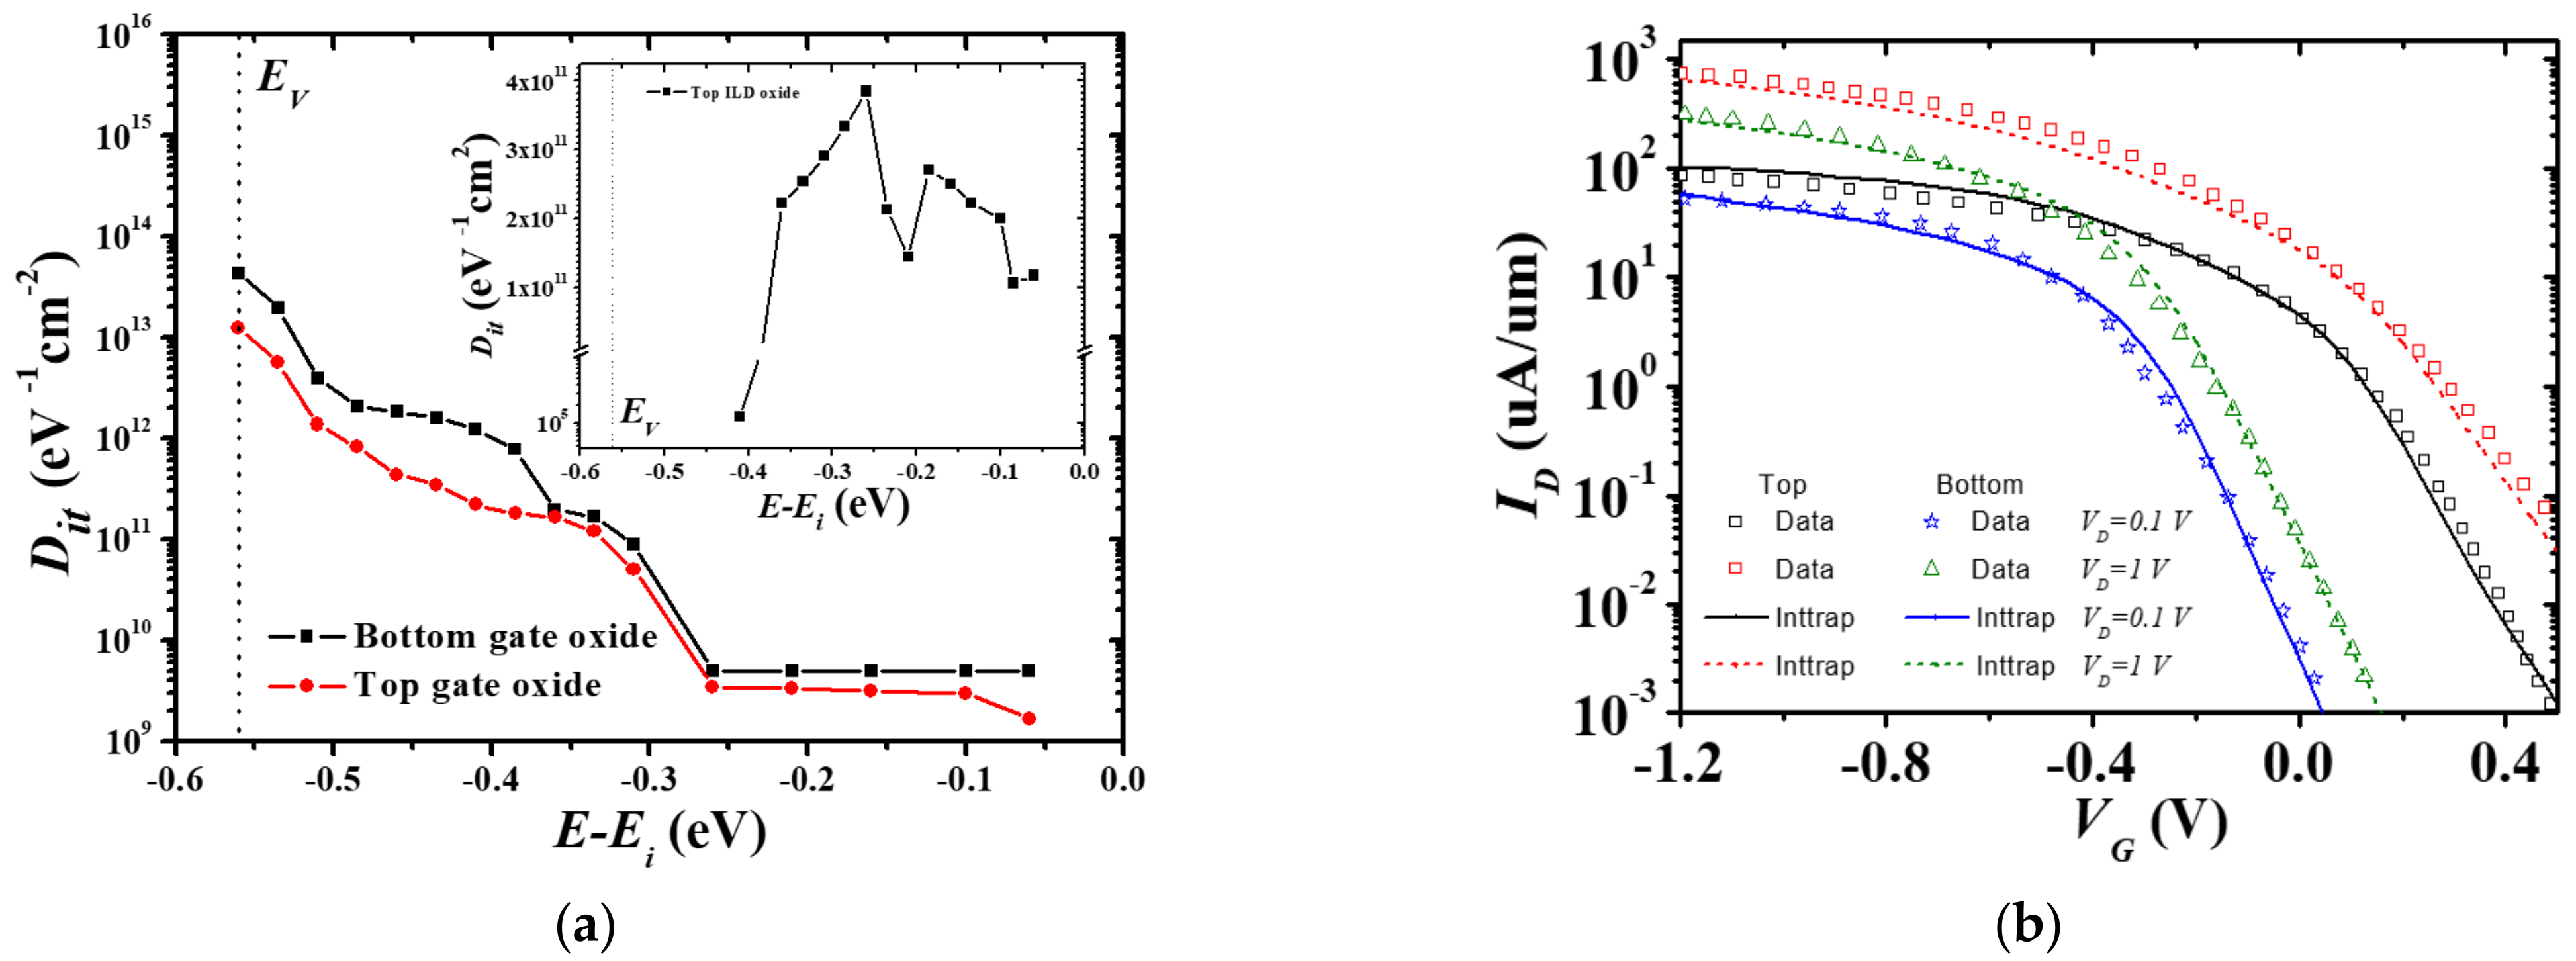
Figure 2 shows the interface trap charge distributions generated in the top and bottom gate-oxide and silicon interfaces extracted in a previous study [13] and the drain current-gate voltage (Ids-Vgs) characteristics. The inset graph of Figure 2a shows the interface trap charge distribution generated at the ILD and silicon interface [13]. Figure 2b shows Ids-Vgs characteristics obtained by fitting the interface trap charge extracted from the reference results [13]. The distribution is extracted by fitting the energy level and charge density parameter of the interface trap charge by using the TCAD simulation results with the same structure as the reference results. The Ids-Vgs characteristics (lines) of the top and bottom transistors using the extracted interface trap charge were verified by matching the experimental data (symbols). Using the interface trap charge distribution extracted from the experimental data, the Ids-Vgs characteristics according to various biases of this device were obtained by TCAD simulation. Based on the Ids-Vgs characteristics of TCAD simulation, the SPICE model parameters of the bottom P-type and top N-type MOSFETs for circuit design are extracted as shown in Table 1 and Table 2 at TILD = 10 (and 100 nm), respectively. As the bottom layer P-type MOSFET is not affected by the thickness of the TILD, the extracted parameter is the same for TILD of 10 and 100 nm.

3. Parameter Extraction for Circuit Simulation

For circuit simulation, the LETI-UTSOI model (version 2.1) [16,17,18] in HSPICE [19] was used for the top and bottom MOSFETs [12].
Parameters of the LETI-UTSOI model were extracted by comparing them with the reference TCAD data. First, the threshold voltage (Vt) roll-off, subthreshold swing (SS) degradation, and interface state factor parameters were extracted. Next, the mobility and series resistance parameters, the velocity saturation parameters were extracted. For the short channel effect, the drain-induced barrier lowering (DIBL), and the channel length modulation (CLM) parameters were extracted. The process was repeated until the parameters were completely extracted. When the DC parameter extraction was complete, the output capacitance parameters were extracted. Finally, the back gate effect parameters were extracted.
To reflect the effect of interface trap charge, parameters such as interface state, threshold voltage, and mobility were used, as shown in Table 1 and Table 2. Figure 3a–c show the Ids-Vgs characteristics of the bottom P-type MOSFET in M3DINV and the top N-type MOSFET at TILD = 10 and 100 nm, respectively. The symbols and lines denote the TCAD and HSPICE simulation results, respectively, using the extracted parameters both with and without interface trap charge distributions.
The drain voltages are 0.2, 0.6, and 1 V for N-type MOSFETs and −0.2, −0.6, and −1 V for P-type MOSFETs, respectively. In both top and bottom MOSFETs, the on-current levels are reduced, the threshold voltage is changed, and SS is reduced by the interface trap charge. The HSPICE circuit simulation results are in good agreement with the TCAD simulation results.
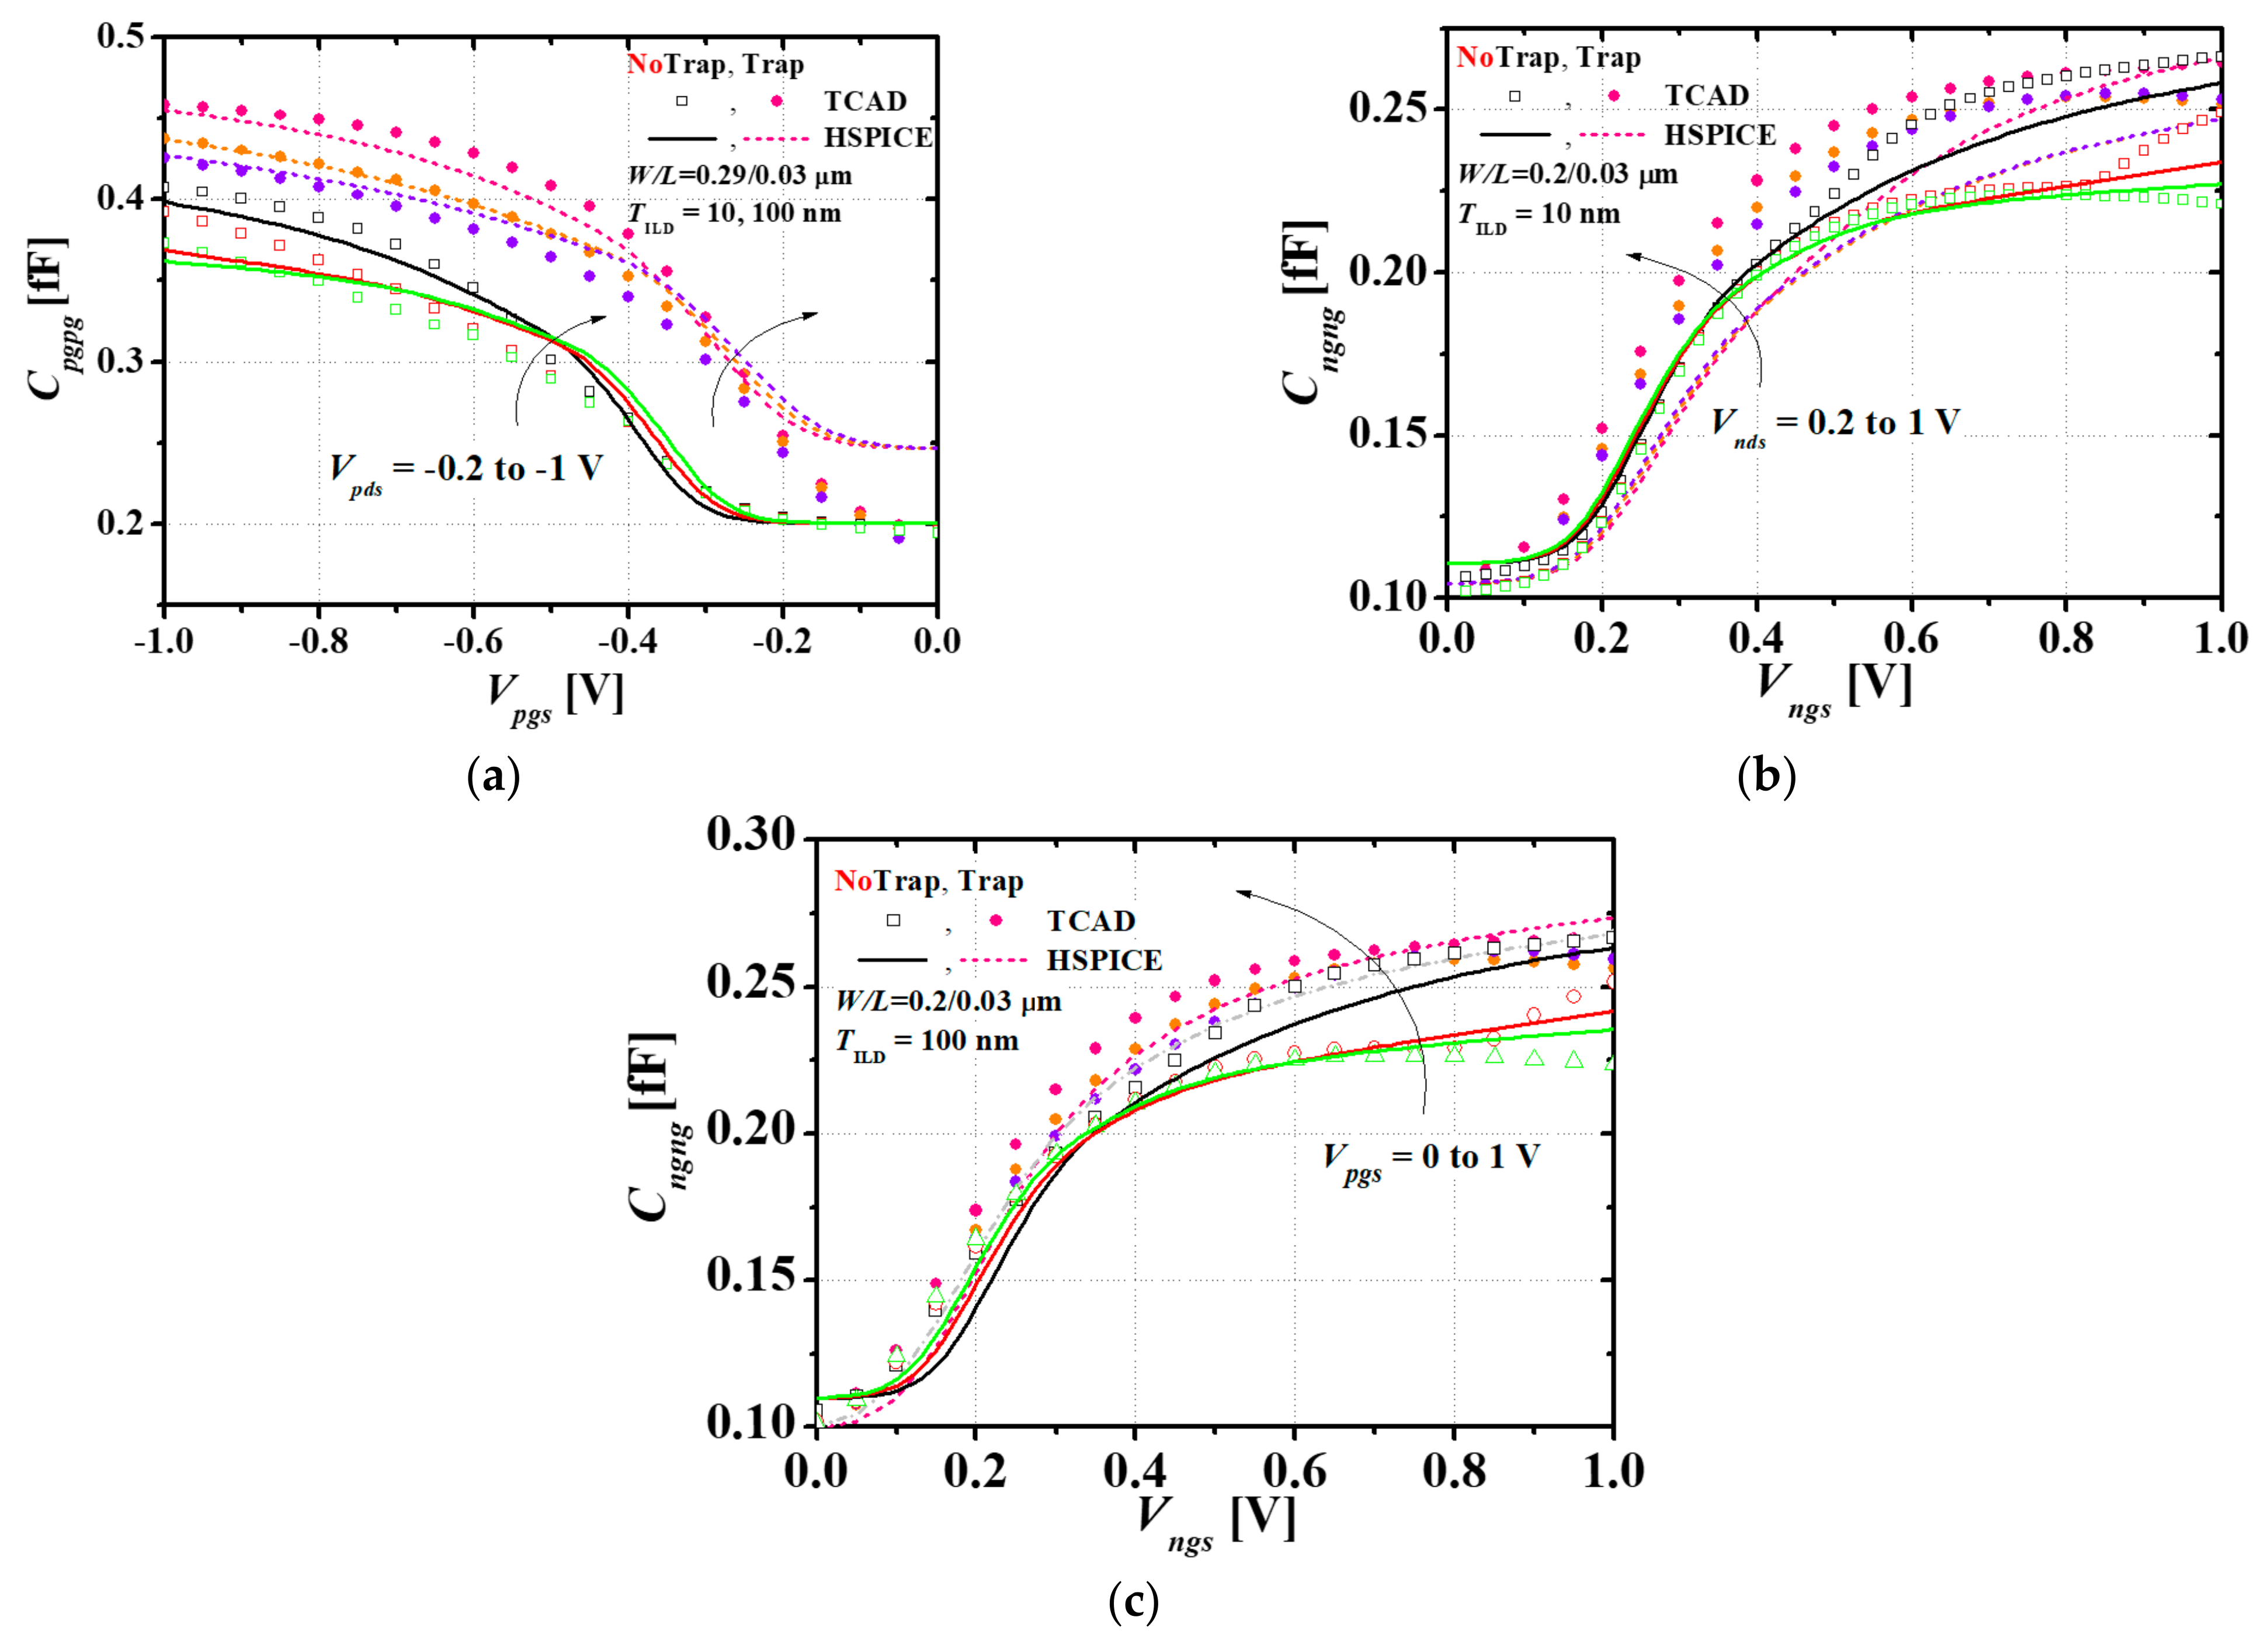
Figure 4 shows the total gate capacitance-gate voltage (Cg-Vgs) characteristics. Figure 4a–c shows the total gate capacitances of the bottom P-type MOSFET and top N-type MOSFETs at TILD = 10 and 100 nm, respectively. The solid and dashed lines show the total gate capacitances simulated with HSPICE without/with the interface trap charge, respectively, and the squares and circles show the total gate capacitances simulated with TCAD without/with the interface trap charge, respectively. In the bottom P-type MOSFET, the threshold voltage was shifted by approximately −0.176 V by the interface trap charge, and the maximum value of the gate capacitance was decreased by approximately 0.05 fF. In the top N-type MOSFETs at TILD = 10 and 100 nm, the threshold voltages are shifted approximately 0.13 and 0.083 V by the interface trap charge, respectively. However, changes in the minimum and the maximum values of the gate capacitance are hardly observed. The HSPICE simulation results also agree well with the total gate capacitance magnitude and trend within the error range.
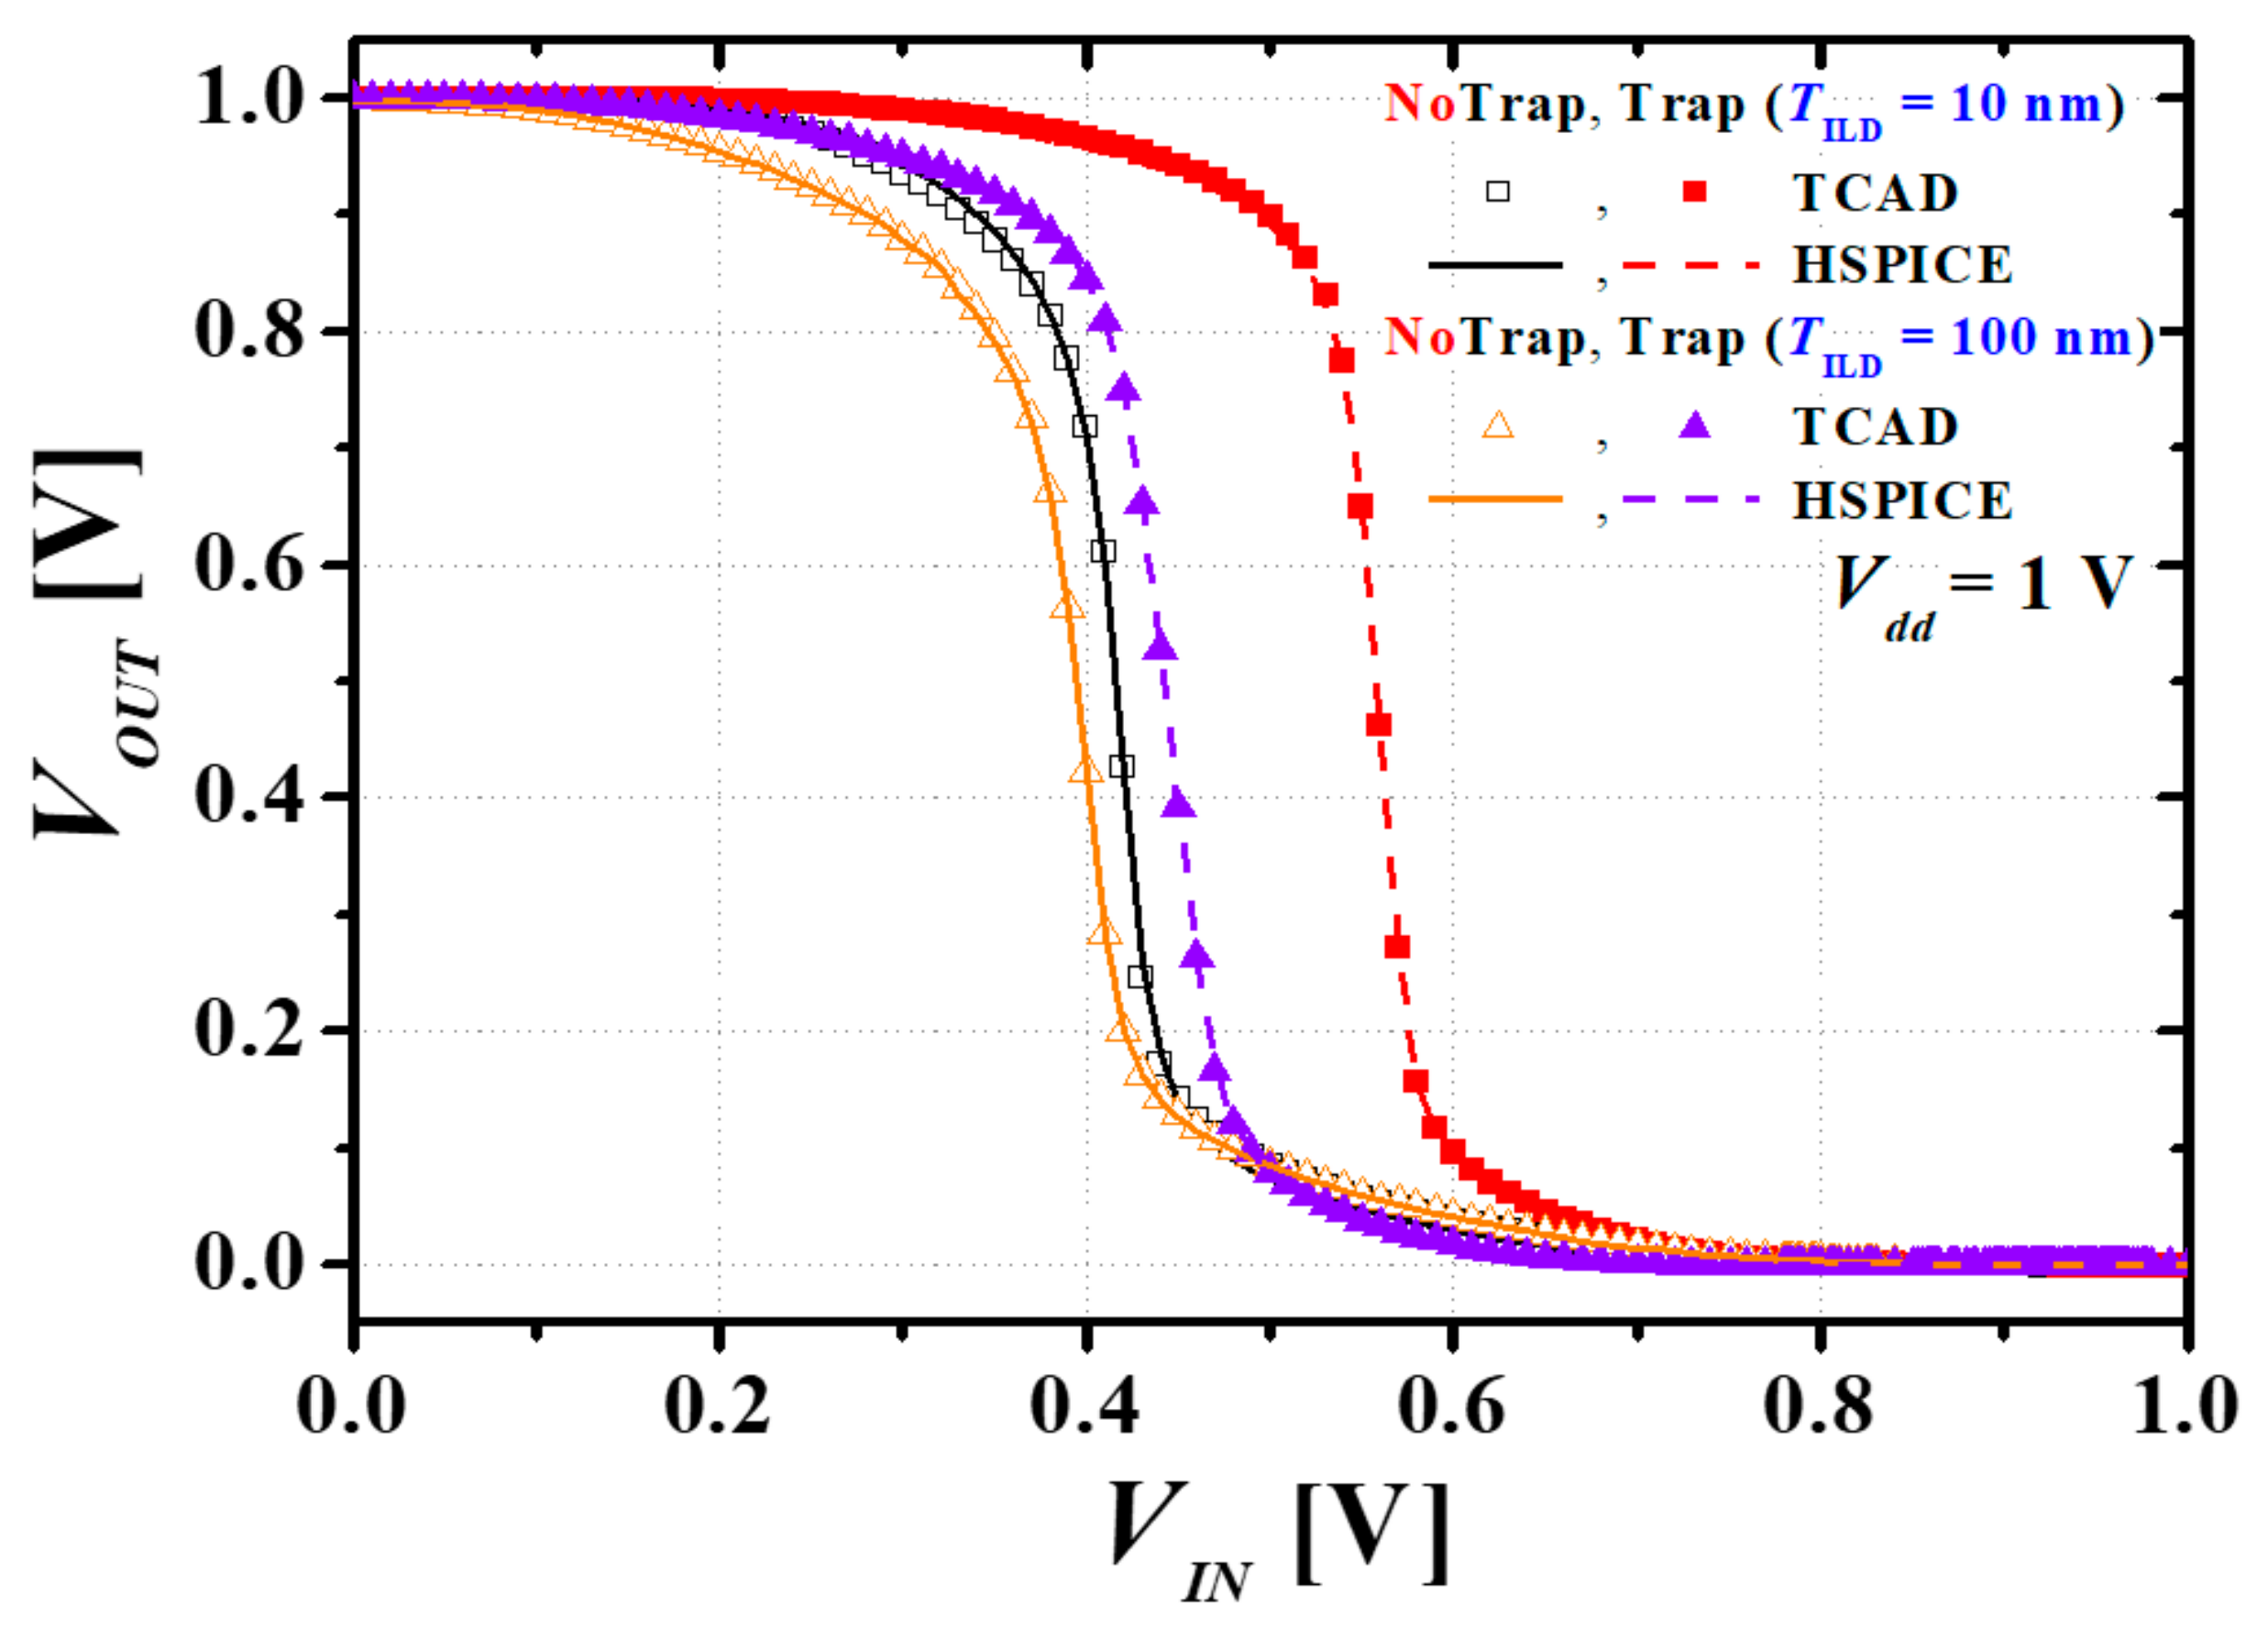
Figure 5 shows the voltage transfer characteristics (VTC) of M3DINV both with and without the interface trap charge at TILD = 10 and 100 nm. The symbols and lines show the TCAD mixed-mode and HSPICE simulation results, respectively. The filled symbols (and solid lines) and empty symbols (and dashed lines) denote without and with the interface trap charge, respectively. The squares and triangles denote TILD of 10 and 100 nm, respectively. The HSPICE simulation results agree well with TCAD mixed-mode results. The switching threshold voltage Vm was shifted owing to the threshold voltage shift of the top/bottom MOSFETs by the interface trap charge. When the TILD is 10 and 100 nm, the Vm s shifts by 0.125 and 0.047 V, respectively.
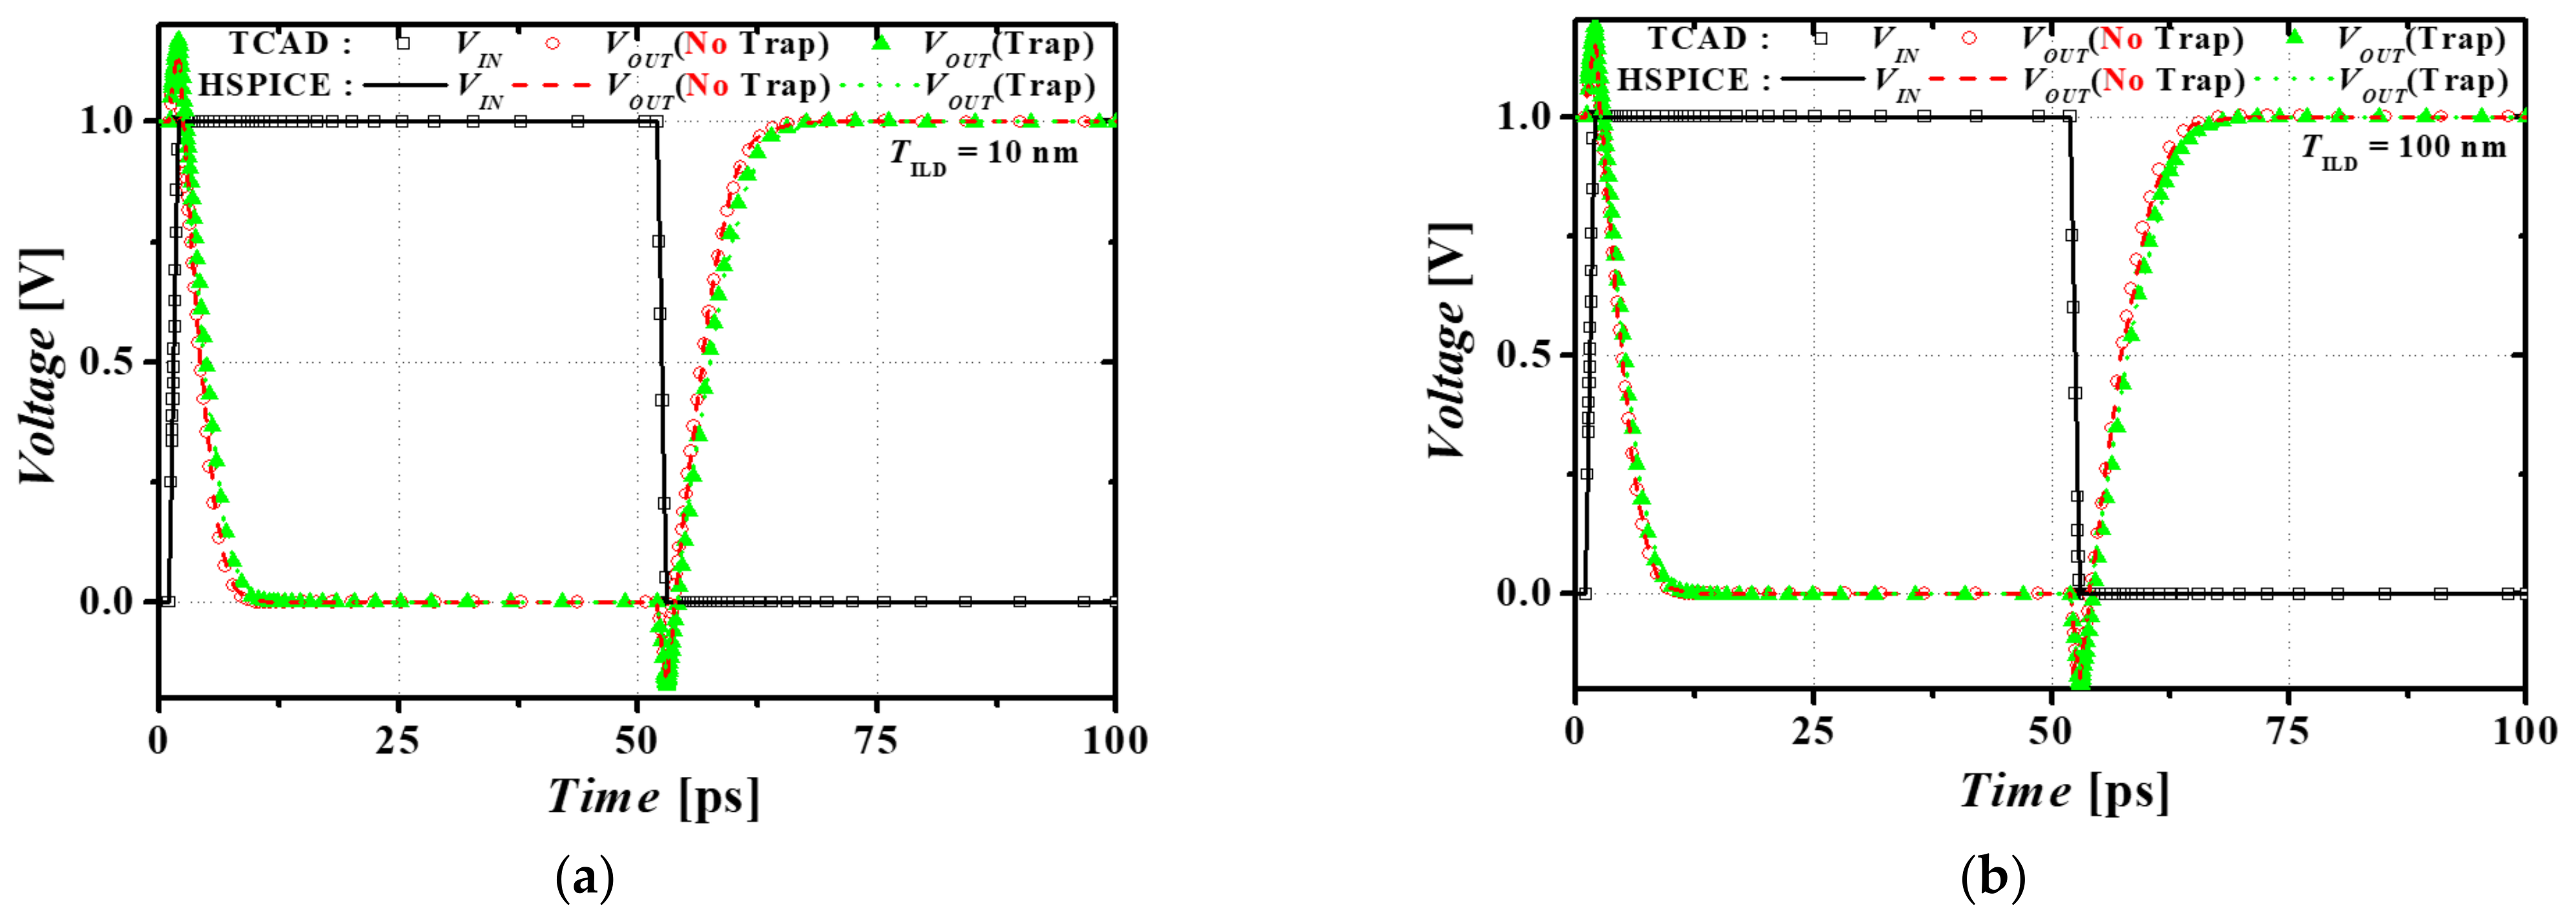
Figure 6 shows the transient response characteristics of M3DINV at TILD = 10 and 100 nm. The load capacitance of M3DINV is CL = 1 fF. The symbols and lines show the results of the TCAD mixed-mode and HSPICE circuit simulations, respectively. The black square (solid line), the red circle (red dotted line), and the green triangle (green dotted line) show the input and output voltages both with and without the interface trap charge, respectively. The HSPICE circuit simulation results match the TCAD mixed-mode results. The change in capacitance due to the interface trap charge at the interface is not large, but the on-current level is greatly reduced by the interface trap charge; thus, it can be confirmed that the propagation delays due to the reduced current increases.
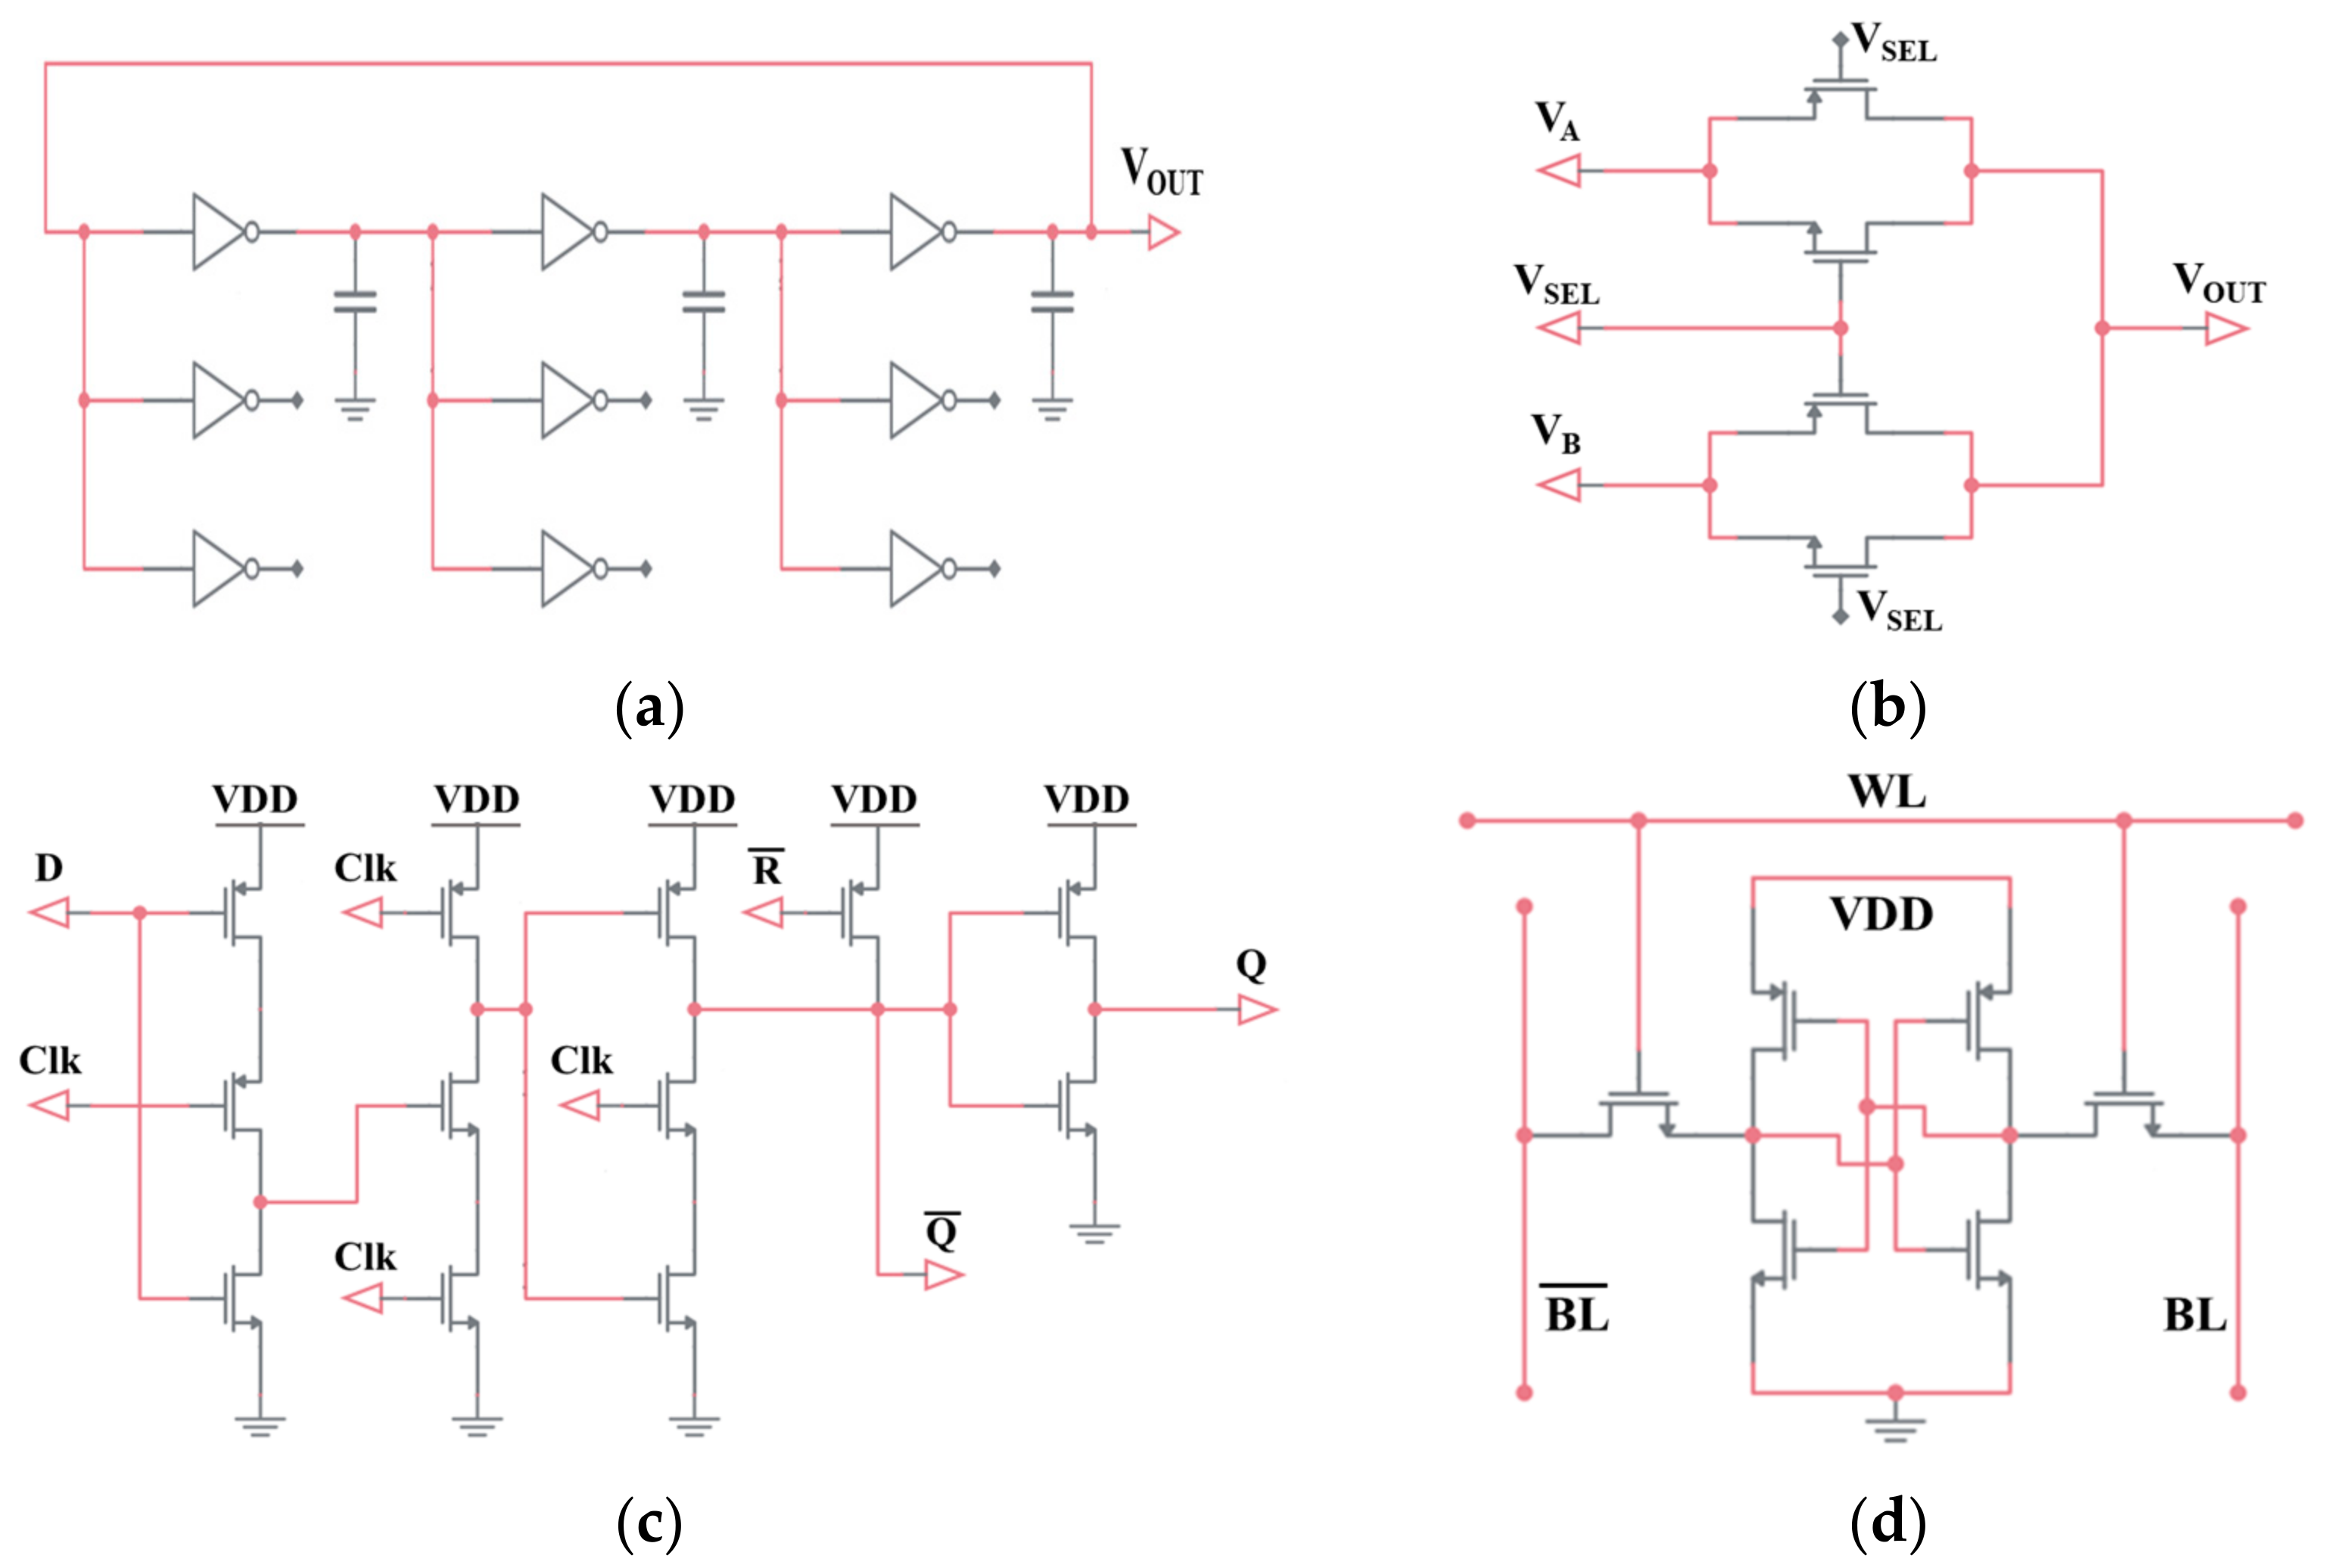
Figure 7 shows the circuit diagram used for circuit simulation. Figure 7a–d are three stages fanout-3 ring oscillator [20], 2 × 1 MUX [21], D Flip-Flop [22], and 6T SRAM [23], respectively.
Table 3 and Table 4 show the power consumption, frequency, and propagation delay of three types of fanout-3 ring oscillators (FO3-RO) consisting of M3DINVs both with and without interface trap charges, respectively. Table 3 and Table 4 show the simulation results of the HSPICE circuit of the FO3-RO both with and without interface trap charges at TILD = 10 and 100 nm, respectively. Comparing FO3-ROs both with and without interface trap charges, the power consumption of FO3-ROs with interface trap charges is almost same as that without them. However, the operating frequency of FO3-ROs with interface trap charges is reduced by approximately 20 and 25% at TILD = 10 and 100 nm, respectively and the propagation delay of FO3-ROs with interface trap charges is increased by approximately 30 and 36% at TILD = 10 and 100 nm, respectively.
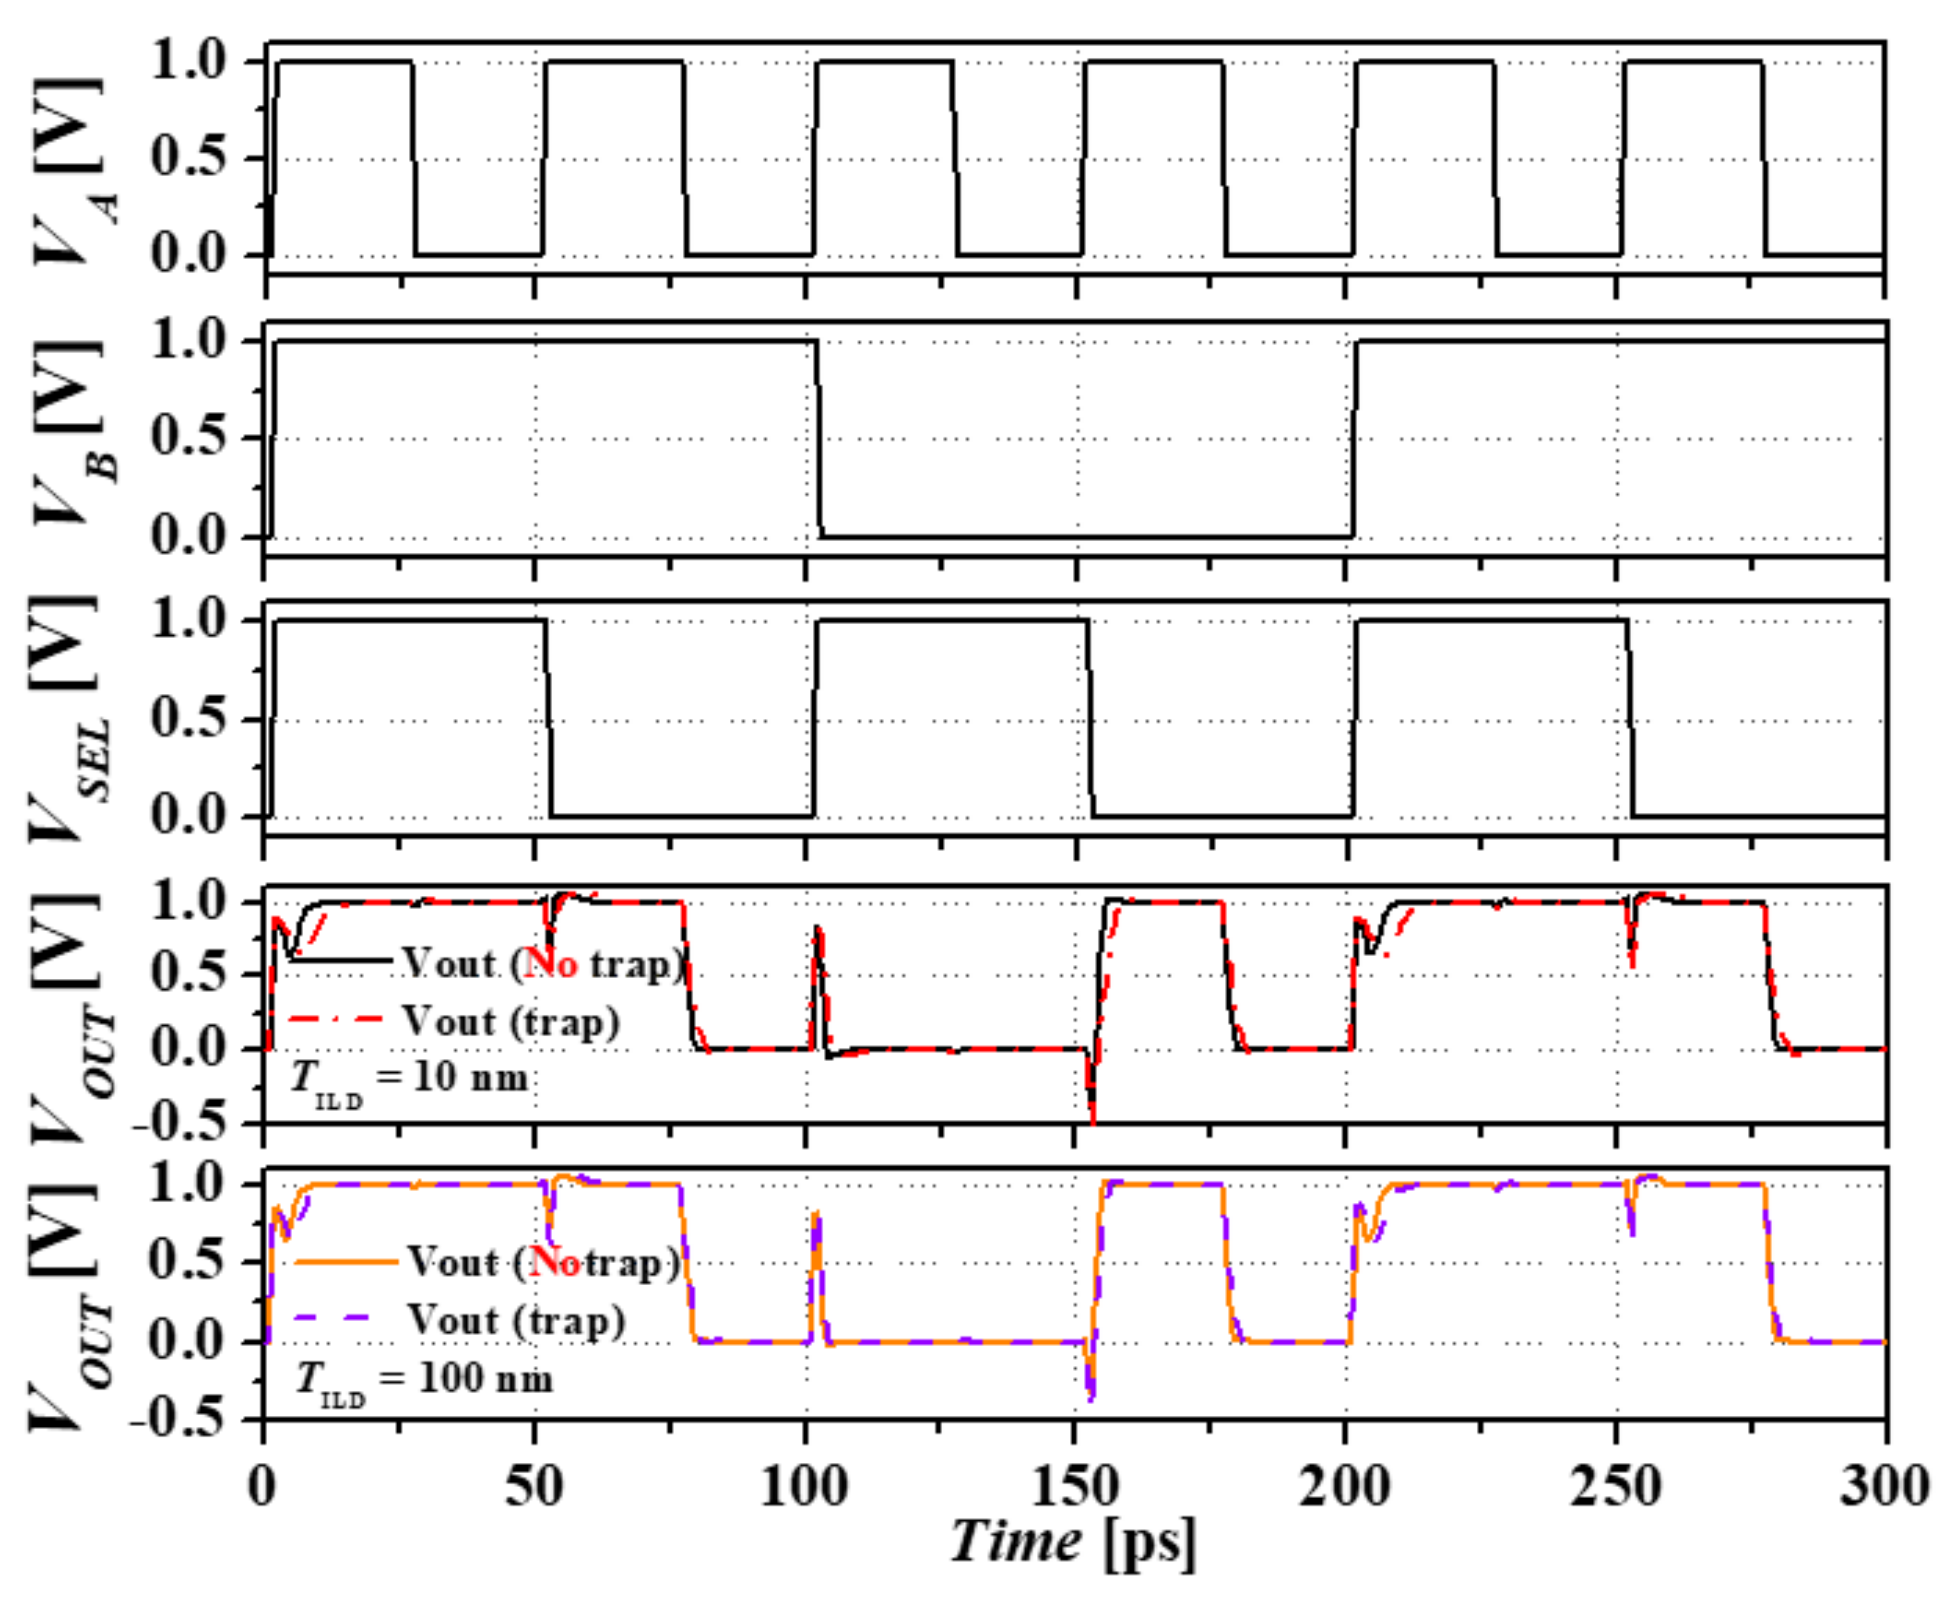
Figure 8 shows the transient simulation result of the 2 × 1 MUX consisting of M3DINVs. The VA, VB, and VSEL denote the input voltages, and VOUTs denotes the output voltage of the 2 × 1 MUX at TILD = 10 and 100 nm. The solid and dashed lines of VOUTs denote the circuit simulation results of the 2 × 1 MUX both with and without interface trap charges, respectively. Both the rising and falling propagation delay of the VOUTs with interface trap charges are larger than those without the interface trap charges.
Table 5 shows the propagation delay and power consumption of the 2 × 1 MUX and D flip-flop consisting of M3DINVs both with and without interface trap charges at TILD = 10 (and 100) nm. The propagation delays of the 2 × 1 MUX and D flip-flop with interface trap charges are approximately 78.2% (and 92.1%) and 39.6% (and 64.2%) greater than those without interface trap charges, respectively. The power consumptions of the 2 × 1 MUX and D flip-flop with interface trap charges are approximately 31.4% (and 51%) and 13.1% (and 14.7%) greater than those without interface trap charges, respectively.
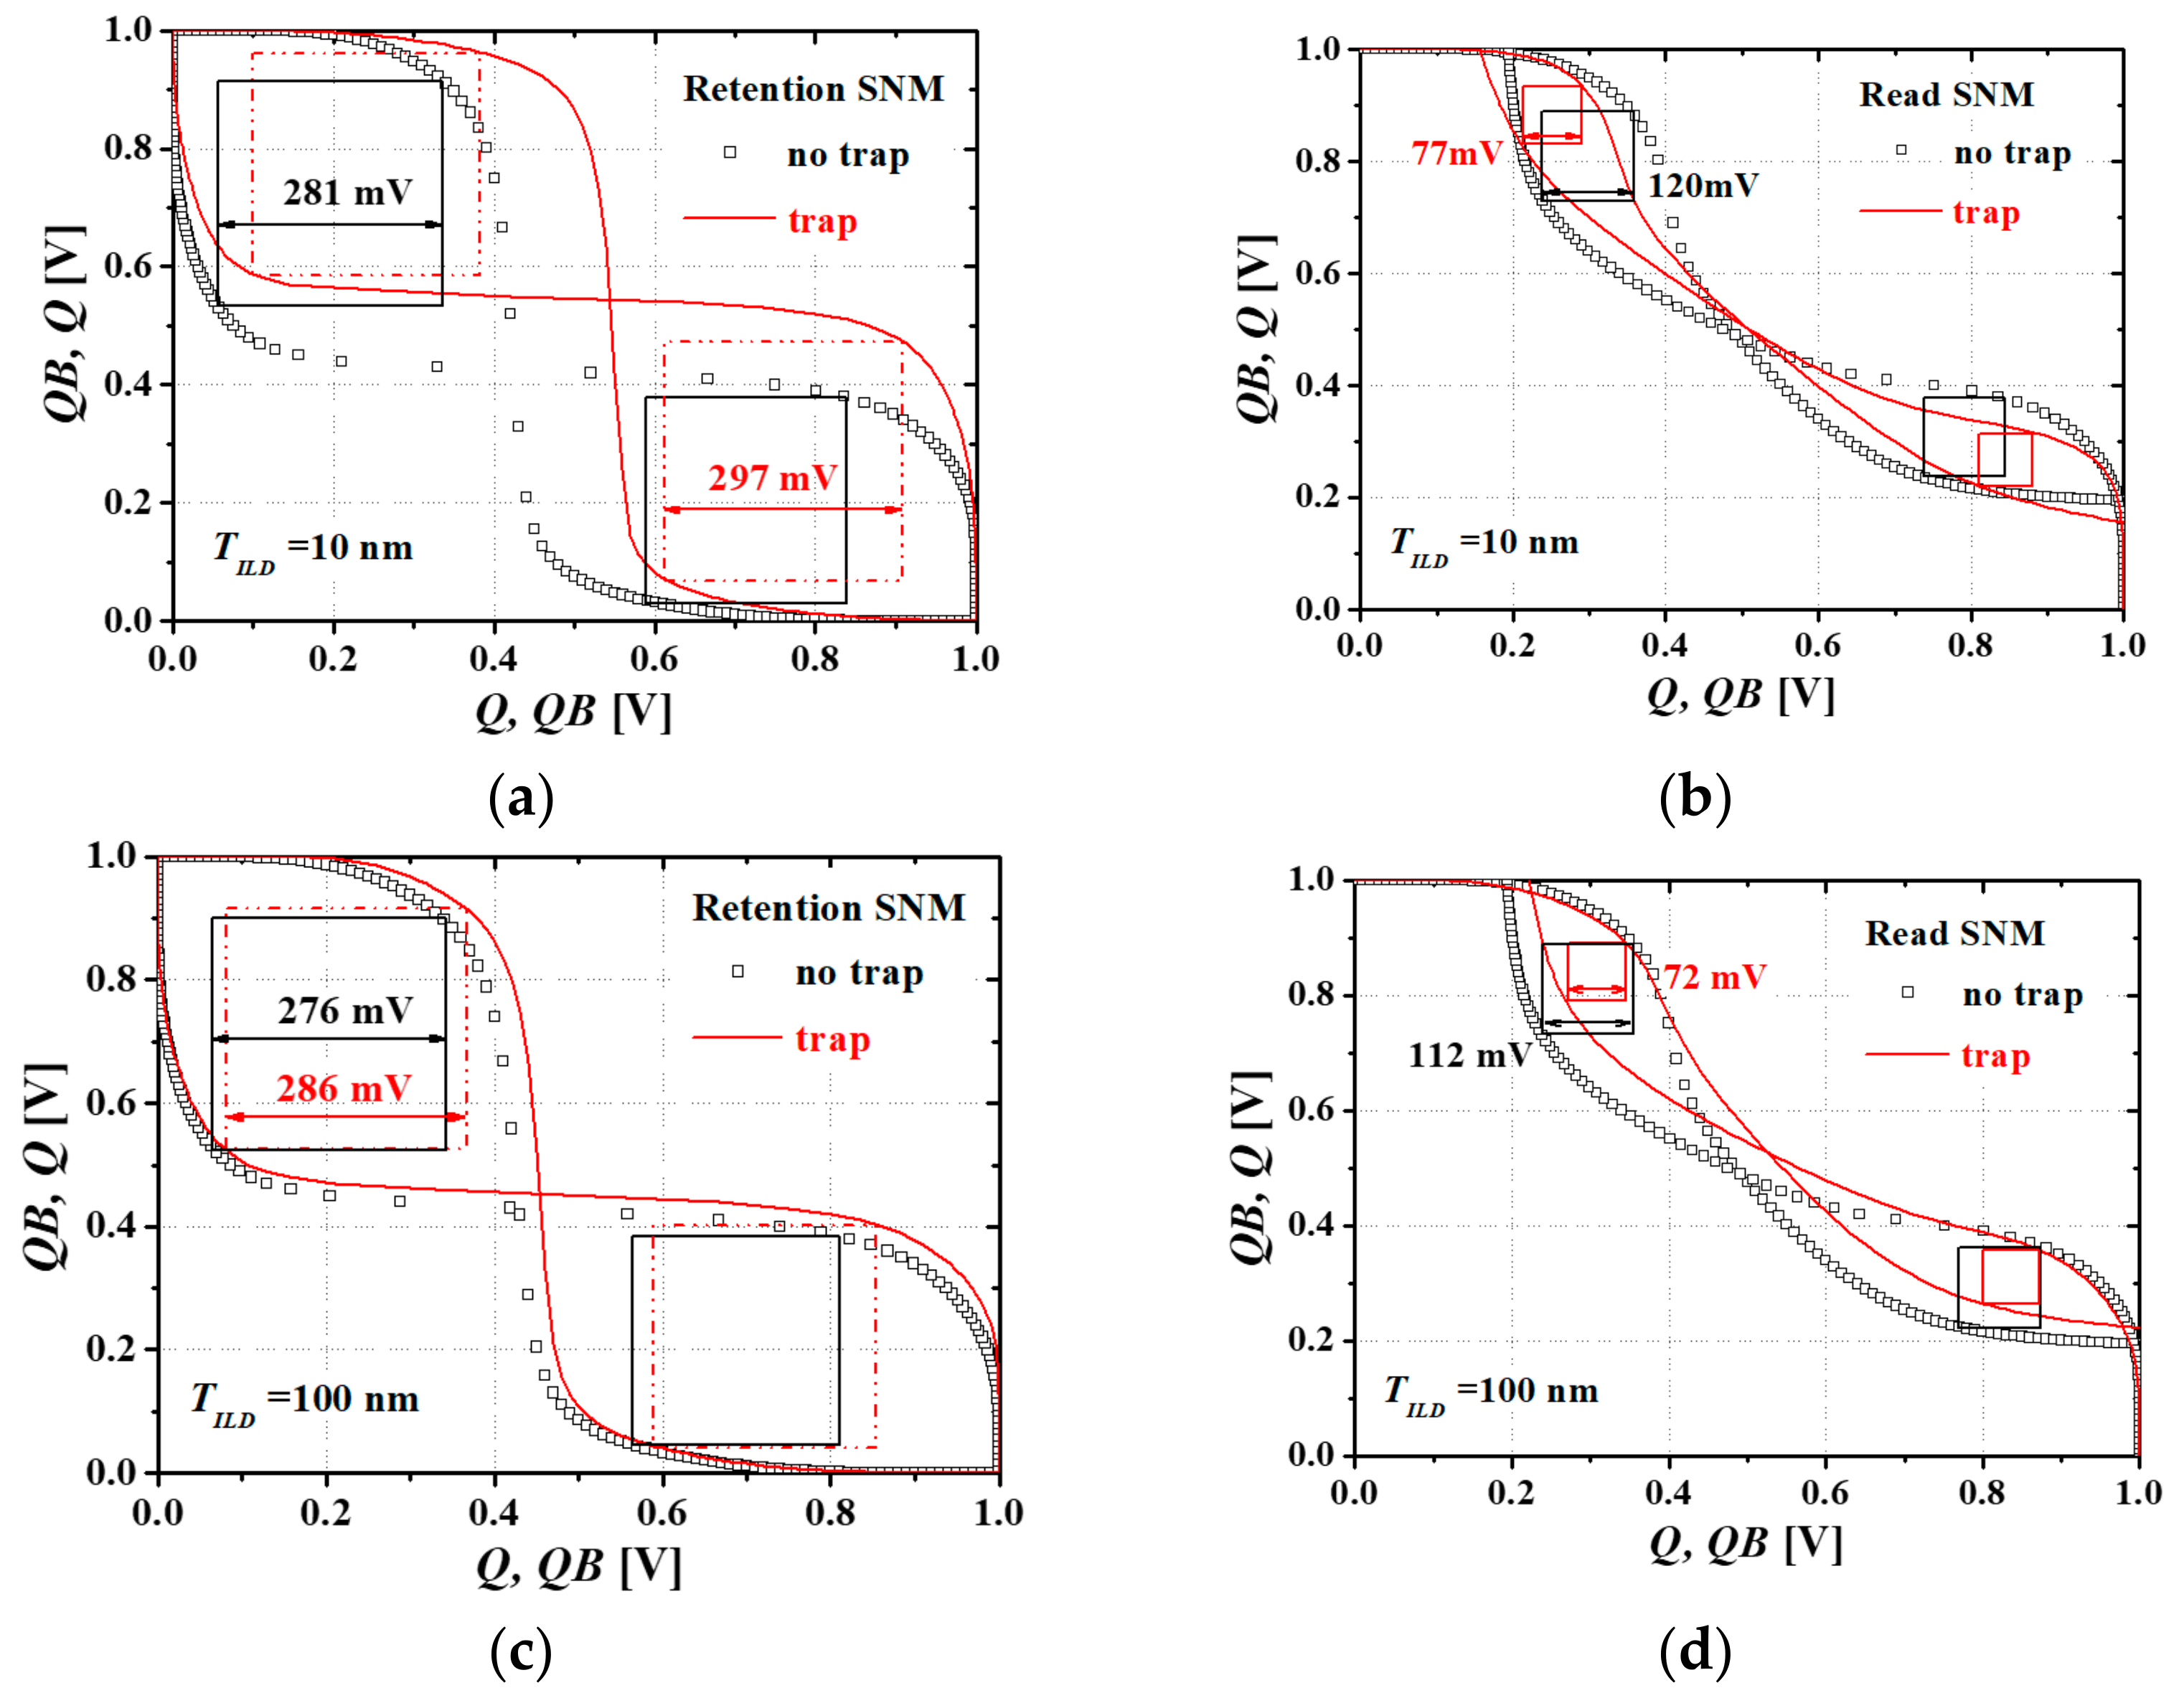
Figure 9 shows the butterfly curve result of the 6T SRAM [23] consisting of M3DINVs. Figure 9a,b shows the retention and read static noise margins (SNMs) at TILD = 10 nm, respectively. Figure 9c,d shows the retention and read SNMs at TILD = 100 nm, respectively. The symbols and lines denote the SNMs of SRAM both with and without interface trap charges, respectively. The differences between TILD = 10 and 100 nm in the retention SNMs and the read SNMs of SRAM without interface trap charge are approximately 5 mV (1.8%) and 8 mV (7.14%), respectively. They reflect the trend in SNMs of planar 6T SRAM (neglecting any coupling between the P-type and N-type MOSFETs, almost equivalent with TILD = 100 nm) and 3D 6T SRAM (including coupling between the P-type and N-type MOSFETs, almost equivalent with TILD = 10 nm) [24]. The retention and read SNMs of the SRAM with TILD = 10 nm increased by 17 mV (6.4%) and decreased by 43 mV (35.8%) owing to the interface trap charges, respectively. The retention and read SNMs of SRAM with TILD = 100 nm increased by 10 mV (3.6%) and decreased by 40 mV (55%) due to the interface trap charges, respectively.

4. Conclusions

In this paper, we investigated the effect of interface trap charge distribution extracted from the experimental data of the M3DIC fabricated by LETI [14] in terms of electrical characteristics and extracted the distribution with TCAD at two types of TILD. To simulate the circuit considering the effect of the interface trap charge in M3DICs, SPICE model parameters of P-type MOSFET (bottom) and N-type MOSFET (Top) in M3DINV, including the interface trap charge distributions, were extracted by using TCAD simulation. To verify the validity of the extracted parameters in the SPICE M3DINV model, the HSPICE simulation results were compared with the TCAD mixed-mode simulation, and they agreed well with the TCAD mixed-mode results. When the interface trap charges were considered, the current level decreased, the threshold voltage shifted, the SS became worse, and the total gate capacitance changed slightly. It was observed that the propagation delays of M3DINV with the interface trap charges increased more than those without the interface trap charges owing to a reduced on-current level due to the interface trap charges. Using the extracted parameter model, the HSPICE simulation results of the FO3 ring oscillator considering the interface trap charges showed a 20% (and 25%) reduction in frequency and a 30% (and 36%) increase in propagation delay than those without the interface trap charges at TILD = 10 (and 100) nm. The propagation delays of the 2 × 1 MUX and D flip-flop with the interface trap charges were approximately 78.2% (and 92.1%) and 39.6% (and 64.2%) greater than those without the interface trap charges, respectively. The power consumption of the 2 × 1 MUX and D flip-flop with the interface trap charges was approximately 31.4% (and 51%) and 13.1% (and 14.7%) greater, respectively, than those without the interface trap charges. The retention SNM of the SRAM increased by 16 mV (6.4%) and the read SNM of SRAM decreased by 43 mV (35.8%) owing to the interface trap charge. The retention SNM of the SRAM increased 10 mV (3.6%) and the read SNM of SRAM decreased by 40 mV (55%) owing to the interface trap charge at TILD = 100 nm. For the coupling (TILD = 10 nm), the stage propagation delay and power consumption increased. The delays and power consumptions of M3D logics with TILD = 10 (coupling) and 100 nm (non-coupling) increased owing to the interface trap charges.
Therefore, it is necessary to fully analyze the electrical performance (such as the delay, power, the integration of logic circuits, and the stability of the SRAM considering electrical coupling [11,12] and interface trap charges) when designing M3DIC and M3D memories.

Author Contributions

Conceptualization, T.J.A., S.K.L. and Y.S.Y.; methodology, T.J.A. and Y.S.Y.; investigation, T.J.A. and Y.S.Y.; data curation, T.J.A.; writing—original draft preparation, T.J.A.; writing—review and editing, T.J.A., S.K.L. and Y.S.Y.; supervision, Y.S.Y.; project administration, Y.S.Y.; funding acquisition, Y.S.Y. All authors have read and agreed to the published version of the manuscript.

Funding

This research was supported by the Basic Science Research Program through the National Research Foundation of Korea (NRF) funded by the Ministry of Education (NRF-2016R1D1A1B03932711 and NRF-2019R1A2C1085295).

Institutional Review Board Statement

Not applicable.

Informed Consent Statement

Not applicable.

Acknowledgments

This work was supported by IDEC (EDA tool).

Conflicts of Interest

The authors declare no conflict of interest.

References

  1. Thompson, S.E.; Parthasarathy, S. Moore’s law: The future of Si microelectronics. Mater. Today 2006, 9, 20–25. [Google Scholar] [CrossRef]
  2. Vinet, M.; Batude, P.; Fenouillet-Beranger, C.; Clermidy, F.; Brunet, L.; Rozeau, O.; Hartmannn, J.; Billoint, O.; Cibrario, G.; Previtali, B.; et al. Monolithic 3D integration: A powerful alternative to classical 2D scaling. In Proceedings of the 2014 SOI-3D-Subthreshold Microelectronics Technology Unified Conference (S3S), Millbrae, CA, USA, 6–9 October 2014; pp. 1–3. [Google Scholar]
  3. Turkyilmaz, O.; Cibrario, G.; Rozeau, O.; Batude, P.; Clermidy, F. 3D FPGA using high-density interconnect Monolithic Integration. In Proceedings of the 2014 Design, Automation & Test in Europe Conference & Exhibition (DATE), Dresden, Germany, 24–28 March 2014; pp. 1–4. [Google Scholar] [CrossRef]
  4. Santos, C.; Vivet, P.; Thuries, S.; Billoint, O.; Colonna, J.P.; Coudrain, P.; Wang, L. Thermal performance of CoolCube™ monolithic and TSV-based 3D integration processes. In Proceedings of the 2016 IEEE International 3D Systems Integration Conference (3DIC), San Francisco, CA, USA, 8–11 November 2016; pp. 1–5. [Google Scholar] [CrossRef]
  5. Llorente, C.D.; Le Royer, C.; Batude, P.; Fenouillet-Beranger, C.; Martinie, S.; Lu, C.-M.; Allain, F.; Colinge, J.-P.; Cristoloveanu, S.; Ghibaudo, G.; et al. New insights on SOI Tunnel FETs with low-temperature process flow for CoolCube™ integration. Solid-State Electron. 2018, 144, 78–85. [Google Scholar] [CrossRef]
  6. Coudrain, P.; Batude, P.; Gagnard, X.; Leyris, C.; Ricq, S.; Vinet, M.; Pouydebasque, A.; Moussy, N.; Cazaux, Y.; Giffard, B.; et al. Setting up 3D Sequential Integration for Back-Illuminated CMOS Image Sensors with Highly Miniaturized Pixels with low temperature Fully Depleted SOI transistors. In Proceedings of the IEEE International Electron Devices Meeting, San Francisco, CA, USA, 15–17 December 2008; pp. 1–4. [Google Scholar] [CrossRef]
  7. Batude, P.; Jaud, M.-A.; Thomas, O.; Clavelier, L.; Pouydebasque, A.; Vinet, M.; Deleonibus, S.; Amara, A. 3D CMOS integration: Introduction of dynamic coupling and application to compact and robust 4T SRAM. In Proceedings of the 2008 IEEE International Conference on Integrated Circuit Design and Technology and Tutorial, Grenoble, France, 2–4 June 2008; pp. 281–284. [Google Scholar] [CrossRef]
  8. Sideris, P.; Lugo-Alvarez, J.; Batude, P.; Brunet, L.; Acosta-Alba, P.; Kerdiles, S.; Fenouillet-Beranger, C.; Sicard, G.; Rozeau, O.; Andrieu, F.; et al. Inter-tier Dynamic Coupling and RF Crosstalk in 3D Sequential Integration. In Proceedings of the 2019 IEEE International Electron Devices Meeting (IEDM), San Francisco, CA, USA, 7–11 December 2019; pp. 3.4.1–3.4.4. [Google Scholar] [CrossRef]
  9. Lim, S.K. Bringing 3D ICs to Aerospace: Needs for design tools and methodologies. J. Inf. Commun. Converg. Eng. 2017, 15, 117–122. [Google Scholar] [CrossRef]
  10. Yu, Y.S.; Panth, S.; Lim, S.K. Electrical coupling of monolithic 3-D inverters. IEEE Trans. Electron Devices 2016, 63, 3346–3349. [Google Scholar] [CrossRef]
  11. Ahn, T.J.; Choi, B.H.; Lim, S.K.; Yu, Y.S. Electrical coupling and simulation of monolithic 3D logic circuits and static random access memory. Micromachines 2019, 10, 637. [Google Scholar] [CrossRef] [PubMed] [Green Version]
  12. Ahn, T.J.; Perumal, R.; Lim, S.K.; Yu, Y.S. Parameter extraction and power/performance analysis of Monolithic 3-D Inverter (M3INV). IEEE Trans. Electron Devices 2019, 66, 1006–1011. [Google Scholar] [CrossRef]
  13. Ahn, T.; Lee, S.H.; Yu, Y. Interface trap density distribution in 3D sequential Integrated-Circuit and its effect. J. Korea Inst. Inf. Commun. Eng. 2015, 19, 2899–2904. [Google Scholar] [CrossRef] [Green Version]
  14. Batude, P.; Vinet, M.; Xu, C.; Previtali, B.; Tabone, C.; Le Royer, C.; Sanchez, L.; Baud, L.; Brunet, L.; Toffoli, A.; et al. Demonstration of low temperature 3D sequential FDSOI integration down to 50 nm gate length. In Proceedings of the 2011 Symposium on VLSI Technology—Digest of Technical Papers, Kyoto, Japan, 14–16 June 2011; pp. 158–159. [Google Scholar]
  15. Silvaco Int. ATLAS ver. 5. 20. R Manual; Silvaco Int.: Santa Clara, CA, USA, 2015. [Google Scholar]
  16. Rozeau, O.; Jaud, M.-A.; Poiroux, T.; Benosman, M. UTSOI Model 1.1.3 Laboratoire d’Électronique et de Technologie de l’Information (Leti). Available online: http://www-leti.cea.fr (accessed on 25 May 2012).
  17. Poiroux, T.; Rozeau, O.; Scheer, P.; Martinie, S.; Jaud, M.A.; Minondo, M.; Juge, A.; Barbe, J.C.; Vinet, M. Leti-UTSOI2.1: A compact model for UTBB-FDSOI technologies—Part I: Interface potentials analytical model. IEEE Trans. Electron Devices 2015, 62, 2751–2759. [Google Scholar] [CrossRef]
  18. Poiroux, T.; Rozeau, O.; Scheer, P.; Martinie, S.; Jaud, M.-A.; Minondo, M.; Juge, A.; Barbe, J.C.; Vinet, M. Leti-UTSOI2.1: A compact model for UTBB-FDSOI technologies—Part II: DC and AC model description. IEEE Trans. Electron Devices 2015, 62, 2760–2768. [Google Scholar] [CrossRef]
  19. HSPICE. Reference Manual: MOSFET Models; Synopsys, Inc.: Mountain View, CA, USA, 2016. [Google Scholar]
  20. Planes, N.; Weber, O.; Barral, V.; Haendler, S.; Noblet, D.; Croain, D.; Bocat, M.; Sassoulas, P.-O.; Federspiel, X.; Cros, A.; et al. 28 nm FDSOI technology platform for high-speed low-voltage digital applications. In Proceedings of the 2012 Symposium on VLSI Technology (VLSIT), Honolulu, HI, USA, 12–14 June 2012; pp. 133–134. [Google Scholar] [CrossRef]
  21. Rani, T.E.; Rani, M.A.; Rao, R. AREA optimized low power arithmetic and logic unit. In Proceedings of the International Conference on Electronics Computer Technology, Kanyakumari, India, 8–10 April 2011; pp. 224–228. [Google Scholar] [CrossRef]
  22. Nasrollahpour, M.; Sreekumar, R.; Hajilou, F.; Aldacher, M.; Hamedi-Hagh, S. Low-power bluetooth receiver front end design with oscillator leakage reduction technique. J. Low Power Electron. 2018, 14, 179–184. [Google Scholar] [CrossRef]
  23. Arandilla, C.D.; Alvarez, A.B.; Roque, C.R.K. Static noise margin of 6T SRAM cell in 90-nm CMOS. In Proceedings of the UkSim 13th International Conference on Computer Modelling and Simulation, Cambridge, UK, 30 March–1 April 2011; pp. 534–539. [Google Scholar] [CrossRef]
  24. Thomas, O.; Vinet, M.; Rozeau, O.; Batude, P.; Valentian, A. Compact 6T SRAM cell with robust read/write stabilizing design in 45nm Monolithic 3D IC technology. In Proceedings of the 2009 IEEE International Conference on IC Design and Technology, Austin, TX, USA, 18–20 May 2009; pp. 195–198. [Google Scholar] [CrossRef]
Figure 1. Location of generated interface trap charges in the M3DINV cell structure. In the magnified figure for the active region (right figure), x denotes the positions of interface trap charges. Here ML, MINV, and BOX mean metal line, metal inter-layer via, and buried oxide, respectively.
Applsci 11 12151 g001
Figure 2. (a) Distribution of the interface trap charges generated in the top/bottom gate-oxide/silicon interfaces extracted from the fabricated M3DINV [13]. The inset shows the distribution of the interface trap charge generated in the ILD/silicon interface. (b) Ids-Vgs characteristics of the top and bottom MOSFETs in the M3DINV at the different Vds (= 0.1 and 1 V) using the extracted interface trap charge distribution as shown in (a). Symbols and lines denote the experimental data [14] and fitted results, respectively.
Applsci 11 12151 g002
Figure 3. Current-voltage characteristics of the bottom P-type MOSFET and top N-type MOSFET with and without interface trap charges. (a) Inds-Vpgs characteristics of the bottom P-type MOSFET at different Vpdss (with TILD = 10 and 100 nm), (b) Inds-Vngs characteristics of the top N-type MOSFET with TILD = 10 nm at different Vndss, and (c) Inds-Vngs characteristics of the top N-type MOSFET with TILD = 100 nm at different Vndss.
Applsci 11 12151 g003
Figure 4. Total gate capacitance-voltage characteristics of the bottom P-type MOSFET and top N-type MOSFET with and without interface trap charges. (a) Cpgpg-Vpgs characteristics of the bottom P-type MOSFET at different Vpdss (and TILD = 10 and 100 nm), (b) Cngng-Vpgs characteristics of the top N-type MOSFET with TILD = 10 nm at different Vndss, and (c) Cngng-Vpgs characteristics of the top N-type MOSFET with TILD = 100 nm at different Vndss.
Applsci 11 12151 g004
Figure 5. Voltage transfer characteristics of M3DINV at TILD = 10 and 100 nm. The symbols and lines denote TCAD mixed-mode and HSPICE simulation results, respectively. The filled symbols (and dashed lines) and non-filled symbols (and solid lines) denote models both with and without the interface trap charges, respectively. Vdd (= 1 V) is the DC bias of M3DINV.
Applsci 11 12151 g005
Figure 6. (a) Transient response of M3DINV at TILD = 10 nm and (b) transient response of M3DINV at TILD = 100 nm. The symbols and lines denote the TCAD mixed-mode circuit simulation and HSPICE simulation results of M3DINV, respectively. The black squares (and black solid lines), red circles (and red dash lines), and green triangles (and green dot lines) denote the input voltage VIN, and the output voltages VOUTs of M3DINV both with and without the interface trap charges, respectively. Load capacitance CL = 1 fF.
Applsci 11 12151 g006
Figure 7. Schematic used for circuit simulation. (a) Three stages fanout-3 ring oscillator, (b) 2 to 1 multiplexer, (c) D flip-flop, and (d) 6-transistor static random-access memory.
Applsci 11 12151 g007
Figure 8. Simulated transient results of a 2 × 1 MUX consisting of M3DINVs both with and without interface trap charges. The input voltages VA, VB, and VSEL, and the output voltage VOUTs of the 2 × 1 MUX both with and without interface trap charges. The solid and dashed lines of VOUTs denote HSPICE simulation results of 2 × 1 MUX both with and without interface trap charges at TILD = 10 and 100 nm, respectively.
Applsci 11 12151 g008
Figure 9. Simulated butterfly curves of the 6T SRAM cell with M3DINV. (a) The retention SNM and (b) read SNM at TILD = 10 nm. (c) The retention SNM and (d) read SNM at TILD = 100 nm. Symbols and lines denote the SRAMs both with and without interface trap charges, respectively.
Applsci 11 12151 g009
Table 1. Summary of extracted LETI-UTSOI model parameters for the bottom P-type MOSFET.
ParameterUnitDescriptionValue
DLQmEffective channel length offset CV4 × 10−8
VFBOVGeometry-independent flat-band voltage0.3
CTO-Interface states factor0.4
CICO-Geometry-independent part of substrate bias dependence factor of interface coupling2.2
CFLV−1Length dependence of DIBL1.3
UOm2/V/sZero-field mobility1.9 × 10−3
MUEOm/VMobility reduction coefficient4.3
THEMUO-Mobility reduction exponent1
FETAO-Effective field parameter3
PSCEL-Length dependence of short channel effect above threshold0.15
THESATOV−1Geometry-independent velocity saturation parameter3
AXO-Geometry-independent of linear/saturation transition factor0
ALPL1-Length dependence of CLM pre-factor ALP0.0005
VPOVCLM logarithm dependence factor0.04
CGBOVLFOxide capacitance for gate-substrate overlap9 × 10−16
CFRWFOuter fringe capacitance2.8 × 10−16
Table 2. Summary of extracted LETI-UTSOI model parameters for the top N-type MOSFET (coupling/non-coupling).
ParameterUnitDescriptionValue (TILD)
10 nm100 nm
DLQmEffective channel length offset CV4 × 10−84 × 10−8
VFBOVGeometry-independent flat-band voltage−0.175−0.26
CTO-Interface states factor0.40.4
CICO-Geometry-independent part of substrate bias dependence factor of interface coupling0.20.2
CFLV−1Length dependence of DIBL0.41
UOm2/V/sZero-field mobility1.8 × 10−23.5 × 10⁻²
MUEOm/VMobility reduction coefficient1.57
THEMUO-Mobility reduction exponent0.10.2
FETAO-Effective field parameter10
PSCEL-Length dependence of short channel effect above threshold0.140.06
THESATOV−1Geometry-independent velocity saturation parameter71
AXO-Geometry-independent of linear/saturation transition factor60.5
ALPL1-Length dependence of CLM pre-factor ALP0.00020.002
VPOVCLM logarithm dependence factor0.042
CGBOVLFOxide capacitance for gate-substrate overlap014 × 10−16
CFRWFOuter fringe capacitance2.5 × 10−162.2 × 10⁻¹⁶
RSGO-Gate-bias dependence of RS0.20.5
Table 3. FO-3 ring oscillator performance using extracted model parameters without interface trap charges (coupling/non-coupling).
StagesPower [μW]Frequency [GHz]Delay per Stage [ps]
10 nm100 nm10 nm100 nm10 nm100 nm
328127418.722.19.047.59
192792722.883.379.167.81
1012812760.520.629.287.93
Table 4. FO-3 ring oscillator performance using extracted model parameters with interface trap charges (coupling/non-coupling).
StagesPower [μW]Frequency [GHz]Delay per Stage [ps]
10 nm100 nm10 nm100 nm10 nm100 nm
328328314.215.811.7110.33
192822782.382.7311.9310.67
1012842830.4080.4512.1310.98
Table 5. Propagation delay and power consumption of the 2 × 1 MUX [21] and D FLIP-FLOP [22] consisting of M3DINVs both with and without interface trap charges (coupling/non-coupling).
2 × 1 MUXD Flip-Flop
No-trap [10]TrapNo-trap [10]Trap
TILD [nm]10100101001010010100
Propagation delay [ps]2.31.954.13.7510.2 8.3516.213.7
Power Consumption [μW]22.618.429.727.841.939.347.445.1
Publisher’s Note: MDPI stays neutral with regard to jurisdictional claims in published maps and institutional affiliations.