Abstract
In the context of energy conservation and sustainable development, building design should take into account the energy efficiency criteria by using renewable energy sources. Double-skin facades (DSF) represent innovative energy-efficient techniques that have gained increasing interest worldwide. The present study reports the results of an experimental campaign performed on a full-scale double-skin façade using the in-situ measurement methodology. The thermodynamic behavior of the façade is studied under real exterior climatic conditions in Romania in hot and cold seasons, and performance indicators in terms of pre-heating efficiency and dynamic insulation efficiency were determined. Three summer periods are analyzed corresponding to the outdoor air curtain scenario for three ventilation modes in naturally or mechanically ventilated single-story DSF. Results revealed that the third ventilation scenario, which combines horizontal and vertical openings, gives the best efficiency of 71.3% in the double skin façade functioning. During the cold season, the channel façade behaved like a thermal buffer between the building and the exterior air, ensuring the thermal energy for partial or integral heating of the building.
1. Introduction
With the worldwide need for sustainable development, double skin façades were developed like strategies and technologies for decreasing the operational consumption of energy during a building’s life cycle. Double Skin Façades (DSF) are building envelopes composed of two layers of glass separated by a ventilated air channel that acts as a thermal agent to improve indoor thermal comfort.
Numerous experimental and numerical studies have been conducted mainly in countries where these façades have been widely applied. More publications are related to experimental studies carried out on test facilities, under real weather conditions. Corgnati et al. [1] present extensive experiments on an active transparent façade, mechanically ventilated, in Italy. Saelens et al. [2] present measurements carried out at the Vliet test building of the Laboratory of Building Physics in Leuven, Belgium. It was shown that the location of the inlet air, airflow rate, and airflow distribution are important parameters that affect the performance of a DSF. These types of measurements are also presented by Zanghirella [3]. Using TWINS, the test facility for experimental investigation, a methodology was proposed to assess the energy performance of active transparent façades. Also, using the Permasteelisa campus, equipped with full-scale test rooms, Fuliotto [4] conducted experimental research on DSF, in terms of both energetic consumption and internal environmental conditions.
Many studies have been performed in situ, on real buildings, by monitoring parameters for long periods of time (minimum one year) [5], determining the behavior of the façade under the influence of different climatic conditions and occupant perception on overall comfort. In general, such studies are the only ones that can provide information on the global interaction of the façade with the occupied building. Given that in situ monitoring requires restricted areas for the tests and periodic inspections of devices, experimental models are tested in the laboratory or in situ by building rooms subject to outdoor climate conditions.
Experimental studies on ventilated façades and fully glazed double skin type were carried out in laboratory conditions [6,7,8]. In addition, Gavan et al. [9] performed an experimental study in laboratory conditions, on a full-scale facility of DSF equipped with Venetian blinds, to minimize the radiation transmitted during the hot season to avoid overheating.
Due to the transient and complex air flow in the façade channel, the influence on the indoor environment and energy consumption is challenging to evaluate. Therefore, Computational Fluid Dynamics (CFD) can play an essential role in assessing and improving the thermodynamic behavior of a double skin facade. Andjelković et al. [10] presented a mathematical model to study the energy performance of a ventilated façade. Ignjatović et al. [11] investigated the influence of glazing types and ventilation principles in double skin façades on delivered heating and cooling energy during the heating season. Matour et al. [12] studied by CFD techniques the effects of opening configurations on airflow behavior, showing that the ratio between the areas of the front and lateral openings is a critical factor for improving the ventilation in the cavity at the wind incident angle between 0° and 30°. Also, it was concluded that employing three front openings on the external skin of DSF can increase the system’s effectiveness in a broader range of wind direction and cavity size. Recently, Tao et al. [13,14] studied the naturally ventilated double-skin façade (NVDSF) with adjustable louvers. Using CFD techniques, they established the impacts of solar angle and intensity on natural ventilation rates, concluded that louvers can enhance or weaken natural ventilation compared to those without louvers. In all studied cases, it was concluded that adding a DSF zone to the south wall of the building leads to the decrease of delivered heating energy.
Most studies have been conducted in the Mediterranean climate [15,16], temperate climate [17,18,19,20], and cold climate conditions [21,22], summarizing the effect of structural parameters of DSF on thermal performance. For some studies, it was established that corresponding results could provide some reference for the buildings in similar climate regions [22]. The research has been extended to wet conditions [23,24], arid tropical climate [25,26], and, more recently, to a combined hot and humid environment [27] or a combined hot and dry climate [28]. In the context of an arid climate, it is argued that the cavity depth should be between 600 and 1000 mm to allow these areas to solve specific problems related to the presence of sand. Regarding the possibility of applying these facades in buildings located in specific climatic conditions of countries like Turkey, a significant reduction in energy consumption for heating in the winter was obtained [29].
Năstase et al. [30] studied the difference between a single skin facade and a box double skin facade from a heat transfer point of view, showing an increase in envelope insulation with benefits during the cold season. The mathematical model proposed and the analyses of the heat transfer indicators were described by tabular values and by one year chart for the Brasov region, in Romania.
Kuznik et al. [31] presented numerical modeling of a double skin façade (DSF) combined with a full-scale DSF experimentally studied in summer configuration with different airflow rates through the air channels of the façade and for different angles of the solar shading devices.
A recent study [32] investigated the evolution of building energy retrofit via double-skin and responsive façades, to show the development and adaptability to the current NZEB requirements. Hou et al. [33] investigated how constructional features affect the behavior of double skin façades (DSFs). In a review containing nearly 70 scientific articles on mechanically and naturally ventilated DSFs tested in different countries and climates (but none from Romania), it was established that complex interactions between more than one parameter at a time are primarily unexplored.
There are studies regarding DSF channel ventilation mode (between the cavity and external glazing openings) using openings on the lateral side of the channel. To avoid the overheating of the channel, the horizontal ventilation was studied experimentally [34] and numerically [35] or a supplementary lateral opening was adopted on the external glazing of the DSF [36]. This one can be a solution applied to enhance the wind-induced cavity natural ventilation using pressure differential.
However, there are very few buildings in which double-skin façades have actually been fully realized in Romania and little experience of the system behavior in operation. Furthermore, the specific climatic conditions of continental temperate are characterized by warm summers and cold winters, and these conditions differ from climates where DSFs have been widely applied.
In this study, an experimental analysis of double skin ventilated façade was conducted in the specific climate conditions of Romania, in July and November, for different strategies of ventilation in order to determine the thermodynamic behavior and performance assessment in terms of pre-heating efficiency during the cold season and the dynamic insulation efficiency during the hot one. This study aims to reflect on strategies for DSF that are responsive to the particular climate type. Moreover, in the hot season of the temperate climate, the combination of the vertical openings on the top of the ventilated channel with the lateral ones on the exterior glazing of the DSF is proposed.
2. Experimental Description
The study was carried out for a single-story façade built on the southwest face of the INCERC Laboratory of Applied Research and Testing in Constructions, National Institute of Research and Development URBAN-INCERC Iasi, a city in the north-east of Romania (Figure 1). The test facility was designed for thermal and airflow investigations of the DSF performance, functioning under natural or mechanical conditions and using various ventilation principles (outdoor air curtain, indoor air curtain, air supply, air exhaust, buffer zone) [37].
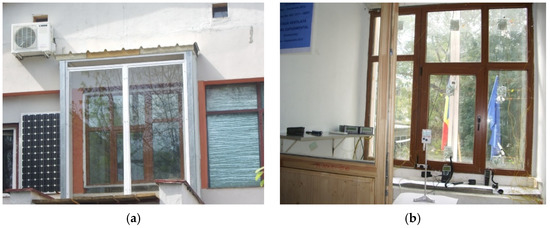
Figure 1.
View of the double-skin façade: (a) from the outside of the building and (b) from the inside of the interior room.
The experimental double-skin facade measured 2.0 m width by 2.8 m high and included the double skin glass façade and an interior room (Figure 2). The inner skin of the façade was a 24 mm thick double-insulated glass and the outer one was a single 12 mm thick clear glass pane. The central part of the inner skin was designed to be opened and to facilitate access to the channel for experimental testing, cleaning, and maintenance purposes. The external skin was composed of two fixed parts of simple glazing for reasons of mechanical resistance. The air cavity between the two glazing panes was 0.45 m wide. Two openings were included in the exterior glazing of DSF, one for the air inlet located at the bottom of the façade and one for the air outlet in the upper part. The openings for ventilation with 0.1 m high cover the whole width of the stand.
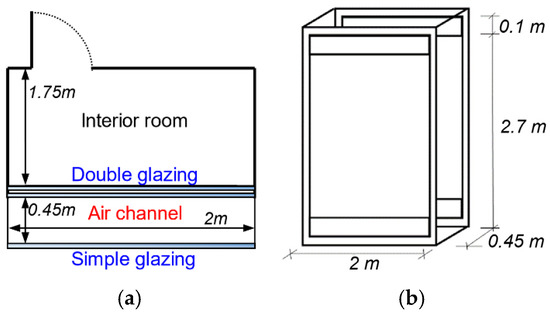
Figure 2.
Schematic view of the double-skin façade: horizontal section (a) and perspective (b).
The interior room measures 2.0 m wide, 2.8 m high, and was 1.75 m in width and was very well insulated to reduce the influence of the indoor environment on the façade (Figure 2a). Using a cooling unit, the temperature of the test chamber was kept constant (27 ± 0.5 °C) starting on day 3 of each summer period (SET1-3). The interior chamber was left unconditioned for the first two days of these periods. For this experiment, no sun-shading device systems were used. The DSF materials and construction details and thermal and optical properties are presented in Table 1.

Table 1.
Thermal and optical properties of DSF glass.
The experimental campaigns included four periods specific to the climate in Romania: three periods in the hot season of July corresponding to three modes of air curtain ventilation (ascendant air circulation between the exterior inlet and exterior outlet sections) and one period in the cold season of November for the buffer mode of DSF (closed air channel), Figure 3.
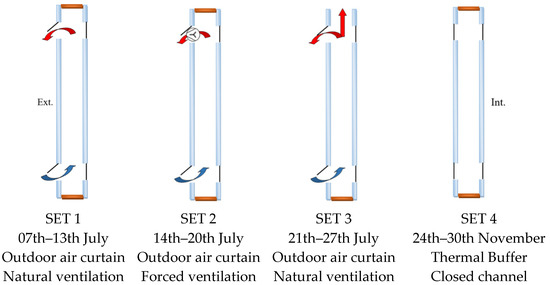
Figure 3.
DSF ventilation modes according to the periods of experiments.
In the first period (SET 1: 7th–13th July), the exterior air inlet and the exterior air outlet were open, and natural ventilation occurred inside the channel.
In the second period (SET 2: 14th–20th July), due to the overheating problem that occurred inside of the DSF channel, the cavity was mechanically ventilated by adding three VORTICE fans in the upper opening of the exterior façade, each with a flow rate of 85 m3/h (SET 2) and an electrical power of 15 W. The choice of the ventilation air rates was based on the criterion of minimum energy consumption of the fans. A higher air flow rate will cool the channel better but with more energy consumption, which will lower the benefits of the system.
To improve the natural ventilation of the channel and eliminate energy consumption for ventilation, in the third period (SET 3: 21st–27th July), the evacuation of air occurs through the exterior air outlet and the upper part of the cavity over its entire section.
In the fourth period of the cold season (SET 4: 24th–30th November), in order to recover the heat loss from the building and to capitalize the solar thermal energy accumulated through the greenhouse effect during the day, the DSF channel was completely closed forming a buffer zone between the building and the exterior air.
2.1. Temperature Measurements
The DSF was equipped with 34 thermocouples type T (copper—constantan) connected to two dataloggers INFOSTAR ISU-L2-C24M with 24 inputs each (Figure 4c), which automatically collected data with a scan rate of 15 min. Thus, 10 thermocouples were used to measure air temperatures and 24 for glass surface temperatures (Figure 4a,b).
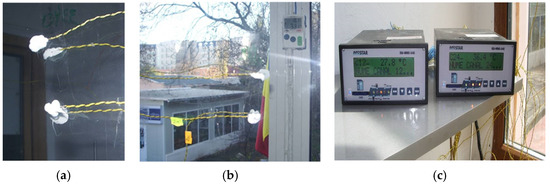
Figure 4.
Type T thermocouples on DSF glass surfaces (a), thermo-hygrometer KIMO KTH 300 A KISTOCK (b), and Datalogger INFOSTAR ISU-L2-C24M (c).
The type-T thermocouples for air temperature measurements were placed in three horizontal sections, located at different heights above the floor level (0.5 m, 1.20 m, and 2.15 m, respectively) and 0.5 m from the lateral cavity closures, Figure 5. The air temperatures at the inlet and the outlet of the channel were measured at two points, each with thermocouples of the same type. In addition, the temperatures of the glass surfaces were measured on both sides, towards the air channel and the interior room.
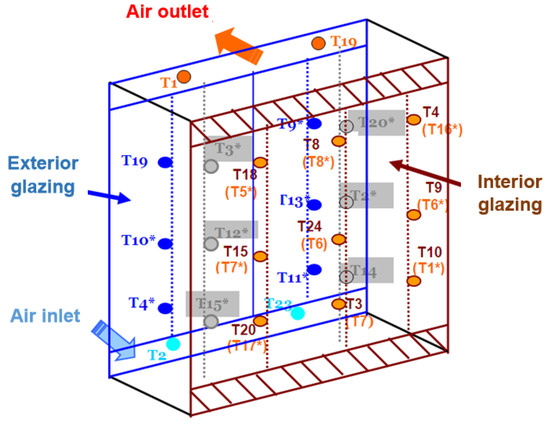
Figure 5.
Locations of thermocouples for measuring air and surface temperatures. Air temperatures:  T2*, T3*, T12*, T14*, T15*, T20*—inside the DSF channel (Tcav);
  T1, T19—to the exterior outlet from the channel (Tout);
  T2, T23—to the exterior inlet in the channel (Te). Surface temperatures of the outer glass:
  T4*, T9*, T10*, T11*, T13*, T19—towards the air channel (Ts,e). Surfaces temperatures of the inner glass:
  T3, T4, T8, T9, T10, T15, T18, T20, T24—towards the interior chamber (Ts,i,i);
  T1*, T5*, T6, T6*, T7, T7*, T8*, T16*, T17*—towards the air channel (Ts,i,e).
 T2*, T3*, T12*, T14*, T15*, T20*—inside the DSF channel (Tcav);
  T1, T19—to the exterior outlet from the channel (Tout);
  T2, T23—to the exterior inlet in the channel (Te). Surface temperatures of the outer glass:
  T4*, T9*, T10*, T11*, T13*, T19—towards the air channel (Ts,e). Surfaces temperatures of the inner glass:
  T3, T4, T8, T9, T10, T15, T18, T20, T24—towards the interior chamber (Ts,i,i);
  T1*, T5*, T6, T6*, T7, T7*, T8*, T16*, T17*—towards the air channel (Ts,i,e).
Air temperature in the interior room was measured at 1.25 m from the interior glazing at a height of 1.20 m. To accurately measure the temperatures, the copper—constantan thermocouples were calibrated using the ice bath technique [20], Figure 6a,b.
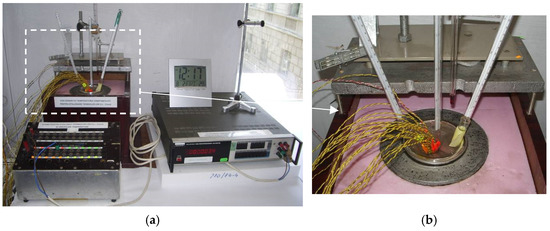
Figure 6.
Thermocouple’s calibration using an ice bath.
In order to monitor the humidity inside the DSF channel, a thermo-hygrometer KIMO KTH 300A KISTOCK with KILOG software was placed at a height of 1.20 m from the bottom of the channel, Figure 4b.
2.2. Air Velocity Measurements
The air velocities were measured for the three first modes of air curtain ventilation (SET 1–3), inside the DSF channel in three points: at the inlet, in the middle at 1.4 m height, and at the outlet using a multifunctional device KIMO AMI 300 with hot wire probe, Figure 7a–c.
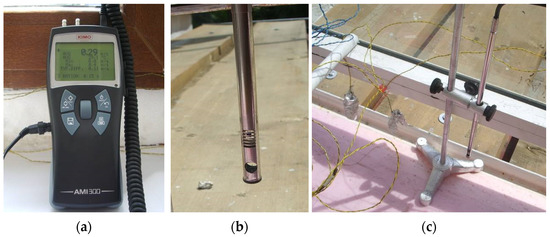
Figure 7.
Air velocity measurement at the inlet in the channel using the hot wire probe.
2.3. Measurements of Climatic Parameters
To measure the outdoor temperature, together with the other outdoor climatic parameters (solar radiation, wind speed, and direction), the Meteorological Station Davis Instruments Vantage Pro2 with WeatherLink software was used, located on the building where the experimental facility was built, Figure 8a,b. Meteorological data were collected daily at an interval of 5 min. Still, there were also periods when the weather station did not make any recordings due to technical problems (fluctuations in power supply, which caused the data console to shut down). The values recorded in the four periods in which the measurements were performed on the experimental stand are presented in Table 2, Table 3, Table 4 and Table 5. All three summer periods have approximately the same daily maximum solar irradiation, and the prevailing wind direction is north.
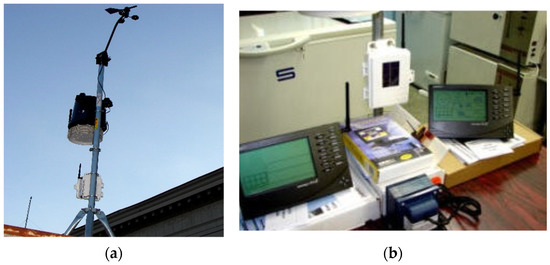
Figure 8.
Meteorological Station Davis Instruments Vantage Pro2.

Table 2.
Climatic data recorded by the weather station—SET 1: 07th–13th July.

Table 3.
Climatic data recorded by the weather station—SET 2: 14th–20th July.

Table 4.
Climatic data recorded by the weather station—SET 3: 21st–27th July.

Table 5.
Climatic data recorded by the weather station—SET 4: 24th–30th November.
3. Results and Discussions
3.1. Temperatures Prediction
Figure 9, Figure 10, Figure 11 and Figure 12 present for the four periods of measurements and ventilation modes, the variations of the exterior air temperature, which also represents the air temperature at the entrance of the channel (Te); the average temperature inside the DSF channel (Tcav); the temperature difference between the air inlet and outlet openings (DT); for the facade ventilated, respectively, the temperature difference between the air channel and the exterior for the closed façade (DT); the temperature in the interior room (Ti); and the solar radiation intensity (It). The air temperatures were calculated as the average of the values measured in different points inside the channel (T2*, T3*, T12*, T14*, T15*, T20*), inlet section (T2, T23), and outlet section (T1, T19), Figure 5.

Figure 9.
Evolution of air temperatures and solar radiation intensity in the first period (07th–13th July), outdoor air curtain, natural ventilation.

Figure 10.
Evolution of air temperatures and solar radiation intensity in the second period (14th–20th July), outdoor air curtain, forced ventilation.

Figure 11.
Evolution of air temperatures and solar radiation intensity in the third period (21th–27th July), outdoor air curtain, natural ventilation.

Figure 12.
Evolution of air temperatures and solar radiation intensity in the fourth period (24th–30th November), thermal buffer, closed channel.
The monitoring results show that for the first ventilation scenario (SET 1, Figure 9), the maximum air temperature (Tcav) inside the channel reaches 47.4 °C on the third day (13:00 p.m.) for an exterior temperature (Te) of 37.6 °C and a solar radiation intensity (It) of 533 W/m2, which is due to the greenhouse effect between the two layers of glass. The minimum value recorded inside the channel is 21.3 °C (6th day, 5:00 a.m.) when the exterior one is 20.3 °C. It can be observed that daily, the two temperatures are almost equal between 06:00 p.m. and 6:00 a.m. and a maximum difference of about 10–13 °C is recorded around noon (10:00 a.m.–02:00 p.m.), depending on the day, when the DSF channel becomes overheating. This justifies the introduction of Venetian blinds inside the channel to reduce the heating of interior room from solar radiation [9]. The average value of the air inside the channel, Tcav for the entire period is 31.8 °C compared with the exterior one of 27.5 °C, for a wind speed of 1.6 km/h (N-NE direction). The average air relative humidity inside the channel has typical a value of 47%. The temperature inside the adjacent room of DSF (Ti) in the first two days without conditioning follows the variation of Tcav and Te with an average value of 31.5 °C. Even if the exterior and the channel temperatures drop between 09:00 p.m. and 10:00 a.m., the air temperature of the interior room decreases very slowly at a minimum of 29.7 °C.
To facilitate the heat removal from the DSF channel, in the second period of measurements (SET 2, Figure 10) forced ventilation was chosen. The results show that the temperature variation inside the channel is closely related to the exterior ones with a maximum value of 47.7 °C on the second day (01:00 p.m.) for an exterior temperature (Te) of 36.8 °C and a solar radiation intensity (It) of 540 W/m2. This shows that forced ventilation does not have a significant impact on the temperature reduction inside the channel in the overheating period of 10:00 a.m.–02:00 p.m. when the average difference between the exterior ones remains around 12 °C. The minimum value recorded inside the channel was 16.8 °C (sixth day, 6.00 a.m.) when the exterior one has the same value. Compared to the SET1, the introduction of the three ventilators in the lateral outlet of the exterior glazing facilitate the channel temperatures to reach the exterior ones rapidly for a more extended period, between 04:00 p.m. and 08:00 a.m., and a drop of the solar intensity has a quick impact on them. The average air relative humidity inside the channel is recorded to be 48.3%, and the average value of the air temperature inside the channel, Tcav for the entire period is 29.0 °C for an exterior one of 24.9 °C and a wind speed of 2.2 km/h (N direction).
In the third ventilation scenario (SET 3, Figure 11) of summer conditions, two openings at the top of the channel were chosen (lateral and vertical) to naturally ventilate the DSF channel. In this case, the temperature difference between the channel and the ambient reaches small values of 7–10 °C between 10:00 a.m.–02:00 p.m. The maximum air temperature (Tcav) inside the channel reaches 44.8 °C on the sixth day (01:00 p.m.) for an exterior temperature (Te) of 34.9 °C and a solar radiation intensity (It) of 545 W/m2. The average value of the air inside the channel, Tcav, for the entire period is 29.08 °C compared with the exterior one of 26.07 °C with a difference of 3 °C, smaller than the first natural ventilation with one lateral opening, in the same weather conditions. The temperatures inside the channel and the exterior ones have almost the same value between 04:00 p.m. and 8:00 a.m. with an average difference of 1 °C, thus reducing the period of channel overheating. Compared to forced ventilation, the change in solar radiation intensity during the day has less impact on the temperatures of the DSF channel. The minimum value recorded inside the channel is 18.5 °C (3rd day) at 6:00 a.m. when the exterior one is 17.6 °C. The average air relative humidity inside the channel is comparable with the previous ones for the summer season of 47.8%. A time shift of approximately one hour exists between the highest solar radiation and the maximum temperature recorded in the channel [38].
Results for the first three ventilation scenarios during the summer season are synthesized in Table 6.

Table 6.
Synthesized results of the ventilation scenarios during the summer season.
In the cold season in November (SET 4, Figure 12), the lateral and vertical openings are closed, and the channel façade behave like a thermal buffer. The aim was to recover the heat from inside the building and to valorize the greenhouse effect from solar radiation. Thus, it can be observed that the temperatures inside the DSF channel are more significant than the exterior ones with an average value of 2.2 °C for smaller solar radiation intensity of around 20 W/m2 (8:00 a.m.–04:00 p.m.) in the first four days of the monitored period. On days 5 and 6, when the solar radiation intensity has maximum values around 12:00 a.m. (144 W/m2), the temperature inside the channel reaches 21.1 °C for an exterior one of 6.6 °C. Also, in this period of a day, the temperature inside the DSF adjacent chamber, where no conditioning system is functioning, reaches a comfort zone of 20 °C. During the night, Tcav records an average of 7 °C for an exterior one of 5 °C, and the temperature inside the interior room is around 16 °C. During the cold season, the time shift between the glass and cavity temperature is less than one hour, because of the small thermal mass available.
In this particular case of no ventilation, the channel’s humidity plays an essential role because of the condensation risk. Thus, the average recorded value of the relative air humidity recorded in the DSF channel was 80%, with a maximum of 94.9%, Figure 13. It can be seen that the humidity has more significant values during the night and morning when the temperatures are lowered, favoring the appearance of condensation on the DSF surfaces inside the channel, Figure 14.
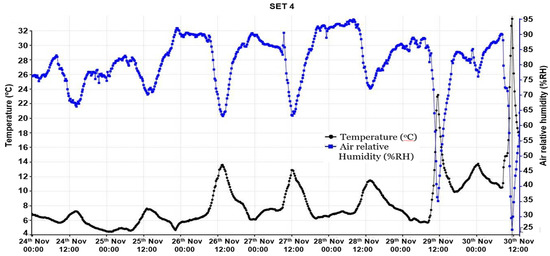
Figure 13.
Evolution of air temperatures and relative humidity in the fourth period of cold season.
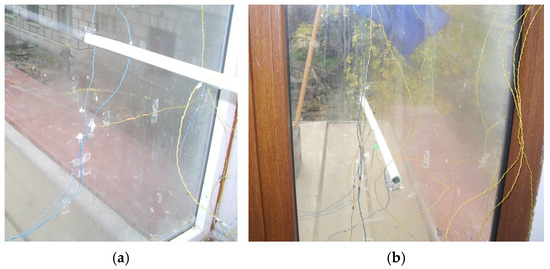
Figure 14.
Condensation phenomena inside the DSF channel (a) exterior glazing—view from inside the channel, (b) interior glazing—view from inside the interior room.
Figure 15, Figure 16, Figure 17 and Figure 18 present for the four periods of measurements and ventilation modes, the variations of the exterior air temperature (Te), the surface temperature of the outer glass (Ts,e), the average temperature inside the DSF channel (Tcav), the surface temperature of the inner glass towards the air channel (Ts,i,e) and towards the interior chamber (Ts,i,i), the temperature in the interior room (Ti), and the solar radiation intensity (It). The surface temperatures averaged over the height of the channel on the outer glass at six points (T4*, T9*, T10*, T11*, T13*, T19), on the inner glass at nine points (T1*, T5*, T6, T6*, T7, T7*, T8*, T16*, T17*), and on the surface of the inner glass inside the chamber at nine points (T3, T4, T8, T9, T10, T15, T18, T20, T24), Figure 5.

Figure 15.
Evolution of surface temperatures and solar radiation intensity in the first period (07th–13th July), outdoor air curtain, natural ventilation.

Figure 16.
Temporal distribution of the surface temperatures during the first period for the seventh day (13th July).

Figure 17.
Evolution of surface temperatures and solar radiation intensity in the second period (14th–20th July), outdoor air curtain, forced ventilation.

Figure 18.
Evolution of surface temperatures and solar radiation intensity in the third period (21st–27th July), outdoor air curtain, natural ventilation.
The first scenario of natural ventilation with lateral openings (SET 1) is presented in Figure 15. During the day, the surface temperatures are highly correlated with solar radiation. The surface temperature of the DSF channel side of the exterior glazing (Ts,e) is lower than the air inside the channel (Tcav) and more significant than the exterior (Te) one between 08:00 a.m. and 16:00 p.m. and almost the same during the night with an average difference of 1.2 °C. This tendency can also be observed in Figure 16, which presents the thermal distribution during the 7th day of the first scenario. Both interior surfaces Ts,e and Ts,i,e have almost equal temperatures. The air inside the channel (Tcav = 41.2 °C) becomes warmer than the exterior glazing (Ts,e = 30.9 °C) during the high values of solar radiation between 08:00 a.m. and 16:00 p.m. with a maximum difference of 10.3 °C in the seventh day (11:00 p.m.) for an exterior temperature (Te) of 25.8 °C and a solar radiation intensity (It) of 504 W/m2. An average value for the entire period of 29.3 °C is recorded for both glazing surfaces inside the channel (Ts,e and Ts,i,e), situated between the air temperature inside the channel, Tcav of 31.4 °C and the exterior one of 28.0 °C. Because of the low interior double glazing U-factor, the interior surface temperature (Ts,i,i) is lower with 2 °C, tempering the indirect solar gains.
During the second measurement period (SET 2, Figure 17), the forced ventilation does not change the variation tendency of surfaces temperatures inside DSF. The average difference between the surface temperatures and the air inside the channel is 2.8 °C higher for the last one, compared with the first scenario of 2.5 °C. This is because the temperature on the glass surface inside the room is lower than the room air and depends on direct solar radiation. The maximum recorded difference of 11.3 °C between the interior surfaces Ts,e and Ts,i,e inside the DSF channel and the air inside was recorded during the day at 11:00 a.m., when the air inside the DSF channel heats up due to the greenhouse effect. An average value for the entire period of 26.3 °C is recorded for Ts,e and Ts,i,e, relative to the air channel, Tcav of 29.0 °C, and the exterior one of 24.9 °C.
In the third ventilation scenario (SET 3, Figure 18) of summer conditions, a maximum difference of 7.3 °C of the air channel is reached relative to the exterior glazing on the fourth day of measurements at 12:00 p.m., smaller than in the first two monitoring periods. The temperatures of the glass surfaces are higher relative to the ones of the exterior air and lower than ones of the cavity air, during the direct solar radiation, between 07.00 a.m. and 04:00 p.m., when they become almost equal. In this period, an average of 27.1 °C is recorded for glass surfaces relative to the air temperature inside the channel of 29.1 °C and to the exterior one of 26.1 °C.
In the specific functioning of the fourth ventilation scenario (SET 4, Figure 19) during the cold season, the surface of the double glazing towards the channel Ts,i,e is warmer than the exterior side of the channel (Ts,e), which is due to the heat loses from the interior room. The difference reached a maximum value of 13.7 °C (Ts,i,e = 19.7 °C and Ts,e = 6 °C) at 10:00 a.m. on the fifth day of the monitored period for an exterior air temperature Te of 4.6 °C and the air channel Tcav of 8.3 °C.

Figure 19.
Evolution of surface temperatures and solar radiation intensity in the fourth period (24th–30th November), thermal buffer, closed channel.
For a smaller solar radiation intensity of around 20 W/m2, between 8:00 a.m. and 04:00 p.m., the average difference of these two surfaces (Ts,i,e and Ts,e) is 7.6 °C, higher near the interior room whose temperature is around 20 °C. During the night, this difference decreases by almost half at 2.8 °C in the conditions of the temperature inside the room of 16.3 °C. Between 10:00 a.m. and 02:00 p.m., due to the direct solar radiation on the exterior glazing, the surface temperature Ts,e exceed the cavity one by almost 2 °C. The same for the glazing surface from the interior room, Ts,i,I, which is warmer than the air only during this period with a difference of 2.4 °C. Minimum values of temperatures are recorded during the night and in the morning on the exterior glazing inside the DSF channel (around 6 °C for an exterior of 5 °C), which favors the appearance of condensation, Figure 14.
3.2. Airflow Prediction
Velocity profiles are presented in Figure 20 for the first three scenarios of the outdoor air curtain in the summer season (SET 1–3: 7th–27th July). Each velocity profile is represented in correlation with other parameters that influence the operation of the facade, namely the wind speed, the exterior temperature, and the air temperature inside the DSF channel. The velocities were measured at three points at different heights in the channel: in the middle of the inlet section (h = 0.05 m), in the middle of the channel (h = 1.4 m), and in the middle of the outlet section (h = 2.75 m). The results in each measurement point and the correlation with the day and time are presented in Table 7, Table 8 and Table 9 for each period (SET 1–3).
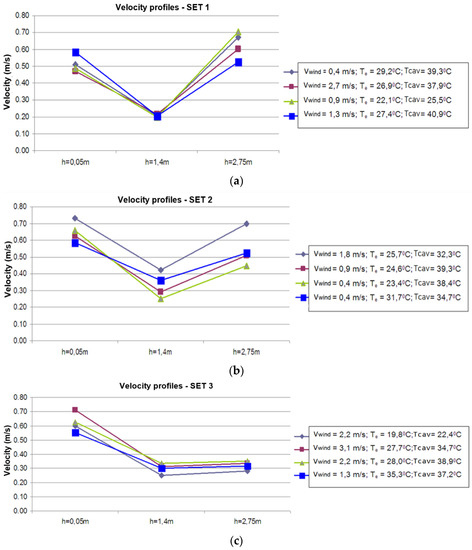
Figure 20.
Air velocity profiles inside the DSF channel for ventilation modes of summer conditions: (a) SET 1-natural ventilation with lateral opening, (b) SET 2-forced ventilation with lateral opening, (c) SET 3-natural ventilation with vertical and lateral openings.

Table 7.
Air velocities at different heights in the DSF channel for SET 1: 07th–13th July.

Table 8.
Air velocities at different heights in the DSF channel for SET 2: 14th–20th July.

Table 9.
Air velocities at different heights in the DSF channel for SET 3: 21th–27th July.
Due to the more significant section of flow, in the middle of the DSF channel, the air velocities are lower relative to the inlet and the outlet of the façade, Figure 20. This is also caused by turbulences observed in the middle section with recirculation zones near the outside glazing of the DSF channel, Figure 21. Visualizations of the airflow pattern (Figure 21) were realized in forced convection using a laser plane (532 nm Green DPSS Laser 1000 mW) and a camera (Nikon D60 with 3.0 frames per second) inside the median section of the channel, where, at the left side is the interior double glazing and at the right side is the exterior single one. Thus, the obtained qualitative results in terms of airflow patterns highlight an ascendant flow near the interior double glazing of the DSF channel and a descendant one near the exterior glazing, which validates the numerical results obtained in the previous works [37,39].
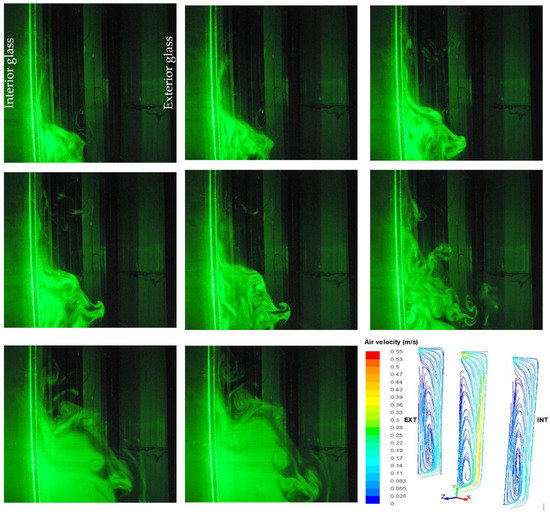
Figure 21.
Visualization of airflow patterns in the median section of the double-skin façade channel compared to the numerical ones [37].
Due to the vertical and lateral openings, the velocities in the third scenario are lower relative to the first two ones, Figure 20. The forced ventilation mode determines the turbulent character of the flow in the middle of the channel with a variation of velocities between 0.25–0.42 m/s (Figure 20b). In the natural airflow ventilation scenarios (Figure 20a,c), the velocities inside the channel are almost constant for the lateral openings and a slight variation of 0.25–0.31 m/s for the lateral and vertical openings. This is because the air velocity at the inlet section depends on the wind speed and a higher temperature of the air inside the channel determines higher velocities in natural convection.
3.3. Energy Efficiency
Two different kinds of efficiency have been defined in order to assess the performance of the double-skin façade in terms of energy savings [1]:
- -
- Pre-heating efficiency, η, and
- -
- Dynamic insulation efficiency, ε.
The pre-heating efficiency, η, assesses the capacity of the façade to pre-heat the ventilation air flow rate during the cold season (heating periods) and is defined as:
where:
- Texh—temperature of the air exhaust (exiting from the façade), °C.
- Ti—air temperature inside the room, °C.
- Te—exterior air temperature, °C.
The dynamic insulation efficiency, ε, is defined as the quota of the heat flux that enters through the outer surface of the façade in the hot season during the cooling period:
where is the heat flux removed by the air flowing through the façade, W, Equation (3):
where: ventilation air mass flow rate inside the DSF channel (kg/s); , specific heat of the air (1005 J/kg K) and the air density (1.165 kg/m3).
The heat flux entering through the outside facing surface of the façade, (W) is defined by Equation (4):
where: solar transmission coefficient through exterior and interior glazings (0.42); A area of the facade module (5.2 m2); U overall heat transfer coefficient through the double glazing (1.92 W/m2K, Table 1).
Finally, the equation of the dynamic insulation efficiency can be written as [1,40]:
Figure 22 presents the variation of the pre-heating efficiency, η, during the cold season (SET 4) when the channel is closed, and the double skin-façade behaves like a thermal buffer. The negative values of the pre-heating efficiency mean that the air temperature that exits from the ventilated facade, Texh, is lower than the temperature of the indoor air, Ti, and there is no energy recovery. In this condition, the only benefit obtained from the ventilated façade is to increase the surface temperature of the inner glass pane inside the channel (Figure 19) and reduce the heat loss from the interior room. When 0 < η < 1 during the last two days of higher solar radiation at noon (29th and 30th November, Figure 22), the air that exits from the façade is preheated at a temperature which is higher than the indoor one but the ventilation air still requires extra heating before being introduced into the room. A maximum value of 1.83 of the pre-heating efficiency is reached at 11:00 a.m. on the seventh day, for a maximum air temperature inside the DSF channel of 28.6 °C, which is higher than the interior one of 19.7 °C, solar radiation intensity of 101 W/m2 and an ambient air temperature of 14.8 °C. At this moment, the façade heats the ventilation air to a higher temperature than the indoor temperature. Therefore, it allows the complete compensation of ventilation losses and the partial compensation of other thermal losses through the building elements.

Figure 22.
Pre-heating efficiency of DSF in the fourth period (24th–30th November) of cold season (thermal buffer, closed channel).
During the hot season, the dynamic insulation efficiency represents the quota of the heat flux removed by the air flowing inside the DSF channel compared to the total heat flux that enters through the outer glass pane. The results are presented in Table 10, Table 11 and Table 12 for the three ventilation modes (SET 1–3) when the velocities inside the channel were measured. The measurements of air velocities were performed at representative values of solar intensity and exterior and cavity temperatures.

Table 10.
Dynamic insulation efficiency for the first ventilation mode (SET 1: 07th–13th July).

Table 11.
Dynamic insulation efficiency for the second ventilation mode (SET 2: 14th–20th July).

Table 12.
Dynamic insulation efficiency for the third ventilation mode (SET 3: 24th–30th July).
For lower values of solar radiation intensity and ambient air temperature and higher ones for the air flow rate inside the channel, the dynamic insulation efficiency has the highest importance. An average dynamic insulation efficiency of 71.3% was recorded for the natural ventilation with both openings on the lateral outer glass and the vertical one in the top of the channel (Table 12), relative to the first scenario with natural ventilation of 67.5% (Table 10) and the second one with forced ventilation of 50.9% (Table 11). Thus, in order to prevent the overheating of the façade during the hot season, combining vertical and horizontal openings in natural ventilation gives the best efficiency of the double-skin facade functioning.
4. Conclusions
In this work, the thermodynamic behavior of a double skin façade (DSF) and performance assessment in terms of pre-heating efficiency during the cold season and the dynamic insulation efficiency during the hot one is studied using an experimental measurement campaign in specific climate conditions of Romania. Experimental work was done on naturally and mechanically ventilated single-story DSF built on southwest façade of the INCERC Laboratory of Applied Research and Testing in Constructions in Iasi. During the hot season, three outdoor air curtain modes of ventilation were chosen: natural ventilation with lateral openings on the exterior glazing, forced ventilation with lateral openings, and natural ventilation combining lateral and vertical openings on the top of the channel. During the cold season, the lateral and vertical openings are closed, and the channel façade behaves like a thermal buffer between the building and the exterior air.
From the analysis of the measured data, the following considerations can be drawn.
During the cold season, the buffer façade offers the possibility to ensure the partial or integral heating of the interior room for a solar radiation intensity higher than 100 W/m2, when the temperatures inside the channel exceed the value of 20 °C with a difference of 14 °C relative to the exterior ones. On the other hand, for smaller solar radiation intensity of 20 W/m2, the difference drops to around 2 °C. In this condition, the negative values of the pre-heating efficiency showed that the only benefit obtained from the ventilated façade is to increase the surface temperature of the inner glass pane inside the channel and reduce the heat losses from the interior room. On the other hand, the condensation appearance on the interior DSF surfaces was observed when the humidity reached values above 80% between 06:00 p.m. and 10:00 a.m.
Results related to the summer period showed that the air and enclosing surfaces temperatures in the channel can reach values above 40 °C mainly between 10:00 a.m. and 02:00 p.m. due to the location and façade orientation, with a difference of about 12 °C relative to the exterior temperature, when the intensity of solar radiation reaches more than 500 W/m2. Direct solar radiation intensity influences the increase of air temperature in the channel, even when the exterior temperature does not exceed 30 °C. In the evening and during the night, the two temperatures become almost equal with a difference of around 2 °C for one of the channels. The forced ventilation does not reduce the channel air and surface temperatures for the flow rates studied, but it can improve the cooling when no solar radiation is present. On the other hand, using a controlled mechanical ventilation system involves operating costs, energy consumption, and the need for an often complex system of technical management. The average air relative humidity in the channel was recorded around 48% and no risk of condensation phenomena was observed.
The supplementary opening at the top of the channel improves the natural ventilation and the temperature difference between the channel and the ambient drops by around 9 °C at the noon and 1 °C during the night. A time shift of approximately one hour exists between the highest solar radiation and the maximum temperature recorded in the channel. In summer, the risk of overheating the DSF channel is obvious. Still, it can be minimized by using natural ventilation with good-sized inlets and outlets, combining the vertical with horizontal ones.
The airflow analyses during the summer showed that its velocity at the inlet section depends on the wind speed and a higher temperature inside the channel determines higher velocities in natural convection. The forced ventilation mode determines the turbulent character of the flow in the middle of the channel with a variation of velocities between 0.25–0.42 m/s. This was confirmed by the visualizations of the airflow pattern inside the channel’s median section, which highlighted an ascendant flow near the interior double glazing of the DSF channel and a descendant one near the exterior glazing.
The performance indicator specific for the hot season in terms of dynamic insulation efficiency recorded a value of 71.3% for natural ventilation with both openings on the lateral outer glass and the vertical one at the top of the channel. Thus, in order to prevent the overheating of the façade during the hot season, combining vertical and horizontal openings in natural ventilation give the best efficiency of the double-skin facade functioning.
Author Contributions
Conceptualization, M.L.C. and N.C.C.; methodology, M.L.C., N.C.C. and A.A.C.; validation, N.C.C. and M.L.C.; formal analysis, M.L.C., N.C.C., A.A.C. and S.V.H.; investigation, M.L.C., N.C.C., A.A.C., S.V.H., E.F.Ț., A.B. and C.G.P.; resources, M.L.C., N.C.C., A.A.C. and C.G.P.; data curation, N.C.C. and S.V.H.; writing—original draft preparation, N.C.C., M.L.C., A.B., S.V.H. and E.F.Ț.; writing—review and editing, N.C.C. and M.L.C.; visualization, N.C.C., S.V.H. and E.F.Ț.; supervision, M.L.C. and N.C.C.; project administration, N.C.C. and M.L.C.; funding acquisition, N.C.C. and M.L.C. All authors have read and agreed to the published version of the manuscript.
Funding
This paper was financed by the program Internal Grants—Publications granted by the “Gheorghe Asachi” Technical University of Iasi, Romania, project number GI/P35_Publications/2021.
Institutional Review Board Statement
Not applicable.
Informed Consent Statement
Not applicable.
Data Availability Statement
Data are contained within the article.
Acknowledgments
We would like to acknowledge the invaluable support provided by the NIRD URBAN-INCERC Iasi Branch and FCI-TUIASI infrastructure in writing this article.
Conflicts of Interest
The authors declare no conflict of interest.
References
- Corgnati, S.P.; Perino, M.; Serra, V. Experimental assessment of the performance of an active transparent façade during actual operating conditions. Sol. Energy 2007, 81, 993–1013. [Google Scholar] [CrossRef]
- Saelens, D.; Roels, S.; Hens, H. Strategies to improve the energy performance of multiple-skin facades. Build. Environ. 2008, 43, 638–650. [Google Scholar] [CrossRef]
- Zanghirella, F. Numerical and Experimental Analysis of Active Transparent Façade. Ph.D. Thesis, Polytechnic University of Turin, Turin, Italy, 2008. [Google Scholar]
- Fuliotto, R.; Cambuli, F.; Mandas, N.; Bacchin, N.; Manara, G.; Chen, Q. Experimental and numerical analysis of heat transfer and airflow on an interactive building facade. Energy Build. 2010, 42, 23–28. [Google Scholar] [CrossRef]
- Hernandez, M. Experimental and Computational Evaluation of Thermal Performance and Overheating in Double Skin Facades. Ph.D. Thesis, University of Nottingham, Nottingham, UK, 2008. [Google Scholar]
- Serra, V.; Zanghirella, F.; Perino, M. Experimental evaluation of a climate façade: Energy efficiency and thermal comfort performance. Energy Build. 2010, 42, 50–62. [Google Scholar] [CrossRef]
- Perino, M. State-of-the-Art Review: Vol. 2A. Responsive Building Elements: NNEX 44: Integrating Environmentally Responsive Elements in Buildings; Aalborg University: Aalborg, Denmark, 2008. [Google Scholar]
- Safer, N. Multi-Scale Modelling of Double Skin Façades Equipped with Solar Protections. Ph.D. Thesis, National Institute for Applied Sciences, Lyon, France, 2006. [Google Scholar]
- Gavan, V.; Woloszyn, M.; Kuznik, F.; Roux, J.-J. Experimental study of a mechanically ventilated double-skin façade with venetian sun-shading device: A full-scale investigation in controlled environment. Sol. Energy 2010, 84, 183–195. [Google Scholar] [CrossRef]
- Anđelković, A.; Cvjetkovic, T.; Djakovic, D.; Stojanovic, I. The development of simple calculation model for energy performance of double skin façades. Therm. Sci. 2012, 16, 251–267. [Google Scholar] [CrossRef]
- Ignjatovic, M.; Blagojevic, B.; Stojanovic, B.; Stojiljković, M. Influence of glazing types and ventilation principles in double skin façades on delivered heating and cooling energy during heating season in an office building. Therm. Sci. 2012, 16, 461–469. [Google Scholar] [CrossRef]
- Matour, S.; Garcia-Hansen, V.; Omrani, S.; Hassanli, S.; Drogemuller, R. Wind-driven ventilation of Double Skin Façades with vertical openings: Effects of opening configurations. Build. Environ. 2021, 196, 107804. [Google Scholar] [CrossRef]
- Tao, Y.; Fang, X.; Chew, M.Y.L.; Zhang, L.; Tu, J.; Shi, L. Predicting airflow in naturally ventilated double-skin facades: Theoretical analysis and modelling. Renew. Energy 2021, 179, 1940–1954. [Google Scholar] [CrossRef]
- Tao, Y.; Fang, X.; Setunge, S.; Tu, J.; Liu, J.; Shi, L. Naturally ventilated double-skin façade with adjustable louvers. Sol. Energy 2021, 225, 33–43. [Google Scholar] [CrossRef]
- Torres, M.; Alavedra, P.; Guzman, A.; Cuerva, E.; Planas, C.; Clemente, R.; Escalona, V. Double Skin Facades—Cavity and exterior openings dimensions for saving energy on Mediterranean climate. Build. Simul. 2007, 1–3, 198–205. [Google Scholar]
- Azarbayjani, M. Climatic based consideration of double skin facade system: Natural ventilation performance of a case study with double skin facade in mediterranean climate. In Proceedings of the Building Simulation 2013 13th International Conference of the International Building Performance Simulation Association, Chambery, France, 25–28 August 2013; pp. 512–519. [Google Scholar]
- Hamza, N.; Cook, M.; Cropper, P. Comparative analysis of natural ventilation performance in non-unifrom double skin facades in temperate climates. In Proceedings of the 12th Conference of International Building Performance Simulation Association, Sydney, Australia, 14–16 November 2011; pp. 2401–2406. [Google Scholar]
- Stec, W.; Van Paassen, A. Symbiosis of the double skin façade with the HVAC system. Energy Build. 2005, 37, 461–469. [Google Scholar] [CrossRef]
- Pomponi, F.; Piroozfar, P.; Southall, R.; Ashton, P.; Farr, E.R. Energy performance of Double-Skin Façades in temperate climates: A systematic review and meta-analysis. Renew. Sustain. Energy Rev. 2016, 54, 1525–1536. [Google Scholar] [CrossRef]
- Dama, A.; Angeli, D.; Larsen, O.K. Naturally ventilated double-skin façade in modeling and experiments. Energy Build. 2017, 144, 17–29. [Google Scholar] [CrossRef]
- Aksamija, A. Context Based Design of Double Skin Facades: Climatic Considerations during the Design Process. Perkins+Will Res. J. 2009, 1, 54–69. [Google Scholar]
- Jankovic, A.; Goia, F. Impact of double skin facade constructional features on heat transfer and fluid dynamic behaviour. Build. Environ. 2021, 196, 107796. [Google Scholar] [CrossRef]
- Hien, W.N.; Liping, W.; Chandra, A.N.; Pandey, A.R.; Xiaolin, W. Effects of double glazed facade on energy consumption, thermal comfort and condensation for a typical office building in Singapore. Energy Build. 2005, 37, 563–572. [Google Scholar] [CrossRef]
- Wong, P.; Prasad, D.; Behnia, M. A new type of double-skin façade configuration for the hot and humid climate. Energy Build. 2008, 40, 1941–1945. [Google Scholar] [CrossRef]
- Hamza, N. Double versus single skin facades in hot arid areas. Energy Build. 2008, 40, 240–248. [Google Scholar] [CrossRef]
- Qahtan, a.m. Thermal performance of a double-skin façade exposed to direct solar radiation in the tropical climate of Malaysia: A case study. Case Stud. Therm. Eng. 2019, 14, 100419. [Google Scholar] [CrossRef]
- Aleksandrowicz, O.; Yezioro, A. Mechanically ventilated double-skin facade in a hot and humid climate: Summer monitoring in an office tower in Tel Aviv. Arch. Sci. Rev. 2018, 61, 171–188. [Google Scholar] [CrossRef]
- Zomorodian, Z.S.; Tahsildoost, M. Energy and carbon analysis of double skin façades in the hot and dry climate. J. Clean. Prod. 2018, 197, 85–96. [Google Scholar] [CrossRef]
- Yilmaz, Z.; Çetintaş, F.; Yılmaz, Z. Double skin façade’s effects on heat losses of office buildings in Istanbul. Energy Build. 2005, 37, 691–697. [Google Scholar] [CrossRef]
- Năstase, G.; Şerban, A.; Dragomir, G.; Bolocan, S.; Brezeanu, A.I. Box window double skin façade. Steady state heat transfer model proposal for energetic audits. Energy Build. 2016, 112, 12–20. [Google Scholar] [CrossRef]
- Kuznik, F.; Catalina, T.; Gauzere, L.; Woloszyn, M.; Roux, J.-J. Numerical modelling of combined heat transfers in a double skin façade–Full-scale laboratory experiment validation. Appl. Therm. Eng. 2011, 31, 3043–3054. [Google Scholar] [CrossRef][Green Version]
- Ascione, F.; Bianco, N.; Iovane, T.; Mastellone, M.; Mauro, G.M. The evolution of building energy retrofit via double-skin and responsive façades: A review. Sol. Energy 2021, 224, 703–717. [Google Scholar] [CrossRef]
- Hou, K.; Li, S.; Wang, H. Simulation and experimental verification of energy saving effect of passive preheating natural ventilation double skin façade. Energy Explor. Exploit. 2021, 39, 464–487. [Google Scholar] [CrossRef]
- Larsen, S.F.; Rengifo, L.; Filippín, C. Double skin glazed façades in sunny Mediterranean climates. Energy Build. 2015, 102, 18–31. [Google Scholar] [CrossRef]
- Guardo, A.; Coussirat, M.; Valero, C.; Egusquiza, E.; Alavedra, P. CFD assessment of the performance of lateral ventilation in Double Glazed Façades in Mediterranean climates. Energy Build. 2011, 43, 2539–2547. [Google Scholar] [CrossRef]
- Hassanli, S.; Hu, G.; Kwok, K.; Fletcher, D.F. Utilizing cavity flow within double skin façade for wind energy harvesting in buildings. J. Wind. Eng. Ind. Aerodyn. 2017, 167, 114–127. [Google Scholar] [CrossRef]
- Chereches, M. The Thermo-Hygro-Energetic Behavior of the Ventilated Facades, Applicable to Public Buildings, in the Climatic Conditions in Romania. Prenormative Research; Contract No. 493/2011; NIRD URBAN–INCERC: Iasi, Romania, 2011. [Google Scholar]
- Saelens, D. Energy performance assessment of singlestorey multiple-skin facades. Ph.D Thesis, Katholieke Universiteit Leuven, Leuven, Belgium, 2002. [Google Scholar]
- Hudişteanu, S.; Poenari, C.F.; Balint, B.I.; Cherecheş, M.; Cherecheş, N.C. Energy saving analysis inside a double skin façade. Math. Model. Civ. Eng. J. 2013, 1, 78–83. [Google Scholar]
- Popovici, C.G.; Cirlan, V.V.; Mateescu, T.D.; Chereches, N.C.; Hudisteanu, S.V. Influence of various angles of the venetian blind on the efficiency of a double skin facade. Energy Procedia 2016, 85, 416–424. [Google Scholar] [CrossRef]
Publisher’s Note: MDPI stays neutral with regard to jurisdictional claims in published maps and institutional affiliations. |
© 2021 by the authors. Licensee MDPI, Basel, Switzerland. This article is an open access article distributed under the terms and conditions of the Creative Commons Attribution (CC BY) license (https://creativecommons.org/licenses/by/4.0/).