Article

On Simulating the Propagation and Countermeasures of Hate Speech in Social Networks

by
Maite Lopez-Sanchez
1,*,† and
Arthur Müller
2
1
Department of Mathematics and Computer Science, Universitat de Barcelona, 08007 Barcelona, Spain
2
Institut of Political science, University of the Bundeswehr Munich, 85579 Neubiberg, Germany
*
Author to whom correspondence should be addressed.
Current address: Gran Via de les Corts Catalanes 585, 08007 Barcelona, Spain.
Appl. Sci. 2021, 11(24), 12003; https://doi.org/10.3390/app112412003
Submission received: 17 November 2021 / Revised: 10 December 2021 / Accepted: 10 December 2021 / Published: 16 December 2021
(This article belongs to the Special Issue Women in Artificial intelligence (AI))

Abstract

:
Hate speech expresses prejudice and discrimination based on actual or perceived innate characteristics such as gender, race, religion, ethnicity, colour, national origin, disability or sexual orientation. Research has proven that the amount of hateful messages increases inevitably on online social media. Although hate propagators constitute a tiny minority—with less than 1% participants—they create an unproportionally high amount of hate motivated content. Thus, if not countered properly, hate speech can propagate through the whole society. In this paper we apply agent-based modelling to reproduce how the hate speech phenomenon spreads within social networks. We reuse insights from the research literature to construct and validate a baseline model for the propagation of hate speech. From this, three countermeasures are modelled and simulated to investigate their effectiveness in containing the spread of hatred: Education, deferring hateful content, and cyber activism. Our simulations suggest that: (1) Education consititutes a very successful countermeasure, but it is long term and still cannot eliminate hatred completely; (2) Deferring hateful content has a similar—although lower—positive effect than education, and it has the advantage of being a short-term countermeasure; (3) In our simulations, extreme cyber activism against hatred shows the poorest performance as a countermeasure, since it seems to increase the likelihood of resulting in highly polarised societies.

1. Introduction

In recent years, many concerns have arisen related to hate speech (which can take several forms and is known by different names such as derogatory language [1], bigotry [2], misogyny [3], bullying [4], or incivility [5]) and hate dissemination on the Internet (a.k.a. cyberhate). According to the United Nations, hate speech is defined as “the attack or usage of pejorative or discriminatory language with reference to a person or a group based on their religion, ethnicity, nationality, gender or other identity factor” (https://www.un.org/en/genocideprevention/documents/UN%20Strategy%20and%20Plan%20of%20Action%20on%20Hate%20Speech%2018%20June%20SYNOPSIS.pdf, accessed on 1 November 2021). These arisen concerns are well founded, as the usage of hateful language has become common on online social media. This is specially the case on community platforms, such as Gab, where the amount of hateful messages has steadily increased over the last years [6]. Gab.com is an American social networking service launched publicly in May 2017 that is known for its far-right userbase. It is critizised for using free speech as a shield for users and groups who have been banned from other social media. Other platforms, such as Twitter, also show a similar tendency in that hateful users have become more extreme [7]. In fact, some authors have noted that the spread of their messages seems to be inadvertently supported by the algorithms of the social networks [8].
To counter this problem researchers and politicians have proposed several measures with different temporal horizons. General long-term measures emphasise on education of democratic values and tolerance [9] as well as developing critical thinking [10]. They are proposed in order to introduce positive bias into the society, thus inhibiting the propagation of hate speech. Awareness campaigns by governmental organisations focus on mid-term effects and try to prevent forming negative prejudices against out-groups and minorities. Others propose expensive manual community management (i.e., moderation) or intrinsically motivated counter speech [11]. In contrast, the short-term measure of automatic message filtering (or blocking of hateful users) is criticised as, for some cases, it could be used against the freedom of expression human right. Moreover, this countermeasure bears hidden risks of having hateful users being just displaced to other platforms and not really eliminated [12]. In fact, despite the risks associated with banning users, there are some successful experiences that support it. For example, Reddit performed a massive banning of hateful groups in 2015 that did not lead to the displacement of haters to other subreddits/groups [13]. Additionally, the Twitter’s user purge in 2017 neither lead to direct migration of haters to Gab—a more radical platform—since they were already there [6]. Exhaustive evaluations of these countermeasures, however, are still lacking and it is difficult to assess the effectiveness of these initiatives and, much less, to compare them among each other.
However, real social networks are too complex to experiment on, and therefore, this paper is devoted to propose an agent-based model [14] as a virtual experiment for the simulation and comparison of countermeasures against the spread of hatred (note that this paper is an extended version of [15]). Although multi-agent based simulations encompass several simplifications, they are definitely useful to conduct what-if analysis to assess the system’s behaviour under various situations [16,17,18], which in our case correspond to different countermeasures. Specifically, we first build a hate speech propagation model based on current research insights on the behaviours of hateful users in social networks. Secondly, we simulate and compare three alternative countermeasures with different temporal effects: education, deferring hateful content and counter activism.
This paper is structured as follows. The next section introduces related work. Then, we bring forward some definitions in Section 3, which are used along the paper. Next, Section 4 defines the baseline propagation model so that Section 5 can then model the three alternative countermeasures. Subsequently, Section 6 presents the simulation results. Finally, the last section concludes the paper and discusses future work.

2. Related Work

This section is devoted to introduce the literature on hateful users and their behaviours, mathematical models of opinion spread research, and existing simulations related to the hatred.

2.1. Characterising Hateful Users in Social Networks

The literature has clearly identified that hateful users exhibit a very different behaviour than regular (normal) users. Their psychological profile describe them as being energetic, talkative, and excitement-seeking [19]. Nevertheless, in addition to these positive traits, they are also found to be narcissist, lack of empathy, and manipulative [20]. Moreover, haters show high activity on social media and follow more people than normal users. Despite the fact that hateful users gain 50% less back-followers for every spawned following relationship per day, they can receive much more followers over the lifetime of their accounts due to their high activity [21]. Surprisingly, although the amount of hateful persons is extremely limited and does not exceed 1% even on Gab, they are responsible for an non-proportionally high amount of content [6]. Moreover, their content can spread faster and diffuse in longer strains trough the network when forwarded by other users [22]. In fact, although hateful content seems to be less informative on Twitter, since this content contains less URLs and hashtags it is known to be more viral when enriched with images or videos [23]. Finally, hateful users turn out to be very densely connected and show more reciprocity (i.e., they follow back more often) than normal users [21,22].
In addition to characterising hateful content, researchers have also studied their effects on the content receivers. As expected, the impact varies depending on whether the receiver belongs to the targeted group (i.e., the victims of hatred content) or not (i.e., they just are listeners/followers receiving the content). Frequent and repetitive exposure to hate speech can lead to desensitization, decreaseing the listeners’ harm perception. Moreover, it increases prejudices against the victims [24], attempting to construct and maintain a reality of domination of one group over another [25].

2.2. Models of Opinion Diffusion

When modelling social networks, researchers use a mathematical graph abstraction. Thus, a social network is built as a graph G = ( E , V ) composed of a set of vertices V, which correspond to users, and a set of edges E representing how they relate (and communicate). Usually, individual opinions about a given topic are represented as numerical values in the interval [ 0 , 1 ] . Both limits of the interval are associated with the extreme stances about the considered topic. In the case of hatred, 0 stands for a very non-hateful opinion whereas 1 stands for the most hateful opinion. Users influence one another by sending messages—through their connecting edges—that lead to a change on their opinion.
The literature has proposed different models for opinion change/diffusion. Here we just introduce a comprehensive (but not exhaustive) set of works. On the one hand, some models are based on the concept of consensus. Thus, Dimakis et al. [26] uses Average Consensus Gossiping (ACG) to force the entire network to converge to the average of all initial opinion values. Alternatively, the aim of DeGroot model [27] is to come to a consensus by using trust as a means to induce differences in the influence of users. DeGroot model was recently applied to the research on hateful behaviours on Twitter and Gab platforms to adjust the score for hate intensity of users [6,21]. On the other hand, bounded confidence models are proposed to follow the intuition that people usually do not accept opinions too far from their own, which is known as confirmation bias. For instance, Friedkin and Johnson [28] add some kind of stubbornness, distinguishing between an intrinsic initial opinion, which remains the same, and an expressed opinion, which changes over time. In contrast, Hegselmann and Krause (HK) [29] introduce confidence level—a threshold for opinion difference. Deffuant and Weisbuch (DW) [30] were the first to use asynchronous random opinion updates of two users considering the confidence level. Finally, Terizi et al. [31] conducted extensive simulations showing that Hegselmann–Krause and Deffuant–Weisbuch outperform other models in describing the spread of hateful content on Twitter.

2.3. Multi-Agent Simulations in the Context of Hatred and Polarisation

To the best of our knowledge, most multi-agent simulations devoted to the phenomenons of the hatred and polarisation use a two-dimensional grid as communication topology. Jager and Amblard [32] conducted a general simulation based on the Social Judgement Theory [33] to demonstrate consensus, bi-polarisation or the formation of multiple opinion groups as a result of the opinion forming dynamics. Stefanelli and Seidl [34] used the same theory to model opinion formation on a polarised political topic in Switzerland. The authors used empirical data to set up the simulation and validate their results. Bilewicz and Soral [1] proposed their own model of the spread of hatred which is dependent from the level of contempt, social norms and ability to identify hate speech. As apposed to this, Schieb and Preuß [35] employed a simplified version of the Elaboration Likelihood Model [36] on a message-blackboard and restricted the communication to a closed group of agents. In contrast to the models presented here, where the underlying psychological models use multiple influence factors to model opinion, works in previous Section 2.2 rely on a simple combination of one-dimensional opinion values. In general, none of mentioned models considered more complex topologies of social networks, neither they studied countermeasures against the spread of hatred in comparison to each other, which is the main contribution of this paper.

3. Terminology

This section is devoted to introduce the terminology required to properly describe our models.
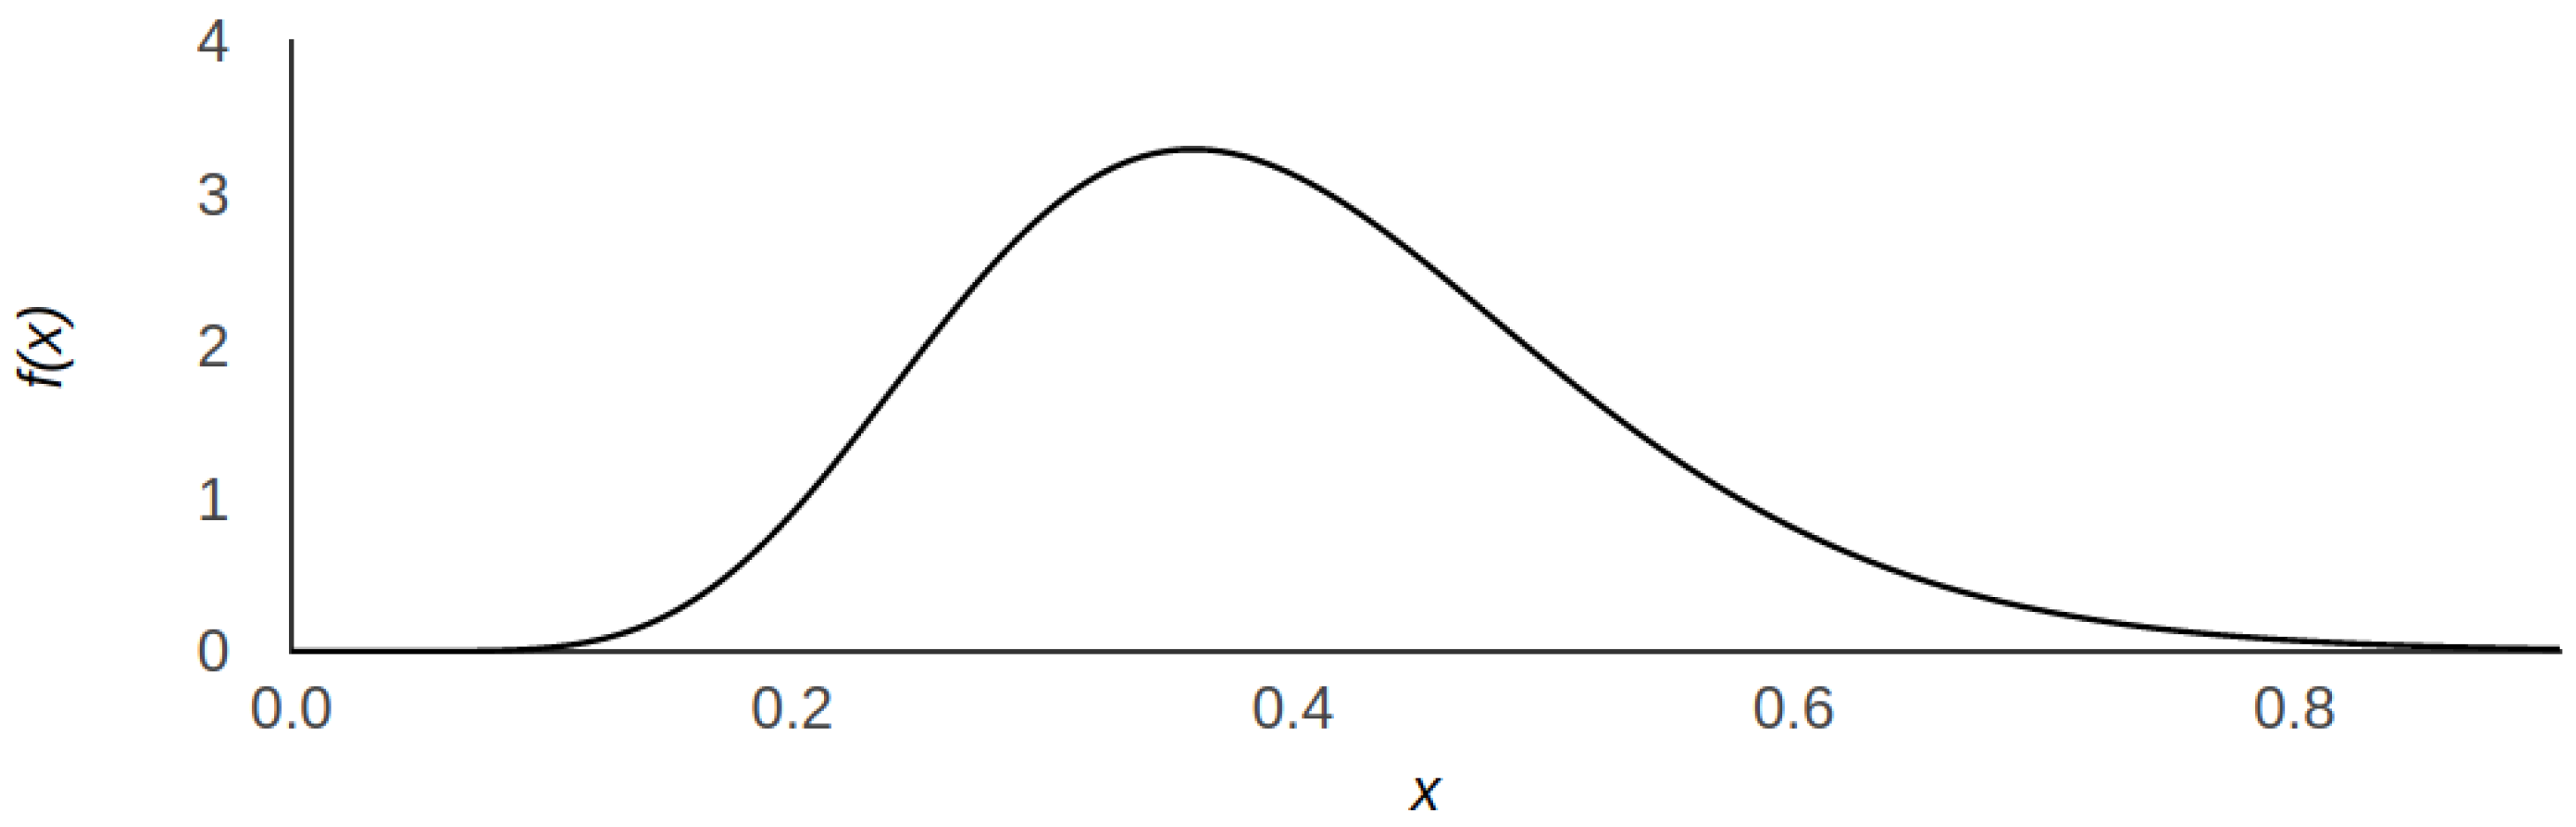
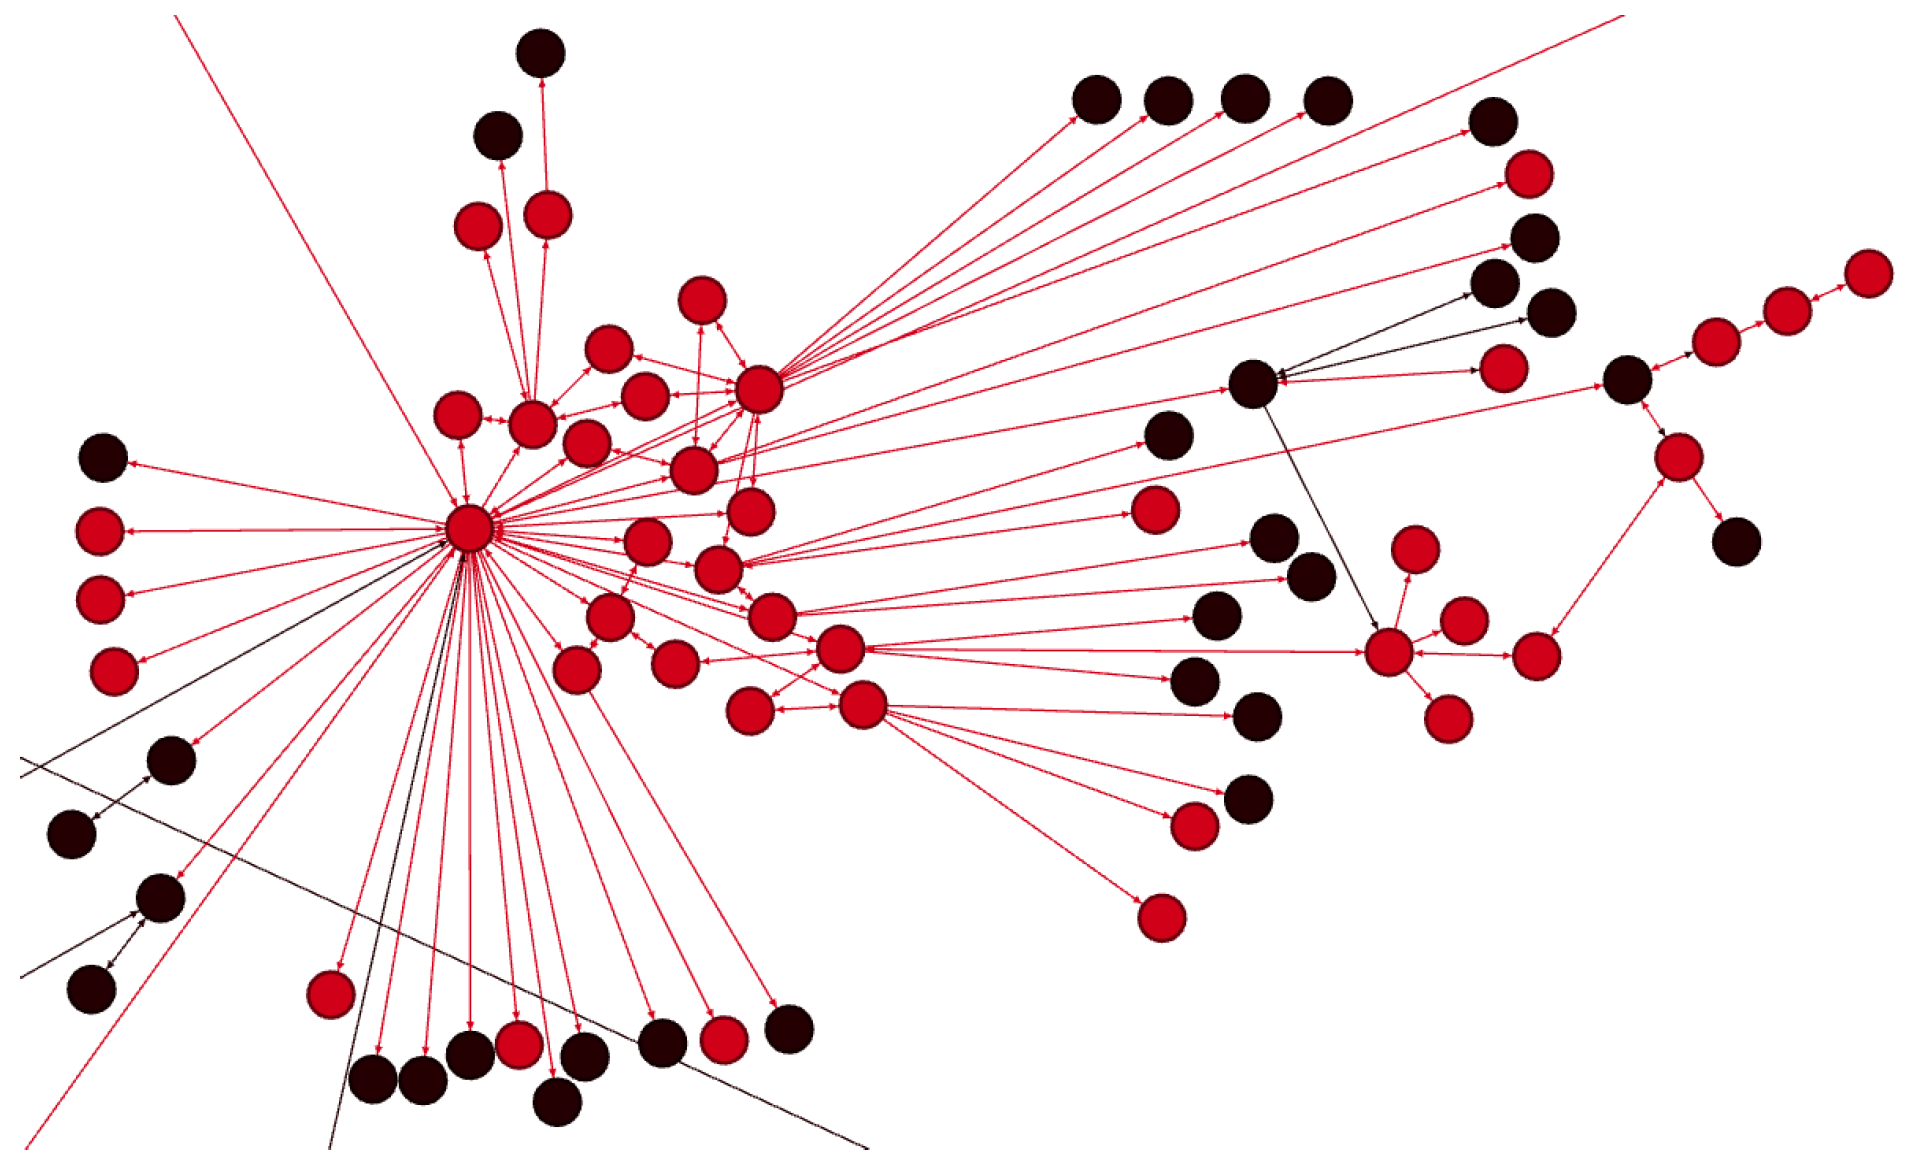
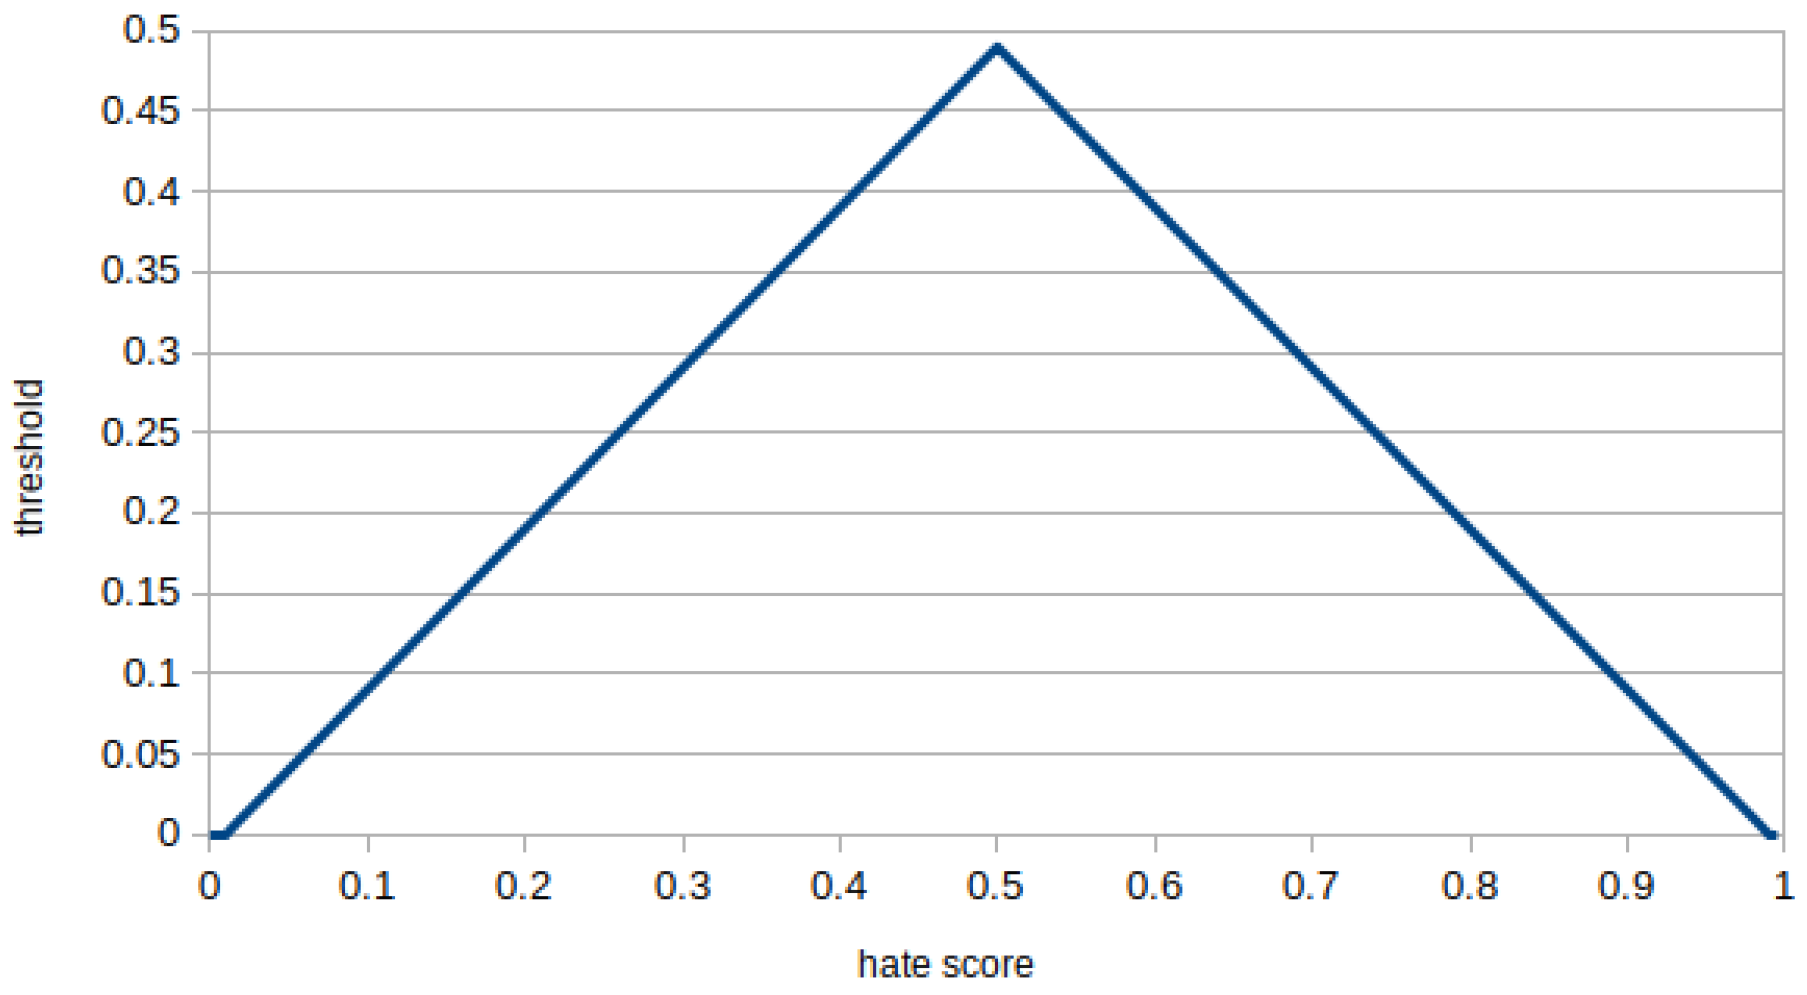
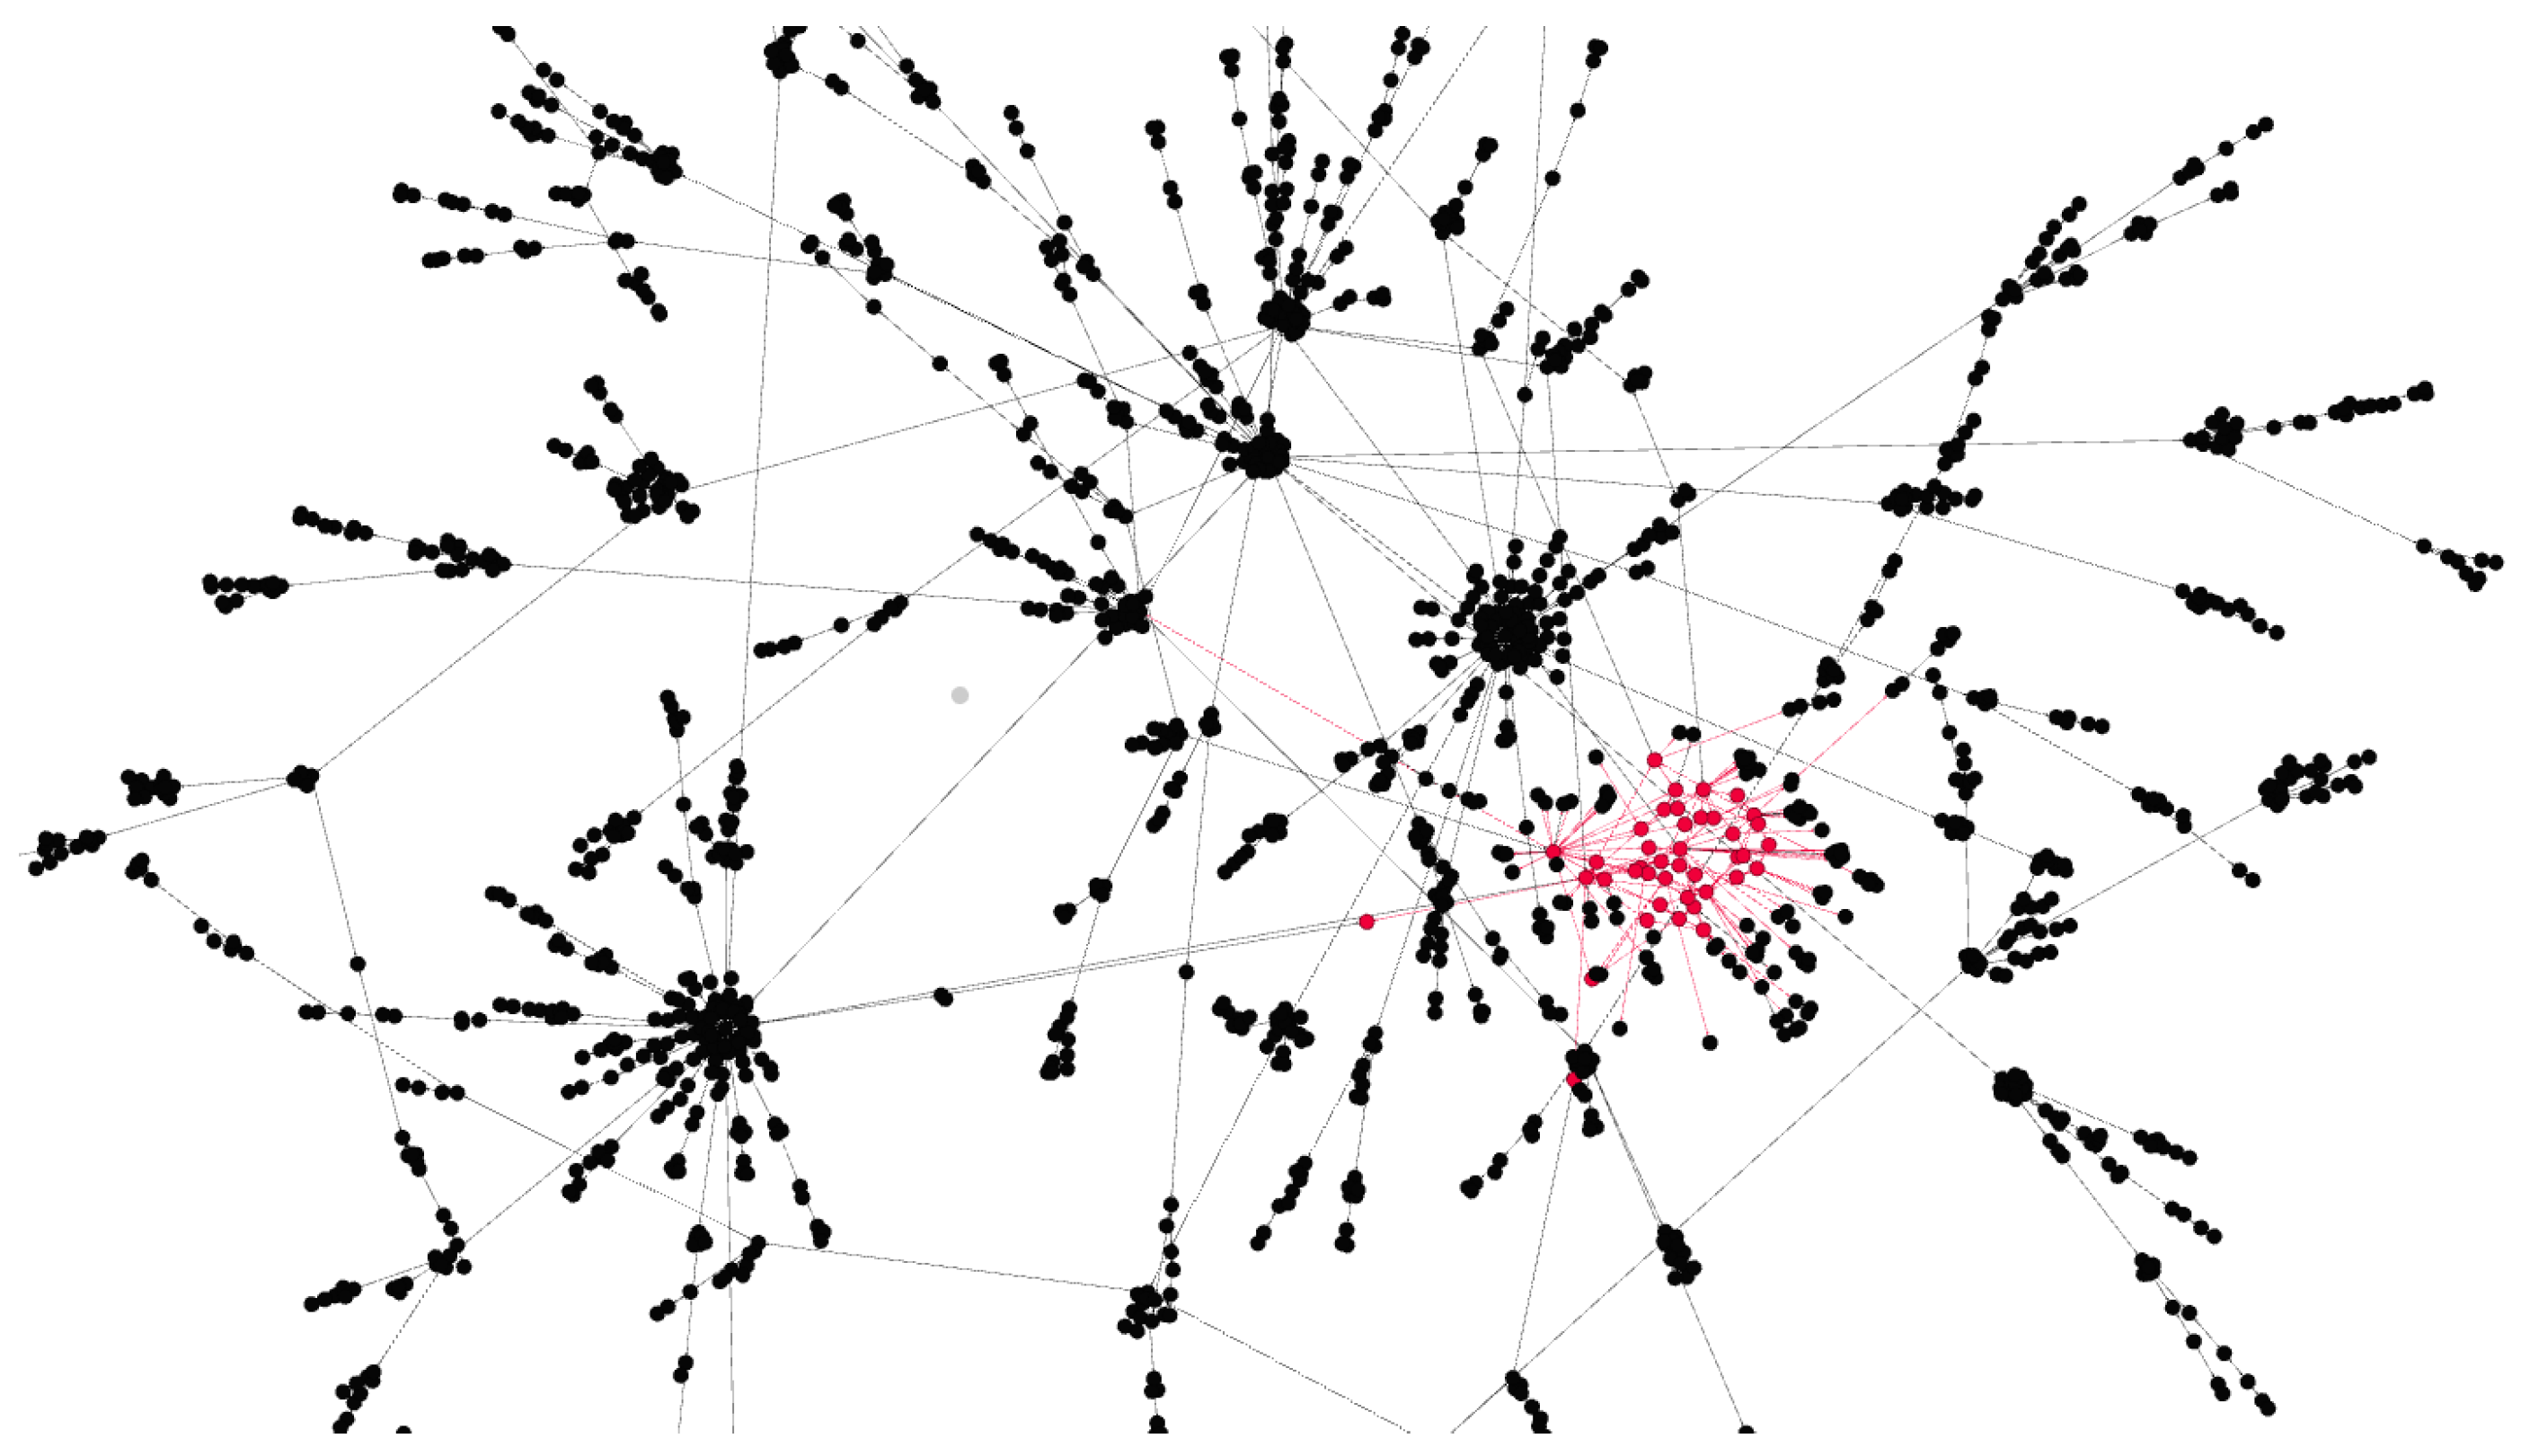
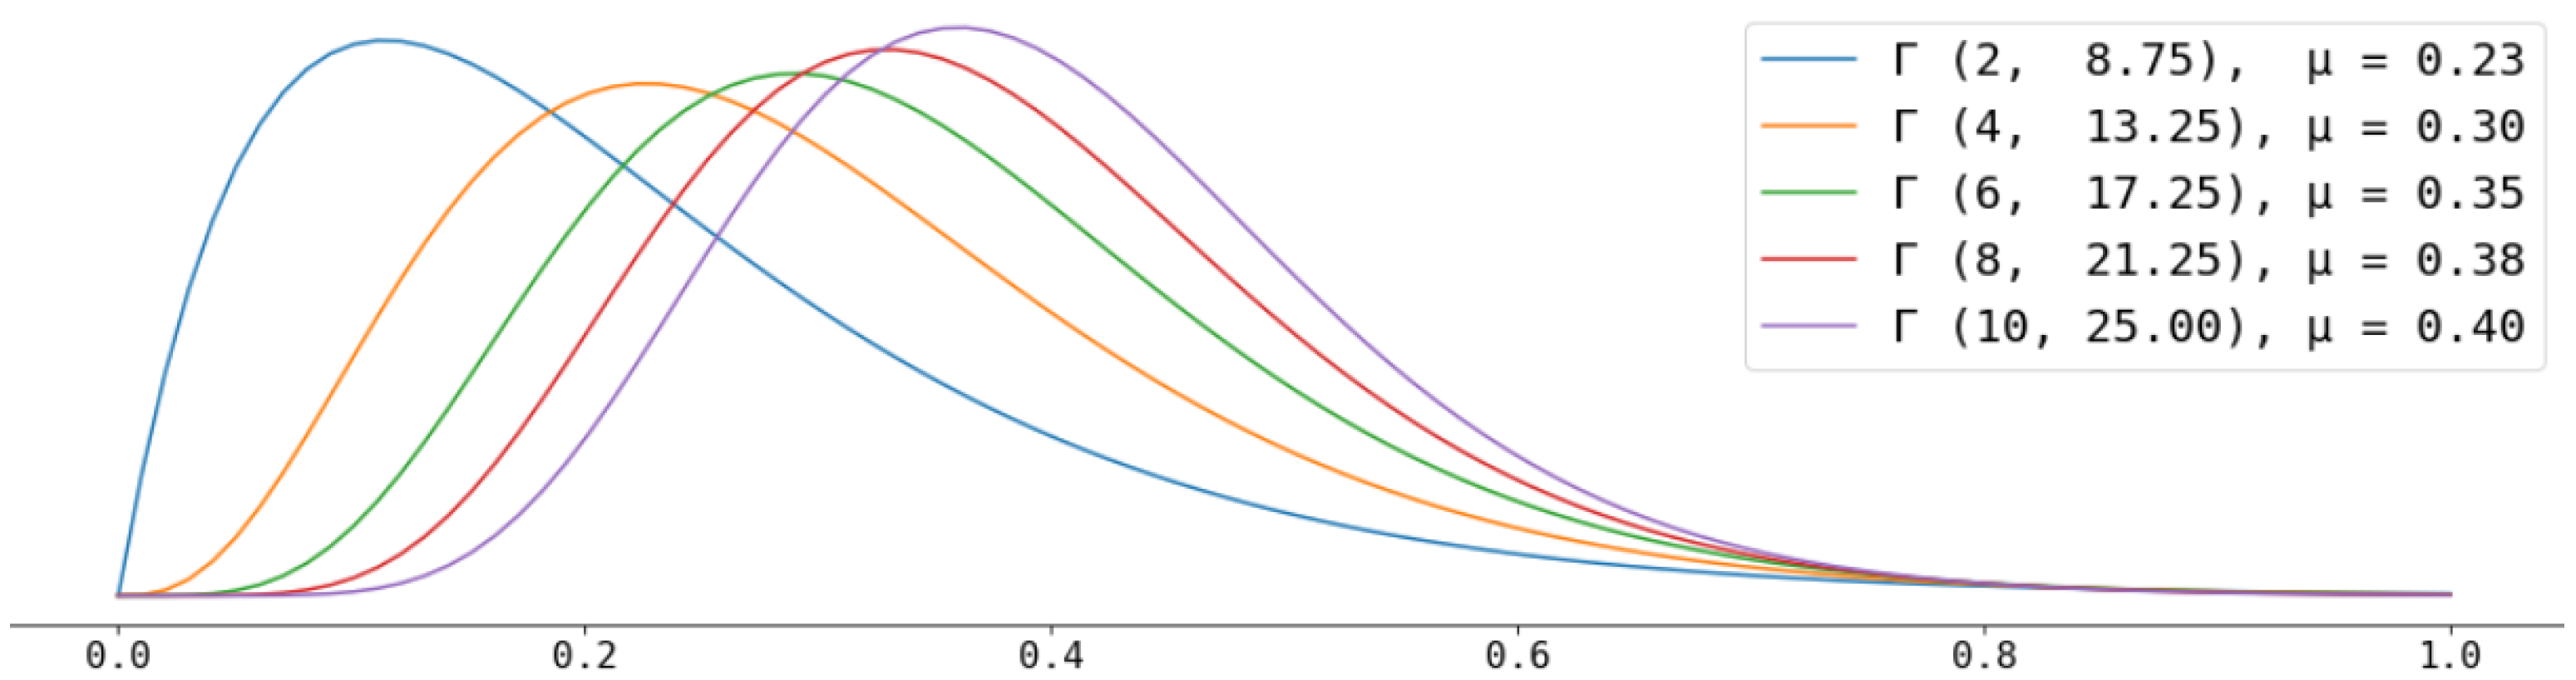
  • Hate score is the central metric in our work and represents the users’ attitude and opinion about some polarised topic, which is discussed within a social network. For instance, immigration laws or equal rights of men and women. It is a real number in [ 0 , 1 ] , where both extremes correspond to a very non-hateful and hateful opinions, respectively. We use the hate score as a user opinion value in our diffusion models but also as a threshold to characterise users. The same concept was also employed by Mathew et al. [6] who showed that hate score distribution on Gab is positively biased towards a non-hateful stance. Similarly, we define a user as hateful when h a t e s c o r e 0.75 and signal it as a red dot in the network graphical representation (see Figure 1). Otherwise, (i.e., when h a t e s c o r e < 0.75 ) we assume the user to be normal and represent it as a black dot. We take this threshold in accordance to—and for better comparability with—previous work. As stated before, the amount of haters is known to be a minority of ca. 1%. Therefore, we model the hate score using the Gamma distribution Γ ( α , λ ) as depicted in Figure 2, so that the area under curve for x > 0.75 is ca. 0.01. For those rare cases when the Gamma distribution naturally exceeds the value of 1 we artificially set users’ hate score to the extreme stance of 1.
  • Hate core is a network component consisting of densely connected hateful users. Figure 1 depicts how most hateful users (in red) are clustered together. Such components emerge from the high cohesiveness among hateful users as well as from their higher activity. It is also worth noticing that, although single users within a hate core do not exhibit the same influence as some famous mainstream users, as a compound, the hate core can achieve similar effects on the network and attract other users.
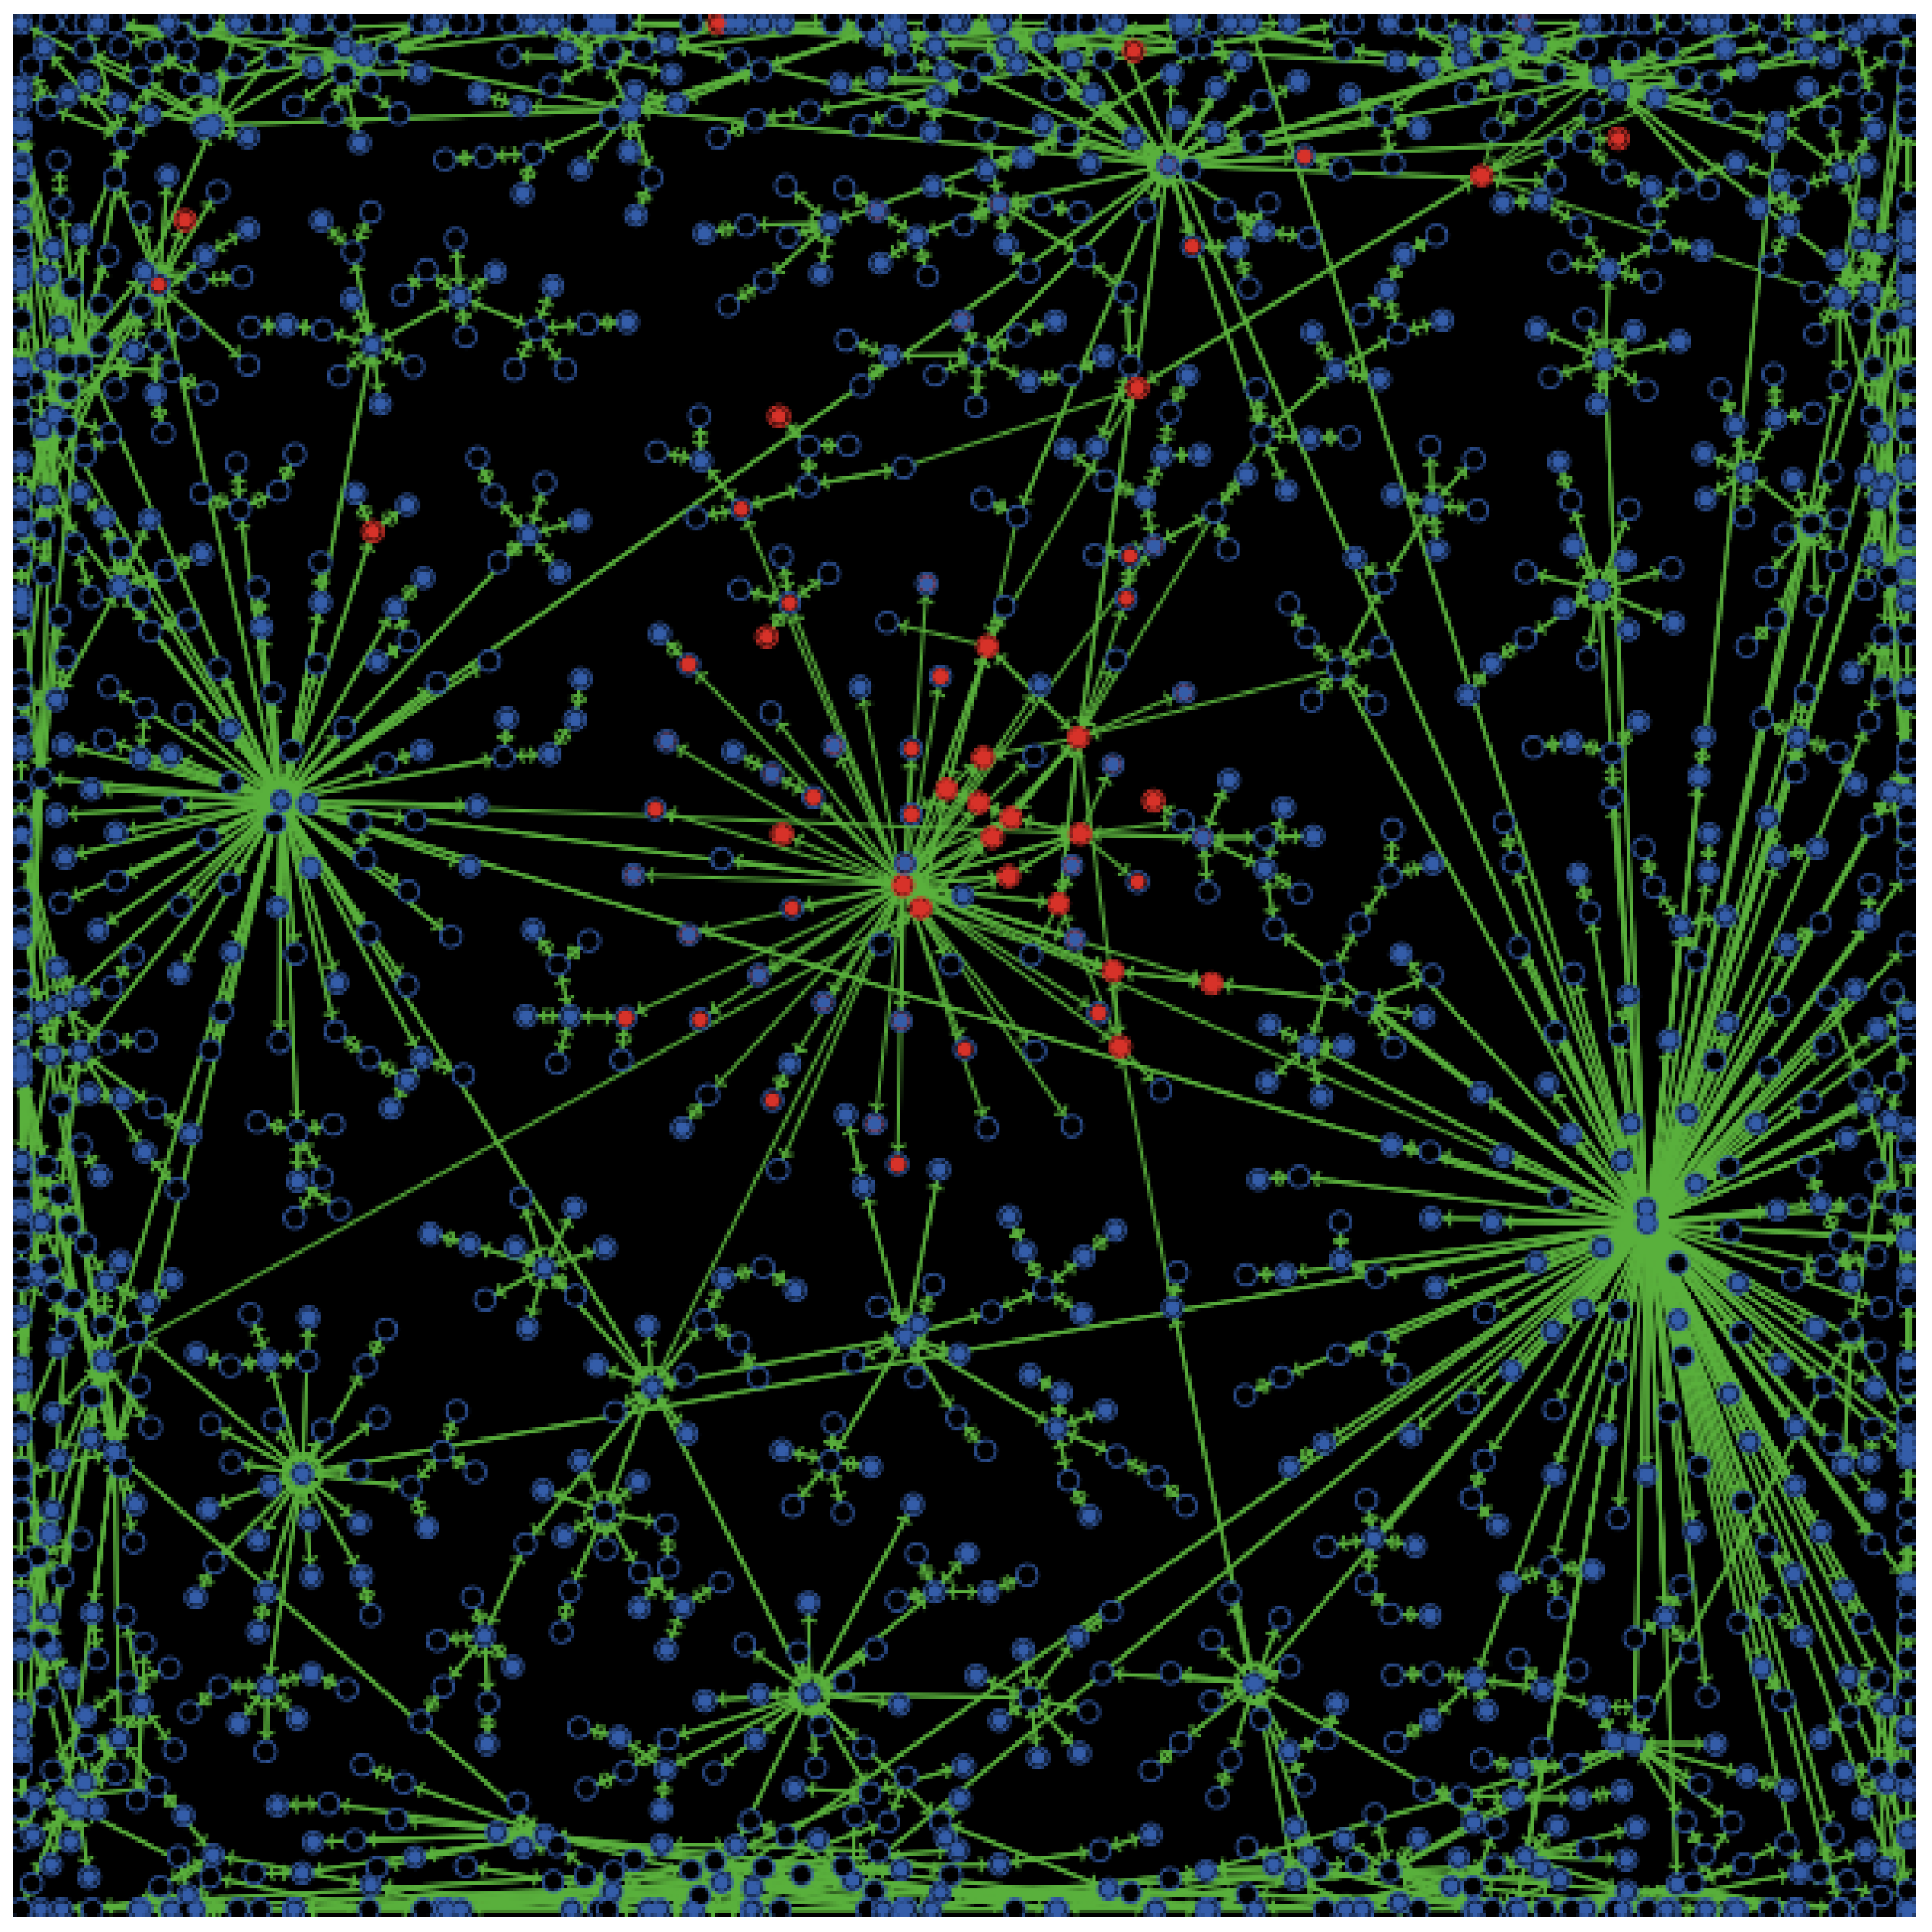
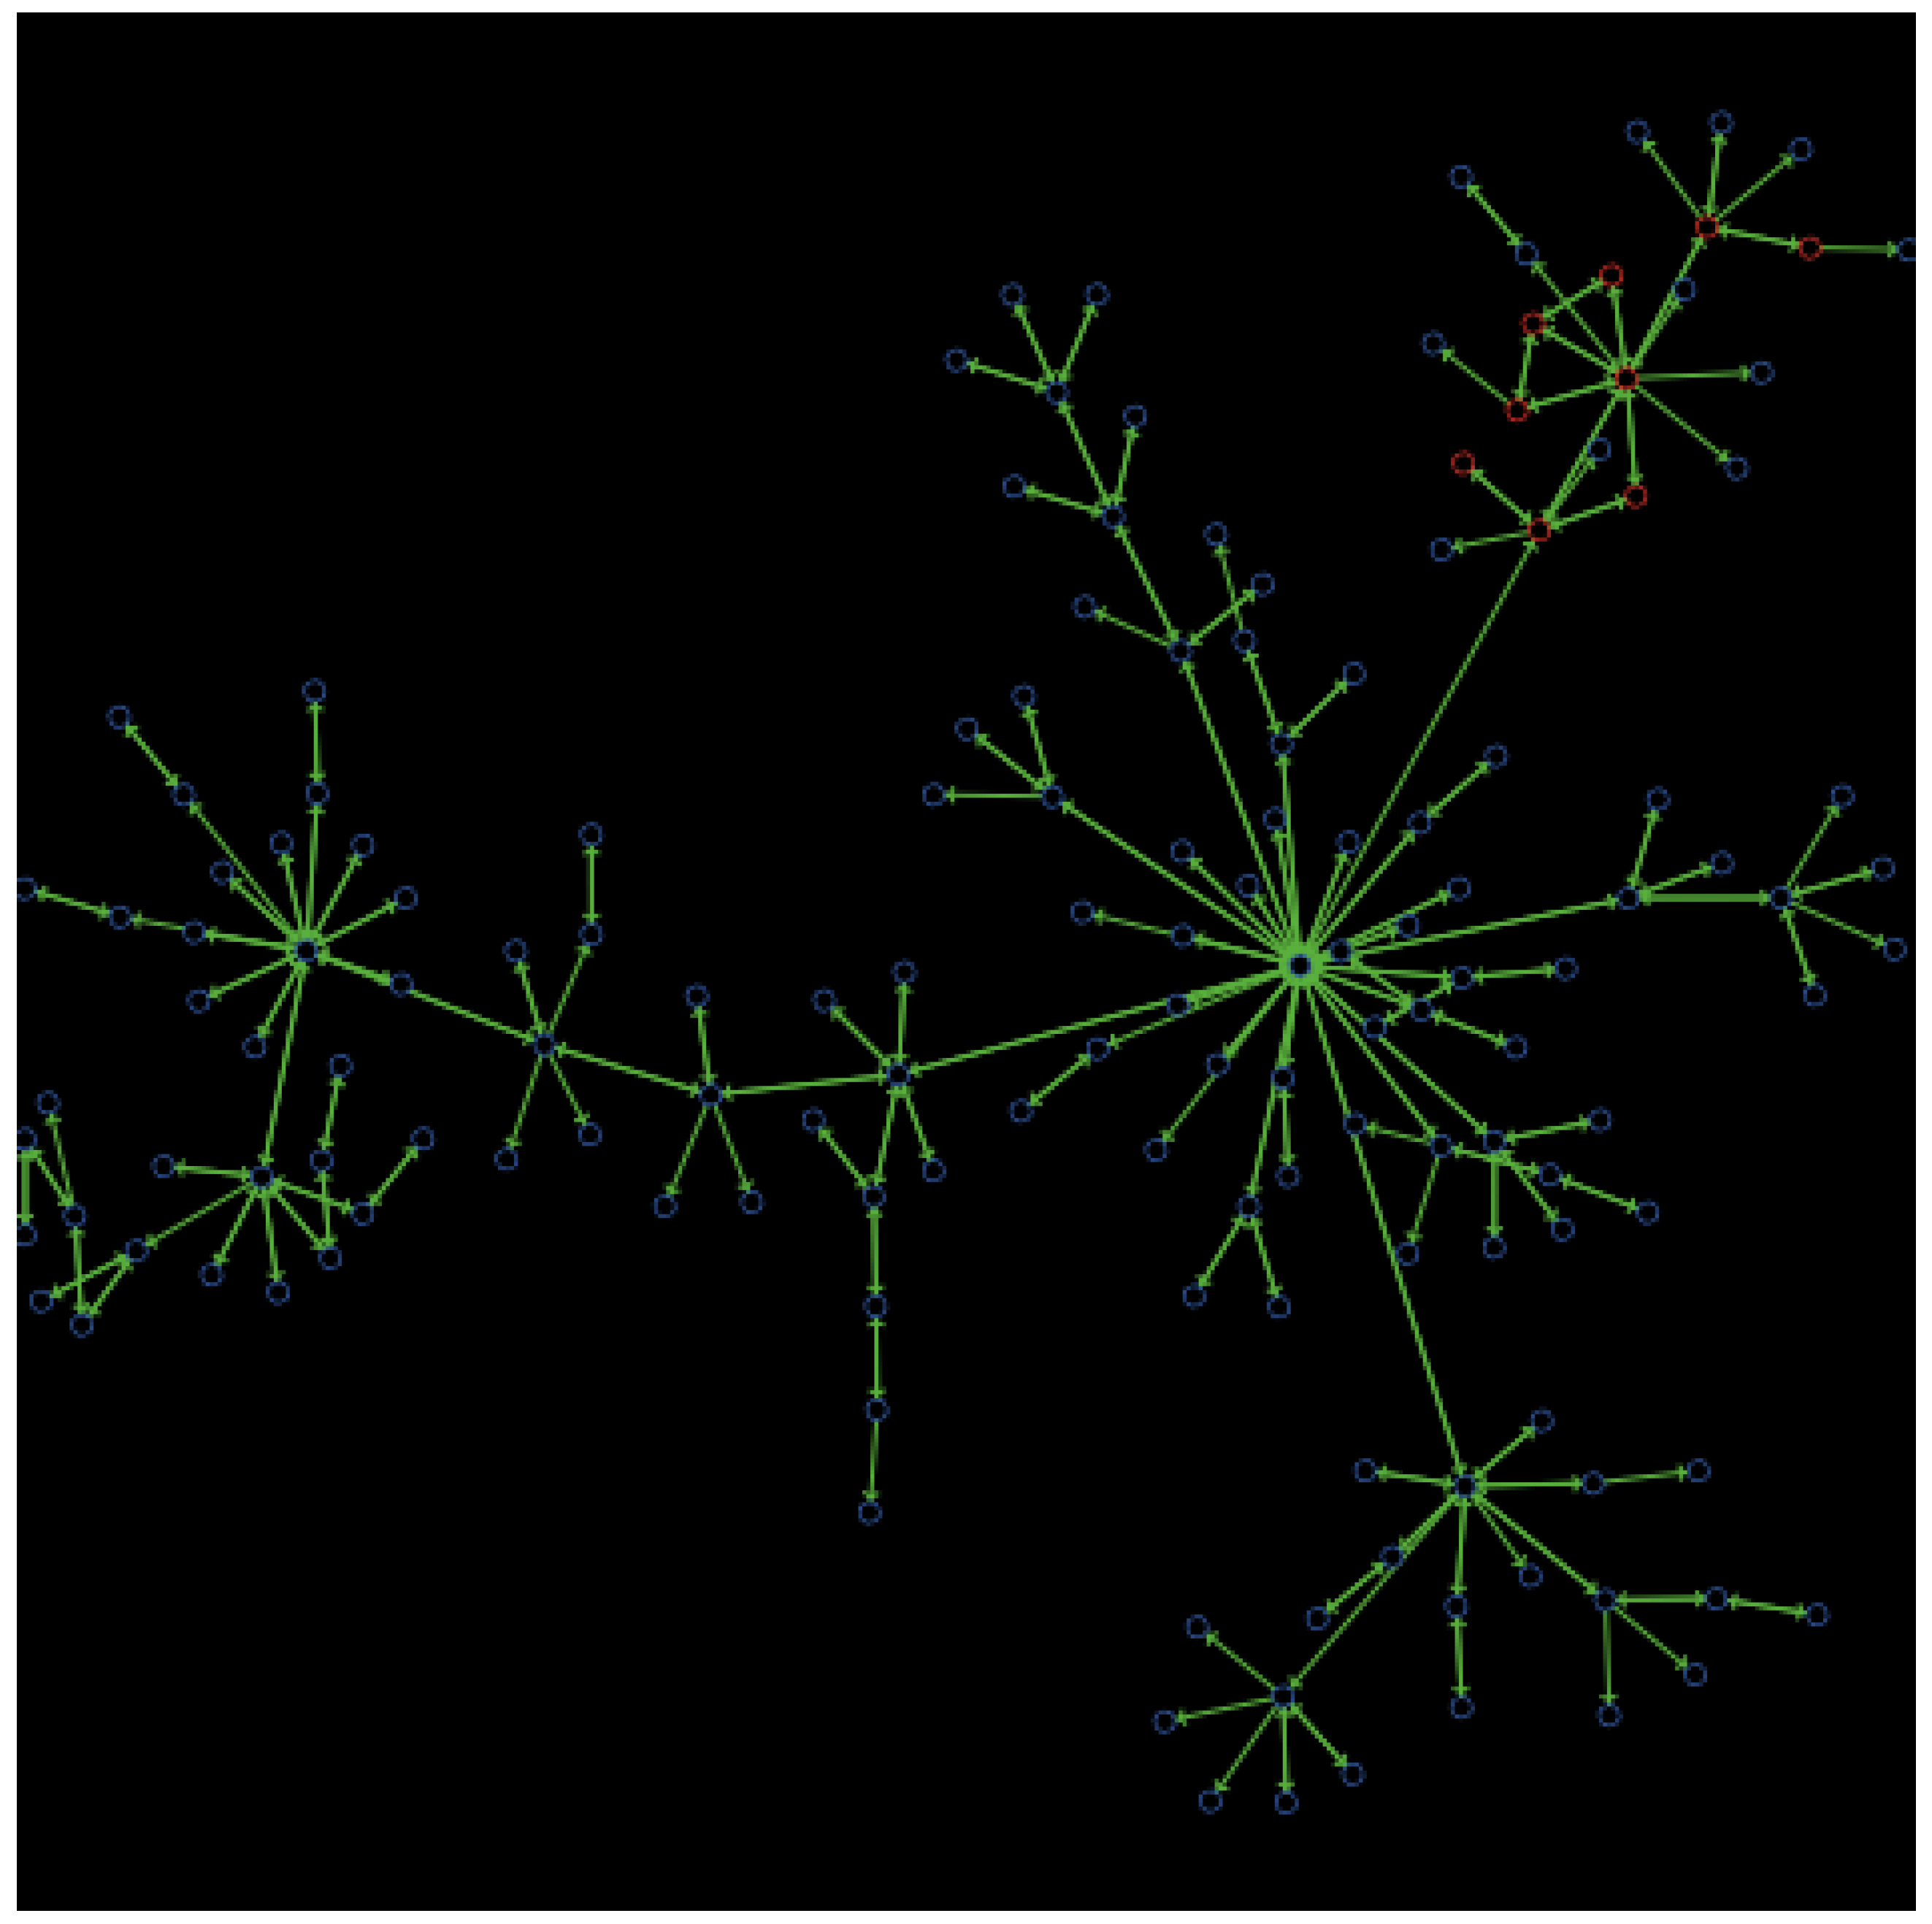
  • Hate strains are extensions of hate cores. As illustrated by Figure 3, hate strains consist of connected hateful users, but exhibit less network density among them than the hate core that originated them. Most often, hate strains emerge from a hate core as the result of opinion diffusion under the negative influence of the hateful users in the core.
  • Swap to a hateful society (by society we mean all the users in the social network). We identify such network transformation when hateful content floods the network and leads to a swap in the opinion of a significant number of users. In particular, we consider a society to be very hateful when the amount of hateful users exceeds 30% of all users in the social network. In fact, experiments have shown that after having trespassed this 30% limit, it becomes extremely difficult to return to a non-hateful society within the time scope of our simulation. Thus, although there may be some exceptions (as hate spread could still be stopped if strategical nodes with high influence within a hateful group were convinced to become non-hateful), we consider swap to a hateful society as the outcome of an irreversible process, which destabilises the society in a very severe way.

4. Our Multi-Agent Social Network: The Baseline Model

Agent-Based Modelling (ABM) [14] has been successfully used in social sciences to simulate and study social systems from the complex adaptive system perspective [37]. It is especially suited for those cases where it is difficult to predict the future behaviour of the whole system analytically, although insights of isolated behaviour of individuals are available. Considering this, we resort to agent-based modelling to simulate a social network where users distribute content. In this manner, each user—which formally corresponds to a vertex in the graph—is modelled as an agent, and agents interact by distributing content with their peer agents—edges in E. The type of distributed content depends on the user profile, which can be normal or hateful. In what follows, Section 4.1 details how such users are added and connected in the network. Then, Section 4.2 exploits the insights from the previous research briefly introduced in Section 2 to model the spread of hatred. Our aim is to ensure that our model is able to mimic those findings from previous work. We refer to the resulting model as the baseline model to stress the fact that subsequent sections enrich this baseline model with different countermeasures and study their effectiveness in containing the spread of hatred.

4.1. Network Construction

Initially, we create a very small predefined clique of two nodes. A clique is a maximal complete subgraph of a graph [38]. In this manner, the two distinct vertices in the clique are adjacent. Subsequently, we apply a network growth process iteratively, by connecting new nodes (i.e., agents/users) to an existing social network, which was grown in previous iteration steps. Following this process, nodes are created and connections are spawned to existing nodes according to some rule.
In particular, we reproduce the structure of a social network by applying the preferential attachment iterative method [39]. Figure 4 shows an example of the simulated network we build during this phase. Briefly, in each round, when joining the network, new users connect to existing users with a probability corresponding to the node degree (amount of followers). So that users with many followers are more likely to receive new followers. Since this preferential attachment method does not distinguish between different user profiles, we extend it for considering hateful users.
  • Firstly, we create, for every simulation round (tick), a new user node and assign it with a hate score that is sampled from the Gamma distribution Γ ( 10 , 25 ) , the lavender (right-most) distribution depicted in Figure 5 (recall, from Section 3, that we do so to produce a proportion of about 1% of hateful users in the network). As a consequence of this hate score assignment, the new node becomes a normal user or a hater.
  • Secondly, for each tick, we also connect the newly created user node with some other users so to mimic their behaviour on Gab and Twitter as described in Section 2.1. Specifically, we proceed by defining several variables that help us tailor the network connections as follows:
    • When joining the network, a new hateful user creates twice new connections than a normal user. In our simulations, a hater sets c h = 2 connections, whereas a normal user only establishes c n = 1 connection (in the code, these limits are set with variables n_following_conn_hater and n_following_conn_normal, respectively). We adhere to Twitter’s terminology and refer to the new created node as the follower and the node it connects to—i.e., the one being followed—as the followee.
    • A normal user connects to an existing user within the network according to the preferential attachment method, without considering its hate score. Conversely, a hateful user will prefer to attach to haters. In particular, a newly created hateful user opts in to connect to another hateful user with a probability p h h = 0.9 (the arrow → in the notation indicates connection and, as for the code, this probability p h h appears as p_hater_follows_hater), and thus, it can still connect to a normal user with a probability of p h n = 0.1 . Preferential attachment is then used to choose the specific hater to connect to. As a response, the hateful followee spawns a following connection with the same probability p h h = 0.9 (the arrow ← in the notation indicates following back and, as for the code, this probability p h h appears as p_hater_back_follows_hater).
    • Hateful users receive less followers from normal users per time interval. Hence, following back by normal users is modelled with a probability p n n = 0.8 and p h n = 0.4 . Lastly, haters will be less likely to follow back normal users with p n h = 0.08 (in the code, these probabilities appear as p_normal_back_follows_normal, p_normal_back_follows_hater, and p_hater_back_follows_normal, respectively).

4.2. Opinion Diffusion by Content

The connections created in the network become the paths for opinion diffusion, since, if a user post some content, their followers will receive it and, as a result, may change their opinion. In the bounded confidence models described in Section 2.2, the influence of users is limited to its followers. However, in social networks such as Twitter, the content created by users can be reposted and, thus, arrive to and influence further audience.
Here we reuse the concept of confidence level, a threshold for opinion difference, defined in the Hegselmann–Krause (HK) model [29] and introduced in Section 2.2. Following the ideas of the heterogeneous HK model, we define the threshold τ i for accepting the opinion of other users tailored for every user i depending on their hate score. The assumption is that: (i) extreme users tend to have rather fixed opinions, which cannot be changed by any influence; and (ii) alternatively, those with a middle hate score may be more open to accept opinions that differ from their own, and in fact could be still dragged to one of the extremes. Figure 6 depicts the function used for the threshold: extreme left and right sides of the possible hate score values exhibit fixed opinion (i.e., with a threshold of 0) whereas median users have a threshold of 0.49.
Additionally, we borrow the formula of opinion adaption from the Deffuant–Weisbuch (DW) model [30] (see Section 2.2), but apply it to the author’s opinion carried within a post. Thus, a post of user j will influence the opinion of user i by a factor μ = 0.05 at the round k, if the difference of both opinions is below a confidence level τ i :
x i , k = x i , k 1 + μ · ( x j , k 1 x i , k 1 ) , iff | x i , k 1 x j , k 1 | < τ i
where x i , k represents the opinion of user i at time k and the τ i threshold is modelled as the previous triangular function on the users’ opinion (hate score) in Figure 6.
As aforementioned, in our simulations of content diffusion, we consider that followers’ opinions may change when the followees post new content but also when they repost. In particular characterise our diffusion model as follows:
  • Hateful users are very active and post at every round (i.e., with  a publication probability p h _ p u b = 1 ), whereas normal users only post with probability p n _ p u b = 0.2 (in the code, these probabilities appear as p _ p u b l i s h _ p o s t _ h a t e r and p _ p u b l i s h _ p o s t _ n o r m a l , respectively).
  • A post cannot be reposted twice by the same user. However, it can be reposted with some low probability even if the opinion does not correspond to reposter’s own opinion. We align here with the retweet statistics provided by Ribeiro et al. [21] and set reposting probabilities between normal (n) and hateful (h) users to r n n = 0.15 , r h h = 0.45 , r n h = 0.05 and r h n = 0.15 (here, the arrow → indicates content flow and, in the code, these probabilities appear as p _ n o r m a l _ r e p o s t s _ n o r m a l , p _ h a t e r _ r e p o s t s _ h a t e r , p _ n o r m a l _ r e p o s t s _ h a t e r , and  p _ h a t e r _ r e p o s t s _ n o r m a l , respectively). In this manner, a hater will repost a normal post with the lowest probability.
  • In order to model different users’ activity profiles, we limit the amount of reposts that a user can perform per round by setting variables to max_reposts_by_normals = 2 and max_reposts_by_haters = 6.

5. Modelling Countermeasures

This section describes how we enrich the baseline model in previous section with three alternative countermeasures aimed at containing the spread of hatred: education, deferring hateful content, and counter activism. The next subsections provide the necessary details about how these measures are modelled within our model.

5.1. Educational Bias

Education is considered the main long-term measure to counter the spread of hate speech. Indeed, advocates of free speech favour this measure over automatic filtering [40], which they strongly criticise. Education is aimed to develop critical thinking [10], enabling individuals to open discussions about any topic. Structured and argumented debates ought then lead to opinion forming and foster thinking [41]. Although education does not always result in tolerance (programmes fail to mitigate prejudice if they overlook factors such as values or ego defense [42]), from the perspective of the so called media literacy, education develops the skills to recognise hate speech itself [11]. Therefore, people need to be instructed in the usage and interpretation of modern digital media, and this is especially the case for youngsters.
Additionally, education can introduce an initial bias into the view of the population, e.g., by teaching democratic values and human rights [9]. However, rather than modelling how this positive bias is actually introduced (i.e., how education is implemented in the society), we can simply model its effect by skewing the hate score distribution used in the creation of the society. The mean value of the whole distribution should then move into the direction of non-hateful persons, hence decreasing the tendency towards the hatred. However, we assume that, despite the educational bias on the majority of the population, the group of very hateful persons will still be present in the population with the same proportion. So, the parameters of the Gamma probability distribution Γ ( α , λ ) are adjusted in such a way that the fraction of hateful persons stays invariably ca. 1% but their mean values μ are decreased. Figure 5 shows the baseline distribution Γ ( 10 , 25 ) and four further distributions with their corresponding mean values which vary from μ = 0.40 down to μ = 0.23 . In this manner, we do not model how the positive bias is introduced into the population but take it for granted and simply apply the bias (i.e., the positively-skewed alternative distributions in Figure 5) to the population during the network construction phase (see Section 4.1).

5.2. Deferring Hateful Content
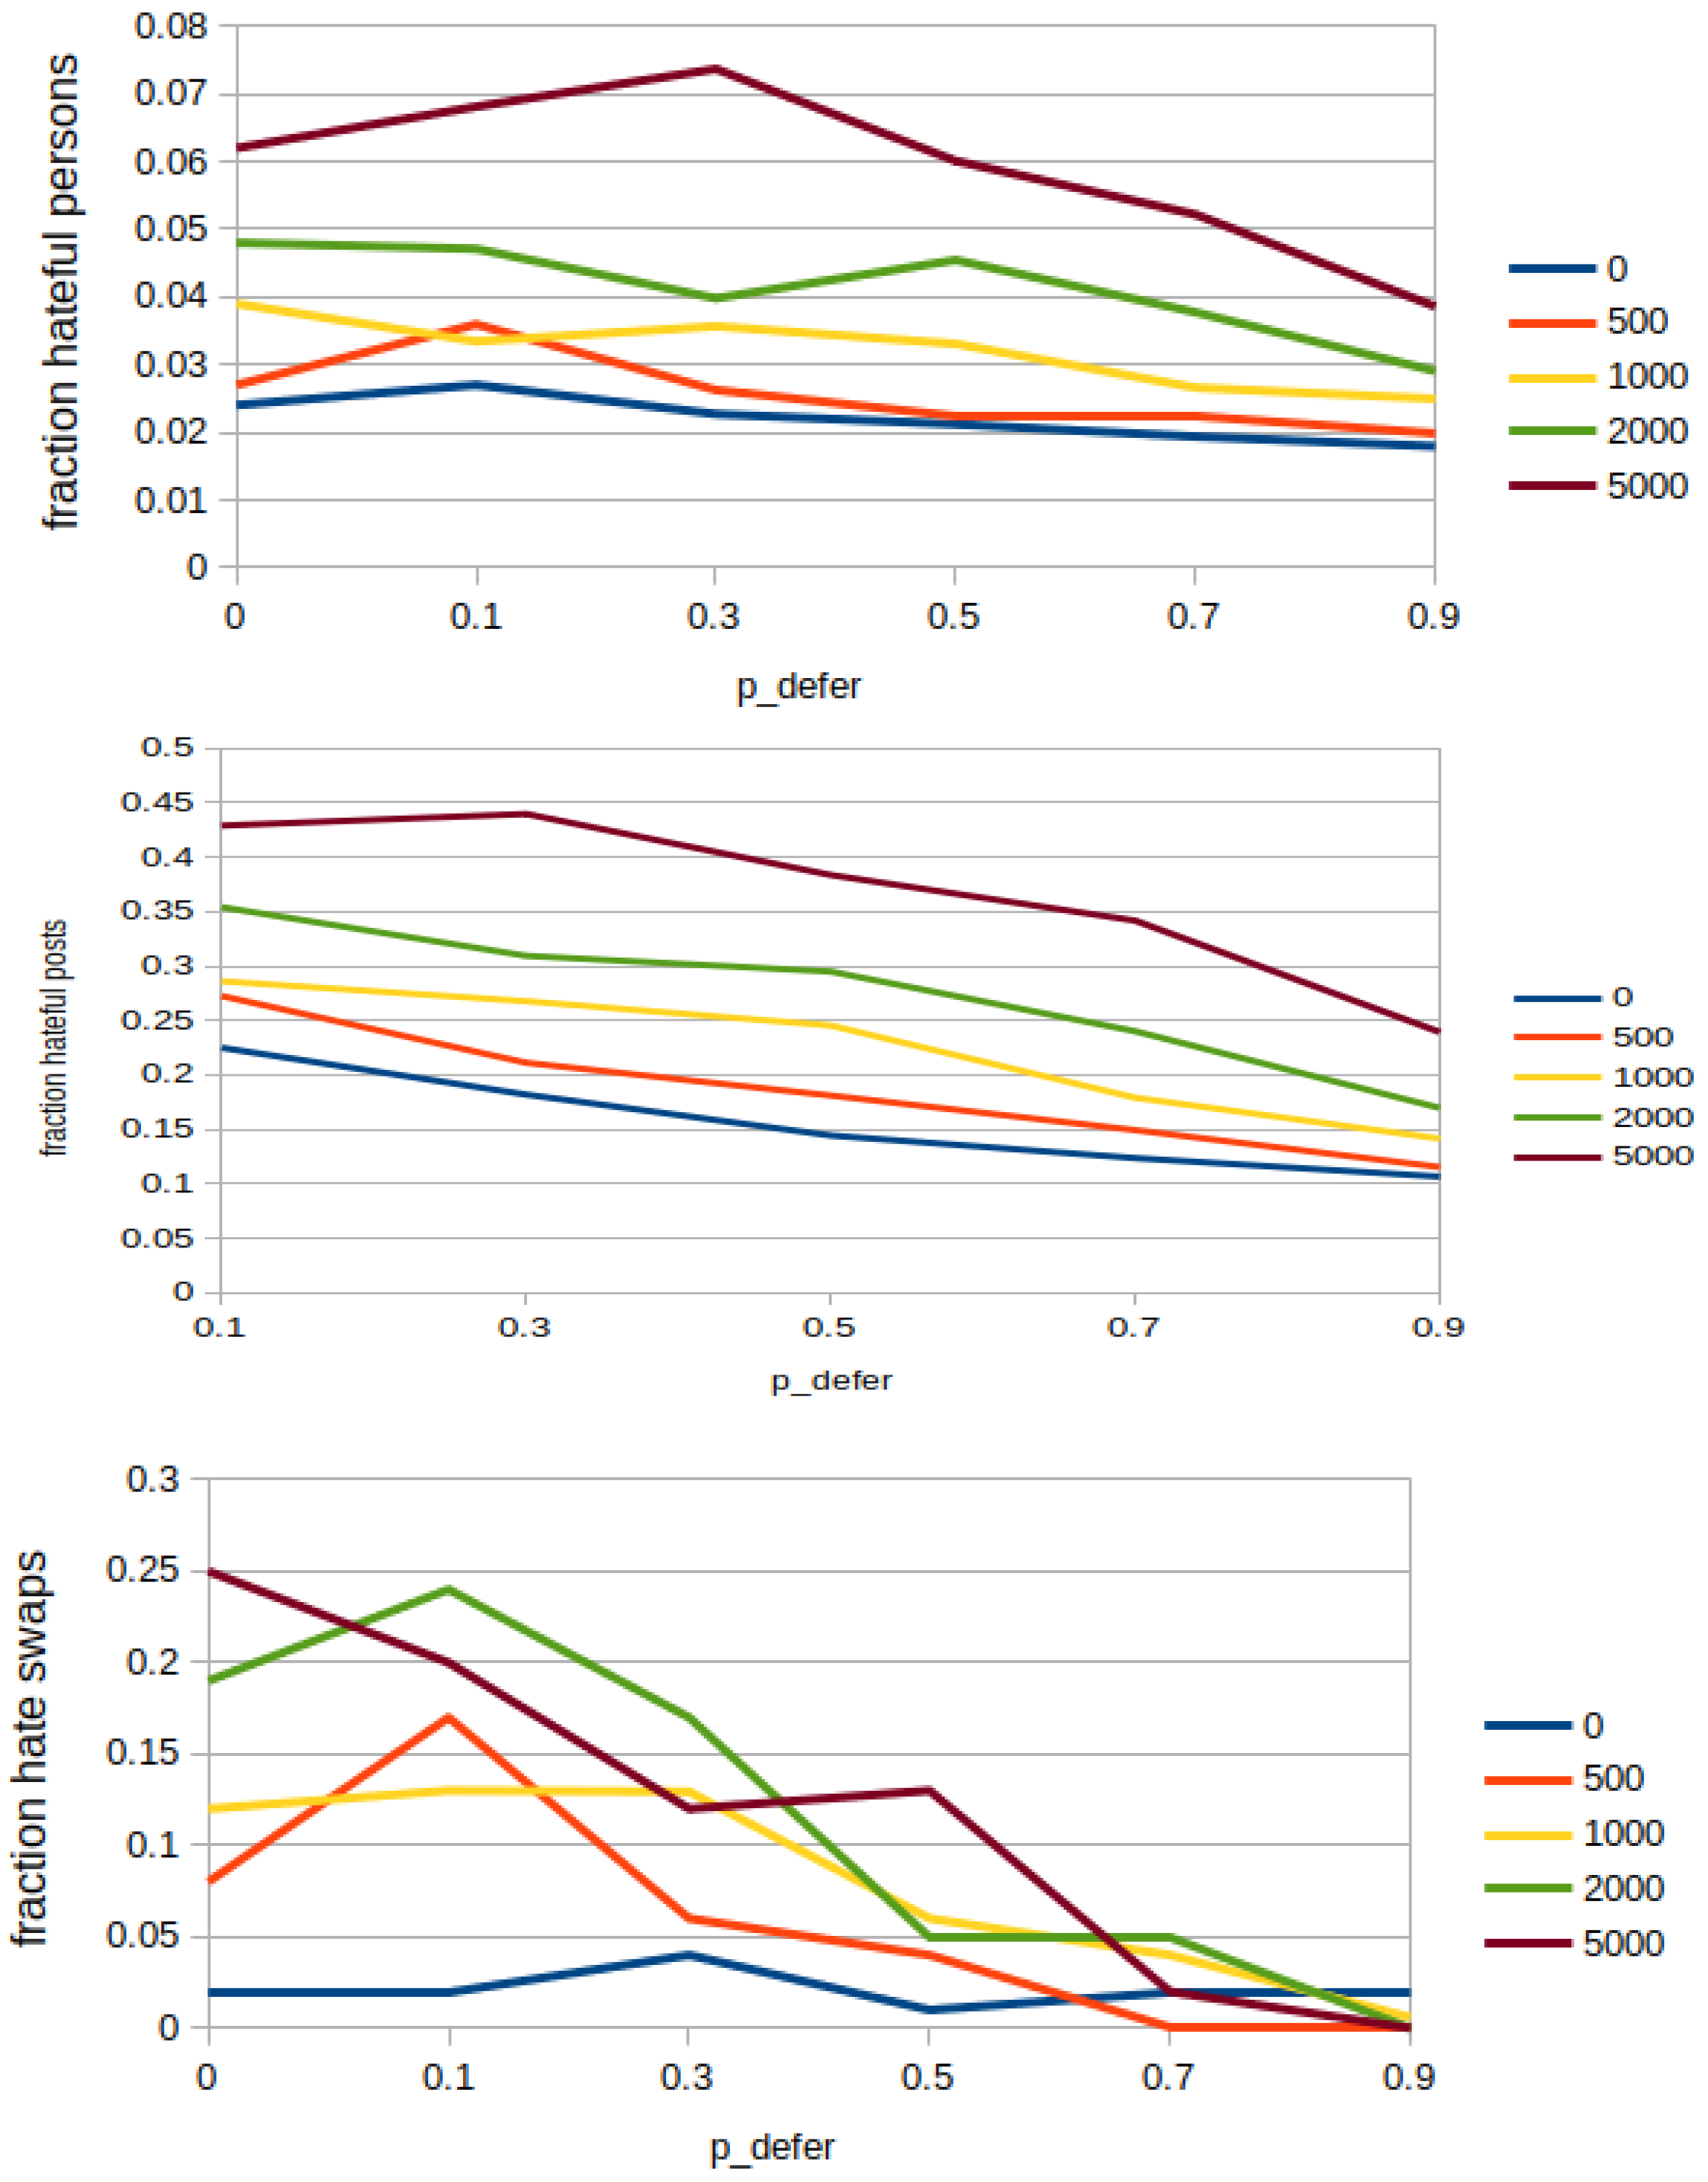
Hate motivated content seems to spread faster and farther through social networks than content generated by normal users. Thus, it can trespass community borders and reach out to wider audiences. The root of this behaviour seems to lie in the higher virality of the hate content, which is achieved, e.g., by usage of emotion triggering images [22]. Therefore, decelerating the publication of content or its visibility without filtering it out completely might already have a positive effect to deescalate conversations on polarised topics. This deceleration (or deferring) has the advantage of not infringing the freedom of speech as filtering and deleting of content would do.
Earlier theoretical work by Dharmapala and McAdam [43] proposed a utility-based model of hate speech influence that reveals that the perceived amount of hate speakers play a key role for motivating other users to join and engage in hate speech, making conversations more viral. It is also known that the lifetime of hateful conversations does not exceed a few days and has a culmination within the margins of one day [44]. This might be explained by people’s fast emotional responses—triggered by some event—which settle down rapidly. Hence, we take the assumption that deferring hateful content (i.e., posts) might deescalate conversations on polarised topics due to decreased perceived amount of participants and stabilised emotional state of responders. As far as we know, such responses (i.e., reposting, replying or liking) give more weight to the content and lead to better promotion of it by internal algorithms of social networks [8,45]. In this work, the response to such content is interpreted as reposting and, thus, the countermeasure of deferring posts and deferring reposting should contribute to decrease the participation in “hot” topics as well as to make hateful content less viral. We model this countermeasure by decreasing the willingness of posting/reposting hateful deferred content: The longer it was deferred, the less the willingness to post/repost.
Deferring hateful content constitutes a short-term countermeasure that we apply during the opinion diffusion phase in our simulations (see Section 4.2). We implement this countermeasure by considering two variables:
  • We employ a variable p d e f e r that stands for the probability of deferring a hateful post at each round (in the code, probability p d e f e r appears as p _ d e f e r _ h a t e f u l _ p o s t ). Any hateful post can be deferred again, if it is reposted in further rounds.
  • In addition to parameters in Section 4.2, a cumulative factor f _ r e p o s t _ d e f e r r e d _ p o s t = 0.5 is used to decrease the probability of being reposted. This means that the probability of being reposted would diminish by a factor of 0.5 for posts deferred for one round, 0.25 for 2 rounds, 0.125 for 3 rounds and so on.

5.3. Counter Activism

Counterspeech is defined as a direct response to hateful or harmful speech which seeks to undermine it. Examples of counterspeech are the presentation of an alternative narrative, rebuking a person for inadequate expressions and convincing a person to change discourse [46].
Counterspeech can be organised by institutions or campaigns but can also be spontaneous, although counterspeech that is conducted by organised groups is associated with a more balanced discourse [7]. Overall, a large scale analysis of conversations related to current societal and political issues on German Twitter between 2013 and 2018 revealed a slight increase of counter tweets in recent years [7]. Additionally, investigations on the case of hate against the Roma Minority in Slovakia has shown that counterspeech can motivate other people to express their opinion against hate speech [47].
In addition to the expected positive effect of promoting anti-hate slogans and to spread positively influencing messages, counterspeech can have different outcomes [46]. On the one hand, extreme opinions of counter speakers tend to be rather ignored [35,48]. On the other hand, the conversation can escalate the hate and counter speakers may become victims themselves. This is especially the cases when utterances are perceived as a threat to one’s own social identity [5]. Thus, moderate counterspeech may be more effective. Indeed, experiences from the activist group Red Levadura (https://redlevadura.net, accessed on 1 November 2021) reveal that emotional expression and empathy are the key factors for success of counterspeech [49]. In fact, counter speakers/activists have been identified as agreeable, altruistic, modest and sympathetic individuals [19].
Together, counter activists constitute a counter movement that act as the pole of ‘the good’, which could subsume different counteractivities such as organised counterspeech or public awareness campaigns. In our model, counter activists spread positively influencing messages whose hate score are in the lowest values, so within the interval [ 0 , 0.25 ) from the default Gamma distribution Γ ( 10 , 25 ) in this work—the lavender (right-most) distribution depicted in Figure 5. As counter activists react against existing hate spreading groups, we implement them as a mid-term measure that starts during the opinion diffusion phase (see Section 4.2), where activists are sampled from the group of non-hateful persons with a probability p c o n v i n c e (in the code, probability p c o n v i n c e appears as p _ c o n v i n c i n g _ t o _ b e c o m e _ a c t i v i s t ), instead of from persons who are just joining the network. By default, their opinion is not fixed (however, activists’ opinions can be fixed in the code by setting the s t u b b o r n _ a c t i v i s t s ? variable to true) and can change due to opinion diffusion. When it exceeds h a t e s c o r e 0.25 they change to normal activity, but keep previously created connections. Furthermore:
  • On becoming activist (denoted as a), a person spawns additional following connections c a to the group of all activists (in the code, this c a limit is set with the variable n _ f o l l o w i n g _ c o n n _ a c t i v i s t _ a d d i t i o n a l ), which are answered with the probability p a a = 0.9 (in the code, probability p a a appears as p _ a c t i v i s t _ b a c k _ f o l l o w s _ a c t i v i s t ).
  • Activists are as active as hateful users and, thus, they publish posts with the probability p a _ p u b = 1 at every round (in the code, probability p a _ p u b appears as p _ p u b l i s h _ p o s t _ a c t i v i s t ).
  • The maximal amount of reposts that an activist can perform per round is set to m a = 6 so that they promote non-hateful content frequently (in the code, m a appears as m a x _ r e p o s t s _ b y _ a c t i v i s t s ). However, they never repost any content of haters (and vice versa) and the reposting probabilities are r a h = r h a = 0 , r a a = 0.45 and r a n = r n a = 0.15 (in the code, these probabilities appear as p_activist_reposts_activist and p _ n o r m a l _ r e p o s t s _ a c t i v i s t , respectively).

6. Simulation Results

We used NetLogo multi-agent modeling environment (http://ccl.northwestern.edu/netlogo/, accessed on 1 November 2021) to implement our model. The resulting simulator is publicly available (see Data Availability Statement) together with the tests we carried out to analyse the simulation results and the obtained data (associated tests and resulting simulation data are also publicly available).
As introduced by Section 4, the simulation is conducted in two phases. First, the network construction phase (see Section 4.1) is run until t 1 [ 0 , 500 , 1000 , 2000 , 5000 ] rounds (ticks), which creates a network with about as many user nodes (more precisely, since we start with an initial network of two nodes and we add one network node per round, then the network finishes this phase having a size of t 1 + 2 nodes). Then, our opinion dynamics phase from Section 4.2 starts so that the network is grown for further 1000 rounds. Figure 7 depicts a screenshot of opinion diffusion in our simulation where both hateful and non-hateful posts are being distributed. Both posts and reposts are represented as solid circles, so our visualization (the graph layout algorithm is based on the Fruchterman–Reingold layout algorithm [50]) does not distinguish the publishing of original content from its subsequent reposting. Moreover, the direction of links indicates influence: we signal that a followee user A influences its follower B by a directed arrow (i.e., a link in the model) that goes from A to B. Thus, the amount of out-going links (i.e., the out-degree) of a user node corresponds to its amount of followers.
Each simulation is conducted 100 times for building the following average metrics:
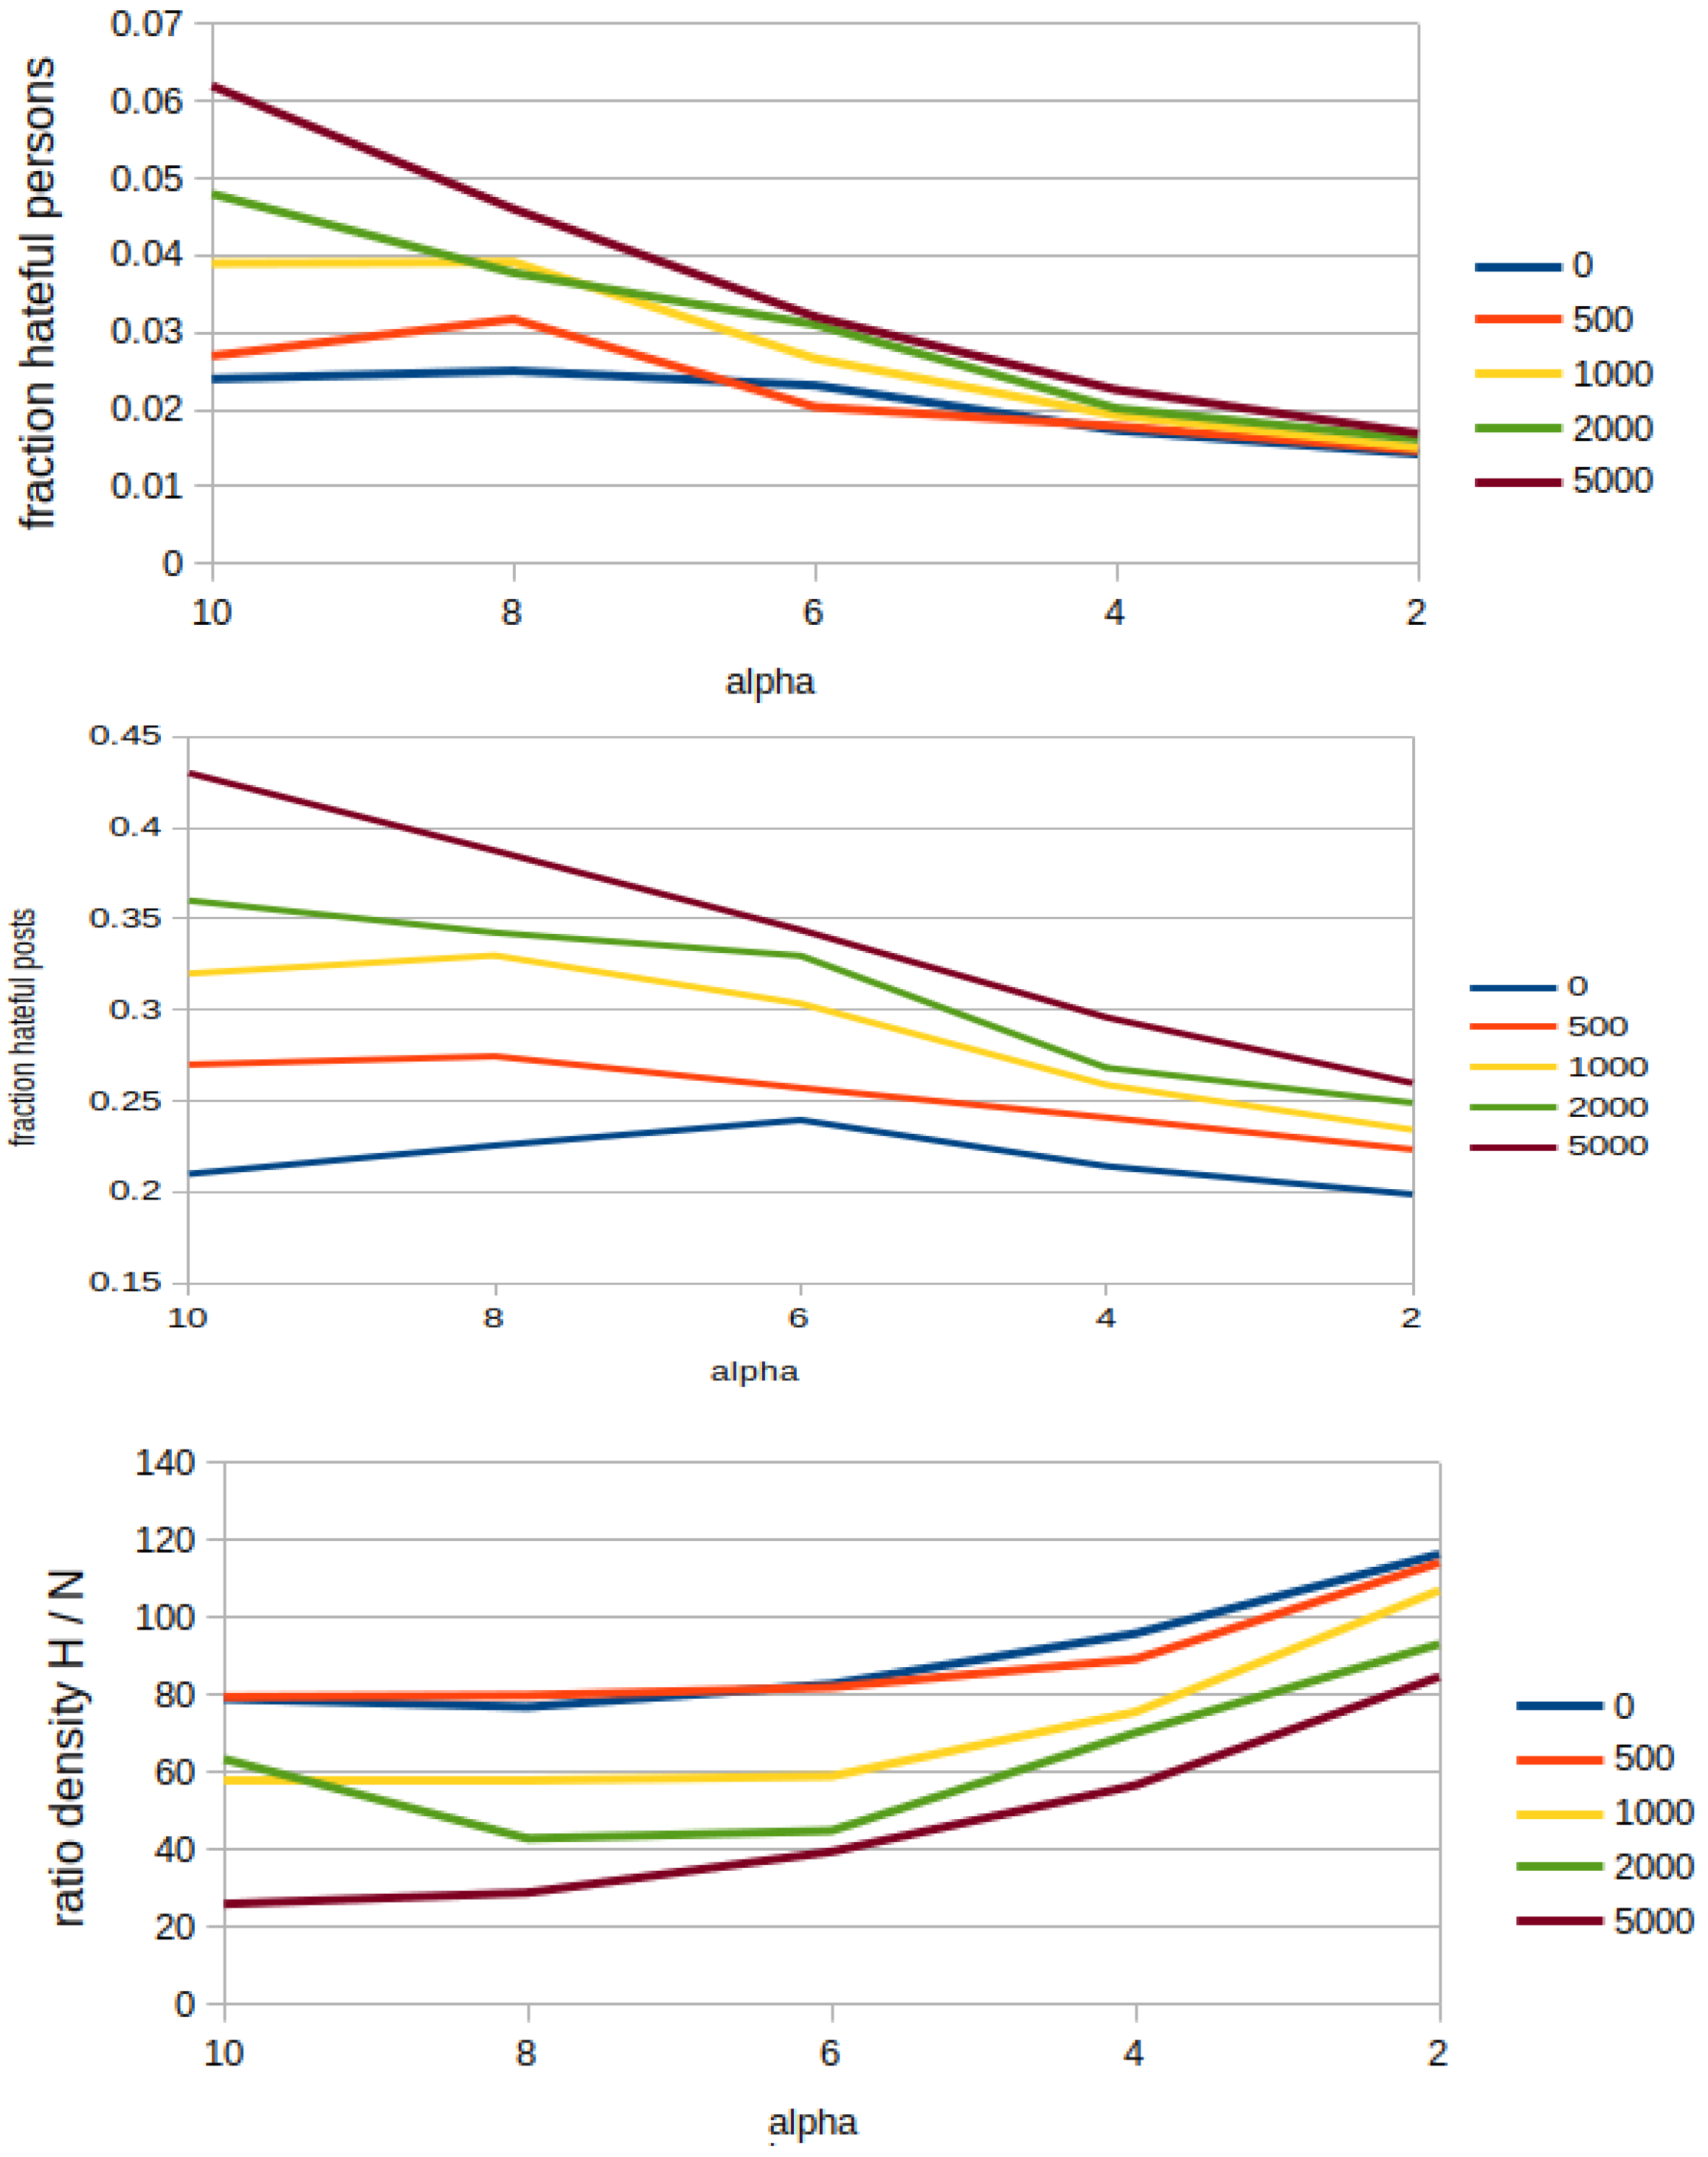
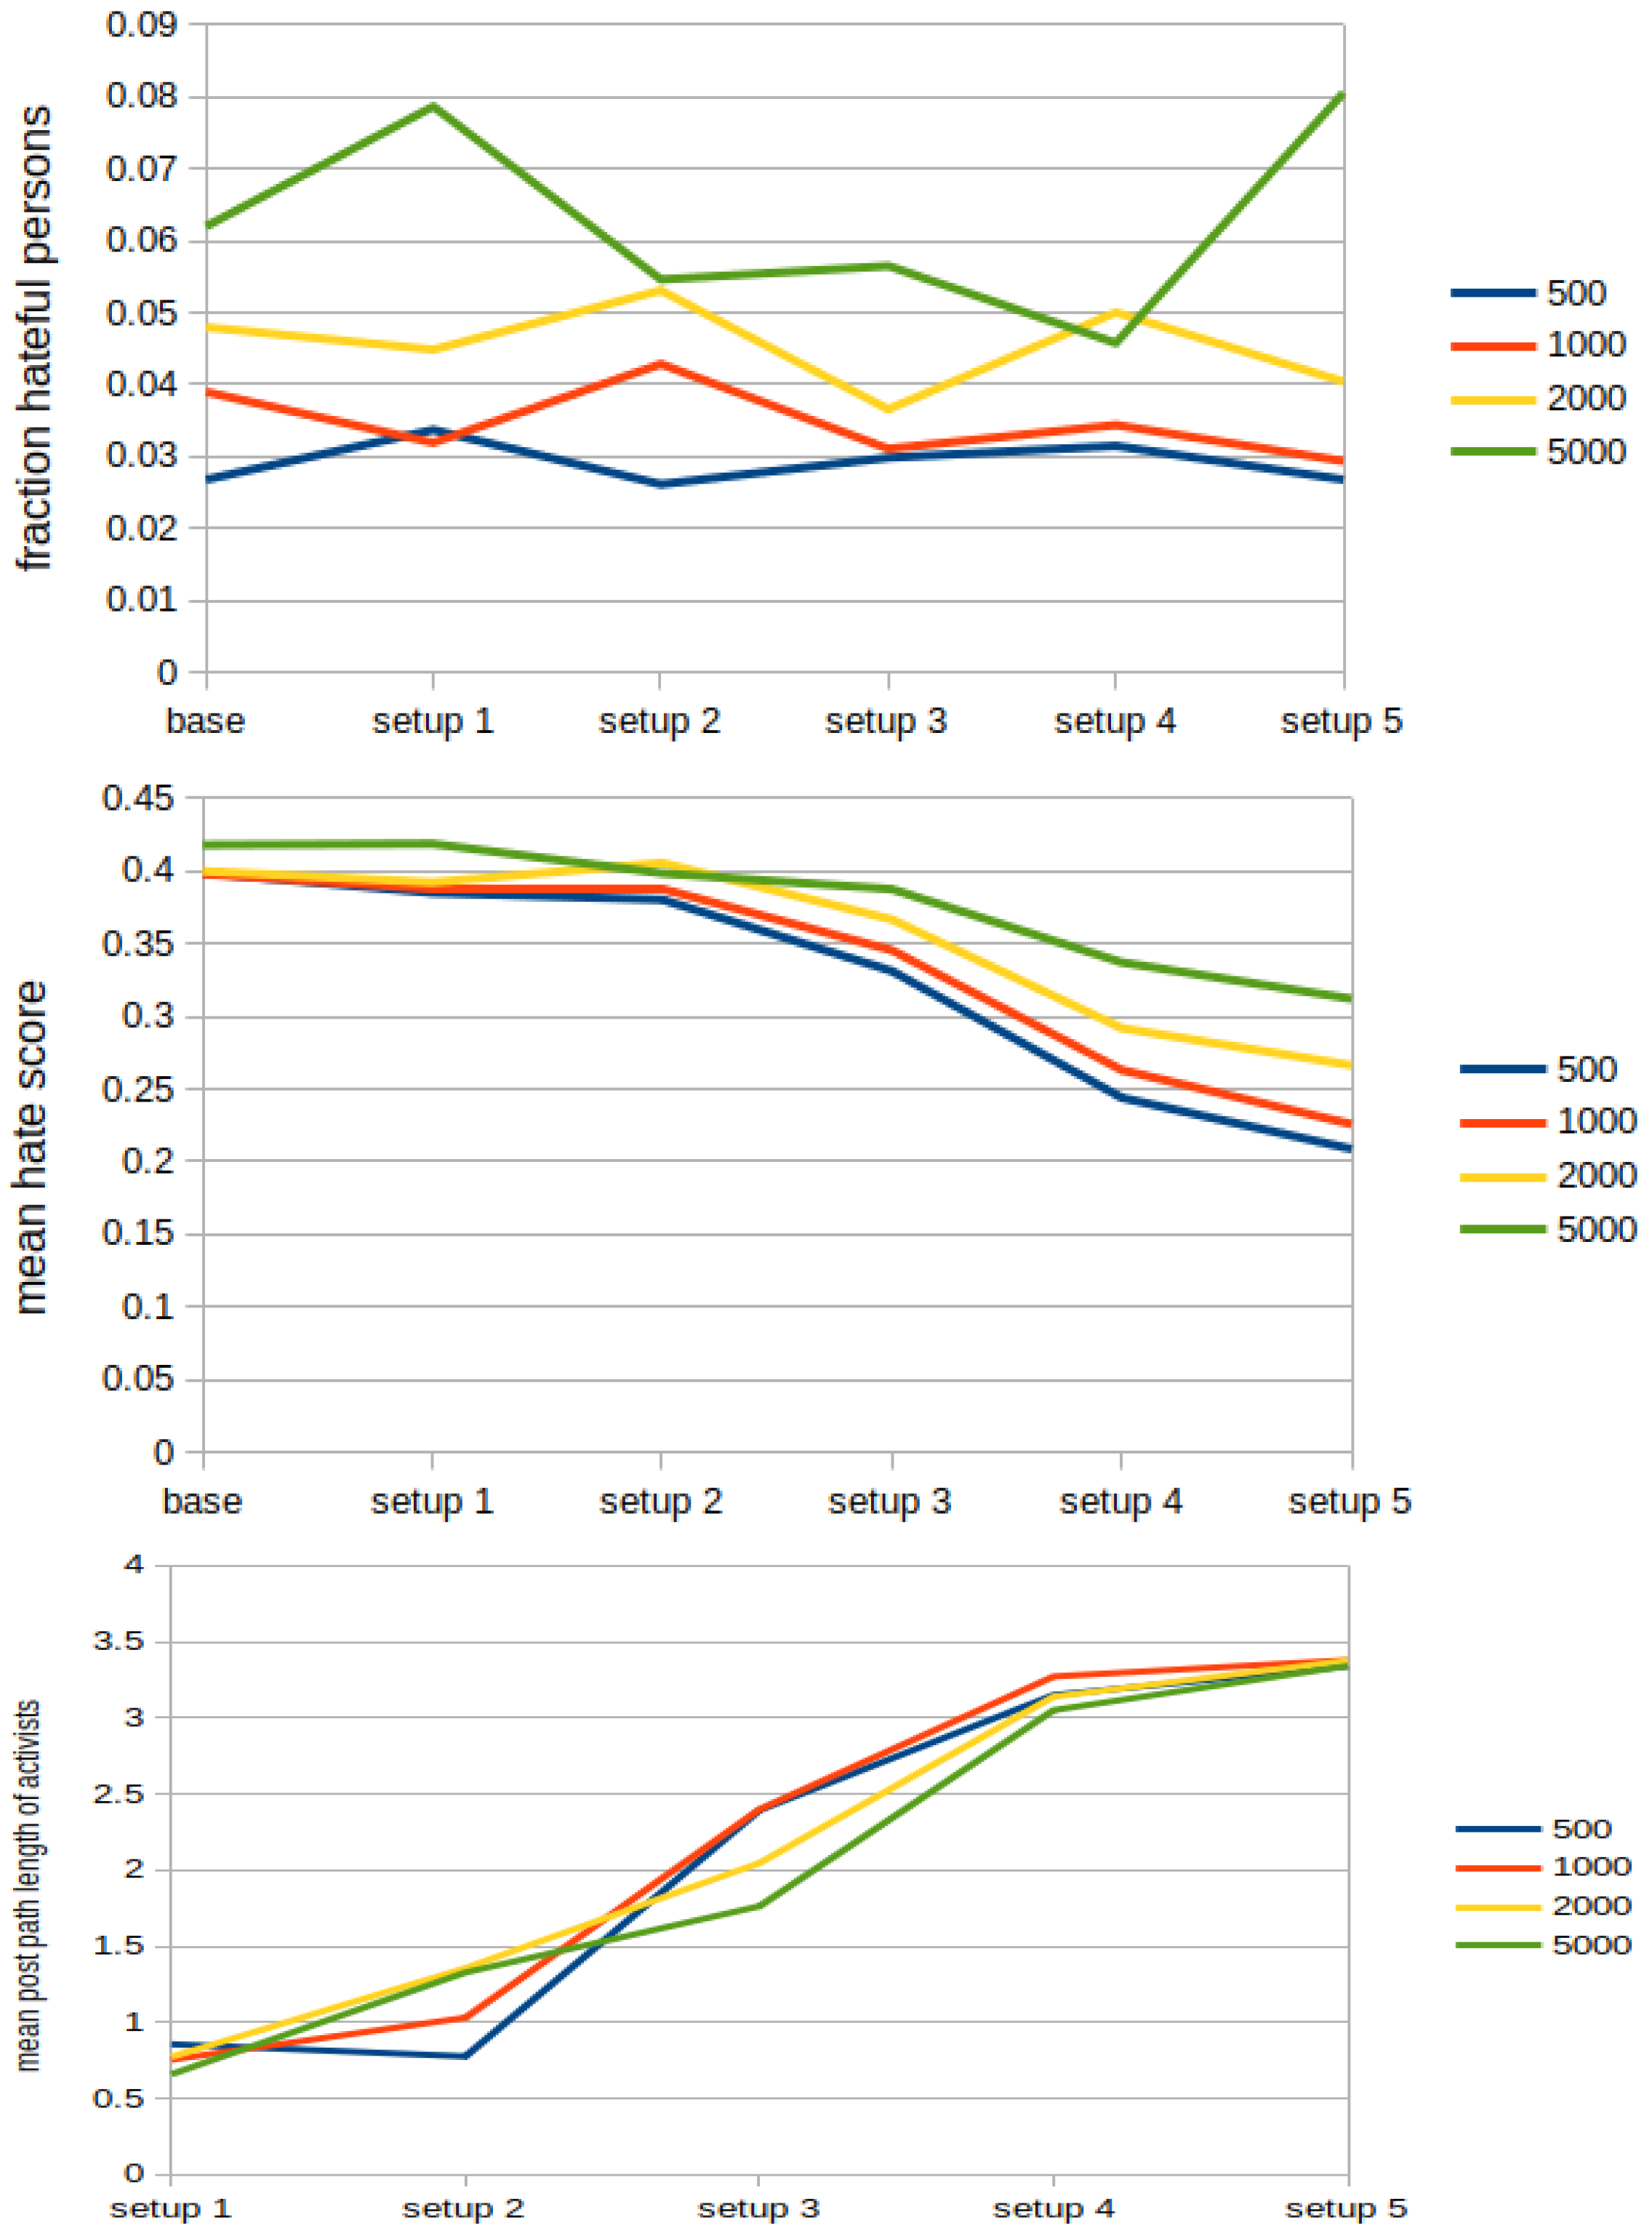
  • Fractions of normal and hateful persons, which correspond, respectively, to the proportion of the normal and hateful persons over the whole network population.
  • Fractions of normal and hateful posts: the proportion of posts authored by hateful and normal users over the whole amount of posts that exist at the current round. Notice that the amount of posts per round can be much higher than the amount of existing persons, because of the possibility to repost multiple posts from the own neighbours.
  • Mean and standard deviation of hate score distribution within the society.
  • Ratio of network densities of hateful over normal users, which shows how much the group of hateful users is more cohesive than the group of normal users. Network density for each group is computed as the division of actual_connections/potential_ c o n n e c t i o n s , where p o t e n t i a l _ c o n n e c t i o n s = n ( n 1 ) / 2 and n is the network population. The overall ratio is then computed as the division of both network densities: densities_ratio = network_density_haters/network_density_normals.
  • Reciprocity of following within normal or hateful users. When two users follow each other (i.e., a followee back-follows its follower) we count these two links as one reciprocal connection. Then, we compute the number of reciprocal connections divided by all connections within a specific group—be it the haters or the group of normal users.
  • Mean followers and mean followees, e.g., mean followers corresponds to the average amount of out-going influence connections over a group of (hateful or normal) persons.
  • Mean ratio follower/followee: the average of out-going/in-coming influence connections. This metric shows the connectivity profile in terms of following relations and is of interest because haters are known to have less followers than the following connections their create.
  • Mean path length of reposts through the network: the average over all post path lengths through the network. It is computed considering that each post generates multiple paths if reposted by different followers.
  • Fraction of swaps to a hateful society: proportion of runs which end with a swap (i.e., having more than 30% of hateful users, see Section 3). Those are not taken into account for none of the above metrics due to the instability they introduce. Instead, they are tracked separately through this specific metric.

6.1. Validating the Baseline Model

Validation of the baseline model is an important step for this work, since it normalises the simulation with real statistics on hateful users. Regarding the first phase of network construction, multiple metrics could be satisfactorily reproduced in accordance to the state-of-the-art. However, runs resulted in extremely high network density ratios of hateful users over normal users which turned out to be ca. 11 times more than reported by [22]. Additionally, the amount of followers as well as the ratio between followers and followees of haters were too high compared to normal users. Subsequently, during the second phase of opinion diffusion, these metrics decreased until being very close to the reported values for higher network sizes. Table 1 details a subset of the resulting average values for simulations with varying number of ticks. As signaled in red, only the reciprocity among hateful users were too low compared to normal users. Although this might be repaired by introducing additional rewiring rules for users who switch from normal to hateful state, we advocate for the simplicity of the model and leave this for future work.
Simulation results also show an interesting fact in comparison between the phases of network growth without and with opinion diffusion. The switch from one phase to another demarcates a structural change in the sub-network of hateful users. It allows hate cores to disseminate hatred in strains to normal users with lesser network densities, showing that true hate cores might be even more densely connected than reported by statistics about real social networks. Overall, from these results, we can argue that our simulation represents hateful behaviours in a reasonable way.

6.2. Countermeasures Simulation Results

Once we have been able to successfully replicate the behaviour of hateful users in a social network, we can now proceed to evaluate the influence of the three countermeasures we have implemented.

6.2.1. Educational Bias

As previously described in Section 5.1, simulations of the usage of education as a countermeasure are based on our definition of hateful user in Section 3. Specifically, we set a user to be hateful when its hate score is larger than a given threshold. As hate score is assigned considering a Gamma distribution, we then induce stronger positive bias in the users’ hate score by decreasing the α parameter in the distribution (see Figure 5).
Our simulations show that the effect of this countermeasure is two-fold. On the one hand, considering the fraction of hateful persons, we can observe, from the top of Figure 8, that if we take as reference the hate scores set when α = 10 in the Gamma distribution, then, all subsequent (lower) α values imply a substantial decrease in the amount of hateful persons, even if they are not completely removed from the society. Indeed, even with the strongest educational bias, which sets α = 2 and reduces the fraction of hateful persons below 0.02 for all the considered network sizes, the amount of haters does not fall below of 1%. Similarly, as shown in the middle of Figure 8, the amount of hateful posts decreases down to below 0.27 for all network sizes when α = 2 . Additional tests show that the risk of swaps to a hateful society drops from 25% below 5% for the values of α = 6 , 4 , 2 for all network sizes. These tests also show that the mean hate score have similar values for all network sizes and steadily decrease from ca. 0.4 for the original Gamma distribution (i.e., with α = 10 ), down to a ca. 0.1 for α = 2 . This can be explained by the structure of the network that results from using preferential attachment, where some nodes have unproportionally higher influence. Hence, applying a skewed distribution upon it can skew the final distribution even more after opinion diffusion.
On the other hand, the density among hateful users increases as depicted on the bottom of Figure 8. The same happens for the reciprocity and mean follower-followee ratio. This increase is due to the fact that education impedes the emergence of hate strains, so that hateful persons stay among like-minded within highly densely connected hate cores. Additionally, the mean path length of hateful posts increases linearly. This is a consequence of the fact that, although hate posts have much less room to unfold by reposting within hate strains (see Figure 3), hateful posts can still make very long paths by circulating posts between persons within a hate core (see Figure 1). Overall, and despite this increase of the density, the effect of the education countermeasure can be summarised as being very successful.

6.2.2. Deferring Hateful Content

As Section 5.2 details, the simulations aimed at studying the effect of deferring hateful content are conducted by varying the deferring probability p d e f e r and considering that a value of 0.7 deems realistic if we take into account the state-of-the-art accuracy in recognition of hate speech [51]. The obtained results show that, compared to the education, this countermeasure is less successful in decreasing the fraction of hateful persons as can be seen on the top of Figure 9, where a value of p d e f e r as high as 0.9 still results in a fraction of hateful users that varies from the ca. 4% for the largest network size down to a fraction of ca. 2% for the smallest one. Surprisingly, we can even observe some kind of reluctance and increase for p d e f e r < 0.5 . As the middle of Figure 9 depicts, something similar happens with the fraction of hateful posts for the largest network size (i.e., 5000), although the main tendency for all the network sizes and probabilities is to decrease values.
As for the mean hate score, it follows a similar pattern, where highest mean hate score is ca. 0.425 for a p d e f e r = 0.3 in the 5000 network, and it goes down to ca. 0.39 for p d e f e r = 0.9 in all the simulated networks. However, this countermeasure has an obvious effect in decreasing the mean path length of hateful content from an initial range of ca. [1.75, 2.6] for a p d e f e r = 0 (i.e., without deferring) down to a range of ca. [0.25, 1.1] for a p d e f e r = 0.9 in all network sizes. More outstanding is its property in protection against swaps to a hateful society as shown on the bottom of Figure 8, as it goes below 0.025 for all network sizes when p d e f e r = 0.9 .
Overall, we can observe that deferring results are similar to the ones from education, but they have the advantage of having a short-term effect. We argue this is very relevant because deferring content is aligned with the freedom of speech value, which is not the case of other short-term countermeasures such as automatic filtering.

6.2.3. Counter Activism

In the case of counter activists (see Section 5.3), we used five different simulation setups with the aim of increasing the strength of the counter movement. Table 2 details how these setups where parameterised. Specifically, the strength of the counter movement strictly increases from setups #1, #2, #4, and #5 due to subsequent increases of the convincing probability p c o n v i n c e , the number of activists’ connections c a , the inclusion of stubbornness, and the selection of activists by their influence, respectively. Setup #3 is in fact a variation of setup #2, as it has higher convincing probability but less connections.
Surprisingly, none of those simulations lead to a clear decrease of hateful users as depicted on the top of Figure 10, where values fluctuate within the [0.025, 0.08] interval for the different network sizes. Exceptionally, a decrease could be only recorded for settings with bigger networks over 5000 users in setups 2–4. The same happens to the fraction of swaps to a hateful society, whose values fluctuate in the [0.03, 0.41] interval for different setups and network sizes.
Even so, a drop of the mean hate score was recorded—especially for the settings with stubborn activists—as seen on the middle of Figure 10, the mean hate score drops from ca. 0.4 to values within the interval [0.21, 0.32]. Thus, activists seem to create higher polarisation within the society by dragging some persons into the positive direction without affecting hateful persons. This depletes representatives of the median opinion, so that people with higher hate scores are rather attracted by very hateful users.
Additionally, the bottom of Figure 10 plots an increase in the mean path length of activists’ posts from values below 0.9 up to values of ca. 3.4. This can be attributed to the strengthening of the counter movement and replicates the tendency of activists to mimic the behaviour of hateful users. Overall, our simulations seem to suggest that activism needs to be carried out in a very sensible way. Otherwise, it may not lead to the desired results.

7. Conclusions and Future Work

This paper proposes a multi-agent model of the spread of hatred within social networks. We base our modelling on insights from previous research and take these as reference to successfully validate the resulting model, the so-called baseline model. Then, we enrich it by adding three countermeasures—education, deferring hateful content and conter activism—and conduct a series of experiments to assess their effectiveness in containing the spread of hatred. As a result, we conclude that: (i) Education proves to be very successful long-term countermeasure, although it still cannot eliminate hatred completely; (ii) Deferring hateful content shows a similar (lower) positive effect, but it also has the advantage of being a short-term countermeasure; (iii) Cyber counteractivism needs to be carefully articulated, as it can increase the society polarisation. Additionally, our simulations seem to indicate that hate cores—which are responsible for hate spread—in real-world social networks might be even more densely connected than reported by current statistics.
As future work, we plan to further refine our model to dive deeper in the study of counteractivism and the other implemented countermeasures. In addition, we find it particularly interesting to model the effects on the content receivers by differentiating passive listeners from the victims of the hateful content. Moreover, we also plan to incorporate additional countermeasures such as awareness campaigns or tight community management.

Author Contributions

Conceptualization, M.L.-S.; methodology, M.L.-S.; software, A.M.; validation, A.M. and M.L.-S.; formal analysis, A.M.; investigation, A.M.; resources, A.M.; writing—original draft preparation, M.L.-S. and A.M.; writing—review and editing, M.L.-S.; visualization, A.M.; supervision, M.L.-S.; project administration, M.L.-S.; funding acquisition, M.L.-S. All authors have read and agreed to the published version of the manuscript.

Funding

This research was funded by projects: 2017 SGR code 341 from the Agència de Gestió d’Ajuts Universitaris i de Recerca (AGAUR) from the Generalitat de Catalunya; MISMIS (Desinformacióny agresividad en Social Media: Analizando el lenguaje, code PGC2018-096212-B-C33) from the Spanish Ministerio de Ciencia, Innovacióny Universidades; Crowd4SDG (Citizen Science for Monitoring Climate Impacts and Achieving Climate Resilience, code H2020-872944) from the European Union; CI-SUSTAIN (Advanced Computational Intelligence Techniques for Reaching, code PID2019-104156GB-I00) from the Spanish Ministerio de Ciencia e Innovación; COREDEM (The Influence of Complex Reward Computation and Working Memory Load onto Decision-Making: A combined Theoretical, Human and Non-human primate approach code SGA2H2020-785907 within the Human Brain Project) from the European Union; and nanoMOOC (Nou format audiovisual amb funcionalitats tecnològiques avançades per a l’aprenentatge code COMRDI18-1-0010-02) from Agència de Suport a l’Empresa Catalana.

Institutional Review Board Statement

Not applicable.

Informed Consent Statement

Not applicable.

Data Availability Statement

Simulations in the paper were conducted with a NetLogo model developed by the authors that is publicly available from http://www.maia.ub.es/~maite/Students.html or directly at http://www.maia.ub.es/~maite/thesis/network_growth.nlogo. The data reported in the paper was generated during the study by using that simulation. Data and associated tests are also publicly available at https://github.com/agrizzli/simulation_countering_hate_speech, all accessed on 1 November 2021.

Conflicts of Interest

The authors declare no conflict of interest. The funders had no role in the design of the study; in the collection, analyses, or interpretation of data; in the writing of the manuscript, or in the decision to publish the results.

Abbreviations

The following abbreviations are used in this manuscript:
ABMAgent-Based Modelling
ACGAverage Consensus Gossiping
a.k.aalso kwnon as
ca.circa (about)
e.g.exempli gratia (for example)
et al.et alia (and others)
DWDeffuant–Weisbuch
HKHegselmann–Krause
i.e.id est (this is)

References

  1. Bilewicz, M.; Soral, W. Hate speech epidemic. The dynamic effects of derogatory language on intergroup relations and political radicalization. Political Psychol. 2020, 41, 3–33. [Google Scholar] [CrossRef]
  2. Cohen-Almagor, R. Fighting hate and bigotry on the Internet. Policy Internet 2011, 3, 1–26. [Google Scholar] [CrossRef]
  3. Jane, E.A. ‘Back to the kitchen, cunt’: Speaking the unspeakable about online misogyny. Continuum 2014, 28, 558–570. [Google Scholar] [CrossRef]
  4. Li, Q. Cyberbullying in schools: A research of gender differences. Sch. Psychol. Int. 2006, 27, 157–170. [Google Scholar] [CrossRef]
  5. Kümpel, A.S.; Rieger, D. Wandel der Sprach-und Debattenkultur in sozialen Online-Medien: Ein Literaturüberblick zu Ursachen und Wirkungen von Inziviler Kommunikation; Konrad-Adenauer-Stiftung e. V.: Berlin, Germany, 2019. [Google Scholar]
  6. Mathew, B.; Illendula, A.; Saha, P.; Sarkar, S.; Goyal, P.; Mukherjee, A. Hate begets hate: A temporal study of hate speech. Proc. ACM Hum.-Comput. Interact. 2020, 4, 1–24. [Google Scholar] [CrossRef]
  7. Garland, J.; Ghazi-Zahedi, K.; Young, J.G.; Hébert-Dufresne, L.; Galesic, M. Countering hate on social media: Large scale classification of hate and counter speech. arXiv 2020, arXiv:2006.01974. [Google Scholar]
  8. O’Callaghan, D.; Greene, D.; Conway, M.; Carthy, J.; Cunningham, P. Down the (white) rabbit hole: The extreme right and online recommender systems. Soc. Sci. Comput. Rev. 2015, 33, 459–478. [Google Scholar] [CrossRef]
  9. Keen, E.; Georgescu, M. Bookmarks: Manual for Combating Hate Speech through Human Rights Education. Council of Europe. 2016. Available online: https://www.coe.int/en/web/no-hate-campaign/compendium/-/asset_publisher/PyHuON7WYezs/content/-bookmarks-a-manual-for-combating-hate-speech-online-through-human-rights-education-?inheritRedirect=false (accessed on 8 November 2012).
  10. Isasi, A.C.; Juanatey, A.G. Hate Speech in Social Media: A State-of-the-Art Review. Available online: https://ajuntament.barcelona.cat/bcnvsodi/wp-content/uploads/2017/01/Informe_discurso-del-odio_ENG.pdf (accessed on 8 November 2012).
  11. Gagliardone, I.; Gal, D.; Alves, T.; Martinez, G. Countering Online Hate Speech; Unesco Publishing: Paris, France, 2015. [Google Scholar]
  12. Johnson, N.; Leahy, R.; Restrepo, N.J.; Velasquez, N.; Zheng, M.; Manrique, P.; Devkota, P.; Wuchty, S. Hidden resilience and adaptive dynamics of the global online hate ecology. Nature 2019, 573, 261–265. [Google Scholar] [CrossRef]
  13. Chandrasekharan, E.; Pavalanathan, U.; Srinivasan, A.; Glynn, A.; Eisenstein, J.; Gilbert, E. You cannot stay here: The efficacy of reddit’s 2015 ban examined through hate speech. Proc. ACM Hum.-Comput. Interact. 2017, 1, 1–22. [Google Scholar] [CrossRef]
  14. Van Dam, K.H.; Nikolic, I.; Lukszo, Z. Agent-Based Modelling of Socio-Technical Systems; Springer Science & Business Media: Berlin/Heidelberg, Germany, 2012; Volume 9. [Google Scholar]
  15. Müller, A.; Lopez-Sanchez, M. Countering Negative Effects of Hate Speech in a Multi-Agent Society. Front. Artif. Intell. Appl. Artif. Intell. Res. Dev. 2021, 339, 103–112. [Google Scholar]
  16. Sulis, E.; Terna, P. An Agent-based Decision Support for a Vaccination Campaign. J. Med. Syst. 2021, 45, 1–7. [Google Scholar] [CrossRef] [PubMed]
  17. Le Page, C.; Bazile, D.; Becu, N.; Bommel, P.; Bousquet, F.; Etienne, M.; Mathevet, R.; Souchere, V.; Trébuil, G.; Weber, J. Agent-based modelling and simulation applied to environmental management. In Simulating Social Complexity; Springer: Berlin/Heidelberg, Germany, 2013; pp. 499–540. [Google Scholar]
  18. Ahrweiler, P.; Schilperoord, M.; Pyka, A.; Gilbert, N. Modelling research policy: Ex-ante evaluation of complex policy instruments. J. Artif. Soc. Soc. Simul. 2015, 18, 5. [Google Scholar] [CrossRef] [Green Version]
  19. Mathew, B.; Kumar, N.; Goyal, P.; Mukherjee, A. Interaction dynamics between hate and counter users on Twitter. In Proceedings of the 7th ACM IKDD CoDS and 25th COMAD, Hyderabad, India, 5–7 January 2020; pp. 116–124. [Google Scholar]
  20. Frischlich, L.; Schatto-Eckrodt, T.; Boberg, S.; Wintterlin, F. Roots of incivility: How personality, media use, and online experiences shape uncivil participation. Media Commun. 2021, 9, 195–208. [Google Scholar] [CrossRef]
  21. Ribeiro, M.; Calais, P.; Santos, Y.; Almeida, V.; Meira, W., Jr. Characterizing and detecting hateful users on twitter. In Proceedings of the International AAAI Conference on Web and Social Media, Palo Alto, CA, USA, 25–28 June 2018; Volume 12. [Google Scholar]
  22. Mathew, B.; Dutt, R.; Goyal, P.; Mukherjee, A. Spread of hate speech in online social media. In Proceedings of the 10th ACM Conference on Web Science, Boston, MA, USA, 30 June–3 July 2019; pp. 173–182. [Google Scholar]
  23. Ling, C.; AbuHilal, I.; Blackburn, J.; De Cristofaro, E.; Zannettou, S.; Stringhini, G. Dissecting the Meme Magic: Understanding Indicators of Virality in Image Memes. arXiv 2021, arXiv:2101.06535. [Google Scholar] [CrossRef]
  24. Soral, W.; Bilewicz, M.; Winiewski, M. Exposure to hate speech increases prejudice through desensitization. Aggress. Behav. 2018, 44, 136–146. [Google Scholar] [CrossRef]
  25. Calvert, C. Hate speech and its harms: A communication theory perspective. J. Commun. 1997, 47, 4–19. [Google Scholar] [CrossRef]
  26. Dimakis, A.G.; Kar, S.; Moura, J.M.; Rabbat, M.G.; Scaglione, A. Gossip algorithms for distributed signal processing. Proc. IEEE 2010, 98, 1847–1864. [Google Scholar] [CrossRef] [Green Version]
  27. DeGroot, M.H. Reaching a consensus. J. Am. Stat. Assoc. 1974, 69, 118–121. [Google Scholar] [CrossRef]
  28. Friedkin, N.E.; Johnsen, E.C. Social influence and opinions. J. Math. Sociol. 1990, 15, 193–206. [Google Scholar] [CrossRef]
  29. Hegselmann, R.; Krause, U. Opinion dynamics and bounded confidence models, analysis, and simulation. J. Artif. Soc. Soc. Simul. 2002, 5, 1–33. [Google Scholar]
  30. Weisbuch, G. Bounded confidence and social networks. Eur. Phys. J. B 2004, 38, 339–343. [Google Scholar] [CrossRef] [Green Version]
  31. Terizi, C.; Chatzakou, D.; Pitoura, E.; Tsaparas, P.; Kourtellis, N. Angry Birds Flock Together: Aggression Propagation on Social Media. arXiv 2020, arXiv:2002.10131. [Google Scholar]
  32. Jager, W.; Amblard, F. Uniformity, bipolarization and pluriformity captured as generic stylized behavior with an agent-based simulation model of attitude change. Comput. Math. Organ. Theory 2005, 10, 295–303. [Google Scholar] [CrossRef] [Green Version]
  33. Sherif, M.; Hovland, C.I. Social Judgment: Assimilation and Contrast Effects in Communication and Attitude Change; Yale University Press: London, UK, 1961. [Google Scholar]
  34. Stefanelli, A.; Seidl, R. Opinions on contested energy infrastructures: An empirically based simulation approach. J. Environ. Psychol. 2017, 52, 204–217. [Google Scholar] [CrossRef]
  35. Schieb, C.; Preuss, M. Considering the Elaboration Likelihood Model for simulating hate and counter speech on Facebook. SCM Stud. Commun. Media 2018, 7, 580–606. [Google Scholar] [CrossRef]
  36. Petty, R.E.; Cacioppo, J.T. The elaboration likelihood model of persuasion. In Communication and Persuasion; Springer: Berlin/Heidelberg, Germany, 1986; pp. 1–24. [Google Scholar]
  37. Janssen, M.A. Agent-based modelling. Model. Ecol. Econ. 2005, 155, 172–181. [Google Scholar]
  38. Moon, J.W.; Moser, L. On cliques in graphs. Isr. J. Math. 1965, 3, 23–28. [Google Scholar] [CrossRef]
  39. Barabási, A.L.; Albert, R. Emergence of scaling in random networks. Science 1999, 286, 509–512. [Google Scholar] [CrossRef] [PubMed] [Green Version]
  40. Llansó, E.J. No amount of “AI” in content moderation will solve filtering’s prior-restraint problem. Big Data Soc. 2020, 7, 2053951720920686. [Google Scholar] [CrossRef] [Green Version]
  41. Howard, J.W. Free speech and hate speech. Annu. Rev. Political Sci. 2019, 22, 93–109. [Google Scholar] [CrossRef]
  42. Leets, L. Experiencing hate speech: Perceptions and responses to anti-semitism and antigay speech. J. Soc. Issues 2002, 58, 341–361. [Google Scholar] [CrossRef]
  43. Dharmapala, D.; McAdams, R.H. Words that kill? An economic model of the influence of speech on behavior (with particular reference to hate speech). J. Leg. Stud. 2005, 34, 93–136. [Google Scholar] [CrossRef]
  44. Liu, P.; Guberman, J.; Hemphill, L.; Culotta, A. Forecasting the presence and intensity of hostility on Instagram using linguistic and social features. In Proceedings of the International AAAI Conference on Web and Social Media, Palo Alto, CA, USA, 25–28 June 2018; Volume 12. [Google Scholar]
  45. Hrdina, M. Identity, activism and hatred: Hate speech against migrants on Facebook in the Czech Republic in 2015. Nase Spol. 2016, 1. [Google Scholar] [CrossRef]
  46. Wright, L.; Ruths, D.; Dillon, K.P.; Saleem, H.M.; Benesch, S. Vectors for counterspeech on twitter. In Proceedings of the First Workshop on Abusive Language Online, Vancouver, BC, Canada, 4 August 2017; pp. 57–62. [Google Scholar]
  47. Miškolci, J.; Kováčová, L.; Rigová, E. Countering hate speech on Facebook: The case of the Roma minority in Slovakia. Soc. Sci. Comput. Rev. 2020, 38, 128–146. [Google Scholar] [CrossRef]
  48. Schieb, C.; Preuss, M. Governing hate speech by means of counterspeech on Facebook. In Proceedings of the 66th Ica Annual Conference, Fukuoka, Japan, 9–13 June 2016; pp. 1–23. [Google Scholar]
  49. De Franco, M. #DecidimFest 2019: Strategies and Alliances to Curb Hate and Fear in a Polarized World. 2020. Available online: https://meta.decidim.org/conferences/decidimfest2020/f/1390/meetings/1453 (accessed on 19 November 2020).
  50. Fruchterman, T.M.; Reingold, E.M. Graph drawing by force-directed placement. Softw. Pract. Exp. 1991, 21, 1129–1164. [Google Scholar] [CrossRef]
  51. Aluru, S.S.; Mathew, B.; Saha, P.; Mukherjee, A. Deep Learning Models for Multilingual Hate Speech Detection. arXiv 2020, arXiv:2004.06465. [Google Scholar]
Figure 1. Hate core: Densely connected hateful users (red nodes) within the overall network mostly formed by normal users (black nodes).
Applsci 11 12003 g001
Figure 2. Gamma distribution Γ ( α = 10 , λ = 25 ) with the mean value μ = 0.4 used to sample hate score values for new users who join the simulated social network.
Applsci 11 12003 g002
Figure 3. Hate strains (zoom): Hate core disseminating hatred in red strains to nodes with lesser network density.
Applsci 11 12003 g003
Figure 4. Representation of the network during the growth phase. Blue circles represent normal users, red circles correspond to hateful users. Arrows signal influence relations.
Applsci 11 12003 g004
Figure 5. Alternative hate score probability distributions modelled with Γ ( α , λ ) distribution.
Applsci 11 12003 g005
Figure 6. Threshold for accepting foreign opinion subject to the user’s hate score.
Applsci 11 12003 g006
Figure 7. Representation of the network during the opinion diffusion by content. Blue and red dots represent content originally authored by normal and hateful users, respectively. In the center we can clearly see a densely connected hateful network component, which is infecting an influential normal user with hateful content. Infected influential users serves then as a proxy to spread content.
Applsci 11 12003 g007
Figure 8. Effects of the education as countermeasure for different network sizes (0, 500, 1000, 2000, 5000) and depending on the α parameter of the Gamma distributions as shown in Figure 5: (Top) fraction of hateful users; (Middle) fraction of hateful posts; (Bottom) ratio of network densities of hateful to normal users.
Applsci 11 12003 g008
Figure 9. Effects of deferring hateful content as countermeasure for different network sizes (0, 500, 1000, 2000, 5000) and depending on p d e f e r , the probability of deferring hateful posts: (Top) fraction of hateful users; (Middle) fraction of hateful posts; (Bottom) fraction of swaps to a hateful society.
Applsci 11 12003 g009
Figure 10. Effects of counter activists as countermeasure for different network sizes (0, 500, 1000, 2000, 5000) and for the five different setups from Table 2: (Top) fraction of hateful users; (Middle) mean hate score; (Bottom) mean path length of activists’ posts.
Applsci 11 12003 g010
Table 1. Simulation metrics for network growth with opinion diffusion by content. Diffusion dynamics are carried out for further 1000 ticks after starting. H and N stand for hateful and normal users, respectively. Red numbers in reciprocity rows signal values whose relation to each other is different than reported in the literature, whereas the remaining black numbers correspond to those similar to the reported values.
MetricOpinion Diffusion Starts after t Ticks
0500100020005000
Fraction of H users0.0240.0270.0390.0480.062
Fraction of posts by H0.2100.2560.3200.3610.429
Ratio network density H/N79.13079.60558.11663.55026.061
Reciprocity between N0.8880.8860.8880.8870.889
Reciprocity between H0.7250.7510.7360.7580.761
Mean followers of N1.7831.7741.7721.7701.765
Mean followers of H2.3122.6262.3822.4502.263
Mean followees of N1.7881.7841.7841.7841.780
Mean followees of H2.3112.3832.1552.1442.025
Mean follower/followee of N0.8840.8800.8830.8780.878
Mean follower/followee of H0.7630.8260.8800.8150.784
Mean path length N posts0.6990.6930.7060.7040.705
Mean path length H posts1.7382.1482.2742.3572.627
Table 2. Experiment settings for activists’ countermeasure.
Experiment Setup
# 1# 2# 3# 4# 5
Convincing probability p c o n v i n c e 0.010.010.040.010.01
Additional connections to other activists c a 12122
Fixed opinion (stubbornness)falsefalsefalsetruetrue
Select activists by their influencefalsefalsefalsefalsetrue
Publisher’s Note: MDPI stays neutral with regard to jurisdictional claims in published maps and institutional affiliations.

