Article

Real-Time Remote Sensing of the Lobesia botrana Moth Using a Wireless Acoustic Detection Sensor

1
School of Electrical Engineering, Pontificia Universidad Católica de Valparaíso, Av. Brasil 2147, Valparaíso 2362804, Chile
2
Joint Department of Biomedical Engineering, University of North Carolina at Chapel Hill, North Carolina State University, 9212A Mary Ellen Jones Building, 116 Manning Drive, Chapel Hill, NC 27599, USA
3
Fundación Para el Desarrollo Frutícola, Los Coigües 651, Quilicura 8730639, Chile
*
Author to whom correspondence should be addressed.
Appl. Sci. 2021, 11(24), 11889; https://doi.org/10.3390/app112411889
Submission received: 15 November 2021 / Revised: 2 December 2021 / Accepted: 3 December 2021 / Published: 14 December 2021

Abstract

:
This article presents a wireless sensor for pest detection, specifically the Lobesia botrana moth or vineyard moth. The wireless sensor consists of an acoustic-based detection of the sound generated by a flying Lobesia botrana moth. Once a Lobesia botrana moth is detected, the information about the time, geographical location of the sensor and the number of detection events is sent to a server that gathers the detection statistics in real-time. To detect the Lobesia botrana, its acoustic signal was previously characterized in a controlled environment, obtaining its power spectral density for the acoustic filter design. The sensor is tested in a controlled laboratory environment where the detection of the flying moths is successfully achieved in the presence of all types of environmental noises. Finally, the sensor is installed on a vineyard in a region where the moth has already been detected. The device is able to detect flying Lobesia botrana moths during its flying period, giving results that agree with traditional field traps.

1. Introduction

In the last years, sustainable and smart agriculture has been an important issue in worldwide research. The Food and Agriculture Organization (FAO) defines on its perspectives for the year 2030 that the use of technologies such as integrated pest and nutrient management, conservation agriculture and organic agriculture could contribute to making agriculture more sustainable [1]. On the other hand, ONU directives for sustainability puts an important objective into the optimization of the resources used in agriculture [2,3]. In order to achieve those goals, the implementation of smart farming in terms of introducing technology to improve different agricultural processes has been pointed out as a key aspect [4,5].
When we talk about sustainability and the optimization of resources, pest management is one of the critical issues. On this perspective, the use of technology to detect and control pests will play an important role at the time of pesticide applications, reducing its indiscriminate use and, in that way, reducing the negative environmental and health effects [1,6]. This has led to many studies that use different technologies in order to identify insects or to achieve an early detection of a possible pest in different fruit and vegetables [7,8]. Pest control and management using technology is, therefore, an important decision making and action-oriented tool. In particular, the Chilean government has placed smart agriculture under its priority foci of development through a smart industry program [9] for the years between 2017 and 2025.
Chile is well known for its wine and grape production. For this reason, pest management and control of this industry could have an important impact for the production. In the last years, a new pest—the Lobesia botrana or grapevine or vineyard moth—has been detected on Chilean soil [10]. Lobesia botrana is a pest of economic importance in vineyards, which can cause damage to flowers and developing grapes [11,12,13]. Therefore, the Chilean government, through its Ministry of Agriculture, has put this pest under a special plan of surveillance, control and quarantine, encouraging strategies for its late detection and eradication [14].
Currently, traditional in-field insect traps are used for the early detection and monitoring of the grapevine moth pest on vineyards [14]. The use of these traps has a significant cost in terms of the people involved for installation and counting as well as decision making. For example, the use of this traditional method can imply a late application of insecticides due to the late detection of the reproductive peak of the insect, which can harm the production. In order to make the detection autonomous, several studies have been developed in the last years. Different techniques such as image processing-based detection [15,16,17,18,19,20], capacitive sensors [21,22], radar techniques [23], optoelectronics [24], electrophysiological signals [25] and acoustic- and optoacoustic-based detection methods [26,27,28,29,30,31] have been proposed and tested in the field. Nevertheless, most of these technologies use post-processing in order to detect the pest and only a few of them use real-time processing of the information acquired and energy optimization for field conditions [21,22,32,33]. The use of remote sensing using a wireless sensor in the field and real-time processing could save significant time and costs as well as improving decision making in terms of the pesticide used (quantity and period of application). For the case of flying insect pests, the location, time, movement and weather conditions of the field at the moment of sensing are also important statistical information in order to understand the behavior and propagation of the pest. Under this perspective, the aim of this article is to present a real-time remote sensing of Lobesia botrana using a wireless acoustic detection sensor with a matched filter where the novelty relies on an operational in-field acoustic detection of the Lobesia botrana through a matched filter obtained with previous acoustic measurements and neural networks for the flying acoustic signal of the moth.

2. Materials and Methods

From the several methods proposed in the literature for pest detection, an acoustic-based detection method was chosen to be implemented on a wireless sensor. This type of solution was preferred because it did not require illumination conditions (Lobesia botrana is known for its crepuscular behavior [34]), image processing or the sending of a large amount of data to a server in order for the server to determine if there was detection or not. The acoustic detection proposed for this sensor was via the previous characterization of the flying acoustic spectral signature of the moth to generate a filter that matched this signature and to recognize if there was a flying Lobesia botrana near to the sensor.
The acoustic signal of flying insects has been a topic of several studies [35,36]. Flying insects have characteristic sounds in the spectrum, most commonly described by a low frequency sound produced by the wing fluttering and a higher frequency sound produced by the contact of wings during the fluttering [37,38]. These sounds are then specifically matched to each species in that the sound frequency, harmonic behavior and temporal duration depend on the physical characteristic of the flying insect (i.e., wing size, insect size). Nevertheless, this moth has not been previously characterized in the literature in terms of its acoustic signature. As the possible acoustic signature was unknown for the authors, it was necessary to obtain the sounds produced or emitted by the moth in a wide range spectrum.
The proposed sensing method consisted of generating a specific filter to obtain the signal coming from the Lobesia botrana moth. To characterize the filter band, many experiments were performed in a controlled laboratory environment, recording audio signals with different quantities of moths and comparing the resulting measured signals with a case without moths on the system as the control. Finally, temporal and spectral analyses were performed in order to obtain the acoustic signature.

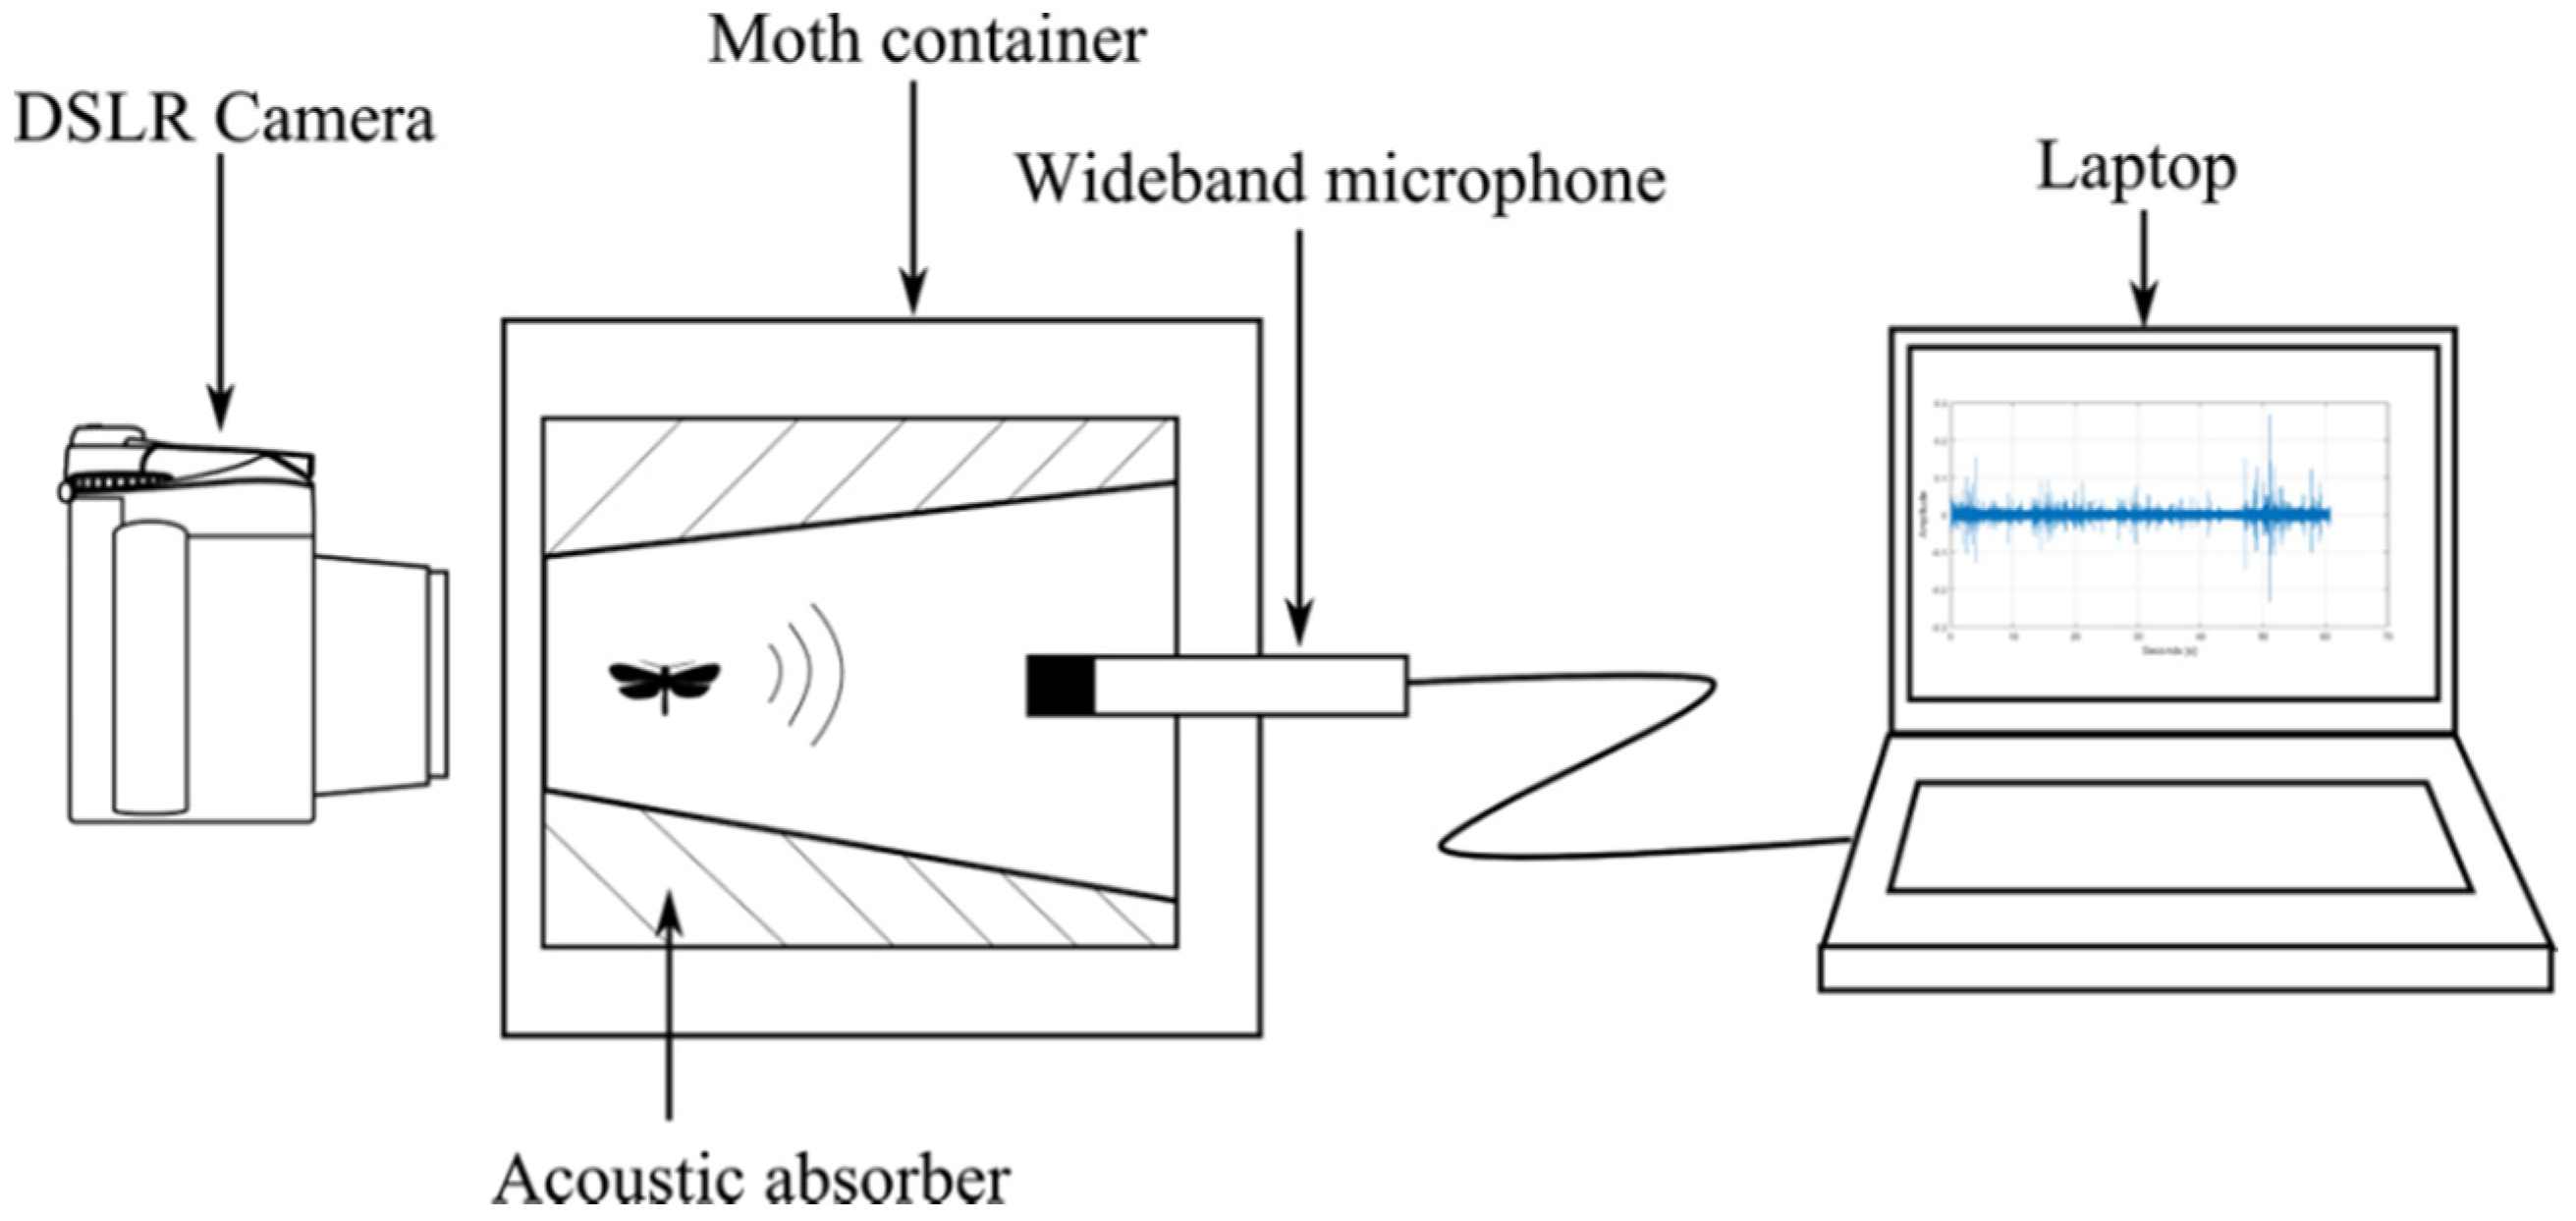
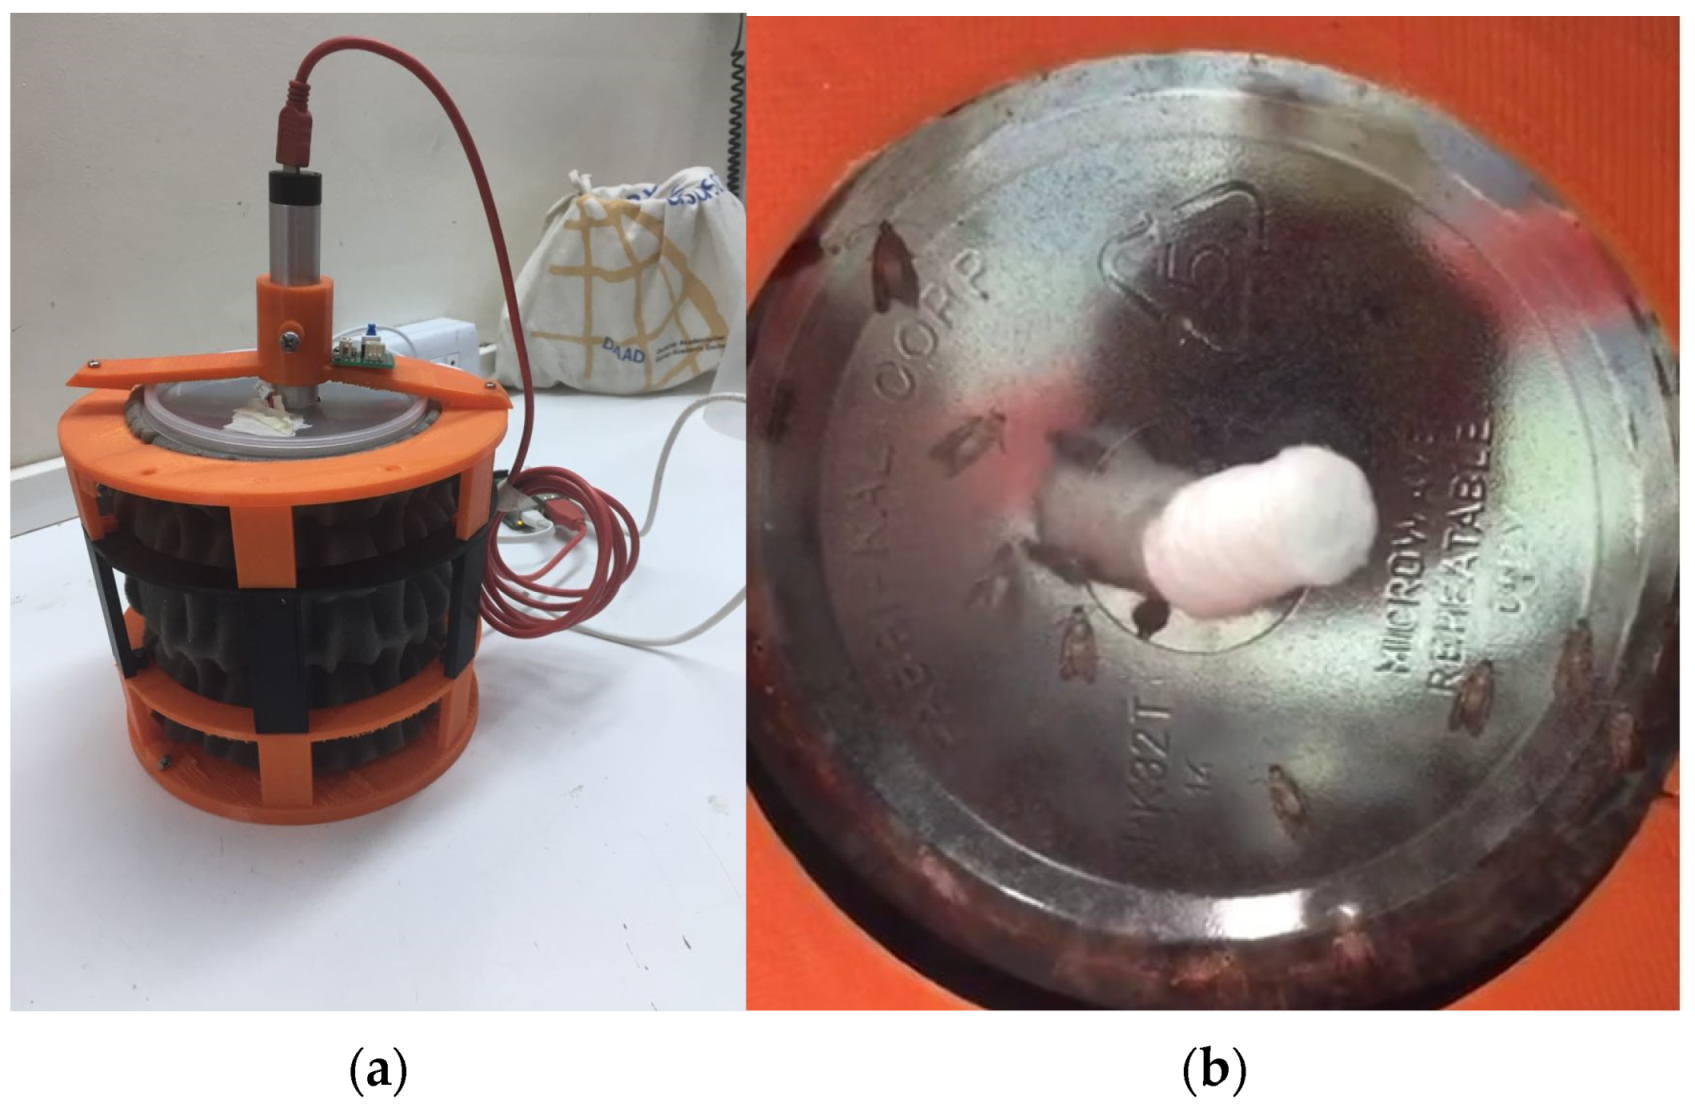
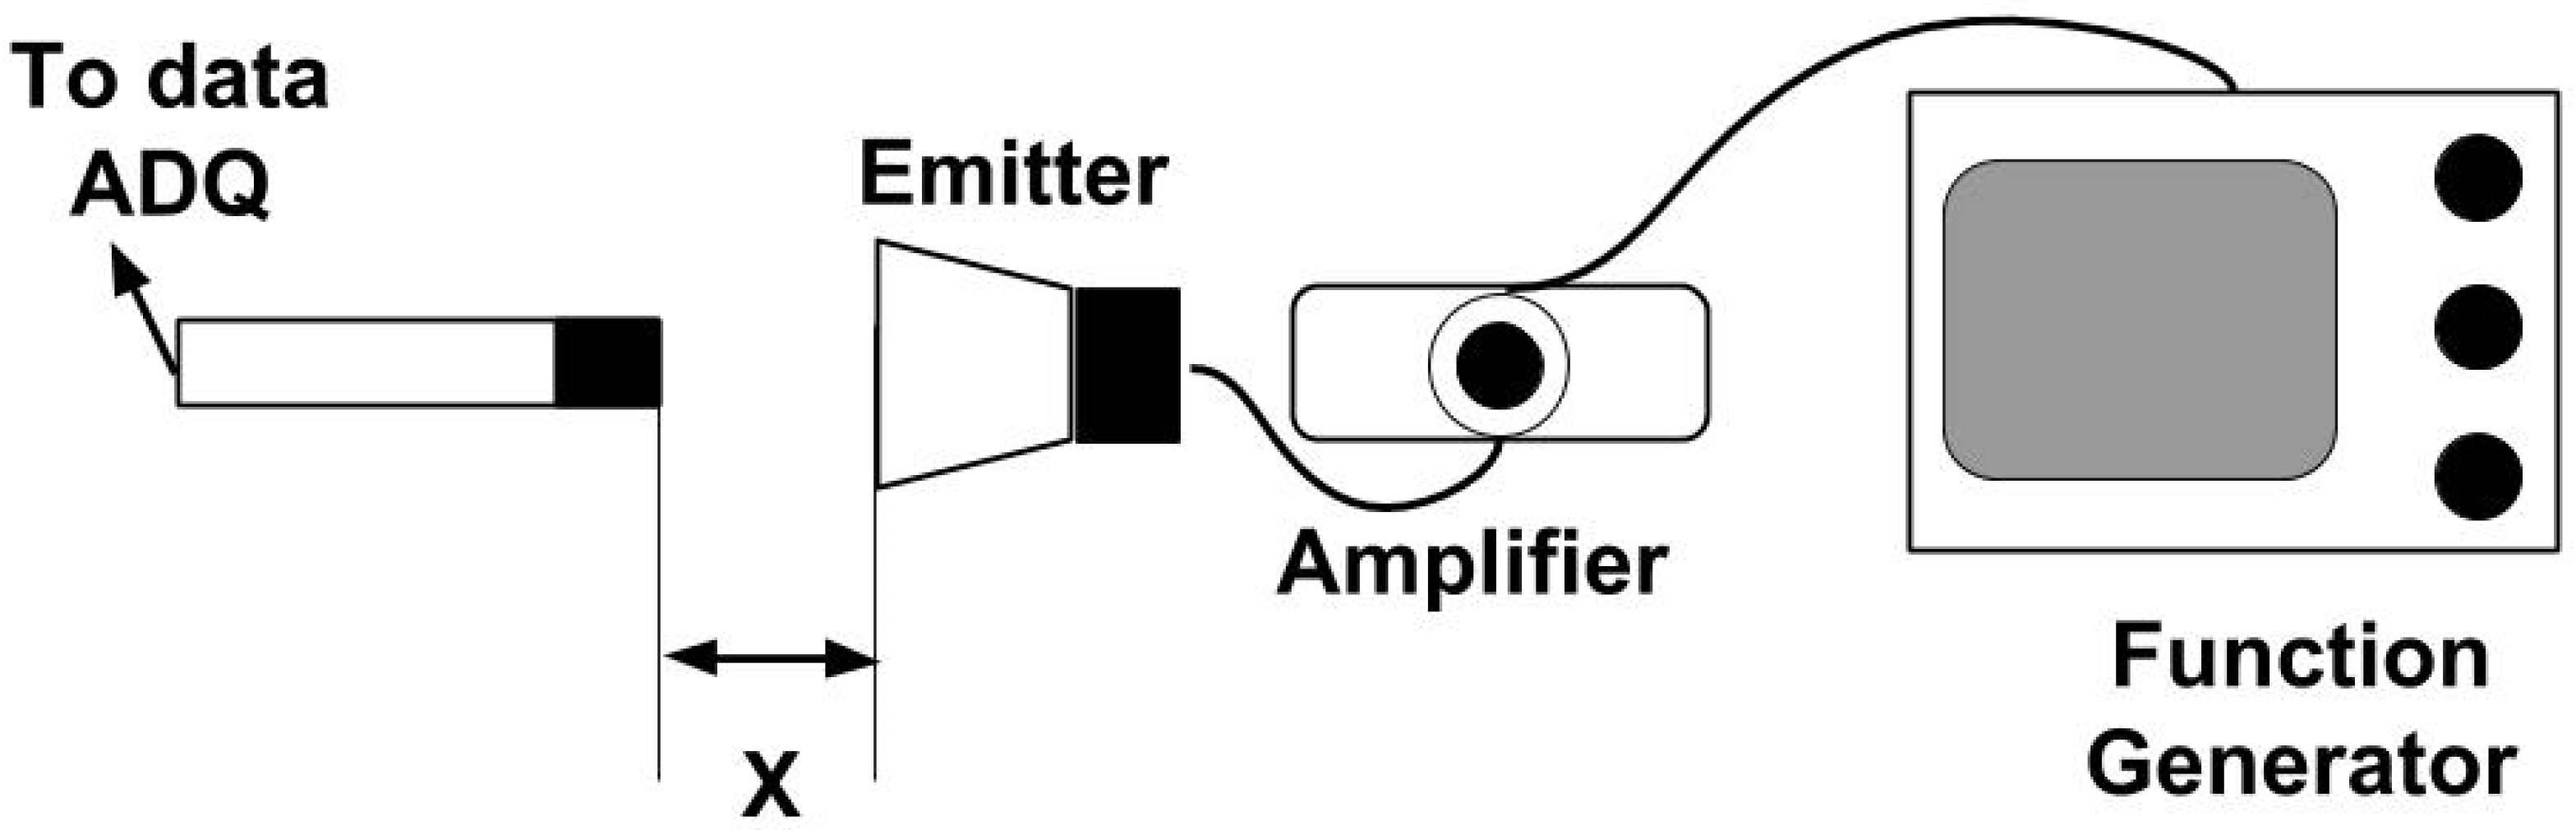
2.1. Experimental Setup and Sound Recordings

At the research center, the Fundación para el Desarrollo Frutícola (FDF: Foundation for Fruit Development) has several laboratories where research is performed with insects that are a threat to Chilean agriculture. They have the facilities for breeding Lobesia botrana in its different growth states. All the tracks of the sound emission of the Lobesia botrana were recorded at the FDF. A schematic for the experimental setup used for recording the Lobesia botrana flight is shown in Figure 1. A special device was constructed for the recording of the sound (see Figure 2) using a 3D printer. The device held the plastic container used at the FDF to carry the insects. The container was surrounded by acoustic absorbing foam to reduce the noise from external sources. It held a wideband microphone, which could record frequencies from 100 Hz to 125 kHz (in Figure 2, the microphone is the upper vertical tube). The wideband microphone was chosen to record the acoustic response of the flying moth without knowing beforehand where this signal would appear on the spectrum. The container also had bright LEDs to illuminate the inside for pictures and video recordings of the moths. With it, the sound events could be associated with the flight of the moths. For this experiment, the sound of the flying Lobesia botrana was recorded using Audacity [39], which is free audio recorder software, running on a laptop.
Figure 3 shows examples of the signals obtained using our acquisition setup. Figure 3a shows the signal obtained from the container without moths inside and Figure 3b shows the acoustic signal obtained from the moths. From the obtained signals, it was possible to observe that the sound of the moths was impulsive, showing peaks at different instants of time. To characterize signals with registers of the impulsive type, the Welch PSD tool is commonly used to calculate the power spectral density (PSD). As our temporal signal registers had different durations, the Welch PSD allowed our method to work better than other methods for averaging the periodograms calculated from the Fourier transform (FFT). In this particular case, the Welch PSD was implemented using Matlab R016a. By analyzing the variations that existed in different frequency ranges resulting from the moth acoustic signals (time signals), it was possible to design a filter to characterize the sound.

2.2. Filter Design Procedure
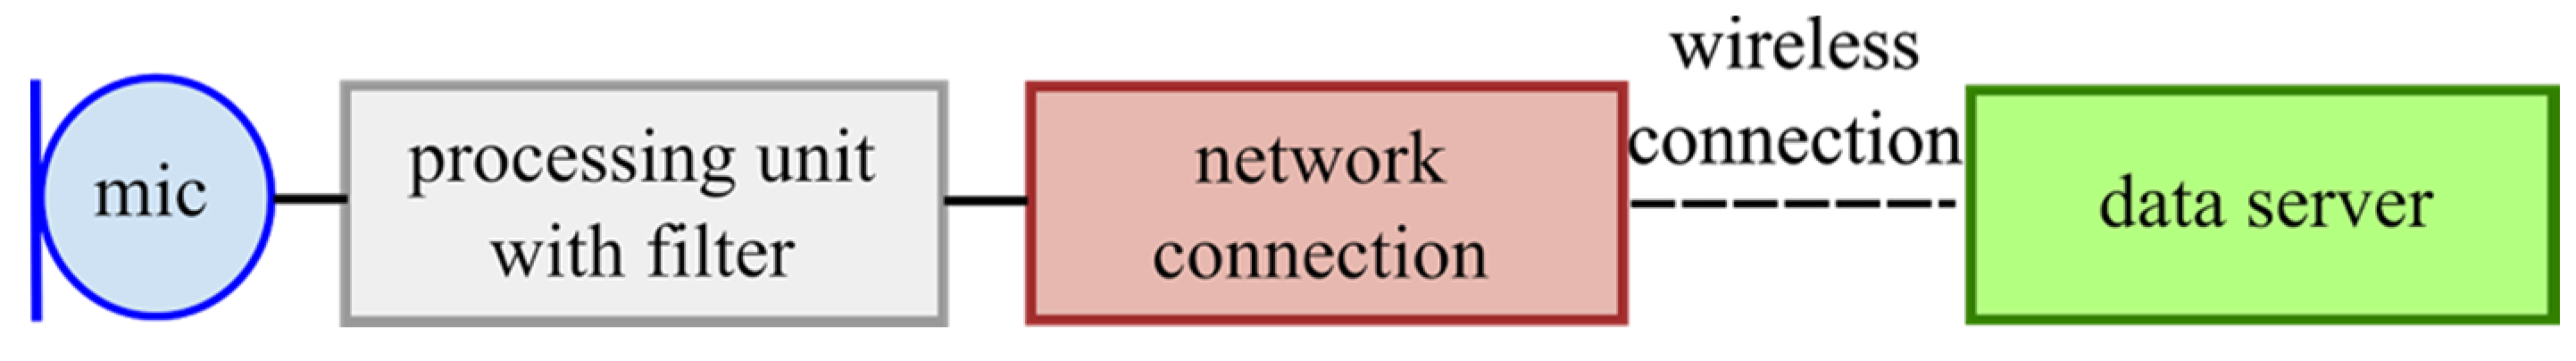
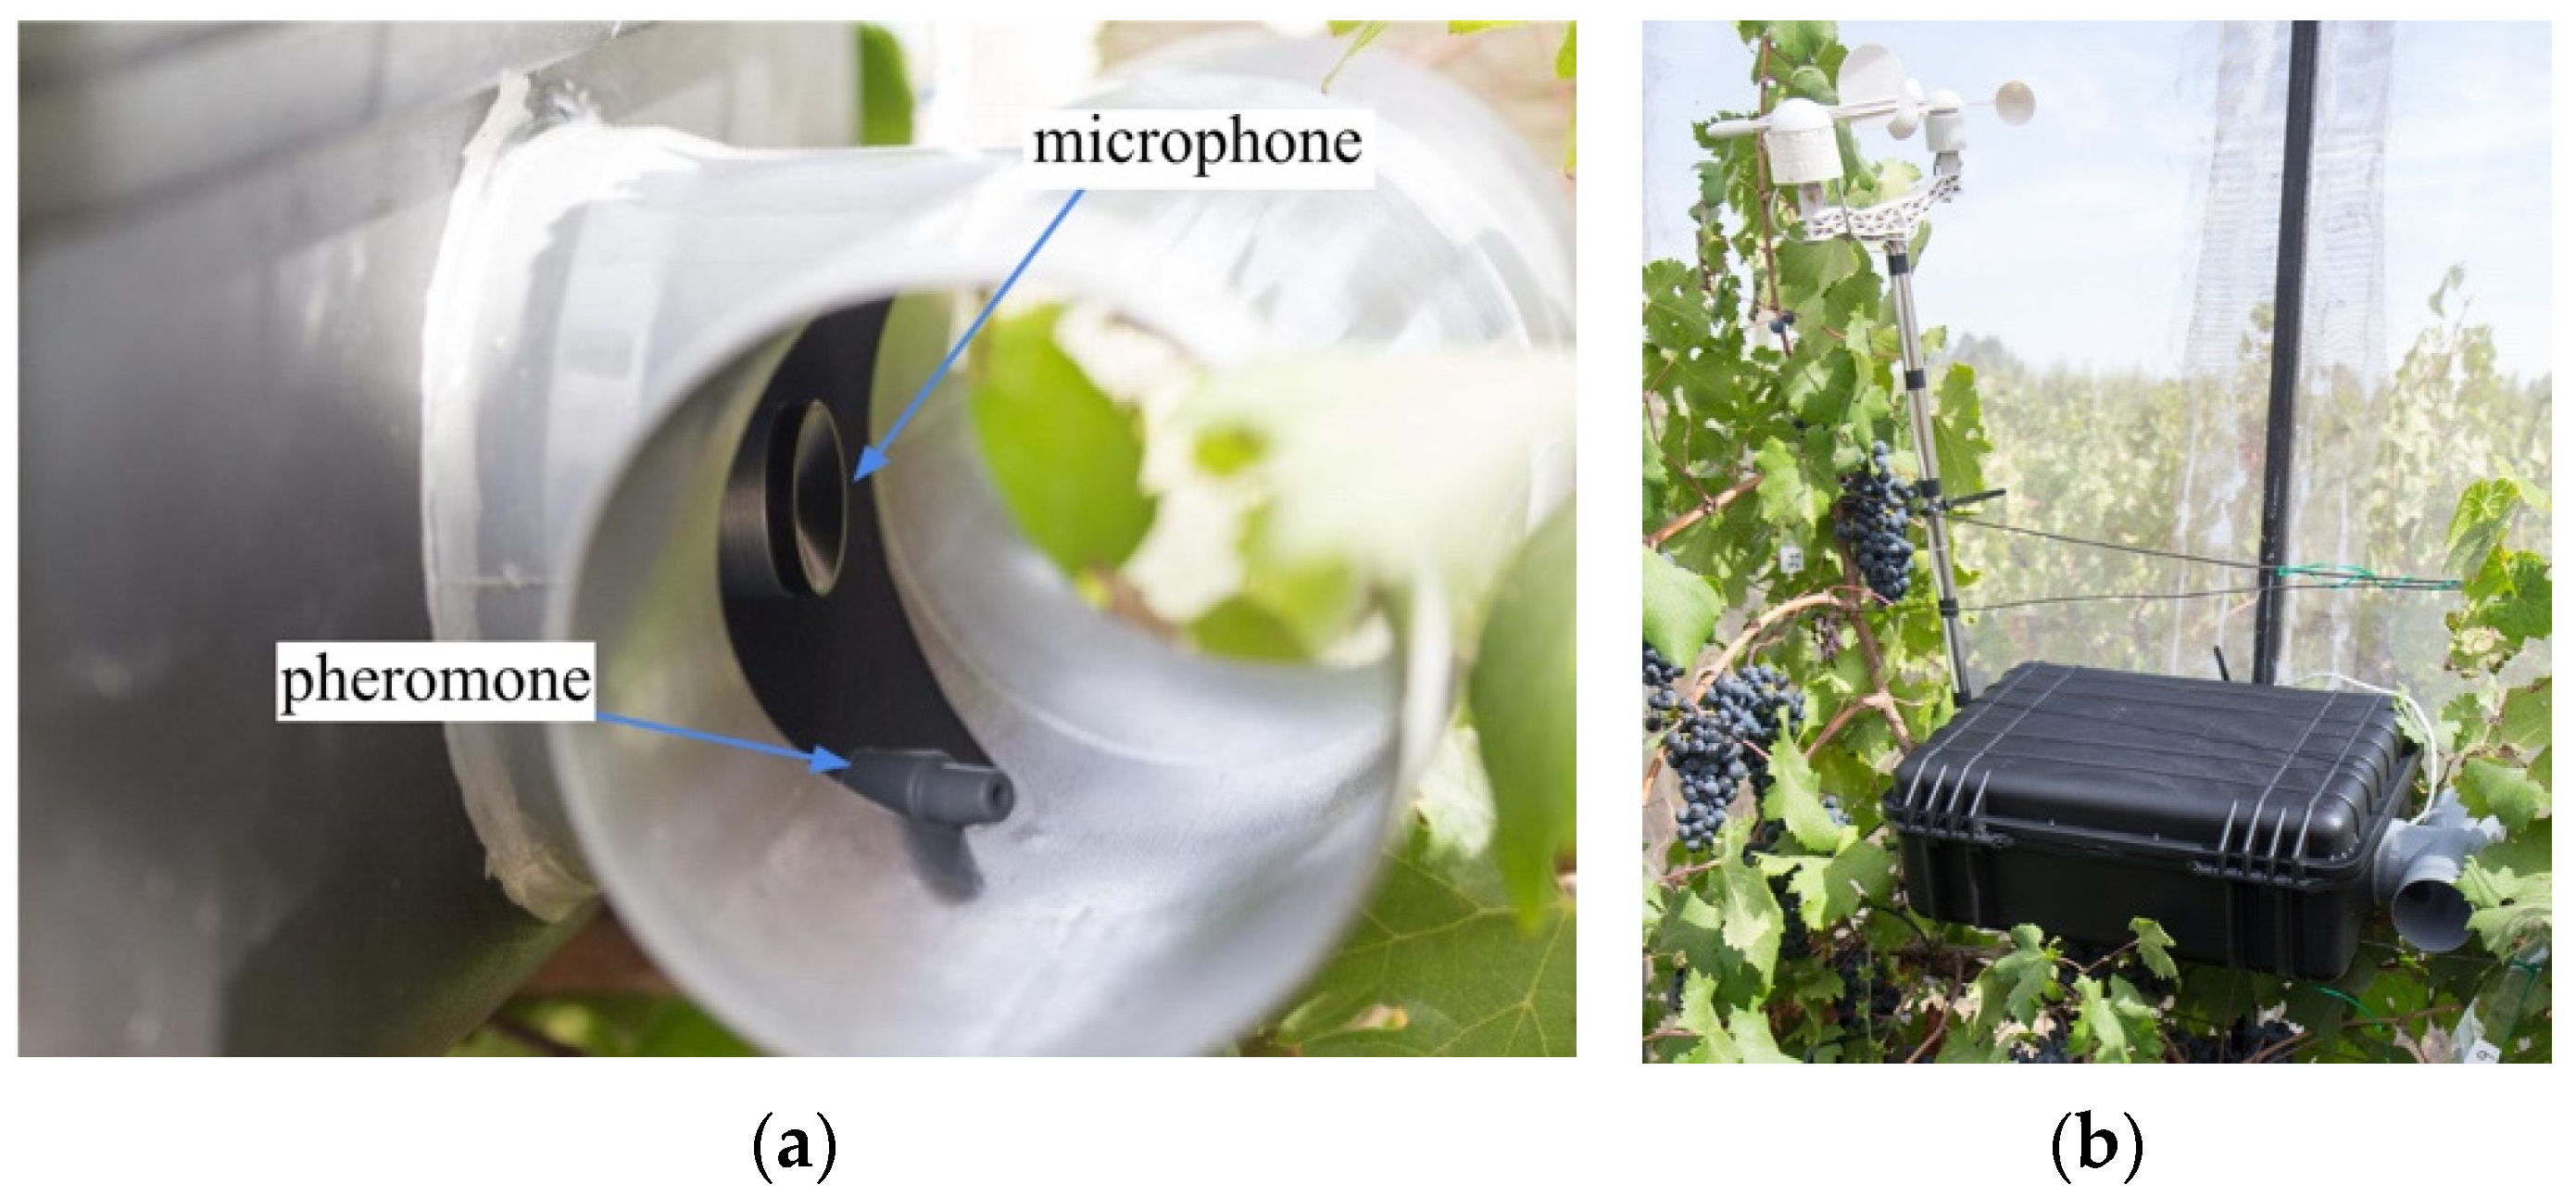
The Welch PSD [40,41] allowed us to estimate the power of a signal at different frequencies using periodogram spectrum estimates, converting the time signal to the frequency domain. Welch’s method computes a modified periodogram for each segment and then averages these estimates to produce the estimate of the power spectral density. Welch’s method uses PSD estimates of different segments of the time series; the modified periodograms represent approximately uncorrelated estimates of the true PSD and averaging reduces the variability. The segments are typically multiplied by a Hamming window so that Welch’s method amounts to averaging the modified periodograms. The segments are partly overlapped; this guards against the loss of information caused by windowing.
In our implementation, the sample rate was 250 kHz and the signals had different durations (around 2,500,000 samples each). To obtain the Welch’s overlapped segment averaging, the PSD estimate of the signal used a segment length of 32,768 samples with 16,384 overlapped samples.
To design the filter, it was necessary to know the behavior of the signals that characterized the sound produced by the moth. The first step in measuring the moth signals was to characterize the container where the moths were placed. Figure 4 shows the PSD obtained from the container without moths. The first thing we observed were the peaks, which stood out at around 20 dB from the background level. The peaks of that prominence were a product of periodic signals with a constant frequency. This is mainly the case for electromagnetic interference and harmonics produced by electric power lines, fluorescent lamps, analog or digital electronic components of power amplifying and communication circuits of microphones. As this was a reference signal for our experiments, all these effects were not considered in the signal comparison.
In addition to the peaks, it was also interesting to notice that the background curve was not flat; it has a resonance at around 50 kHz. This non-flat course corresponded with the shape of the internal noise of the microphone, as presented by the manufacturer of the MEMS microphone [42].
The process continued by entering different numbers of moths into the container. In our experiment, we used a different number of moths in the container (varying from 1 to 50). Two cases are shown in Figure 5 and Figure 6. In addition, the experiment was repeatedly performed and replicated over several days; therefore, an experimental signal database was built with the information of the flying moths under laboratory conditions. The PSDs obtained for the containers with 8 and 50 moths are shown in Figure 5 and Figure 6, respectively. On each figure, a reference PSD was added (in a red color) that corresponded with the container without moths (as shown in Figure 4). Figure 5a shows the moth signal recorded as produced by 8 moths inside the container and Figure 5b shows its respective PSD. Similarly, Figure 6a shows the signal captured when there were 50 moths in the container and Figure 6b represents its PSD. Note the increase in the PSD amplitude (around 10 dB) when there were moths inside the container compared with the reference (the container without moths) at frequencies between 6 kHz and 30 kHz.
From the two figures (Figure 5 and Figure 6), it was possible to observe an increase in the amplitude of the PSDs in the frequency ranges between 6 kHz and 12 kHz and between 18 kHz and 30 kHz. Applying the PSD to several signals obtained from the moths always produced variations in the amplitude in ranges close to 8 kHz and 20 kHz. In this way, it was chosen to define two bandpass filters centered at frequencies of 8 kHz and 23 kHz, respectively. The final filter is presented in Figure 7. Figure 8 shows the filter response by using a flying Lobesia botrana signal (Figure 8). In Figure 8b, it is possible to observe how the response of the designed filter varied, increasing its amplitude (peak in frequency) at around 10 dB as a product of the acoustic signal of the Lobesia botrana.

2.3. Sensor

In this section, the particular setup used in laboratory and field experiments will be presented. The sensor consisted of four main parts: a microphone, a processing unit with an acoustic filter (a Lobesia botrana matched filter) for the moth detection, a network connection unit and a data server. A block diagram of the wireless sensor is presented in Figure 9. To attract the moth to the sensing unit, a pheromone was used.
Figure 10 shows the pseudo-code implemented in the processing unit that allowed the explanation of the process of acquisition of the signal and the sending of the message. The sensor worked as follows: the microphone acquired the acoustic signal emitted by a flying moth flying near to the sensor. The received signal went to a processing unit (via a USB) with an acoustic filter that matched the acoustic signature of a flying Lobesia botrana, which was obtained before. Finally, if the received acoustic signal matched the filter, the data were sent through a network connection to a data server where the data of the number of moths were counted and the time and sensor ID were stored and displayed.

2.3.1. Microphone

Microphones are devices that convert sound waves into electric signals. As presented in [36], moths (Lobesia botrana was not included in that work) have the capability of producing and emitting sounds in a broad spectrum including a human audible range (20 Hz–20 kHz), going as high as 120 kHz. For moth detection, it is necessary to have a microphone that has a broad frequency range to include the sound produced by the insect but it is not less important to have a flat frequency response, as in music or voice recording, or at least a known frequency response. The Ultramic 250 k from Dodotronic [43] is based on a MEMS (micro-electro-mechanical systems) sensor and delivers data over a USB connection. It was chosen because it was capable of registering sound from a low frequency to 125 kHz, thus including the frequency range of different moths. This microphone is directly recognized as a sound recording device on most computer platforms including many smartphones, making it ideal for use with different systems as needed (testing, calibrating, filter matching, field use). This microphone also integrates a preamplifier and an A/D converter unit for the received signal.

2.3.2. Processing Unit

Due the aforementioned development steps (initial testing, laboratory tests and filter matching as well as a field test), a Raspberry Pi was chosen as the processing unit because it is small, powerful, easy to configure and not energy hungry. It had been previously used together with an Ultramic 250 k microphone in a bat recording project [44]. The model used was the Raspberry Pi 2. The Raspberry Pi is a single-board computer consisting of an ARM processor, USB and ethernet connectors, HDMI out and an SD Card reader, which holds a Linux OS.
The system is capable of processing the input acoustic signal in real-time; thus, it could be used to filter and detect thresholds (Figure 10). The principal part of the detection algorithm was configured using Linux’s SoX-Sound eXchange version 14.4.2 [45].
For each event (moth detection), the system created a resulting audio file (the acoustic signal of the moth). A cron-job (configurable recurrent process) defined on the operating system checked the creation of new audio files each minute. In a positive case, the unit connected to the database server and upgraded the event counter for the individual sensing unit.

2.3.3. Network Connection

There are many options to connect a Raspberry Pi to the internet. In this case, we used a battery-powered portable router with an access point (AP) from TP-LINK, model TL-MR3040. It provided internet access to the connected devices through an existent AP or through using a SIM Card. Under normal circumstances, only very low data are used.

2.3.4. Data Server

The server had a microservice architecture running MySQL and Java. Every time the processing unit registered an event, it pushed the information to the server. A so-called heartbeat message, an ID and an IP address to access the device remotely was sent every time the system was powered on and a “counter + 1” message was sent after an acoustic detection.

3. Results

To obtain a high confidence of the detection and counting results, a three step validation process was performed: (i) a validation in controlled conditions (laboratory); (ii) a simulated moth validation; and (iii) a field validation. As presented before, the sound characteristic of the Lobesia botrana was obtained in previous experiments.

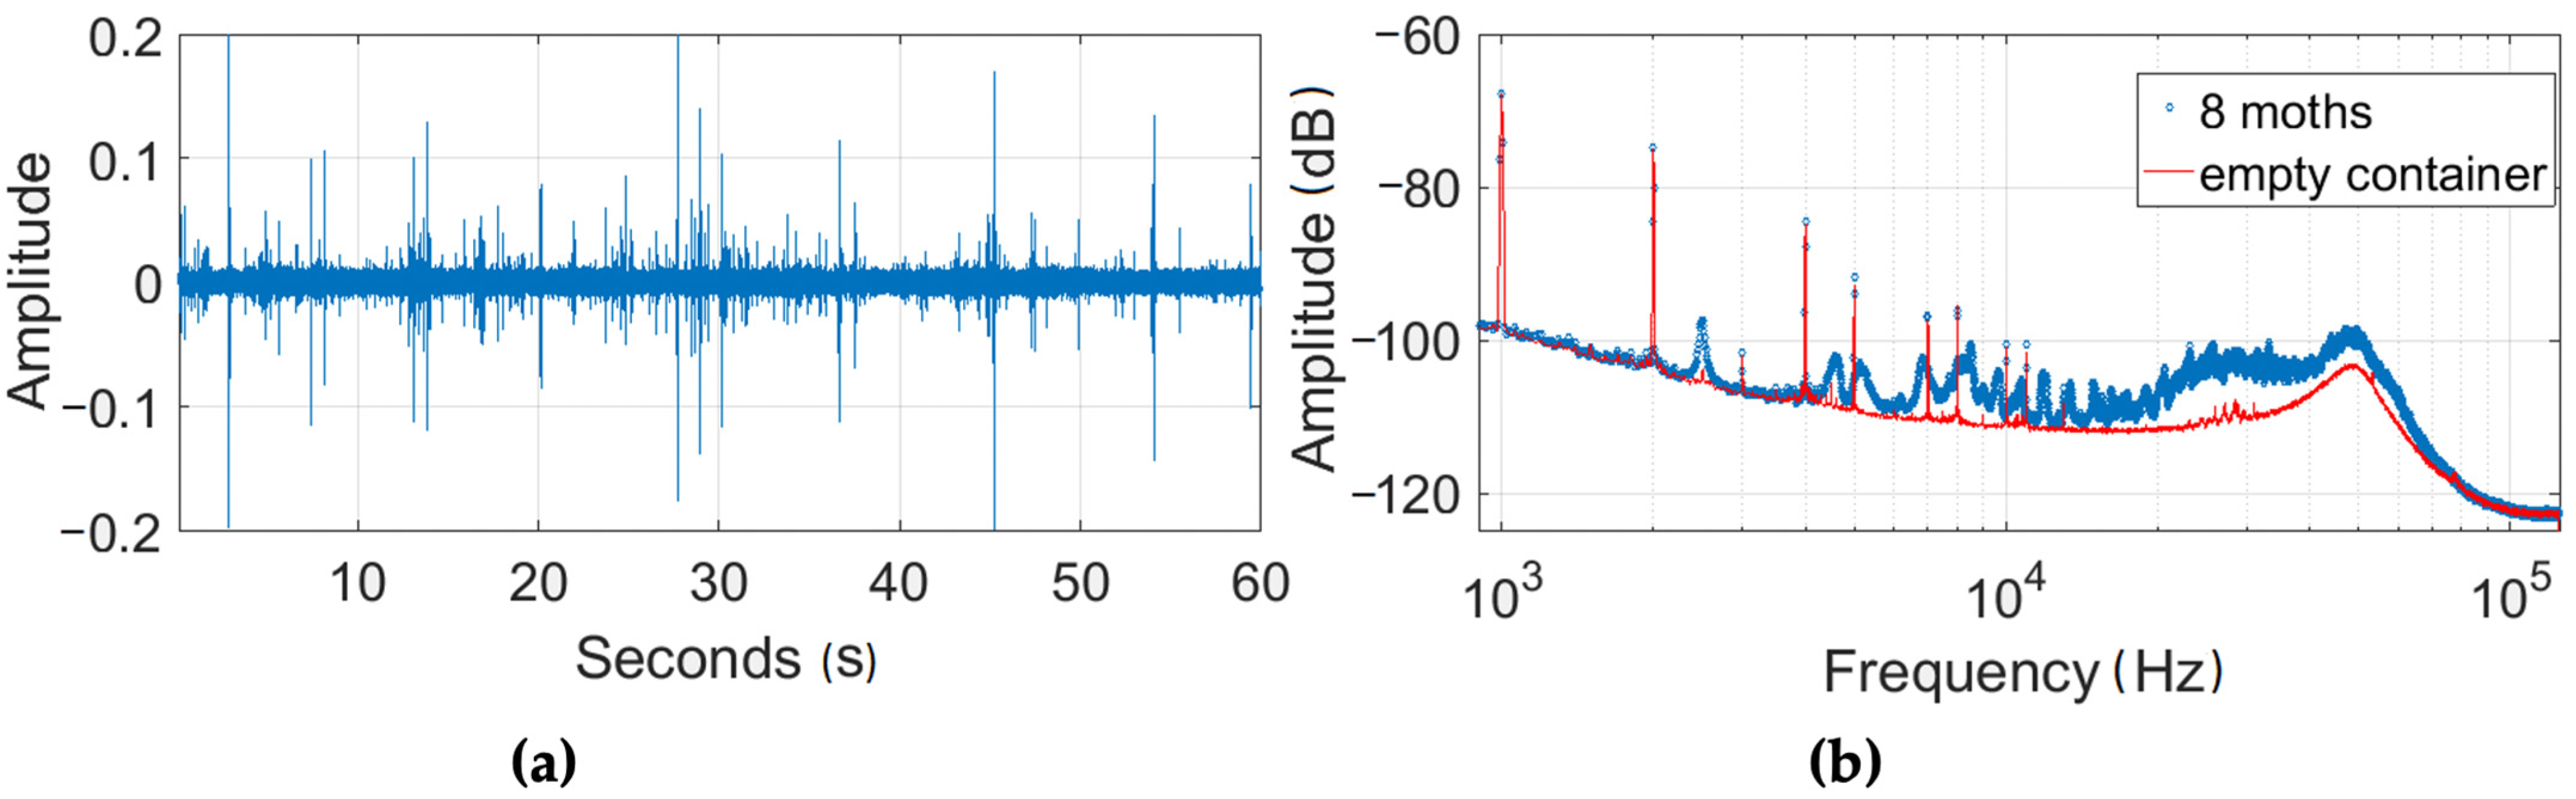
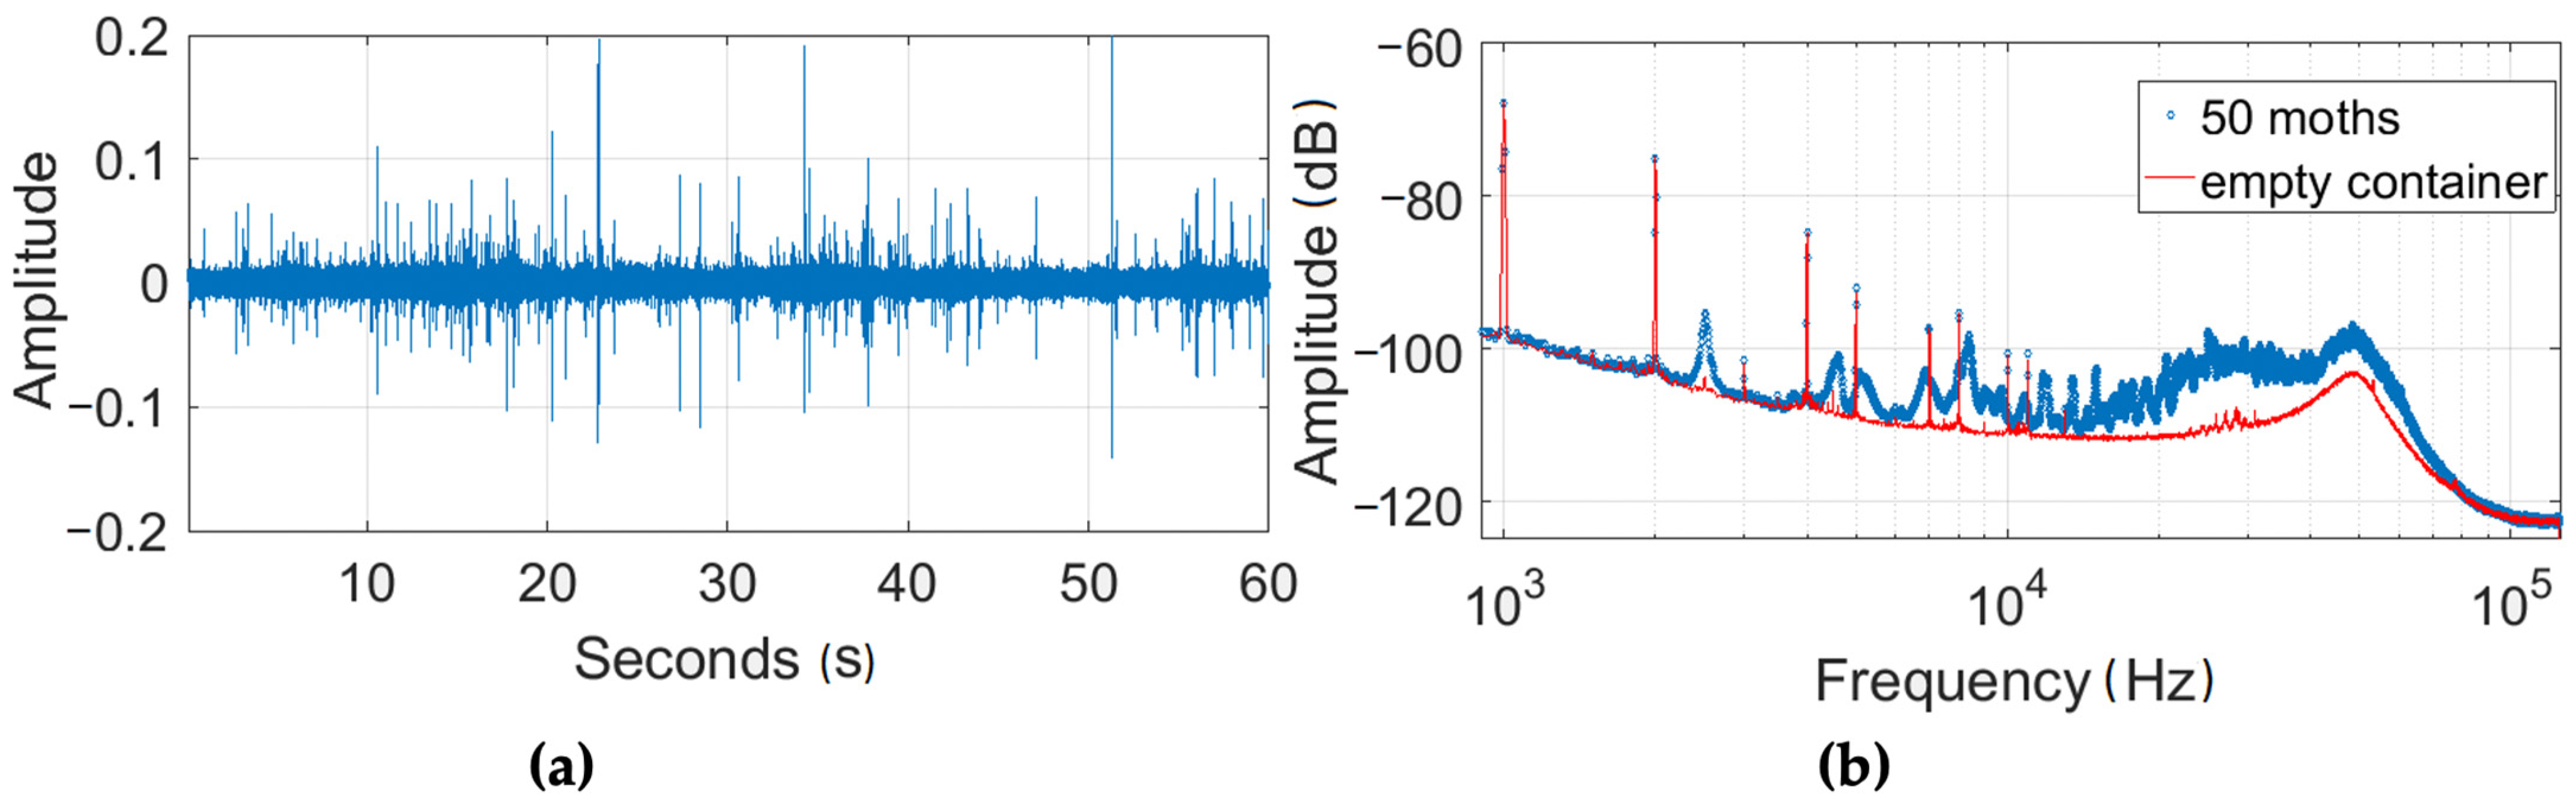
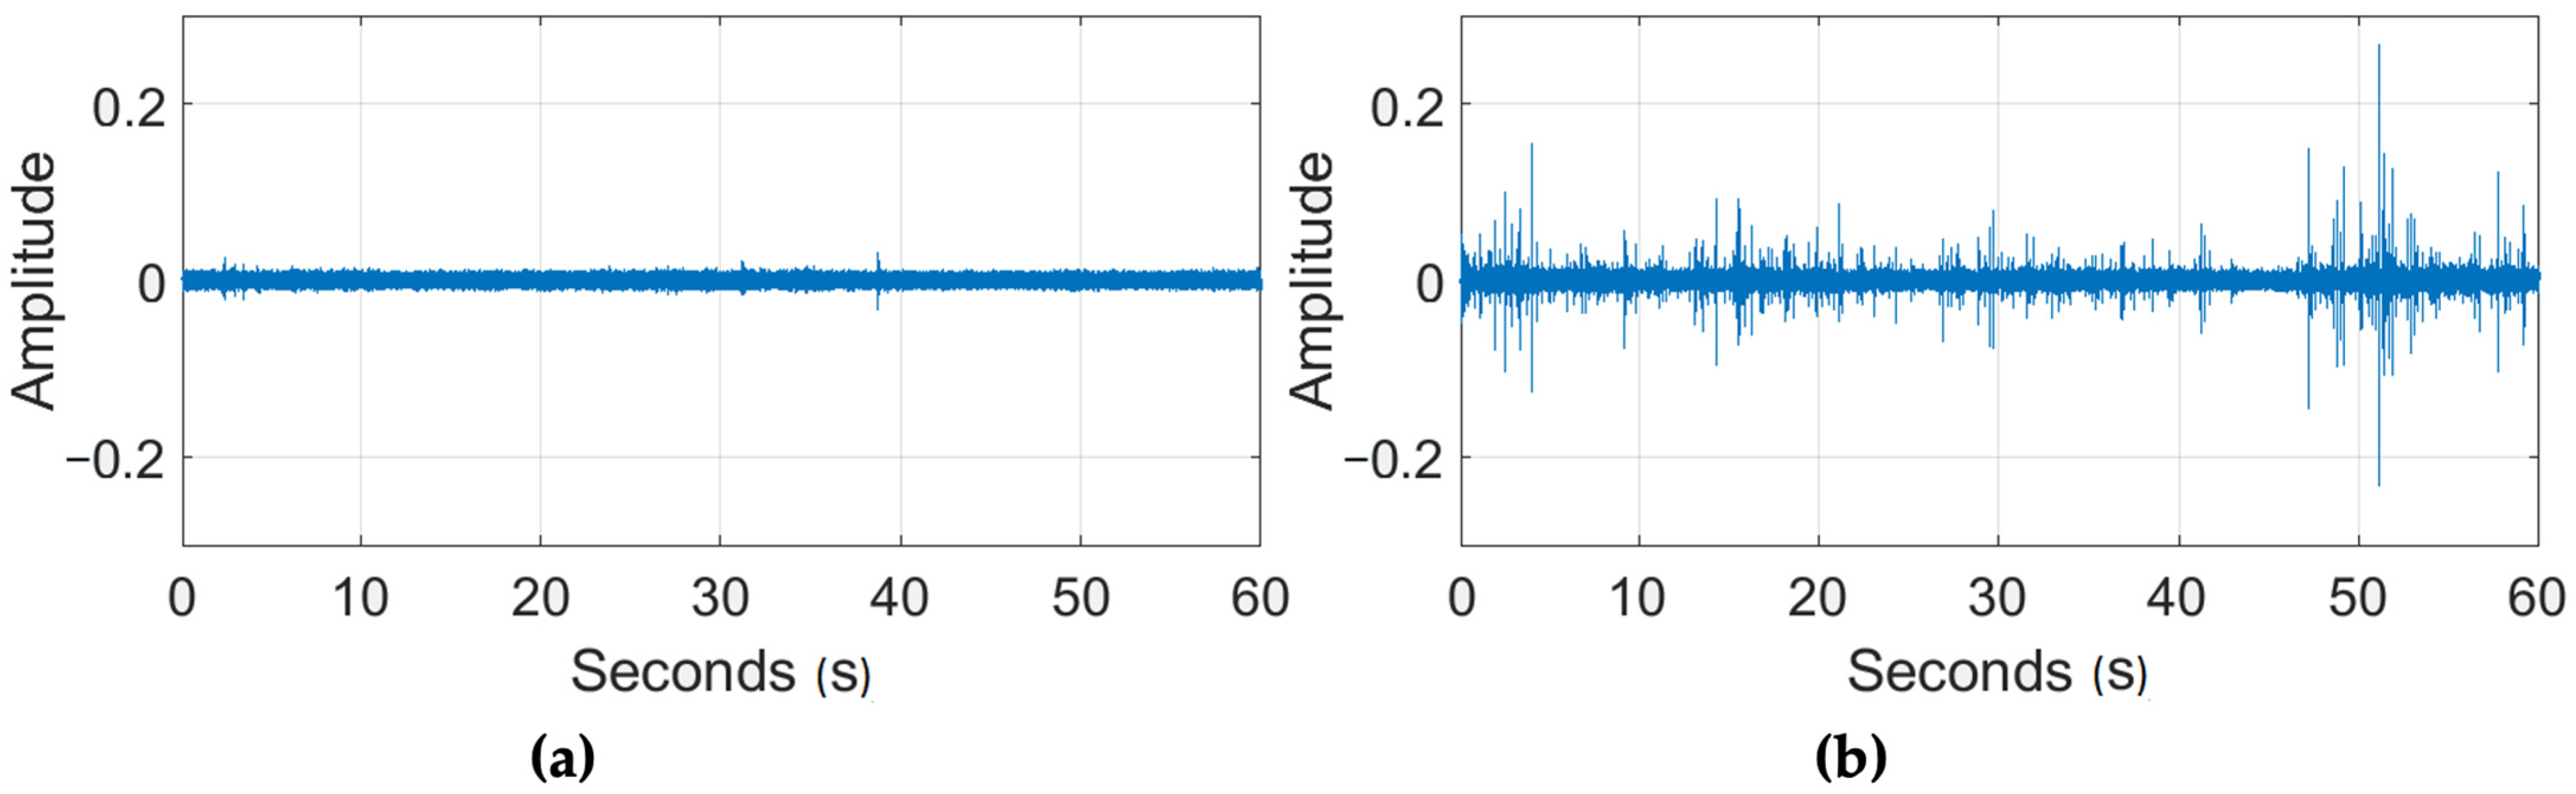
3.1. Laboratory Validation
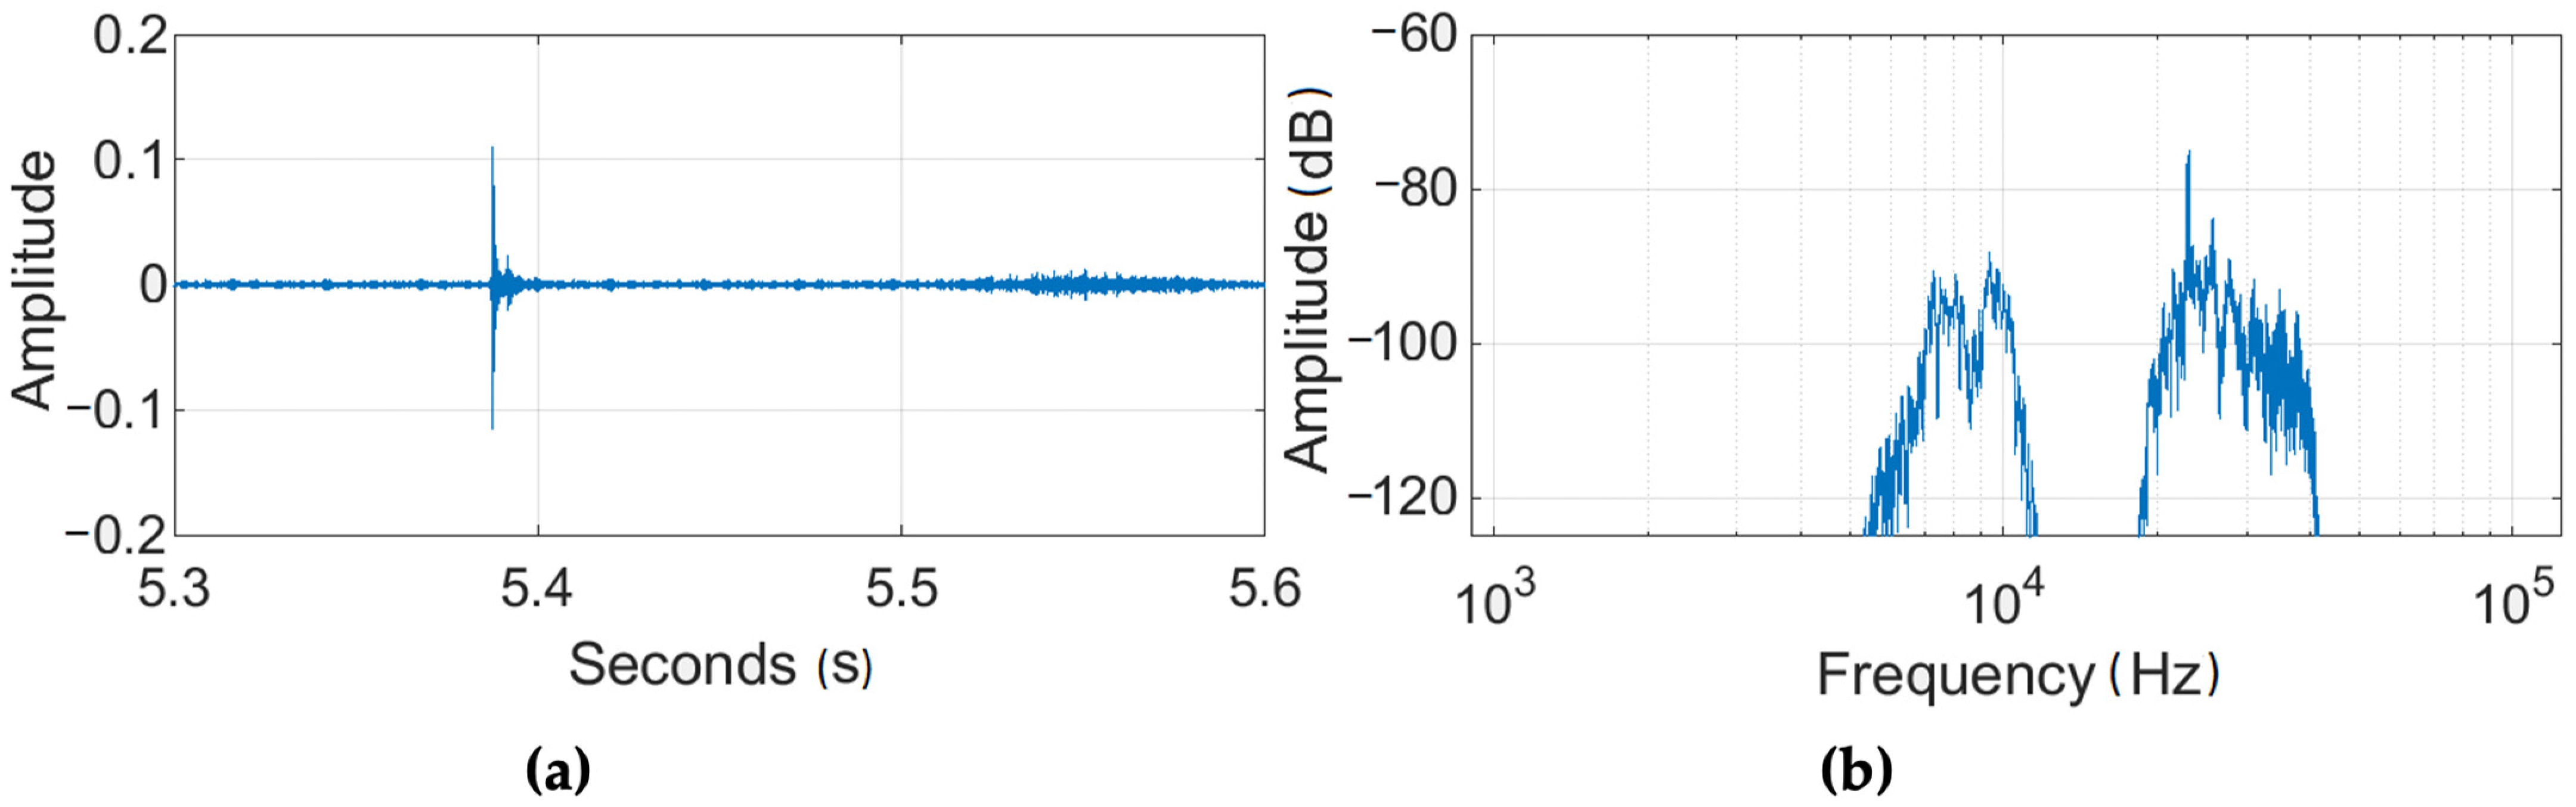
The validation with controlled conditions consisted of an experiment using the same device presented in Figure 2. It contained around 50 moths and the microphone was connected to the Raspberry Pi running the detection algorithm with a running network connection. The first minutes were used to adjust and set the amplification gain to reach the threshold. When set, the ambient noise (speech, AC System, impulsive noise) did not activate an event. When the moths (one or several) flew near the microphone, the detection algorithm of the system detected it and sent the event information to the server. This happened several times in the 1 h validation session. There was no pheromone trap inside the plastic container.

3.2. Simulated Moth

The simulation of the moth was performed by using two case scenarios. First, a neural network analysis was configured to find each passing of the moths in the near field of the sensor head. The network was trained in Matlab R2016b using clippings from a long acquisition and each clip was characterized using a set of six features (see Table 1). The parameter of the feedforward network was 6 inputs, 50 hidden layers and 1 output layer.
The neural network was trained using a set of 200 clippings from the long signal; 60% was used to train, 20% to validate and the remaining 20% for testing the network. The complete set of signals was analyzed using 4000 windows of detection. Figure 11 shows the mean spectrum over 100 detections obtained from the neural network analysis.
We performed two separate tests for both frequency bands previously determined (7 kHz to 10 kHz and 20 kHz to 40 kHz). In both tests, an active speaker was set at a distance X in the axial direction of the microphone and the amplifier was set to achieve 39.5 dB(A) at a distance of 1 cm at 7 kHz. We then displaced the emitter away from microphone until no detection was made by the system (Figure 12). For the first frequency range, we were able to detect the emitter up to 7 cm and for the second case, detection was possible up to 25 cm. It is worth mentioning that if the emitter moved at low speeds, the detection range decreased by approximately a factor of two.

3.3. Field Test

A final field validation with the complete system was performed. The system was installed near a vineyard in María Pinto in the Casablanca Valley, Chile, 70 km to the west of Santiago, for two weeks in January 2017. This is a valley affected by Lobesia botrana. The unit had a pheromone trap close to the microphone, as shown in Figure 13. The system was connected to the internet through an access point. It registered 9 events (26 January: 7 counts; 28 January: 1 count; 31 January: 1 count). These results were congruent with the register from the field traps from the Servicio Agrícola y Ganadero (Chilean Agricultural Service) [46].

4. Discussion and Conclusions

A real-time moth (Lobesia botrana) presence monitoring system was presented in this work. It was based on an acoustic signal detection. The different steps of the calibration of the sensor device as well as the moth detection and register of the data on the server were positively validated in the field experiments.
The results showed that it was possible to detect and identify Lobesia botrana with an acoustic sensor and processing device, which was validated in the laboratory and with a neural network analysis from an experimental database. This is a promising alternative to the current survey method with pheromone traps and manual installing and manual counting. The manual counting is often performed over several days or weeks so occasionally the moth is not detected in time; therefore, countermeasures for the pest control are delayed.
In searching the literature for pest detection, we did not find other reports for the acoustic detection of Lobesia botrana. Results for other insects, or pests in general, were often similar to what we have presented here; detection and counting was possible and effective in a laboratory situation and was validated in the field under controlled scenarios. As our acoustic method showed, the detection of insects under real conditions was effective and technically possible as others have also demonstrated using acoustics or other methods [8,19,22,24,27,30,32]. Further work is needed for most of them to be widely used and applied to transform the agriculture and food industry as questions about costs, location, distribution, real-time capabilities, necessity, detection sensitivity, insect identification and discrimination are mostly unanswered. It is interesting to note the broad-sensing principles and technologies used (image processing (UV, visible, IR), radar, vibration, acoustics, capacitance) using different features or characteristics of the insect as well as the fact that many of them base the detection on trained and self-learning algorithms from artificial intelligence.
As a perspective, and to permit the use of this device as a Lobesia botrana counter, the system must be calibrated in its sensitivity in contrast to current pheromone traps. The question about how many counted events correspond with a count with a pheromone trap has to be answered. Therefore, more field experiments are needed.
As a future work, we propose to optimize the design of the system to make it fit the needs of the Chilean Agricultural Service or the vineyards in terms of autonomy, size and potential other services (GPS location, temperature sensing, etc.) as well as in terms of the costs. The components used in the current version were of a broad purpose and over-dimensioned; the current broadband microphone could be changed to a normal microphone and the processing unit could be reduced to a specialized device (i.e., a signal amplifier with an analog filter or the same in a digital version). It would be interesting to test the device with other pest insects to broaden the use and application. Therefore, the particular filters have to be reviewed and upgraded.

Author Contributions

Conceptualization, S.F., G.H. and F.P.; methodology, S.F., G.H. and F.P.; software, N.B., G.H., F.P. and F.S.; validation, S.F., G.H. and F.P.; formal analysis, S.F., G.H., F.P. and F.S.; investigation, F.P.; resources, D.C., S.F. and C.Y.; writing—original draft preparation, F.P.; writing—review and editing, S.F., G.H. and F.P.; visualization, F.L.; supervision, G.H.; project administration, S.F. All authors have read and agreed to the published version of the manuscript.

Funding

This research was funded by FONDECYT-Chile Grant 11150388.

Institutional Review Board Statement

Not applicable.

Acknowledgments

The work presented in this paper is the result of different initiatives. It started with a project call by Telefonica I + D Chile, where a first prototype was developed. It then continued with the kind collaboration of the Fundación para el Desarrollo Frutícola (Foundation for Fruit Development) in Santiago, Chile. They provided the installation and moths for the secure work, testing and calibration of the sensing device. We want to thank Diego Nuñez and colleagues from the Ingeniería 2030 office at PUCV.

Conflicts of Interest

The authors declare no conflict of interest.

References

  1. Bruinsma, J. World Agriculture: Towards 2015/2030: An FAO Perspective; Earthscan: London, UK, 2003. [Google Scholar]
  2. Turrén-Cruz, T.; Zavala, M.Á.L. Framework Proposal for Achieving Smart and Sustainable Societies (S3). Sustainability 2021, 13, 13034. [Google Scholar] [CrossRef]
  3. United Nations Department of Economic and Social Affairs. The Sustainable Development Goals Report 2021; Cambridge University Press: Cambridge, UK, 2021. [Google Scholar]
  4. Tagarakis, A.C.; Dordas, C.; Lampridi, M.; Kateris, D.; Bochtis, D. A Smart Farming System for Circular Agriculture. Eng. Proc. 2021, 9, 10. [Google Scholar] [CrossRef]
  5. Bernhardt, H.; Schumacher, L.; Zhou, J.; Treiber, M.; Shannon, K. Digital Agriculture Infrastructure in the USA and Germany. Eng. Proc. 2021, 9, 1. [Google Scholar] [CrossRef]
  6. Molnar, I.; Rakosy-Tican, E. Difficulties in Potato Pest Control: The Case of Pyrethroids on Colorado Potato Beetle. Agronomy 2021, 11, 1920. [Google Scholar] [CrossRef]
  7. Adedeji, A.A.; Ekramirad, N.; Rady, A.; Hamidisepehr, A.; Donohue, K.D.; Villanueva, R.T.; Parrish, C.A.; Li, M. Non-Destructive Technologies for Detecting Insect Infestation in Fruits and Vegetables under Postharvest Conditions: A Critical Review. Foods 2020, 9, 927. [Google Scholar] [CrossRef] [PubMed]
  8. Ramalingam, B.; Mohan, R.E.; Pookkuttath, S.; Gómez, B.F.; Sairam Borusu, C.S.C.; Wee Teng, T.; Tamilselvam, Y.K. Remote Insects Trap Monitoring System Using Deep Learning Framework and IoT. Sensors 2020, 20, 5280. [Google Scholar] [CrossRef] [PubMed]
  9. CORFO. Programa Estratégico Industrias Inteligentes, CORFO, Executive Resume 2016. Available online: http://seguimiento.agendadigital.gob.cl/download?filename=1507037460_20150122 PENII Resumen Ejecutivo vF.pdf (accessed on 11 November 2021).
  10. EPPO Global Database. Available online: https://gd.eppo.int/ (accessed on 11 November 2021).
  11. Bovey, P. Super famille des Tortricidae. Entomol. Appl. L’Agric. 1966, 2, 456–893. [Google Scholar]
  12. Al-Zyoud, F.A.; Elmosa, H.M. Population dynamics of the grape berry moth, Lobesia botrana Schiff. (Lepidoptera: Tortricidae) and its parasites in Jerash Area, Jordan. Dirasat Agric. Sci. 2001, 28, 6–13. [Google Scholar]
  13. Venette, R.C.; Davis, E.E.; DaCosta, M.; Heisler, H.; Larson, M. Mini Risk Assessment Grape Berry Moth, Lobesia botrana. Department of Entomology, University of Minnesota, St. Paul, Minnesota, September 2003. Available online: https://www.aphis.usda.gov/plant_health/plant_pest_info/eg_moth/downloads/lbotrana-minipra.pdf (accessed on 11 November 2021).
  14. Ministerio de Agricultura de Chile. Servicio Agrícola y Ganadero (SAG). Estrategia 2016–2017 Programa Nacional de Lobesia botrana, December 2016. Available online: http://www.fdf.cl/lobesia_botrana/estrategia_pnlb_2016_2017.pdf (accessed on 4 November 2021).
  15. Huddar, S.R.; Gowri, S.; Keerthana, K.; Vasanthi, S.; Rupanagudi, S.R. Novel algorithm for segmentation and automatic identification of pests on plants using image processing. In Proceedings of the 2012 Third International Conference on Computing, Communication and Networking Technologies (ICCCNT’12), Coimbatore, India, 26–28 July 2012; pp. 1–5. [Google Scholar] [CrossRef]
  16. Rajan, P.; Radhakrishnan, B.; Suresh, L.P. Detection and classification of pests from crop images using Support Vector Machine. In Proceedings of the 2016 International Conference on Emerging Technological Trends (ICETT), Kollam, India, 21–22 October 2016; pp. 1–6. [Google Scholar] [CrossRef]
  17. Zheng, X.; Cai, R. Geometrid larvae detection using contour feature. In Proceedings of the 2016 IEEE 13th International Conference on Signal. Processing (ICSP), Chengdu, China, 6–10 November 2016; pp. 673–676. [Google Scholar] [CrossRef]
  18. Gavhale, K.R.; Gawande, U.; Hajari, K.O. Unhealthy region of citrus leaf detection using image processing techniques. In Proceedings of the International Conference for Convergence for Technology-2014, Pune, India, 6–8 April 2014; pp. 1–6. [Google Scholar] [CrossRef]
  19. Zhong, Y.; Gao, J.; Lei, Q.; Zhou, Y. A Vision-Based Counting and Recognition System for Flying Insects in Intelligent Agriculture. Sensors 2018, 18, 1489. [Google Scholar] [CrossRef] [PubMed] [Green Version]
  20. Vanegas, F.; Bratanov, D.; Powell, K.; Weiss, J.; Gonzalez, F. A Novel Methodology for Improving Plant Pest Surveillance in Vineyards and Crops Using UAV-Based Hyperspectral and Spatial Data. Sensors 2018, 18, 260. [Google Scholar] [CrossRef] [PubMed] [Green Version]
  21. Garcia-Lesta, D.; Ferro, E.; Brea, V.M.; López, P.; Cabello, D.; Iglesias, J.; Castillejo, J. Live demonstration: Wireless sensor network for snail pest detection. In Proceedings of the 2016 IEEE International Symposium on Circuits and Systems (ISCAS), Montréal, QC, Canada, 22–25 May 2016; p. 2371. [Google Scholar] [CrossRef]
  22. Qi, S.-F.; Li, Y.-H. A New Wireless Sensor Used in Grain Pests Detection. In Proceedings of the 2012 International Conference on Control. Engineering and Communication Technology, Shenyang, China, 7–9 December 2012; pp. 755–758. [Google Scholar] [CrossRef]
  23. Noskov, A.; Bendix, J.; Friess, N. A Review of Insect Monitoring Approaches with Special Reference to Radar Techniques. Sensors 2021, 21, 1474. [Google Scholar] [CrossRef] [PubMed]
  24. Balla, E.; Flórián, N.; Gergócs, V.; Gránicz, L.; Tóth, F.; Németh, T.; Dombos, M. An Opto-Electronic Sensor-Ring to Detect Arthropods of Significantly Different Body Sizes. Sensors 2020, 20, 982. [Google Scholar] [CrossRef] [PubMed] [Green Version]
  25. Najdenovska, E.; Dutoit, F.; Tran, D.; Plummer, C.; Wallbridge, N.; Camps, C.; Raileanu, L.E. Classification of Plant Electrophysiology Signals for Detection of Spider Mites Infestation in Tomatoes. Appl. Sci. 2021, 11, 1414. [Google Scholar] [CrossRef]
  26. Martin, B.; Juliet, V. Detection of pest infestation by preprocessing sound using vector quantization. In Proceedings of the 2010 2nd International Conference on Signal. Processing Systems, Dalian, China, 5–7 July 2010; pp. V3-219–V3-223. [Google Scholar] [CrossRef]
  27. Yazgac, B.G.; Kirci, M.; Kivan, M. Detection of sunn pests using sound signal processing methods. In Proceedings of the 2016 Fifth International Conference on Agro-Geoinformatics (Agro-Geoinformatics), Tianjin, China, 18–20 July 2016; pp. 1–6. [Google Scholar] [CrossRef]
  28. Potamitis, I.; Ganchev, T.; Fakotakis, N. Automatic bioacoustic detection of Rhynchophorus ferrugineus. In Proceedings of the 2008 16th European Signal Processing Conference, Lausanne, Switzerland, 25–29 August 2008; pp. 1–4. [Google Scholar]
  29. Flynn, T.; Salloum, H.; Hull-Sanders, H.; Sedunov, A.; Sedunov, N.; Sinelnikov, Y.; Sutin, A.; Masters, A. Acoustic methods of invasive species detection in agriculture shipments. In Proceedings of the 2016 IEEE Symposium on Technologies for Homeland Security (HST), Waltham, MA, USA, 10–11 May 2016; pp. 1–5. [Google Scholar] [CrossRef]
  30. de la Rosa, J.J.G.; Lloret, I.; Moreno, A.; Puntonet, C.G.; Gorriz, J.M. Higher-order spectral characterization of termite emissions using acoustic emission probes. In Proceedings of the 2007 IEEE Sensors Applications Symposium, San Diego, CA, USA, 6–8 February 2007; pp. 1–6. [Google Scholar] [CrossRef]
  31. Potamitis, I.; Rigakis, I.; Tatlas, N.-A. Automated Surveillance of Fruit Flies. Sensors 2017, 17, 110. [Google Scholar] [CrossRef] [PubMed] [Green Version]
  32. Martin, B.; Juliet, V.; Sankaranarayanan, P.E.; Gopal, A.; Rajkumar, I. Wireless implementation of mems accelerometer to detect red palm weevil on palms. In Proceedings of the 2013 International Conference on Advanced Electronic Systems (ICAES), Pilani, India, 21–23 September 2013; pp. 248–252. [Google Scholar] [CrossRef]
  33. Pilli, S.K.; Nallathambi, B.; George, S.J.; Diwanji, V. eAGROBOT—A robot for early crop disease detection using image processing. In Proceedings of the 2015 2nd International Conference on Electronics and Communication Systems (ICECS), Coimbatore, India, 26–27 February 2015; pp. 1684–1689. [Google Scholar] [CrossRef]
  34. Dagatti, C.V.; Becerra, V.C. Ajuste de modelo fenológico para predecir el comportamiento de Lobesia botrana (Lepidoptera: Tortricidae) en un viñedo de Mendoza, Argentina. Rev. Soc. Entomol. Argent. 2015, 74, 117–122. [Google Scholar]
  35. Raman, D.R.; Gerhardt, R.R.; Wilkerson, J.B. Detecting Insect Flight Sounds in the Field: Implications for Acoustical Counting of Mosquitoes. Trans. ASABE 2007, 50, 1481–1485. [Google Scholar] [CrossRef] [Green Version]
  36. Mankin, R.W.; Machan, R.; Jones, R.L. Field testing of a Prototype Acoustic device for d etection of Mediterranean Fruit Flies Flying into a trap. In Proceedings of the 7th International Symposium on Fruit Flies of Economic Importance, Salvador, Brazil, 10–15 September 2006. [Google Scholar]
  37. Lapshin, D.N.; Vorontsov, D.D. Acoustic irradiation produced by flying moths (Lepidoptera, Noctuidae). Entmol. Rev. 2007, 87, 1115–1125. [Google Scholar] [CrossRef]
  38. Bailey, W.J. Resonant wing systems in the Australian whistling moth Hecatesia (Agarasidae, Lepidoptera). Nature 1978, 272, 444–446. [Google Scholar] [CrossRef]
  39. Audacity. Available online: https://sourceforge.net/projects/audacity (accessed on 4 November 2021).
  40. Welch, P. The use of fast Fourier transform for the estimation of power spectra: A method based on time averaging over short, modified periodograms. IEEE Trans. Audio Electroacoust. 1967, 15, 70–73. [Google Scholar] [CrossRef] [Green Version]
  41. Oppenheim, A.V.; Schafer, R.W. Discrete-Time Signal. Processing; Prentice Hall: Hoboken, NJ, USA, 1989. [Google Scholar]
  42. Knowles Acoustics. MEMS Microphone, Ultrasonic MEMS Sensor SPM0404UD5. Available online: https://www.digikey.com/en/articles/ultrasonic-mems-sensor-spm0404ud5 (accessed on 4 November 2021).
  43. Dodotronic. Microphone Ultramic250K, Ultramic UM250K. Available online: https://www.dodotronic.com/product/ultramic-um250k/?v=2a47ad90f2ae (accessed on 4 November 2021).
  44. Fledermausschutz Aachen, A.K. Düren, Euskirchen, Raspberry Pi Bat Project, Bat Pi 3. Available online: http://www.bat-pi.eu/EN/index-EN.html (accessed on 4 November 2021).
  45. SoX—Sound eXchange. Available online: http://sox.sourceforge.net (accessed on 4 November 2021).
  46. Servicio Agrícola y Ganadero. Vigilancia. Available online: http://www.sag.cl/ambitos-de-accion/vigilancia (accessed on 4 November 2021).
Figure 1. Schematic of the experimental setup used for the acoustic characterization of the flying moth.
Applsci 11 11889 g001
Figure 2. (a) Picture of the moth container with the acoustic absorbers and the wideband microphone and (b) a picture of the container (without microphone) where several moths are visible. A moistened piece of cotton wool was used so that the moths could drink is also shown.
Applsci 11 11889 g002
Figure 3. Time signal recorded from the acquisition setup: (a) without moths; (b) with moths.
Applsci 11 11889 g003
Figure 4. PSD of the sound recorded on the container without moths.
Applsci 11 11889 g004
Figure 5. (a) Acoustic signal of the container with 8 moths; (b) PSD of the container with 8 moths (blue) and reference (red).
Applsci 11 11889 g005
Figure 6. (a) Acoustic signal of the container with 50 moths; (b) PSD of the container with 50 moths (blue) and reference (red).
Applsci 11 11889 g006
Figure 7. PSD of the wideband impulse response of the matched filter.
Applsci 11 11889 g007
Figure 8. (a) Acoustic signal of the Lobesia botrana. (b) PSD of the filter response from the Lobesia signal.
Applsci 11 11889 g008
Figure 9. Block diagram of the wireless sensor.
Applsci 11 11889 g009
Figure 10. Pseudo-code implemented in the sensor.
Applsci 11 11889 g010
Figure 11. Power spectrum average of the detected signals and background noise obtained with a neural network analysis.
Applsci 11 11889 g011
Figure 12. Experimental setup diagram for the detection range characterization.
Applsci 11 11889 g012
Figure 13. System installed in the field under controlled conditions inside a closed net cage. In the cage, 50 moths were detected and the system functioned for 5 days. (a) A close-up of the microphone and pheromone trap. Both are inside a tube to protect them from rain. (b) First prototype version of the system inside a sealed case.
Applsci 11 11889 g013
Table 1. Features measured to characterize an event.
FeaturesDescription
1Signal mean
2Root mean square
3Amplitude of the central maxima of the autocorrelation function
4Position of the first peak in the autocorrelation function
5Amplitude of the first peak in the autocorrelation function
6Spectral power from 20 kHz to 40 kHz
Publisher’s Note: MDPI stays neutral with regard to jurisdictional claims in published maps and institutional affiliations.

