Article

The Calculated Circadian Effects of Light Exposure from Commuting

School of Architecture, Design and Planning, The University of Sydney, Sydney, NSW 2006, Australia
*
Author to whom correspondence should be addressed.
Appl. Sci. 2021, 11(24), 11846; https://doi.org/10.3390/app112411846
Submission received: 29 September 2021 / Revised: 9 December 2021 / Accepted: 10 December 2021 / Published: 13 December 2021
(This article belongs to the Special Issue Advances in Human-Centric Lighting)

Abstract

:
Light entrains human circadian rhythms, but increased time spent indoors and decreased daylight exposure may disrupt human circadian regulation and cause health problems. Much research is focused on improving indoor lighting conditions to minimize the adverse circadian impact of electric lights, and few studies investigate the circadian impact of daylight during the incidental time that people spend outdoors. For instance, when people commute from home to work, they are exposed to daylight. The purpose of this study is to investigate daylight’s impact on commuters’ circadian rhythms. Measurements of the illuminance and the spectral irradiance distribution (SID) of daylight were taken for three modes of commuting: driving, riding on trains, and walking; and under different weather conditions, on different days, and at different locations throughout the summer and autumn in the Sydney metropolitan region in Australia. With the SID data, three metrics were calculated to estimate the circadian impacts: α-opic irradiance, circadian stimulus (CS), and equivalent melanopic lux (EML). The results suggest that driving or walking on sunny or cloudy days and riding trains on sunny days are beneficial for the commuters’ circadian synchronization.

1. Introduction

Light entrains human circadian rhythms [1,2,3], with studies showing that both light exposure history and timing can influence circadian rhythms. The master clock tends to phase early when exposed to light in the morning, and the clock phases late when exposed to light at night [4]. Research has shown that at least four hours of daylight exposure (or electric light exposure of equivalent intensity) during daytime for seven days decreased the subjects’ sensitivity to subsequent light exposure, compared with dim light exposure during the day [5]. Despite using a variety of methodologies, several studies have consistently found that bright light exposure dampens the impact of subsequent light exposure on the circadian systems [6,7,8].
Disruption of circadian regulation has been associated with many health issues [9]. As many people spend a substantial portion of their time indoors [10], concerns have been raised that limited daylight exposure may disrupt the human circadian cycles [11], and some suggest that indoor lighting conditions should be changed to compensate for this reduced exposure to daylight [12].
A recent study showed that nighttime exterior lighting can have a circadian effect on people [13]. However, a human’s light exposure is not limited to the electric lighting in indoor spaces or outdoor lighting at night—many people travel between their home and workplace on a regular basis. In Australia, the primary commuting modes are driving (79%), taking public transportation (14%), and walking or cycling (5.2%) [14], during which they are incidentally exposed to daylight. In 2017, the average commuting time of employed Australians was one hour [14]. A survey conducted in the United States shows that people spend about an average of 6% of their time in vehicles [15], which is approximately consistent with the Australian commuting time. There have been no studies on the effect of this light exposure on the circadian systems of commuters. This research aims to evaluate the circadian effect of daylight from commuting.
In this study, the illuminance and the spectral irradiance distribution (SID) of daylight were measured for three different commuting modes: driving, riding on trains, and walking, in two types of weather conditions (sunny and cloudy). The measurements were repeated during different times and days at various locations in the Sydney metropolitan area. The SID data were used to calculate three metrics: α-opic irradiance [16], circadian stimulus (CS) [17,18], and equivalent melanopic lux (EML) [19], in order to estimate the circadian effects of the different commuting modes. The average α-opic irradiance for each mode of commuting in both sunny and cloudy weather conditions is reported in this study. The average CS and EML values are compared to their recommended minimum values.

2. Materials and Methods

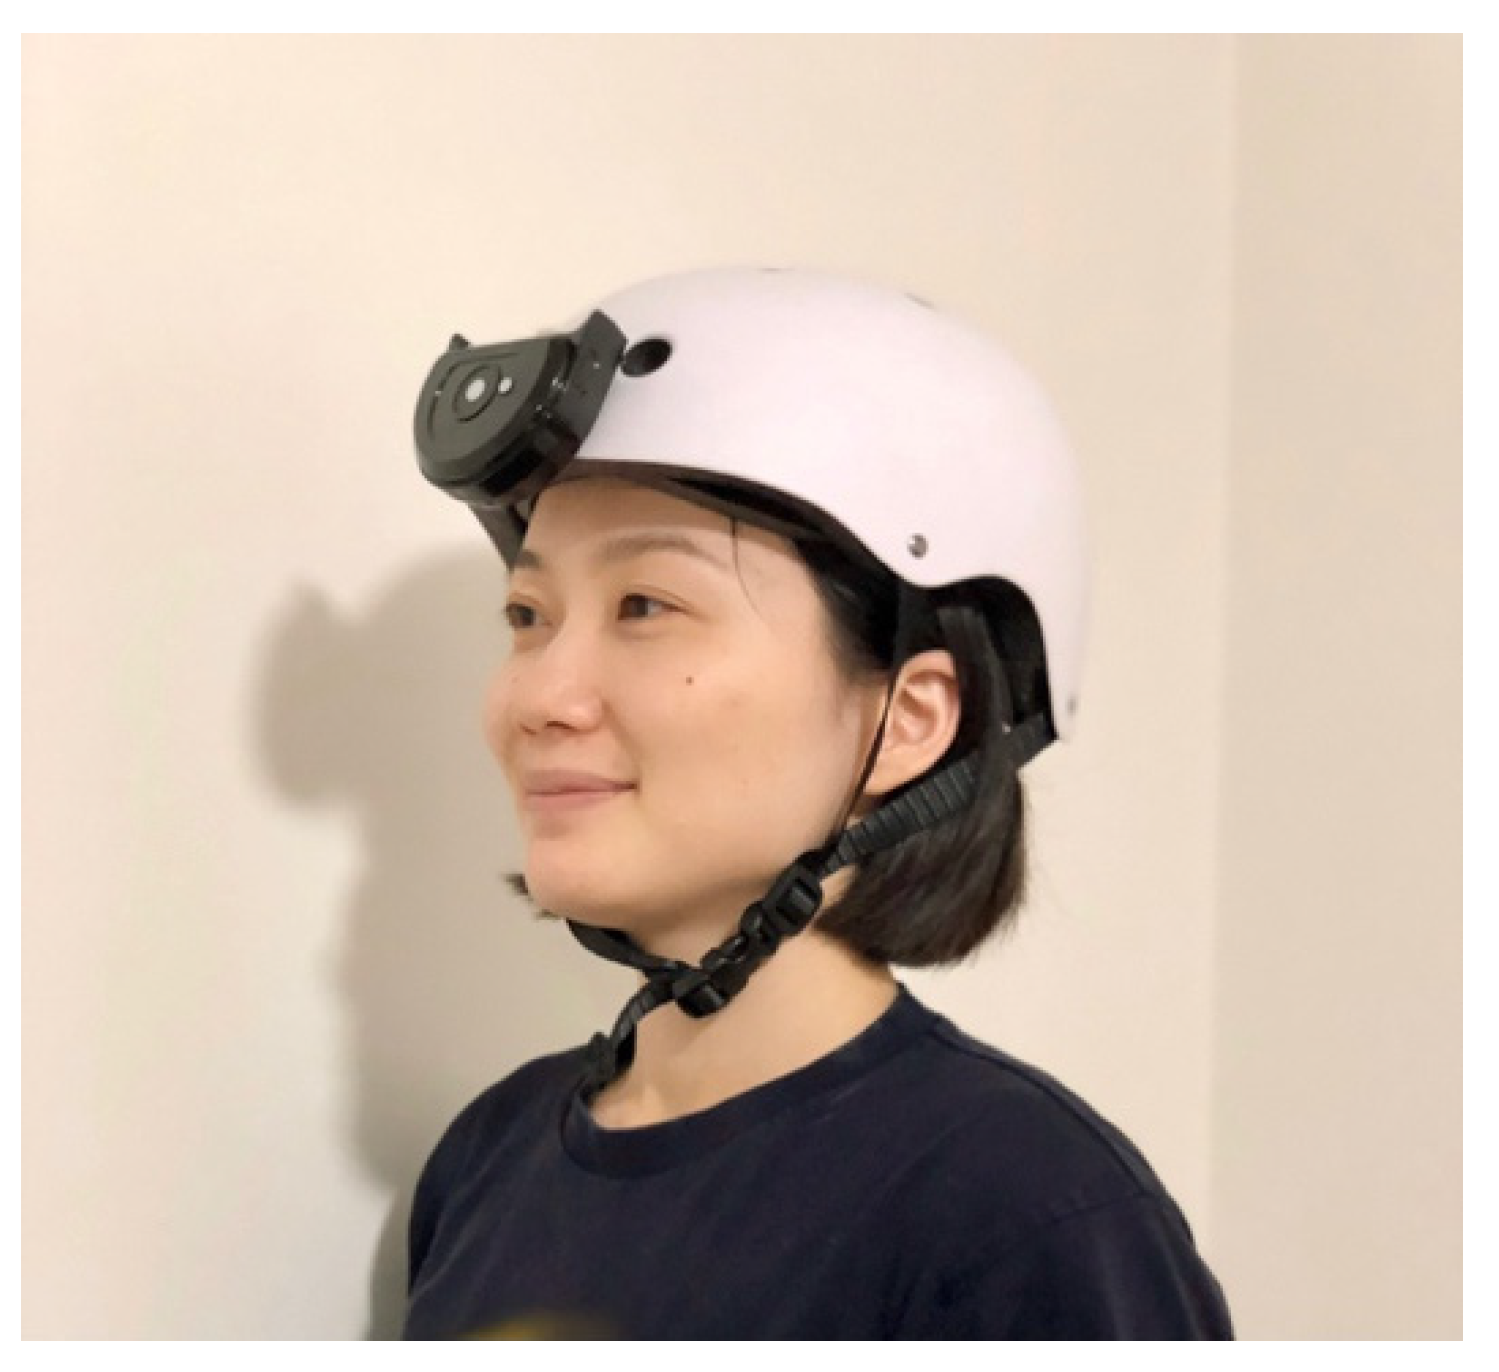
2.1. Light Exposure Measurements

A calibrated Everfine SPIC-300 spectral irradiance meter was used to measure the illuminance and SID. The sensor of the spectral irradiance meter can be separated from the rest of the instrument, which it communicates with via Bluetooth. In order to estimate the corneal illuminance and SID while traveling safely, the sensor was mounted on a modified helmet. When the operator wore the helmet to conduct the measurements, the sensor was, therefore, in the center of the operator’s forehead, just above the eyes (Figure 1). After initiating the instrument, the equipment recorded the first measurement and automatically measured the subsequent light. The time taken for each measurement varied. The average measurement frequency during the trips was 1.4 recordings per minute. The measurements ceased when the operator manually stopped the equipment. A series of measurements were automatically and continuously recorded while the operator traveled.
The mounting position of the sensor on a helmet was used to ensure the safety of the operator. However, comparisons were made between the measurements of the light striking the sensor when mounted on the helmet and when placed in front of the cornea, and very little difference was found. The same instrument was used for this comparison, with the same operator (Figure 1). The operator stood outdoors, measured the light once when the sensor was on the helmet, and then immediately moved the sensor onto her right eye and recorded another measurement. This process was repeated three times. The percentage difference of the measured irradiance was calculated as the difference between the irradiance at the helmet position and the irradiance at the eye position divided by the irradiance at the eye. The three percentages were 1.2%, −0.5%, and 1.3%, which are all less than the measurement uncertainty of the instrument.
Measurements were obtained for a total of 21 trips, representative of those undertaken by the commuters. All trips were taken in the summer and autumn (from December 2019 to March 2020) in the Sydney metropolitan region in Australia. Seven trips were taken for each commuting mode: driving, riding trains, and walking. Additionally, all trips were taken during the morning peak hours (within the time range of 07:30 to 10:00). For driving, the average starting time was 08:54 a.m. and the average ending time was 09:22 a.m. For riding trains, the average starting time was 08:38 a.m. and the average ending time was 08:59 a.m. For walking, the average starting time was 08:28 a.m. and the average ending time was 09:00 a.m. The duration of the trips varied from 12 min to 41 min. The average duration of all trips was 27 min. For driving and walking, the direction of travel included all four directions (north, south, west, and east, approximately) for each mode of commuting. For train rides, the trips include one railway line which is a loop, as well as three other railway lines, for which measurements were collected in both directions of travel. All the measurements were conducted by the same operator (Figure 1).
When driving, the operator wore the modified helmet with the attached sensor and initiated the spectral irradiance meter before she started to drive. The equipment automatically recorded the measurements as she drove. The primary light source was the daylight coming through the front windshield and the windows of the vehicle. The operator was free to perform any necessary movements for safe driving, such as checking the GPS, adjusting the side-view mirrors, monitoring traffic conditions, etc. The seven trips that were taken for the driving mode started at different locations and ended at different destinations. The measurements were conducted inside of the same vehicle (model: 2018 Toyota, CH-R) with tinted side windows.
When riding on the commuter trains, the operator wore the modified helmet with the attached sensor and initiated the spectral irradiance meter just before she boarded the train. The operator sat near the windows in a seat either facing forward or backward, relative to the direction of travel, and on either the upper or lower level of the train. The operator was exposed to the daylight coming through the windows of the train and the electric lights in the train. The measurements captured the contributions of both light sources. The operator was free to perform any typical movements associated with riding trains, such as looking at the views outside the windows, reading a book, navigating through the train car, etc. The seven trips that were taken for the mode of riding trains started and ended at different stations. Between some stations, the train travelled underground, during which times daylight was blocked and the electric lights were the only light source. During this period, the measurements were continued, and the data for these sections were included in the calculation to reflect real-life commuting situations.
When walking, the measurement procedure was similar to the other two commuting modes. The operator wore the modified helmet with the attached sensor and initiated the spectral irradiance meter when she started to walk. The seven trips that were taken for the mode of walking started at different locations and ended at various destinations. The operator walked through a variety of areas, including places where tall buildings or trees partially blocked the daylight. The walking routes also included areas with more open space, where the operator was fully exposed to daylight. The operator was free to perform any necessary movements for safe walking, such as monitoring the environment, checking traffic conditions, waiting for traffic lights, etc.
A weather application on a smartphone was used to monitor and record the weather conditions. The weather was recorded twice for each trip—once when the trip started and again when the trip ended. The light measurements were taken when the weather was relatively steady throughout the trips. They were not just taken on sunny days, when the daylight was intense, but also on cloudy days, when the daylight was weaker. Table 1 gives detailed information about examples of the trip itineraries for each commuting mode. The majority of the areas where the measurements were conducted have high-rise buildings, in which 36–82% of the dwellings are high density [20,21]. The GPS route was captured for driving and walking by a smartphone GPS application. Figure 2 shows examples of the GPS route for driving and walking.

2.2. Calculations of the Circadian Effects of Lights

The three metrics, α-opic irradiance, CS, and EML, were used to estimate the circadian effects of the light exposure experienced during a typical commute. The calculations were based on the following methods.

2.2.1. α-Opic Irradiance

The first method is recommended by the International Commission on Illumination (CIE) in CIE S 026/E:2018 [16]. This international standard provides the spectral sensitivity functions (action spectra), which describe the extent to which radiation stimulates each of the five photoreceptor types that contribute to the non-visual effects of light in humans [16]. The sensitivity function for the intrinsically-photosensitive retinal ganglion cells (ipRGCs) is based on the work of Lucas et al. [22]. The cone sensitivity function and rod sensitivity function recommended in CIE S 026/E:2018 are based on a previous CIE publication [16]. With the SID and spectral sensitivity functions, the weighted irradiance (α-opic irradiance) for each human photoreceptor type can be calculated with Equation (1):
E e ,   α =   E e ,   λ ( λ ) S α ( λ ) d λ
where E e ,   α is the α-opic irradiance, E e ,   λ ( λ ) is the spectral irradiance, and S α ( λ ) is the α-opic action spectrum [16]. A toolbox to support the use of this metric has been developed and is available on the CIE website [23].

2.2.2. Circadian Stimulus

Another method for quantifying the circadian impact of light is through the circadian stimulus (CS) [17,18]. CS represents the percentage of melatonin suppression evoked by light [24]. The non-linear model was initially developed based on spectral sensitivity data published by several researchers [25,26], and the model has been modified multiple times since it was initially proposed [18]. Instead of modeling the five different spectral sensitivity functions—one for each photoreceptor type—CS quantifies the total circadian effect from light. Given the SID, CS can be calculated with Equations (2) and (3):
C S = 0 . 7 0 . 7 1 + ( C L A 355 . 7 ) 1 . 1026
C L A = { 1548 [   M C λ E λ d λ + ( a b y (   S λ m p λ E λ d λ k   V λ m p λ E λ d λ )   a r o d ( 1 e   V λ E λ d λ R o d S a t ) ) ] ,   i f     S λ m p λ E λ d λ k   V λ m p λ E λ d λ 0 1548   M C λ E λ d λ   ,   i f     S λ m p λ E λ d λ k   V λ m p λ E λ d λ < 0
where C L A is circadian light, C S is circadian stimulus, E λ is the SID of the incident light, M C λ is melanopsin (corrected for crystalline lens transmittance) sensitivity [27], S λ is the S-cone fundamental [28], m p λ is macular pigment transmittance [29], V λ is the photopic luminous efficiency function [30], V λ is the scotopic luminous efficiency function [30], R o d S a t is the half-saturation constant for bleaching rods, equal to 6.5 W/m2 [31], k equals 0.2616 [32], a b y equals 0.7 [32], and a r o d equals 3.3 [32]. Due to the non-linear structure of the model, there are slight differences in the intensity of the narrowband light of ~507 nm [18], which can lead to massive differences in the output of the CS. This discontinuity can cause inaccuracies when predicting circadian effects with this model. More details about the CS metric and its limitations are reported in the publications by Rea et al. [18,32,33].

2.2.3. Equivalent Melanopic Lux
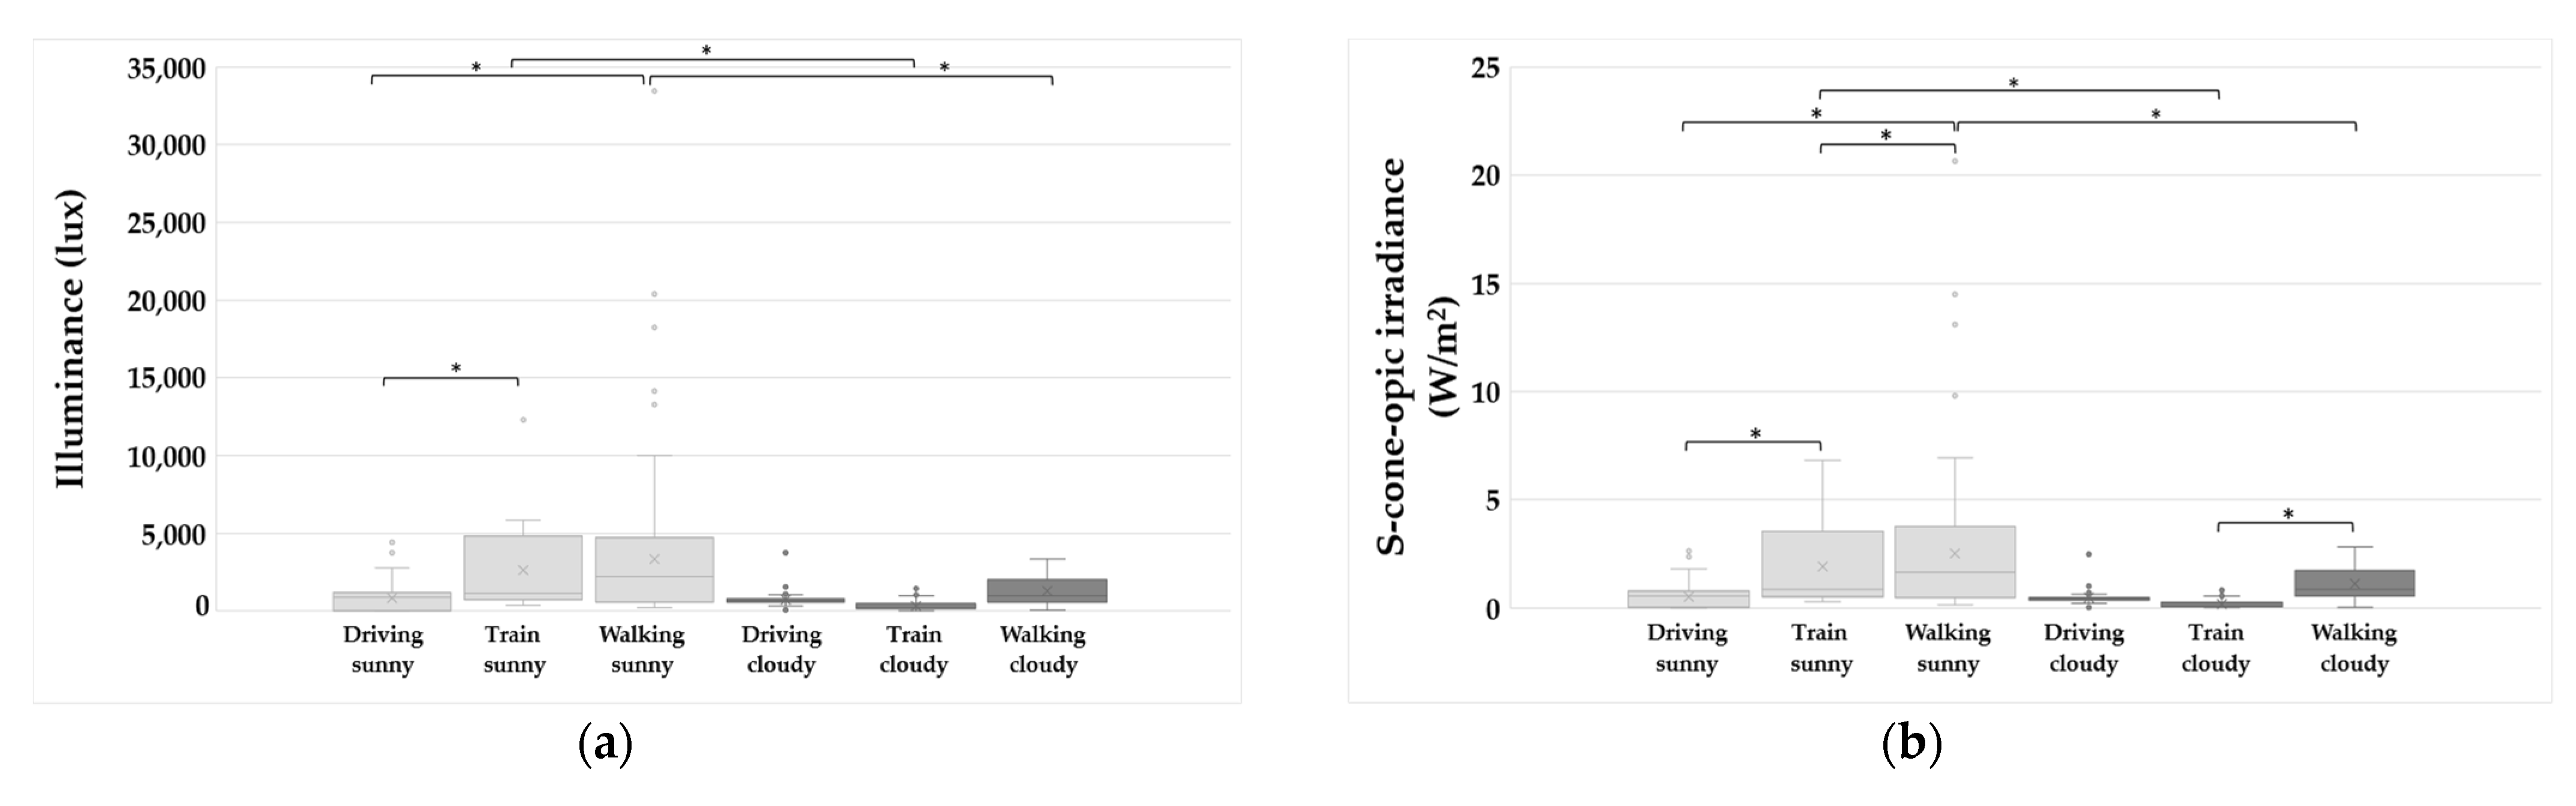
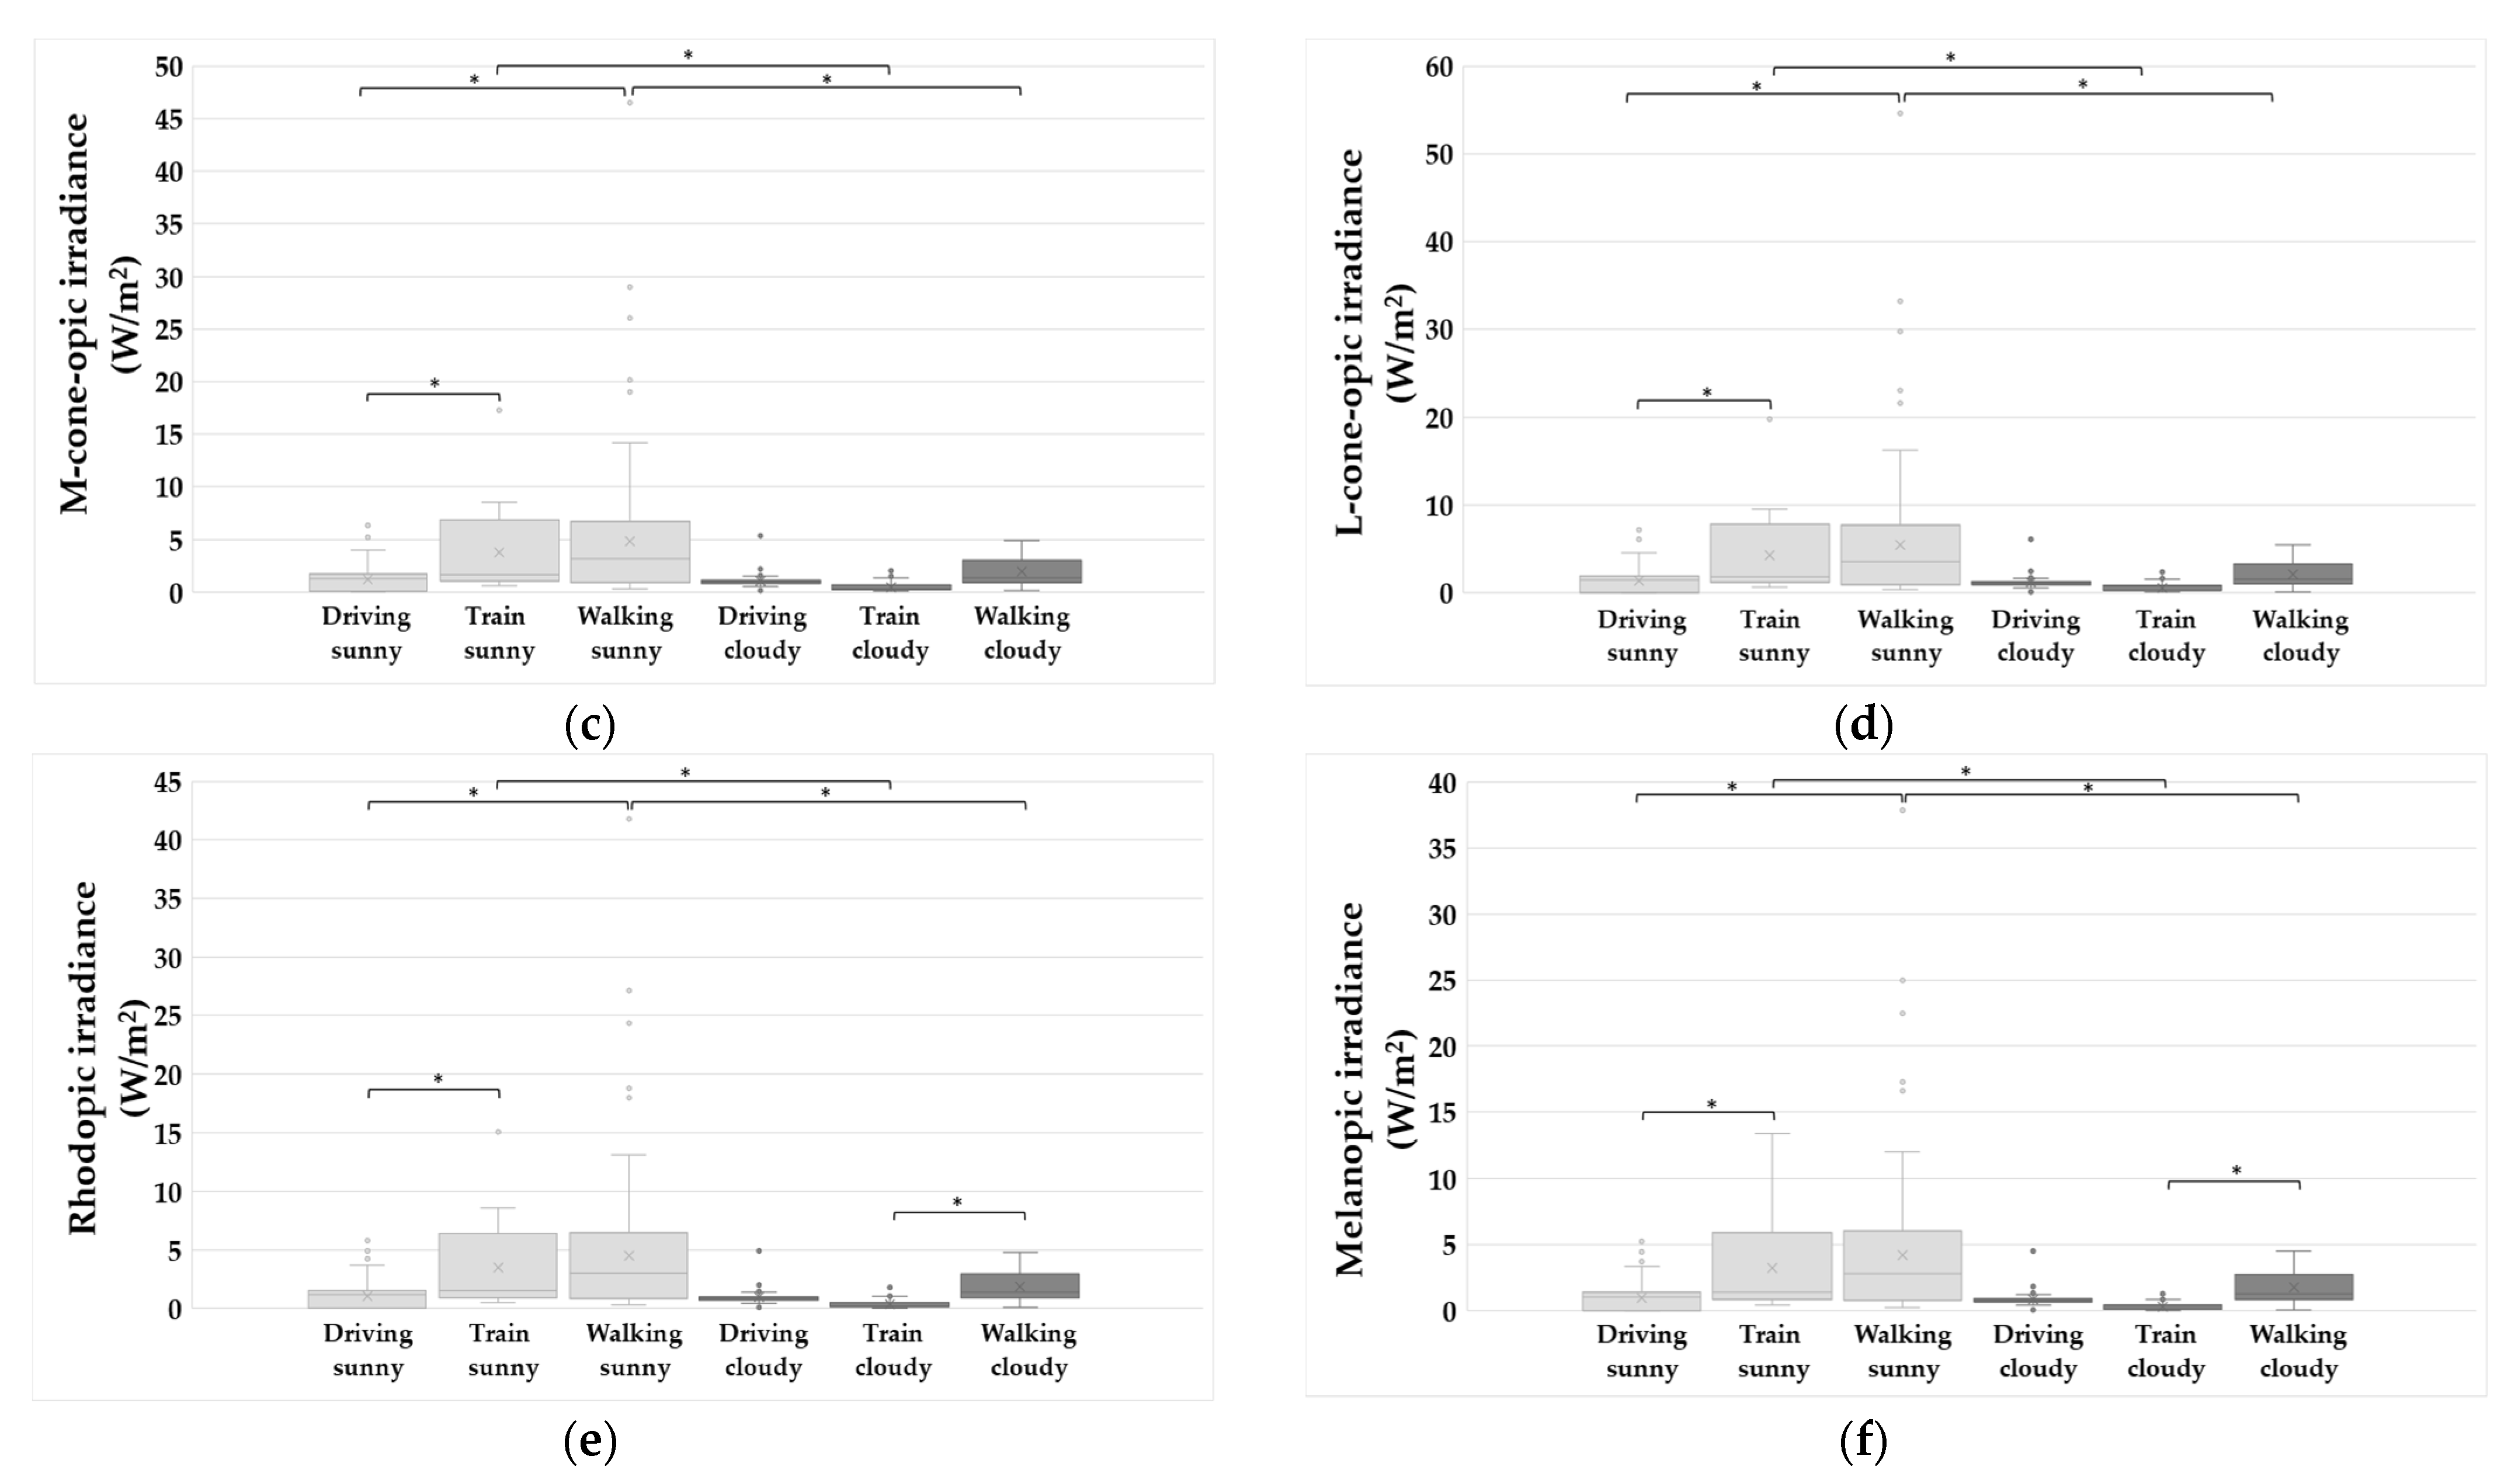
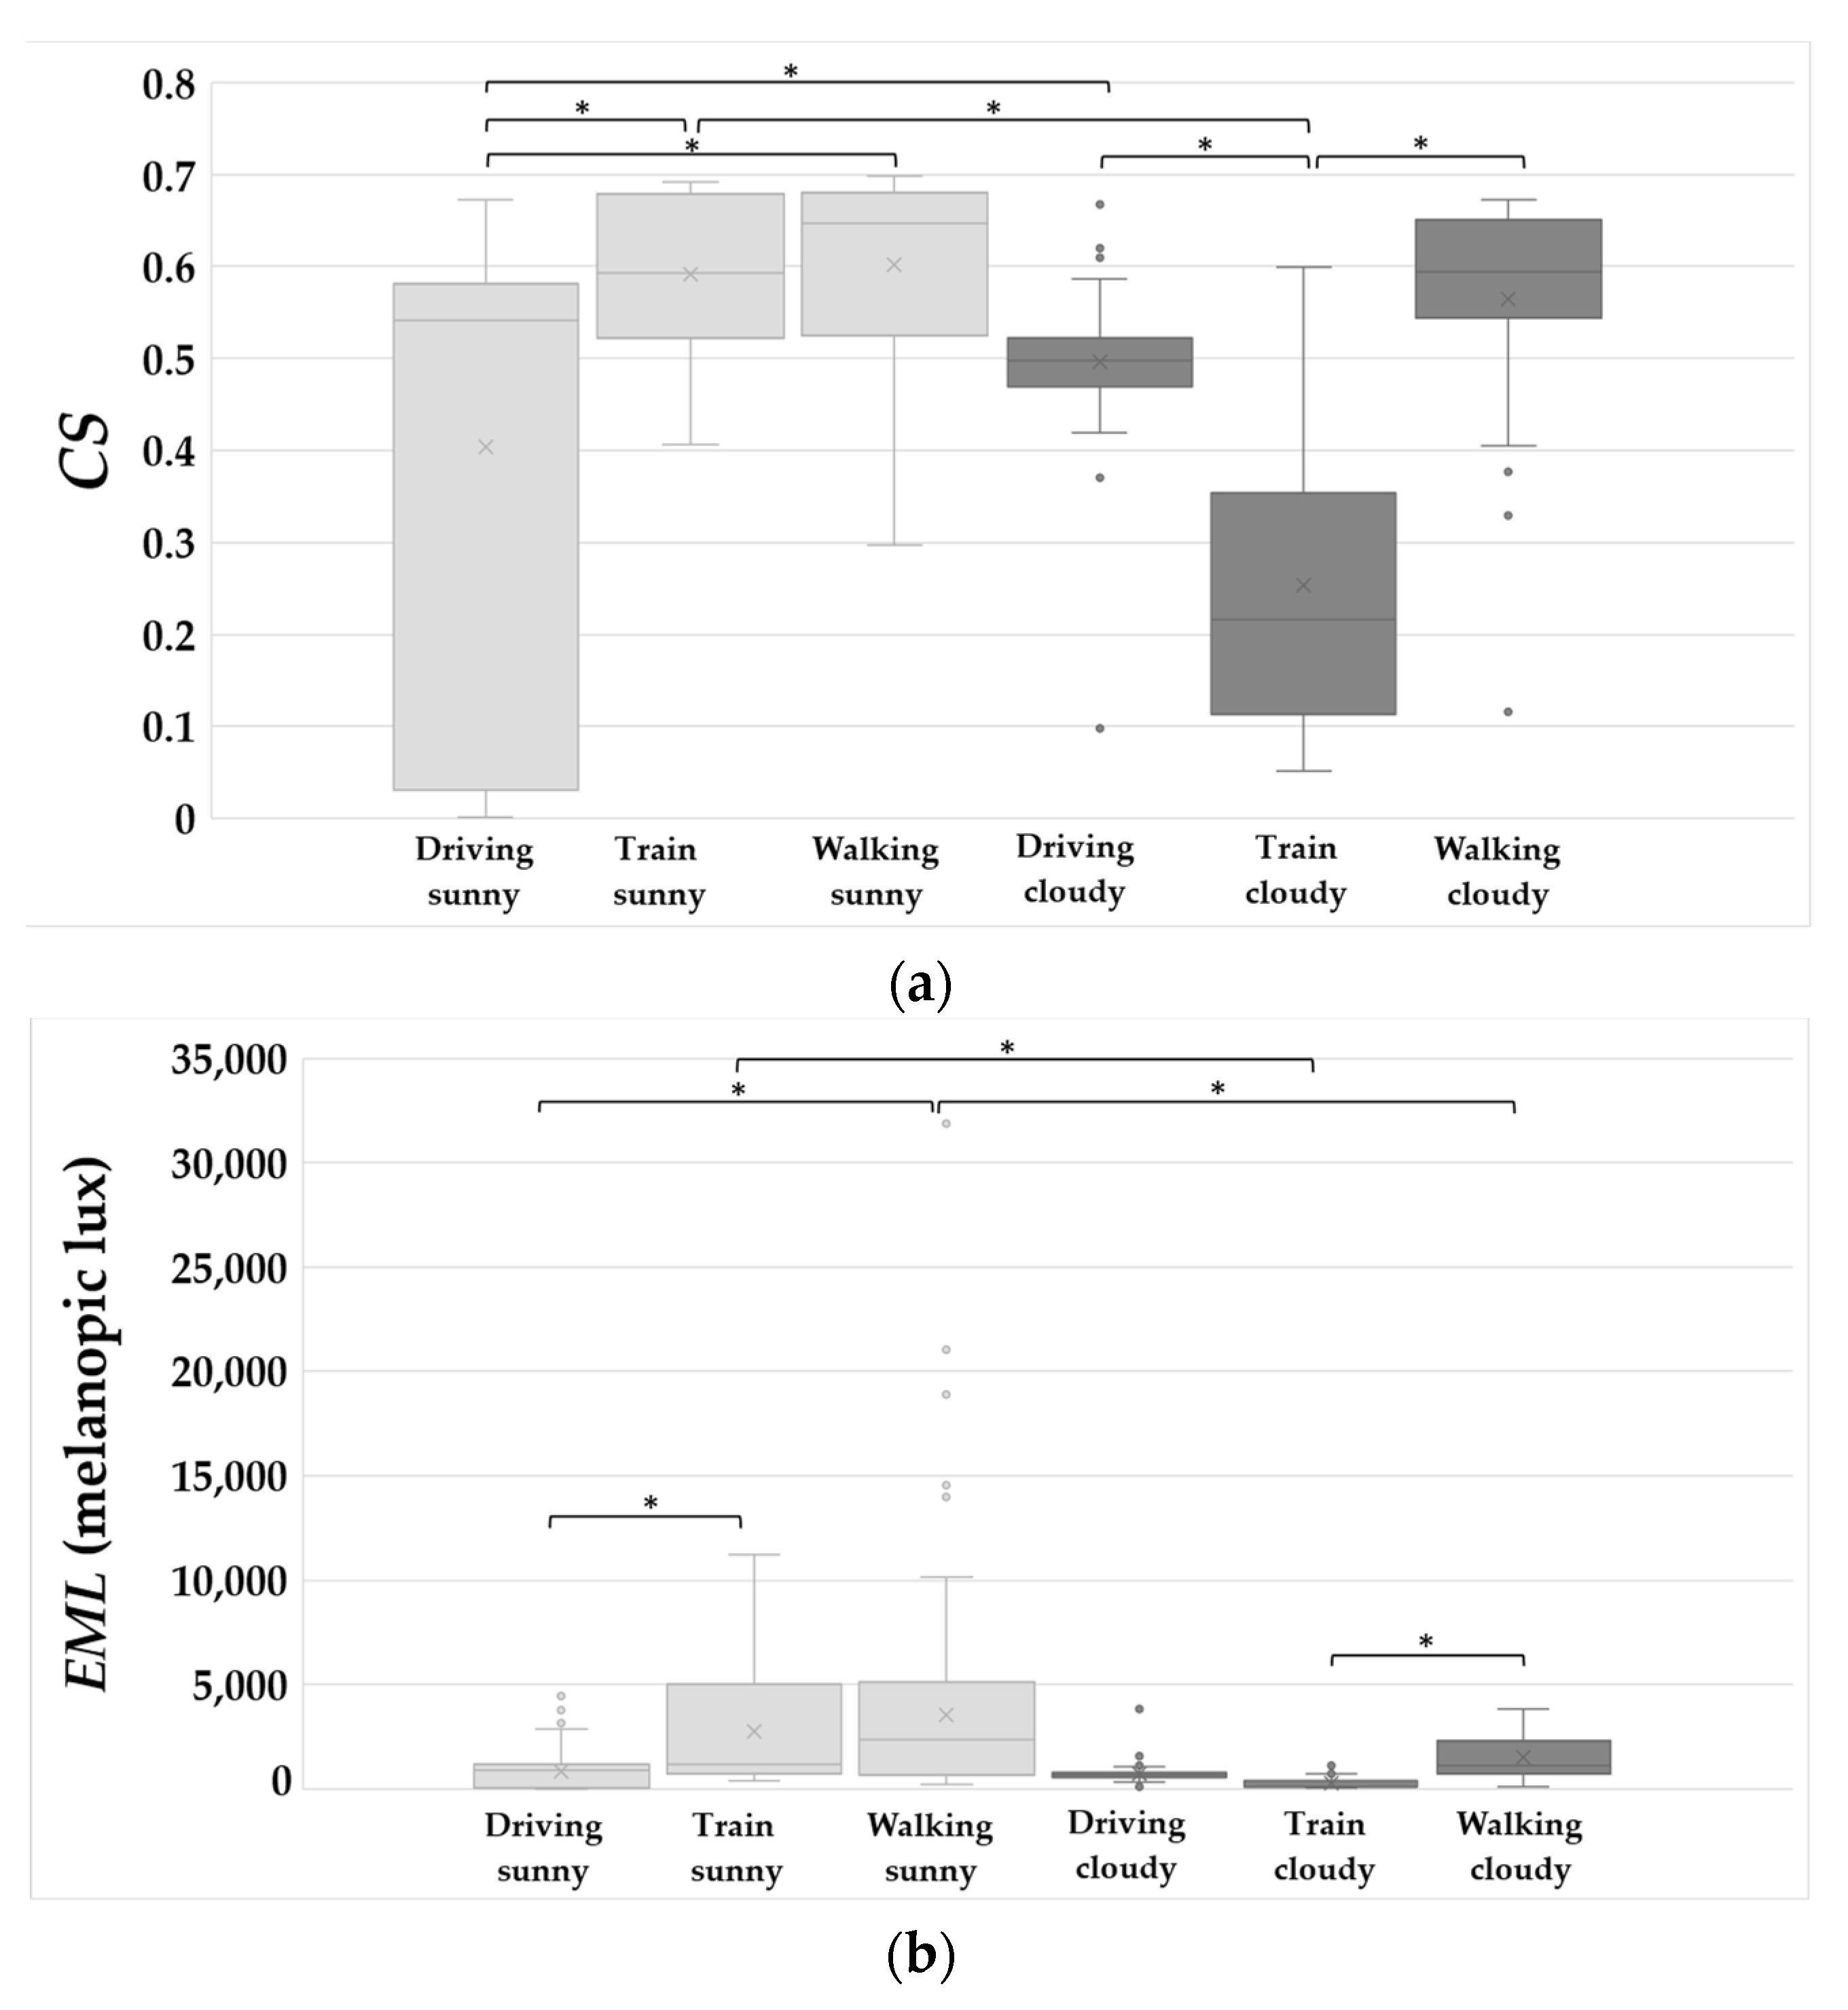
The third method used here is the equivalent melanopic lux (EML), which characterizes the light’s impact on the circadian system in the unit of melanopic lux [19]. It does not reflect modifications of the ipRGCs by the rods or cones [22,31]. With the retinal illuminance and SID, EML can be simply calculated by Equations (4) and (5):
E M L = R   ×   L
R = M e l a n o p i c   i r r a d i a n c e P h o t o p i c   i r r a d i a n c e   ×   1 . 218
where E M L is equivalent melanopic lux and L is illuminance. The 1.218 constant is also called the e q u a l   e n e r g y   c o n s t a n t . R is the ratio of the irradiance weighted by the circadian spectral sensitivity function and the irradiance weighted by the photopic spectral sensitivity function, multiplied by a constant. The constant ensures that the melanopic illuminance is equivalent to the photopic illuminance for a theoretical equal energy radiator [19]. The circadian spectral sensitivity function used in this equation is also from the work of Lucas et al. [22].

3. Results

In total, 21 commuting trips were taken to measure the illuminance and SIDs, with seven trips taken for each mode of commuting. The seven trips were then categorized into two groups based on their weather conditions, sunny or cloudy. The sunny group includes trips that were taken when the weather conditions were sunny, mostly sunny, or partly cloudy—i.e., when the daylight was intense. The cloudy group includes trips that were taken when the weather conditions were cloudy or mostly cloudy—i.e., when the daylight was relatively weak. Table 2 shows the number of trips categorized in the sunny group, the cloudy group, and the total for each commuting mode. In total, 732 SID measurements were collected during these 21 trips. Table 3 shows the number of SID measurements that were taken for each commuting mode in the different weather conditions, reflecting the uneven sample size of each group. Figure 3 shows the representative relative spectral power distributions measured for each of the three commuting modes for the two weather conditions. It is clear that the interior lighting in the trains dominates daylight, as the spectral power distributions for the train trips predominately correspond to those of white light-emitting diodes (LEDs).
The average values and standard deviations for the illuminance, the five α-opic irradiances (S-cone, M-cone, L-cone, rhodopic, and melanopic), CS, and EML for each of the three commuting modes are shown in Table 4. The table also distinguishes the results for the sunny and cloudy weather conditions. Box plots of the measured corneal illuminances and the five calculated α-opic irradiance values are shown in Figure 4. One-way analysis of variance (ANOVA) tests (p < 0.05) of the illuminance and the five α-opic irradiances were performed in MATLAB to determine whether there are statistically significant differences between the different modes of commuting in different weather conditions. Any significant differences (p < 0.05) are denoted with asterisks in Figure 4. The average illuminances and the average α-opic irradiances are higher for the sunny weather conditions than the cloudy conditions for each mode of commuting. The average illuminances and average α-opic irradiances are highest for the walking mode of commuting, while driving resulted in the lowest light exposure.
Box plots of the calculated CS and EML values for the three modes of commuting under the two weather conditions are shown in Figure 5. One-way ANOVA tests (p < 0.05) of CS and EML were performed in MATLAB to determine whether there are statistically significant differences between the different modes of commuting in different weather conditions. Any significant differences (p < 0.05) are denoted with asterisks in Figure 5. The average CS and EML values are shown in Table 4. The suggested desired criterion of CS is 0.3, with the condition that the light exposure is one hour in duration [12,32,34,35]. When the CS value is over 0.3, people who are exposed to such lighting conditions will have better daytime alertness and sleep quality [12,32,34,35]. As the average commuting time of employed Australians was one hour (66 min in mainland capital cities, and 48 min in others) [14], 0.3 is used here. As shown in Table 4, the average CS value for riding trains in cloudy conditions (0.25) is slightly below the desired criterion (0.3), but others are all above it. The suggested value of the EML depends on the space. For example, 200 melanopic lux is the recommended minimum level for a work area [19]. Although there is no recommended criterion for commuting, 200 melanopic lux is applied here, since the purpose of this study is to analyze daylight’s impact on people while they are commuting, before they spend the rest of the day at their workplaces. As shown in Table 4, all average EML values exceed the EML recommended value (200 melanopic lux), including riding trains in cloudy conditions (260 melanopic lux).
As shown in Table 4, the calculation results for α-opic irradiance and EML show a consistent trend—the average values for sunny conditions are all higher than the average values for cloudy conditions, which suggests that commuting on sunny days results in greater circadian impacts than traveling on cloudy days. For walking and traveling by train, these differences were statistically significant, but the differences between driving in sunny conditions and cloudy conditions were not significant. Interestingly, the average CS is smaller for driving in sunny conditions (0.40) than in cloudy conditions (0.50), and this difference was statistically significant. Similarly, CS predicts that driving results in greater circadian stimulation than riding a train, which is contrary to the predictions of the other metrics. Driving has the lowest average α-opic irradiance and EML values, but the CS (0.43) for driving is not lower than riding trains. Riding trains has the lowest average CS value (0.34), but α-opic irradiance and EML are higher for riding trains than driving. The illuminance measurements are consistent with the α-opic irradiance and EML calculation results. The average illuminance when driving in sunny conditions are higher than in cloudy conditions, and the average illuminance when riding trains is higher than when driving. However, one cannot conclude that the α-opic irradiance and EML are more accurate than the CS based on the illuminance measurements, as a higher photopic intensity of light doesn’t necessarily result in greater circadian effects. Several characteristics of light influence the circadian rhythms interactively: spectrum [2,36,37,38], intensity [39], duration [40], timing [5,6], and spatial distribution [41,42,43,44]. It is also unclear the extent to which the contribution of the electrical lighting in trains (i.e., the fact that the spectral power distributions largely correspond to LEDs) influences these findings. Further studies should be conducted to investigate the inconsistent predictions between these metrics.

4. Discussion

In this study, a total of 732 SID measurements were recorded during 21 trips for the three modes of commuting: driving, taking trains, and walking. The measurements were then categorized into two groups based on the weather conditions, sunny or cloudy. Three metrics (α-opic irradiance, CS, and EML) were used to quantify the circadian impact of light on commuters. The results of the CS and EML were compared to their recommended minimum values. The light exposure measured when riding trains in cloudy conditions was below the CS desired criterion, but above the EML recommended value. However, the CS and EML results for driving and walking in both sunny and cloudy conditions, as well as riding trains in sunny conditions, exceed the recommended values for both metrics. This suggests that riding trains on sunny days and driving or walking in all weather conditions can be beneficial for commuters’ circadian synchronization to the local day–night cycle and is likely to improve commuters’ daytime alertness and sleep quality [12,19,32,34,35,45].

Limitations

Although the results suggest a positive circadian impact of daylight on commuters, it should be noted that the measurements were conducted in a metropolitan environment in Sydney, Australia and this conclusion may not apply to all circumstances or age groups. For example, travelling in suburban areas may result in a higher circadian impact than travelling in a central business district, as suburban areas have fewer tall buildings that can block the light [10]. Travelling toward the light source (sun) will result in more circadian effects than travelling away from the light source. Older individuals may be impacted differently than younger people traveling on the same commute, as lens transmittances varies with age [46]. While people are commuting, many factors affect how much daylight people are exposed to, and not all these factors were reflected in these measurements. For example, wearing sunglasses will reduce the amount of light entering the eyes and, consequently, reduce the circadian impacts. Wearing a pair of prescription glasses with blue light filters may also reduce the circadian impacts compared with wearing glasses without filters, as the human circadian systems are most sensitive to blue light [2,36,37,38]. These measurements were taken in the summer and autumn and the effects of commuting on circadian entrainment may differ in the winter and spring. The Sydney peak morning commuting hours occur after the sun has risen [47] year-round and the sun angle is lower in winter [48], so it’s possible that commuters’ corneas would receive more light in winter than in summer, which would lead to a greater circadian impact.
In this research, no physiological measurements were made. The conclusions are based on the calculated results of the three metrics. When the CS value is over 0.3 and EML value is over 200 melanopic lux, the lighting conditions can be beneficial to people’s circadian synchronization to the local day–night cycle, and are likely to improve one’s daytime alertness and sleep quality [12,19,32,34,35,45]. However, the improvement of daytime alertness and sleep quality from daytime light exposure can be varied between different individuals. A recent literature review conducted by Lok et al. shows that the non-visual effects of light on subjective alertness and sleepiness are inconclusive [49]. Several studies also show inconclusive results [50,51,52]. There are also some inconsistencies between the results of the three metrics reported in this paper. The results of this study cannot conclude which metric is more accurate. Future research could investigate this inconsistency by measuring a circadian rhythm marker, such as melatonin suppression [7], pupil constriction [53], phase shifting [41], and/or changes in core body temperature [54], to identify the actual circadian effects of commuting on people.
Several studies have used the melanopic equivalent daylight (D65) illuminance (melanopic EDI) to quantify light’s circadian impact [55,56,57]. In addition to the five α-opic irradiances, the melanopic EDI is defined as one of the five α-opic equivalent daylight (D65) illuminances (α-opic EDIs) by the CIE in CIE S 026/E:2018 [16]. It can be simply calculated as the melanopic irradiance divided by the melanopic efficacy of the luminous radiation for daylight (D65), which is 1.3262 (mW/lm) [16]. Compared with other types of cells, the melanopsin-based ipRGCs predominantly contribute to the non-visual effects, including circadian impacts [25,57,58,59]. However, the actual non-visual effects from light exposure rely on the combined responses of all photoreceptors [16,22]. It is necessary to report the response of each photoreceptor type [16]. As the five α-opic irradiances and five α-opic EDIs can be easily converted between each other, to avoid repetition, only irradiances are reported here. Readers who are interested in melanopic EDI values can calculate them from the α-opic irradiances.
A new version of the CS was published in 2021 [33] during the preparation of this paper. Two factors were introduced into the CS equation: a duration factor, which indicates the duration of light exposure (ranging from 0.5 h to 3.0 h), and a distribution factor, which is a variable equal to 2, 1, or 0.5 corresponding to three visual field conditions (full visual field, central visual field, and superior visual field) [33]. The older version of the CS requires the light duration to be one hour or more, and it doesn’t take the distribution of light exposure across the retina into consideration. However, the new CS equation can be used to predict melatonin suppression for different light exposure durations and different distributions. Instead of applying the new version of the CS, this paper used the older version [17,18,32] to calculate the CS value, which has been validated [60,61,62,63] and used [12,13,45,60,64] in several papers. More details about the new version of the CS metric and its limitations are reported in Rea et al.’s publication [33].

Author Contributions

Conceptualization, Y.L., W.H., W.D.; methodology, Y.L., W.H., W.D.; software, Y.L.; validation, Y.L., W.H., W.D.; formal analysis, Y.L.; investigation, Y.L.; resources, W.H., W.D.; data curation, Y.L.; writing—original draft preparation, Y.L.; writing—review and editing, W.H., W.D.; visualization, Y.L.; supervision, W.H., W.D.; project administration, Y.L., W.H., W.D. All authors have read and agreed to the published version of the manuscript.

Funding

This research received no external funding.

Institutional Review Board Statement

Not applicable.

Informed Consent Statement

Not applicable.

Data Availability Statement

The data supporting the results of this study are available on request from the corresponding author, Y.L.

Conflicts of Interest

The authors declare no conflict of interest.

References

  1. Lewy, A.J.; Wehr, T.A.; Goodwin, F.K.; Newsome, D.A.; Markey, S.P. Light Suppresses Melatonin Secretion in Humans. Science 1980, 210, 1267–1269. [Google Scholar] [CrossRef]
  2. Berson, D.M.; Dunn, F.A.; Takao, M. Phototransduction by Retinal Ganglion Cells That Set the Circadian Clock. Science 2002, 295, 1070–1073. [Google Scholar] [CrossRef] [PubMed] [Green Version]
  3. Duffy, J.F.; Wright, K.P. Entrainment of the Human Circadian System by Light. J. Biol. Rhythm. 2005, 20, 326–338. [Google Scholar] [CrossRef]
  4. Khalsa, S.B.S.; Jewett, M.E.; Cajochen, C.; Czeisler, C.A. A Phase Response Curve to Single Bright Light Pulses in Human Subjects. J. Physiol. 2003, 549, 945–952. [Google Scholar] [CrossRef] [PubMed]
  5. Hébert, M.; Martin, S.K.; Lee, C.; Eastman, C.I. The Effects of Prior Light History on the Suppression of Melatonin by Light in Humans. J. Pineal Res. 2002, 33, 198–203. [Google Scholar] [CrossRef] [PubMed] [Green Version]
  6. Chang, A.-M.; Scheer, F.A.J.L.; Czeisler, C.A. The Human Circadian System Adapts to Prior Photic History. J. Physiol. 2011, 589, 1095–1102. [Google Scholar] [CrossRef]
  7. Jasser, S.A.; Hanifin, J.P.; Rollag, M.D.; Brainard, G.C. Dim Light Adaptation Attenuates Acute Melatonin Suppression in Humans. J. Biol. Rhythm. 2006, 21, 394–404. [Google Scholar] [CrossRef] [PubMed]
  8. Smith, K.A.; Schoen, M.W.; Czeisler, C.A. Adaptation of Human Pineal Melatonin Suppression by Recent Photic History. J. Clin. Endocrinol. Metab. 2004, 89, 3610–3614. [Google Scholar] [CrossRef] [PubMed]
  9. Lunn, R.M.; Blask, D.E.; Coogan, A.N.; Figueiro, M.G.; Gorman, M.R.; Hall, J.E.; Hansen, J.; Nelson, R.J.; Panda, S.; Smolensky, M.H.; et al. Health Consequences of Electric Lighting Practices in the Modern World: A Report on the National Toxicology Program’s Workshop on Shift Work at Night, Artificial Light at Night, and Circadian Disruption. Sci. Total Environ. 2017, 607–608, 1073–1084. [Google Scholar] [CrossRef] [PubMed] [Green Version]
  10. Zielinska-Dabkowska, K.M.; Xavia, K. Protect Our Right to Light. Nature 2019, 568, 451–453. [Google Scholar] [CrossRef] [PubMed]
  11. Touitou, Y.; Reinberg, A.; Touitou, D. Association between Light at Night, Melatonin Secretion, Sleep Deprivation, and the Internal Clock: Health Impacts and Mechanisms of Circadian Disruption. Life Sci. 2017, 173, 94–106. [Google Scholar] [CrossRef]
  12. Figueiro, M.G.; Steverson, B.; Heerwagen, J.; Kampschroer, K.; Hunter, C.M.; Gonzales, K.; Plitnick, B.; Rea, M.S. The Impact of Daytime Light Exposures on Sleep and Mood in Office Workers. Sleep Health 2017, 3, 204–215. [Google Scholar] [CrossRef] [PubMed]
  13. Chen, S.; Wei, M.; Dai, Q.; Huang, Y. Estimation of Possible Suppression of Melatonin Production Caused by Exterior Lighting in Commercial Business Districts in Metropolises. LEUKOS 2020, 16, 137–144. [Google Scholar] [CrossRef] [Green Version]
  14. Wilkins, R.; Laß, I.; Butterworth, P.; Vera-Toscano, E. The Household, Income and Labour Dynamics in Australia Survey: Selected Findings from Waves 1 to 17; Melbourne Institute: Applied Economic & Social Research, University of Melbourne: Melbourne, Australia, 2019. [Google Scholar]
  15. Klepeis, N.E.; Nelson, W.C.; Ott, W.R.; Robinson, J.P.; Tsang, A.M.; Switzer, P.; Behar, J.V.; Hern, S.C.; Engelmann, W.H. The National Human Activity Pattern Survey (NHAPS): A Resource for Assessing Exposure to Environmental Pollutants. J. Expo. Sci. Environ. Epidemiol. 2001, 11, 231–252. [Google Scholar] [CrossRef] [Green Version]
  16. CIE CIE S 026/E:2018; CIE System for Metrology of Optical Radiation for IpRGC-Influenced Responses to Light; International Commission on Illumination (CIE), CIE Central Bureau: Vienna, Austria, 2018.
  17. Rea, M.S.; Figueiro, M.G.; Bullough, J.D.; Bierman, A. A Model of Phototransduction by the Human Circadian System. Brain Res. Rev. 2005, 50, 213–228. [Google Scholar] [CrossRef] [PubMed]
  18. Rea, M.; Figueiro, M.; Bierman, A.; Hamner, R. Modelling the Spectral Sensitivity of the Human Circadian System. Lighting Res. Technol. 2012, 44, 386–396. [Google Scholar] [CrossRef]
  19. Circadian Lighting Design|WELL Standard. Available online: https://standard.wellcertified.com/light/circadian-lighting-design (accessed on 11 May 2020).
  20. Urban Living Index–Measuring the Urban Lifestyle of Your Suburb. Available online: https://urbanlivingindex.com/ (accessed on 24 October 2021).
  21. Australian Bureau of Statistics Web Site-Populations of Interest: Housing Characteristics. Available online: https://absstats.maps.arcgis.com/apps/MapSeries/index.html?appid=6ac28a3a3ba141eb99b226ca87983e41 (accessed on 25 October 2021).
  22. Lucas, R.J.; Peirson, S.N.; Berson, D.M.; Brown, T.M.; Cooper, H.M.; Czeisler, C.A.; Figueiro, M.G.; Gamlin, P.D.; Lockley, S.W.; O’Hagan, J.B.; et al. Measuring and Using Light in the Melanopsin Age. Trends Neurosci. 2014, 37, 1–9. [Google Scholar] [CrossRef] [PubMed]
  23. Launch of CIE S 026 Toolbox and User Guide|CIE. Available online: https://cie.co.at/news/launch-cie-s-026-toolbox-and-user-guide (accessed on 25 November 2021).
  24. Rea, M.S.; Figueiro, M.G. A Working Threshold for Acute Nocturnal Melatonin Suppression from “White” Light Sources Used in Architectural Applications. J. Carcinog. Mutagen. 2013, 4, 3. [Google Scholar] [CrossRef]
  25. Brainard, G.C.; Hanifin, J.P.; Greeson, J.M.; Byrne, B.; Glickman, G.; Gerner, E.; Rollag, M.D. Action Spectrum for Melatonin Regulation in Humans: Evidence for a Novel Circadian Photoreceptor. J. Neurosci. 2001, 21, 6405–6412. [Google Scholar] [CrossRef] [PubMed] [Green Version]
  26. Thapan, K.; Arendt, J.; Skene, D.J. An Action Spectrum for Melatonin Suppression: Evidence for a Novel Non-Rod, Non-Cone Photoreceptor System in Humans. J. Physiol. 2001, 535, 261–267. [Google Scholar] [CrossRef] [PubMed]
  27. Smith, V.C.; Pokorny, J.; Gamlin, P.D.; Packer, O.S.; Peterson, B.B.; Dacey, D.M. Functional Architecture of the Photoreceptive Ganglion Cell in Primate Retina: Spectral Sensitivity and Dynamics of the Intrinsic Response. Investig. Ophthalmol. Vis. Sci. 2003, 44, 5185. [Google Scholar]
  28. Smith, V.C.; Pokorny, J. Spectral Sensitivity of the Foveal Cone Photopigments between 400 and 500 Nm. Vis. Res. 1975, 15, 161–171. [Google Scholar] [CrossRef]
  29. Snodderly, D.M.; Brown, P.K.; Delori, F.C.; Auran, J.D. The Macular Pigment. I. Absorbance Spectra, Localization, and Discrimination from Other Yellow Pigments in Primate Retinas. Investig. Ophthalmol. Vis. Sci. 1984, 25, 660–673. [Google Scholar]
  30. Photometry-The CIE System of Physical Photometry|CIE. Available online: https://cie.co.at/publications/photometry-cie-system-physical-photometry (accessed on 25 October 2021).
  31. Al Enezi, J.; Revell, V.; Brown, T.; Wynne, J.; Schlangen, L.; Lucas, R. A “Melanopic” Spectral Efficiency Function Predicts the Sensitivity of Melanopsin Photoreceptors to Polychromatic Lights. J. Biol. Rhythm. 2011, 26, 314–323. [Google Scholar] [CrossRef]
  32. Rea, M.; Figueiro, M. Light as a Circadian Stimulus for Architectural Lighting. Lighting Res. Technol. 2018, 50, 497–510. [Google Scholar] [CrossRef]
  33. Rea, M.S.; Nagare, R.; Figueiro, M.G. Modeling Circadian Phototransduction: Quantitative Predictions of Psychophysical Data. Front. Neurosci. 2021, 15, 44. [Google Scholar] [CrossRef]
  34. Figueiro, M.; Kalsher, M.; Steverson, B.; Heerwagen, J.; Kampschroer, K.; Rea, M. Circadian-Effective Light and Its Impact on Alertness in Office Workers. Lighting Res. Technol. 2019, 51, 171–183. [Google Scholar] [CrossRef]
  35. Figueiro, M.; Steverson, B.; Heerwagen, J.; Yucel, R.; Roohan, C.; Sahin, L.; Kampschroer, K.; Rea, M. Light, Entrainment and Alertness: A Case Study in Offices. Lighting Res. Technol. 2019, 52, 736–750. [Google Scholar] [CrossRef]
  36. Dacey, D.M.; Liao, H.-W.; Peterson, B.B.; Robinson, F.R.; Smith, V.C.; Pokorny, J.; Yau, K.-W.; Gamlin, P.D. Melanopsin-Expressing Ganglion Cells in Primate Retina Signal Colour and Irradiance and Project to the LGN. Nature 2005, 433, 749–754. [Google Scholar] [CrossRef]
  37. Gamlin, P.D.R.; McDougal, D.H.; Pokorny, J.; Smith, V.C.; Yau, K.-W.; Dacey, D.M. Human and Macaque Pupil Responses Driven by Melanopsin-Containing Retinal Ganglion Cells. Vis. Res. 2007, 47, 946–954. [Google Scholar] [CrossRef] [Green Version]
  38. Lucas, R.J.; Freedman, M.S.; Muñoz, M.; Garcia-Fernández, J.-M.; Foster, R.G. Regulation of the Mammalian Pineal by Non-Rod, Non-Cone, Ocular Photoreceptors. Science 1999, 284, 505–507. [Google Scholar] [CrossRef]
  39. Mclntyre, I.M.; Norman, T.R.; Burrows, G.D.; Armstrong, S.M. Human Melatonin Suppression by Light Is Intensity Dependent. J. Pineal Res. 1989, 6, 149–156. [Google Scholar] [CrossRef] [PubMed]
  40. McIntyre, I.M.; Norman, T.R.; Burrows, G.D.; Armstrong, S.M. Quantal Melatonin Suppression by Exposure to Low Intensity Light in Man. Life Sci. 1989, 45, 327–332. [Google Scholar] [CrossRef]
  41. Rüger, M.; Gordijn, M.C.M.; Beersma, D.G.M.; de Vries, B.; Daan, S. Nasal versus Temporal Illumination of the Human Retina: Effects on Core Body Temperature, Melatonin, and Circadian Phase. J. Biol. Rhythm. 2005, 20, 60–70. [Google Scholar] [CrossRef] [Green Version]
  42. Glickman, G.; Hanifin, J.P.; Rollag, M.D.; Wang, J.; Cooper, H.; Brainard, G.C. Inferior Retinal Light Exposure Is More Effective than Superior Retinal Exposure in Suppressing Melatonin in Humans. J. Biol. Rhythm. 2003, 18, 71–79. [Google Scholar] [CrossRef]
  43. Visser, E.K.; Beersma, D.G.M.; Daan, S. Melatonin Suppression by Light in Humans Is Maximal When the Nasal Part of the Retina Is Illuminated. J. Biol. Rhythm. 1999, 14, 116–121. [Google Scholar] [CrossRef] [PubMed] [Green Version]
  44. Lasko, T.A.; Kripke, D.F.; Elliot, J.A. Melatonin Suppression by Illumination of Upper and Lower Visual Fields. J. Biol. Rhythm. 1999, 14, 122–125. [Google Scholar] [CrossRef]
  45. Jarboe, C.; Snyder, J.; Figueiro, M. The Effectiveness of Light-Emitting Diode Lighting for Providing Circadian Stimulus in Office Spaces While Minimizing Energy Use. Lighting Res. Technol. 2020, 52, 167–188. [Google Scholar] [CrossRef]
  46. Charman, W.N. Age, Lens Transmittance, and the Possible Effects of Light on Melatonin Suppression. Ophthalmic Physiol. Opt. 2003, 23, 181–187. [Google Scholar] [CrossRef] [PubMed]
  47. Australia, G. Astronomical Information. Available online: https://www.ga.gov.au/scientific-topics/astronomical (accessed on 27 September 2021).
  48. Khavrus, V.; Shelevytsky, I. Introduction to Solar Motion Geometry on the Basis of a Simple Model. Phys. Educ. 2010, 45, 641–653. [Google Scholar] [CrossRef]
  49. Lok, R.; Smolders, K.C.H.J.; Beersma, D.G.M.; de Kort, Y.A.W. Light, Alertness, and Alerting Effects of White Light: A Literature Overview. J. Biol. Rhythm. 2018, 33, 589–601. [Google Scholar] [CrossRef] [PubMed] [Green Version]
  50. Segal, A.Y.; Sletten, T.L.; Flynn-Evans, E.E.; Lockley, S.W.; Rajaratnam, S.M.W. Daytime Exposure to Short- and Medium-Wavelength Light Did Not Improve Alertness and Neurobehavioral Performance. J. Biol. Rhythm. 2016, 31, 470–482. [Google Scholar] [CrossRef] [PubMed] [Green Version]
  51. Phipps-Nelson, J.; Redman, J.R.; Dijk, D.-J.; Rajaratnam, S.M.W. Daytime Exposure to Bright Light, as Compared to Dim Light, Decreases Sleepiness and Improves Psychomotor Vigilance Performance. Sleep 2003, 26, 695–700. [Google Scholar] [CrossRef] [PubMed]
  52. Gornicka, G.B. Lighting at Work: Environmental Study of Direct Effects of Lighting Level and Spectrum on Psychophysiological Variables. Ph.D. Thesis, Technische Universiteit Eindhoven, Eindhoven, The Netherlands, 2008. [Google Scholar]
  53. Zele, A.J.; Feigl, B.; Smith, S.S.; Markwell, E.L. The Circadian Response of Intrinsically Photosensitive Retinal Ganglion Cells. PLoS ONE 2011, 6, e17860. [Google Scholar] [CrossRef] [PubMed] [Green Version]
  54. Badia, P.; Myers, B.; Boecker, M.; Culpepper, J.; Harsh, J.R. Bright Light Effects on Body Temperature, Alertness, EEG and Behavior. Physiol. Behav. 1991, 50, 583–588. [Google Scholar] [CrossRef]
  55. Kolberg, E.; Pallesen, S.; Hjetland, G.; Nordhus, I.; Thun, E.; Flo-Groeneboom, E. Insufficient Melanopic Equivalent Daylight Illuminance in Nursing Home Dementia Units across Seasons and Gaze Directions. Lighting Res. Technol. 2021. [Google Scholar] [CrossRef]
  56. Houser, K.W.; Esposito, T. Human-Centric Lighting: Foundational Considerations and a Five-Step Design Process. Front. Neurol. 2021, 12, 630553. [Google Scholar] [CrossRef]
  57. Brown, T.M. Melanopic Illuminance Defines the Magnitude of Human Circadian Light Responses under a Wide Range of Conditions. J. Pineal Res. 2020, 69, e12655. [Google Scholar] [CrossRef] [Green Version]
  58. Prayag, A.S.; Najjar, R.P.; Gronfier, C. Melatonin Suppression Is Exquisitely Sensitive to Light and Primarily Driven by Melanopsin in Humans. J. Pineal Res. 2019, 66, e12562. [Google Scholar] [CrossRef] [PubMed]
  59. Brainard, G.C.; Sliney, D.; Hanifin, J.P.; Glickman, G.; Byrne, B.; Greeson, J.M.; Jasser, S.; Gerner, E.; Rollag, M.D. Sensitivity of the Human Circadian System to Short-Wavelength (420-Nm) Light. J. Biol. Rhythms. 2008, 23, 379–386. [Google Scholar] [CrossRef] [Green Version]
  60. Figueiro, M.; Rea, M. Office Lighting and Personal Light Exposures in Two Seasons: Impact on Sleep and Mood. Lighting Res. Technol. 2016, 48, 352–364. [Google Scholar] [CrossRef]
  61. Wood, B.; Rea, M.S.; Plitnick, B.; Figueiro, M.G. Light Level and Duration of Exposure Determine the Impact of Self-Luminous Tablets on Melatonin Suppression. Appl. Ergon. 2013, 44, 237–240. [Google Scholar] [CrossRef] [PubMed]
  62. Figueiro, M.G.; Bullough, J.D.; Bierman, A.; Rea, M.S. Demonstration of Additivity Failure in Human Circadian Phototransduction. Neuro Endocrinol. Lett. 2005, 26, 493–498. [Google Scholar]
  63. Figueiro, M.G.; Bierman, A.; Rea, M.S. Retinal Mechanisms Determine the Subadditive Response to Polychromatic Light by the Human Circadian System. Neurosci. Lett. 2008, 438, 242–245. [Google Scholar] [CrossRef] [PubMed]
  64. Figueiro, M.G.; Wood, B.; Plitnick, B.; Rea, M.S. The Impact of Light from Computer Monitors on Melatonin Levels in College Students. Neuroendocrinol. Lett. 2011, 32, 158–163. [Google Scholar]
Figure 1. Photo of the operator wearing the modified helmet with the sensor attached on it.
Applsci 11 11846 g001
Figure 2. Examples of the GPS route for driving and walking: (a) driving from S point to E point; (b) walking from S point to E point.
Applsci 11 11846 g002
Figure 3. Representative relative spectral power distributions for the three commuting modes, for the two weather conditions (sunny and cloudy): (a) driving sunny; (b) driving cloudy; (c) train sunny; (d) train cloudy; (e) walking sunny; (f) walking cloudy.
Applsci 11 11846 g003
Figure 4. Box plots of the measured corneal illuminance and the five calculated α-opic irradiance values for the three modes of commuting under the two weather conditions (sunny and cloudy): (a) illuminance; (b) S-cone-opic irradiance; (c) M-cone-opic irradiance; (d) L-cone-opic irradiance; (e) rhodopic irradiance; (f) melanopic irradiance. The horizontal lines that divide the boxes into two parts denote the median (middle quartile). The boxes represent the inter-quartile range (the middle 50%), and the upper and lower whiskers show the highest and the lowest non-outliers. The individual points outside the boxes show the outliers. The cross in each box represents the mean. Asterisks indicate statistically significant differences between groups with a p-value < 0.05.
Applsci 11 11846 g004aApplsci 11 11846 g004b
Figure 5. Box plots of calculated CS and EML values for the three modes of commuting in sunny and cloudy conditions: (a) CS; (b) EML. The horizontal lines that divide the boxes into two parts denote the median (middle quartile). The boxes represent the inter-quartile range (the middle 50%), and the upper and lower whiskers show the highest and the lowest non-outliers. The individual points outside the boxes show the outliers. The cross in each box represents the mean. Asterisks indicate statistically significant differences between groups with a p-value < 0.05.
Applsci 11 11846 g005
Table 1. Examples of trip itineraries for three commuting modes.
ModeDateWeatherGPS Coordinates/
Train Stations
TimeNote
StartEndStartEndStartEnd
Driving12 Dec. 2019Mostly cloudyMostly cloudy(−33.882898, 151.121124)(−33.879560, 151.198464)8:409:11Heavy traffic, medium to high-density housing areas
Train18 Dec. 2019SunnySunnyAshfield railway station Parramatta railway station7:398:10facing direction of travel, lower level, no tunnel
Walking19 Mar. 2020SunnySunny(−33.922654, 151.190095)(−33.922073, 151.190443)8:088:34High-density housing areas
Table 2. The number of trips for each commuting mode in different weather conditions.
DrivingTrainWalking
Sunny545
Cloudy232
Total777
Table 3. The number of SID measurements for each commuting mode in different weather conditions.
DrivingTrainWalking
Sunny22269116
Cloudy9719533
Total319264149
Table 4. The average values and standard deviations (SD) of illuminance, S-cone-opic irradiance, M-cone-opic irradiance, L-cone-opic irradiance, rhodopic irradiance, melanopic irradiance, circadian stimulus (CS), and equivalent melanopic lux (EML) for the three commuting modes, for the two weather conditions (sunny and cloudy).
Illuminance
(Lux)
α-Opic Irradiance (W/m2)Circadian Stimulus (Unitless)Equivalent Melanopic Lux (Melanopic Lux)
S-ConeM-ConeL-ConeRhodopicMelanopic
MeanSDMeanSDMeanSDMeanSDMeanSDMeanSDMeanSDMeanSD
Driving
Sunny8197110.520.441.171.011.331.151.070.920.970.830.400.25817702
Cloudy7333820.470.251.040.551.190.620.960.500.870.460.500.06734388
Total7936300.510.401.130.901.281.021.030.820.940.740.430.21792624
Train
Sunny263923441.931.663.773.334.293.823.523.083.232.830.590.0927222380
Cloudy3362720.190.210.450.390.540.440.360.350.310.320.250.16260270
Total93815820.641.151.322.261.522.581.192.121.071.950.340.219031641
Walking
Sunny333944272.513.034.806.255.447.224.555.774.215.280.600.0935424449
Cloudy13138941.110.761.931.312.141.461.901.281.781.200.560.1214961014
Total289140142.202.764.165.674.716.553.965.243.674.800.590.1030894041
Publisher’s Note: MDPI stays neutral with regard to jurisdictional claims in published maps and institutional affiliations.

