Article

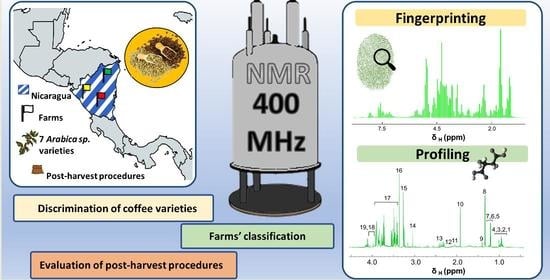
Phenotyping Green and Roasted Beans of Nicaraguan Coffea Arabica Varieties Processed with Different Post-Harvest Practices

1
Magnetic Resonance Center (CERM), University of Florence, 50019 Sesto Fiorentino, Italy
2
Department of Chemistry “Ugo Schiff”, University of Florence, 50019 Sesto Fiorentino, Italy
3
Consorzio Interuniversitario Risonanze Magnetiche di Metallo Proteine (CIRMMP), 50019 Sesto Fiorentino, Italy
4
Home Office, Via Alessandro Manzoni 2, 50121 Florence, Italy
5
Caravela Coffee Ltd., 44-48 Waterside Wharf Road n.1, London N1 7UX, UK
*
Authors to whom correspondence should be addressed.
Appl. Sci. 2021, 11(24), 11779; https://doi.org/10.3390/app112411779
Submission received: 28 October 2021 / Revised: 30 November 2021 / Accepted: 3 December 2021 / Published: 11 December 2021

Abstract

:
Metabolomic tecniques have already been used to characterize two of the most common coffee species, C. arabica and C. canephora, but no studies have focused on the characterization of green and roasted coffee varieties of a certain species. We aim to provide, using NMR-based metabolomics, detailed and comprehensive information regarding the compositional differences of seven coffee varieties (C. arabica) of green and roasted coffee bean batches from Nicaragua. We also evaluated how different varieties react to the same post-harvest procedures such as fermentation time, type of drying and roasting. The characterization of the metabolomic profile of seven different Arabica varieties (Bourbon-typica), allowed us also to assess the possible use of an NMR spectra of bean aqueous extracts to recognize the farm of origin, even considering different farms from the same geographical area (Nueva Segovia). Here, we also evaluated the effect of post-harvest procedures such as fermentation time and type of drying on green and roasted coffee, suggesting that post-harvest procedures can be responsible for different flavours. This study provides proof of concept for the ability of NMR to phenotype coffee, helping to authenticate and optimise the best way of processing coffee.

Graphical Abstract

1. Introduction

Green coffee beans are one of the most traded commodities, and coffee is the most consumed beverage after water [1]. Its popularity is due to the attractive organoleptic and energetic characteristics of coffee [2]. The quality of coffee principally derives from the grade of green coffee beans that are influenced by several factors, including genetics, geographic localization, altitude of the plantation, climate, agricultural and postharvest processing factors [3,4]. Moreover, the different processing techniques of coffee beans can impact the final product. Usually, in wet-processed coffee, freshly harvested coffee cherries are de-pulped to remove the skin and most of the fruit around the bean. Then, de-pulped coffee beans are placed in tanks where they can naturally ferment for 12–24 h. This fermentation begins to break down the mucilage, which is a sugary, slimy substance that surrounds the beans. Then, the coffee is dried on courtyards under the direct sun or in shade. The exact implementation of these steps influences the organoleptic properties and the quality of the product [5], which can be described also by the presence and the concentration of certain metabolites (small molecules < 1500 Da) in coffee beans [6]. These differences in metabolites can be therefore used as indicators of coffee quality, and can potentially direct the agronomic and post-harvest procedures to a high-quality grade final product [7].
Metabolomics, the omic science that deals with metabolites the final products of all biochemical reactions occurring in a certain biological system, can be considered an optimal tool to characterize the totality of genetic and environmental interactions and their effect on coffee [8]. Therefore, understanding how different factors affect coffee metabolites could be crucial to improve coffee quality. Most of the commonly used analytical techniques have been extensively applied to characterize the levels of certain specific chemical components (e.g., sugars, caffeine, trigonelline, phenolics, tocopherols, chlorogenic acids and lipids) and the metabolic profiles of the two mostly traded coffee species, Coffea arabica and C. canephora (Robusta) [7,9,10,11,12]. The profiles of Arabica and Robusta species can be distinguished using fatty acids, amino acid enantiomers, caffeine and other xanthine alkaloids, chlorogenic acid concentration, as well as other compounds (furans, phenols, quinic acids, pyridines, biogenic amines, terpenes and steroids) [13]. Arabica coffee accounts for 60% of global production and is preferred by customers due to its distinct flavor and aroma [14]. There are currently more than 50 commercially grown Arabica coffee cultivars but with different traits that can be classified into four groups based on their genetic descriptions: Ethiopian Landrace, Bourbon-Typica group, Introgressed, and F1 Hybrid [15]. However, little is known about the chemical differences between coffee varieties [6,16,17]. Considering that coffee species have demonstrated to react differently to external stimuli, it could be interesting to evaluate how different varieties of the same species and cultivation type, react if exposed to the identical post-harvest conditions or roasting procedure. Mengistu et al. 2020, demonstrated that different coffee varieties of C. arabica grown in the north-western highlands of Ethiopia are characterized by different levels of trigonelline, chlorogenic acids and caffeine. However, at present there are no metabolomic based studies determining the fingerprint and the profile of green and roasted beans of different coffee varieties. Here, NMR-based metabolomics is applied to characterize seven different coffee varieties of the same species (C. arabica) and the same cultivation type (Bourbon-Typica) localized within the same geographic area of Nicaragua. Moreover, we evaluated how they differently react to the same post-harvest procedure and to the same roasting time and temperature. The experimental design also allowed us to evaluate the differences between the same varieties grown by different farms located within the same territory. The possibility to characterize the profile of coffee of different producers, localized within a restricted geographic area, as previously demonstrated by our group in cow’s milk [18], could be of potential interest for precise authentication. This could pave the way for the authentic territorial characterization of specialty coffees. Identifying qualitative attributes and characteristic metabolomic profiles of each producer and promoting transparency concerning its origin could help individual farmers to add value to their products and become more involved in upgrading strategies.

2. Materials and Methods

2.1. Coffee Beans

A total of 36 green coffee beans batches were collected in 2019 from three distinct farms (farm 1: 13°47′11.8″ N 86°32′46.5″ W, 1155 m AMSL (above mean sea level); farm 2: 13°45′08.8″N 86°29′42.3″ W, 1033 m AMSL; farm 3: 13°44′36.1″ N 86°24′25.0″ W, 696 m AMSL) localized in the Nicaraguan department of Nueva Segovia. Table 1 shows all the characteristics of each batch. A total of seven different coffee varieties (C. arabica, Bourbon-Typica) have been collected: catuai rojo (CR, number of coffee batches = 8), maracaturra (MC, n = 4), bourbon (BO, n = 8), caturra (CA, n = 4), pacamara (PA, n = 4), tekesic (TE, n = 4), bourbon rojo (BR, n = 4). Selected varieties are recognized by name according to information provided by the growers. With the aim to evaluate the effect of the different types of green coffee processing, we considered for each variety two different times of fermentation (12 h and 24 h duration), and two drying procedures after full washing, namely “under shade” (Us) and “direct sun” (Ds), see Table 1. Green bean batches (80 g) were roasted by Caravela Ltd. (London, UK) using an IKAWA professional roaster (IKAWA Ltd., London, UK) at 220 °C for 5:30 min.

2.2. NMR Samples

Seven beans for each batch were grounded using a Caso 1830 coffee grinder, which was thoroughly cleaned between the grinding of each sample. A total of ~0.2 g of crushed beans were weighed into 2 mL Eppendorf tubes and 1 mL of ultrapure H2O (Synergy®, Merck KGaA, Darmstadt, Germany) was added to each sample. Samples were centrifuged 5 min at 14,000 RCF (room temperature) and then incubated at 95 °C in closed 2 mL Eppendorf tubes for 1 h. The aqueous extracts were centrifuged for 5 min at 14,000 RCF at 4 °C to let the solid debris settle. Then, 300 μL of the supernatant were transferred into a new 1.5 mL Eppendorf tube and mixed with 300 μL of phosphate buffer (1.5 M K2HPO4, 100% (v/v) 2H2O, 2 mM NaN3, 5.8 mM TSP; pH 7.4, all reagents have been purchased by Sigma-Aldrich, Darmstadt, Germany) and vortexed for 20 s. A total of 450 μL of this mixture was transferred in a 4.25 mm NMR tube. Samples were weighted and extracted in five technical replicates for each batch.

2.3. NMR Spectroscopic Analysis and Data ProcessingNMR Data Analysis

One-dimensional (1D) 1H-NMR spectra were measured at 400 MHz using an AVANCE III Bruker spectrometer equipped with a 5 mm BBI 400S1 H-BB-D-05Z probe. The probe temperature was regulated at 300 K and for each spectrum, 64 scans were collected using noesygpps1d (Bruker) pulse sequence, a spectral width of 12.47 ppm, a relaxation delay of 4 s and a total acquisition time of 8 min. The receiver gain was set to 203. FIDs were zero-filled and transformed using exponential line broadening (0.6 Hz), resulting in spectra of 16,384 data points. A total of 260 noesygpps1d spectra were acquired. Because of the low shimming quality, two NMR spectra of roasted coffee beans (361a and 369b) were removed before the statistical analyses (total of considered spectra: n° green = 180; n° roasted = 178).

2.4. NMR Data Analysis

Resulting NMR spectra were aligned to the TSP signal (0 ppm) and input variables for statistical analyses were generated via variable size binning (green coffee beans spectra divided into 384 buckets, and roasted coffee beans spectra divided into 419 buckets). Each spectrum was segmented into buckets of 0.02 ppm in the range between 0.4 and 10 ppm, except the resonance regions of caffeine (3.2, 3.4, 7.75 ppm) and chlorogenic acid (6.2, 7.0, 7.50 ppm) because of the significant chemical shift changes observable due to their interaction in aqueous solution [19]. Therefore, the buckets of these regions were merged to have the protons of the corresponding molecule into the same bucket window (merged in green buckets: 3.14–3.28, 3.34–3.44, 6.02–6.5, 6.58–7.2, 7.44–7.68, 7.7–7.9; merged roasted buckets: 3.22–3.28, 3.36–3.48, 6.22–6.44, 6.72–7.2, 7.44–7.66, 7.7–7.88; Supplementary Materials Figure S1). Moreover, the region of residual water (4.5 ppm–5.24 ppm) was excluded. Buckets were then normalized to the measured weight of crushed beans, and thereafter, Probabilistic Quotient Normalization (PQN) was applied. The resulting dataset was used to perform multivariate statistical analysis.
A total of 20 metabolites were identified in all the NMR spectra of green coffee, and 29 were identified in all the roasted one. Among them, 15 metabolites are present both in the NMR spectra of green and roasted aqueous extracts. Comprehensively, 34 different metabolites were assigned (Figure 1). Since most of them resonate in crowded regions of the spectrum, where the presence of other signals below certain peaks cannot be excluded, only 15 metabolites in green and 25 metabolites in roasted coffee, corresponding to well defined and resolved peaks in the spectra, were quantitated considering the area under the peaks. Signal identification was performed using a library of NMR spectra of pure organic compounds (AssureNMR 2.2 software, Bruker BioSpin, Karlsruhe, Germany), public databases (e.g., FooDB, n.d.; PhytoHub, n.d., Edmonton, Alberta) storing reference and literature data [7,10,12]. The resulting matrices were used to perform multivariate and univariate data analyses.

2.5. Statistical Analysis

Data analyses were performed using R, an open-source software for the statistical analysis of data. Multivariate analysis on metabolomic data was performed on processed NMR bucketed spectra. Principal component analysis (PCA) was used as first exploratory analysis [20]. The RF (“Random Forest” of R package) algorithm [21], was used to assess whether green and roasted NMR metabolomic profiles can be used to classify samples according to the variety, origin, and kind of drying (direct sun or under shadow) and fermentation time (12 h or 24 h) of different coffee batches. Random Forest uses a collection of classification trees, each of them is grown by random selection of features from a bootstrap sample at each branch. Class prediction is based on the majority vote of the collection. While the tree is constructed, about one-third of the instances are left out of the bootstrap sample. This data is then used as test sample to obtain an unbiased estimate of the classification (OOB) error. Variable importance is evaluated by measuring the increase of the OOB error when variables are permuted [22].
Univariate analysis was performed on quantitated metabolites. The Kruskal–Wallis test followed by Dunn post hoc analysis [23] was chosen to infer significant differences among independent samples from multiple groups (n° groups > 2). The Wilcoxon test was chosen to gather differences between two groups and false discovery rate correction was applied using the Benjamini and Hochberg method (FDR) [24], an adjusted p-value  <  0.05 was considered statistically significant.

3. Results and Discussion

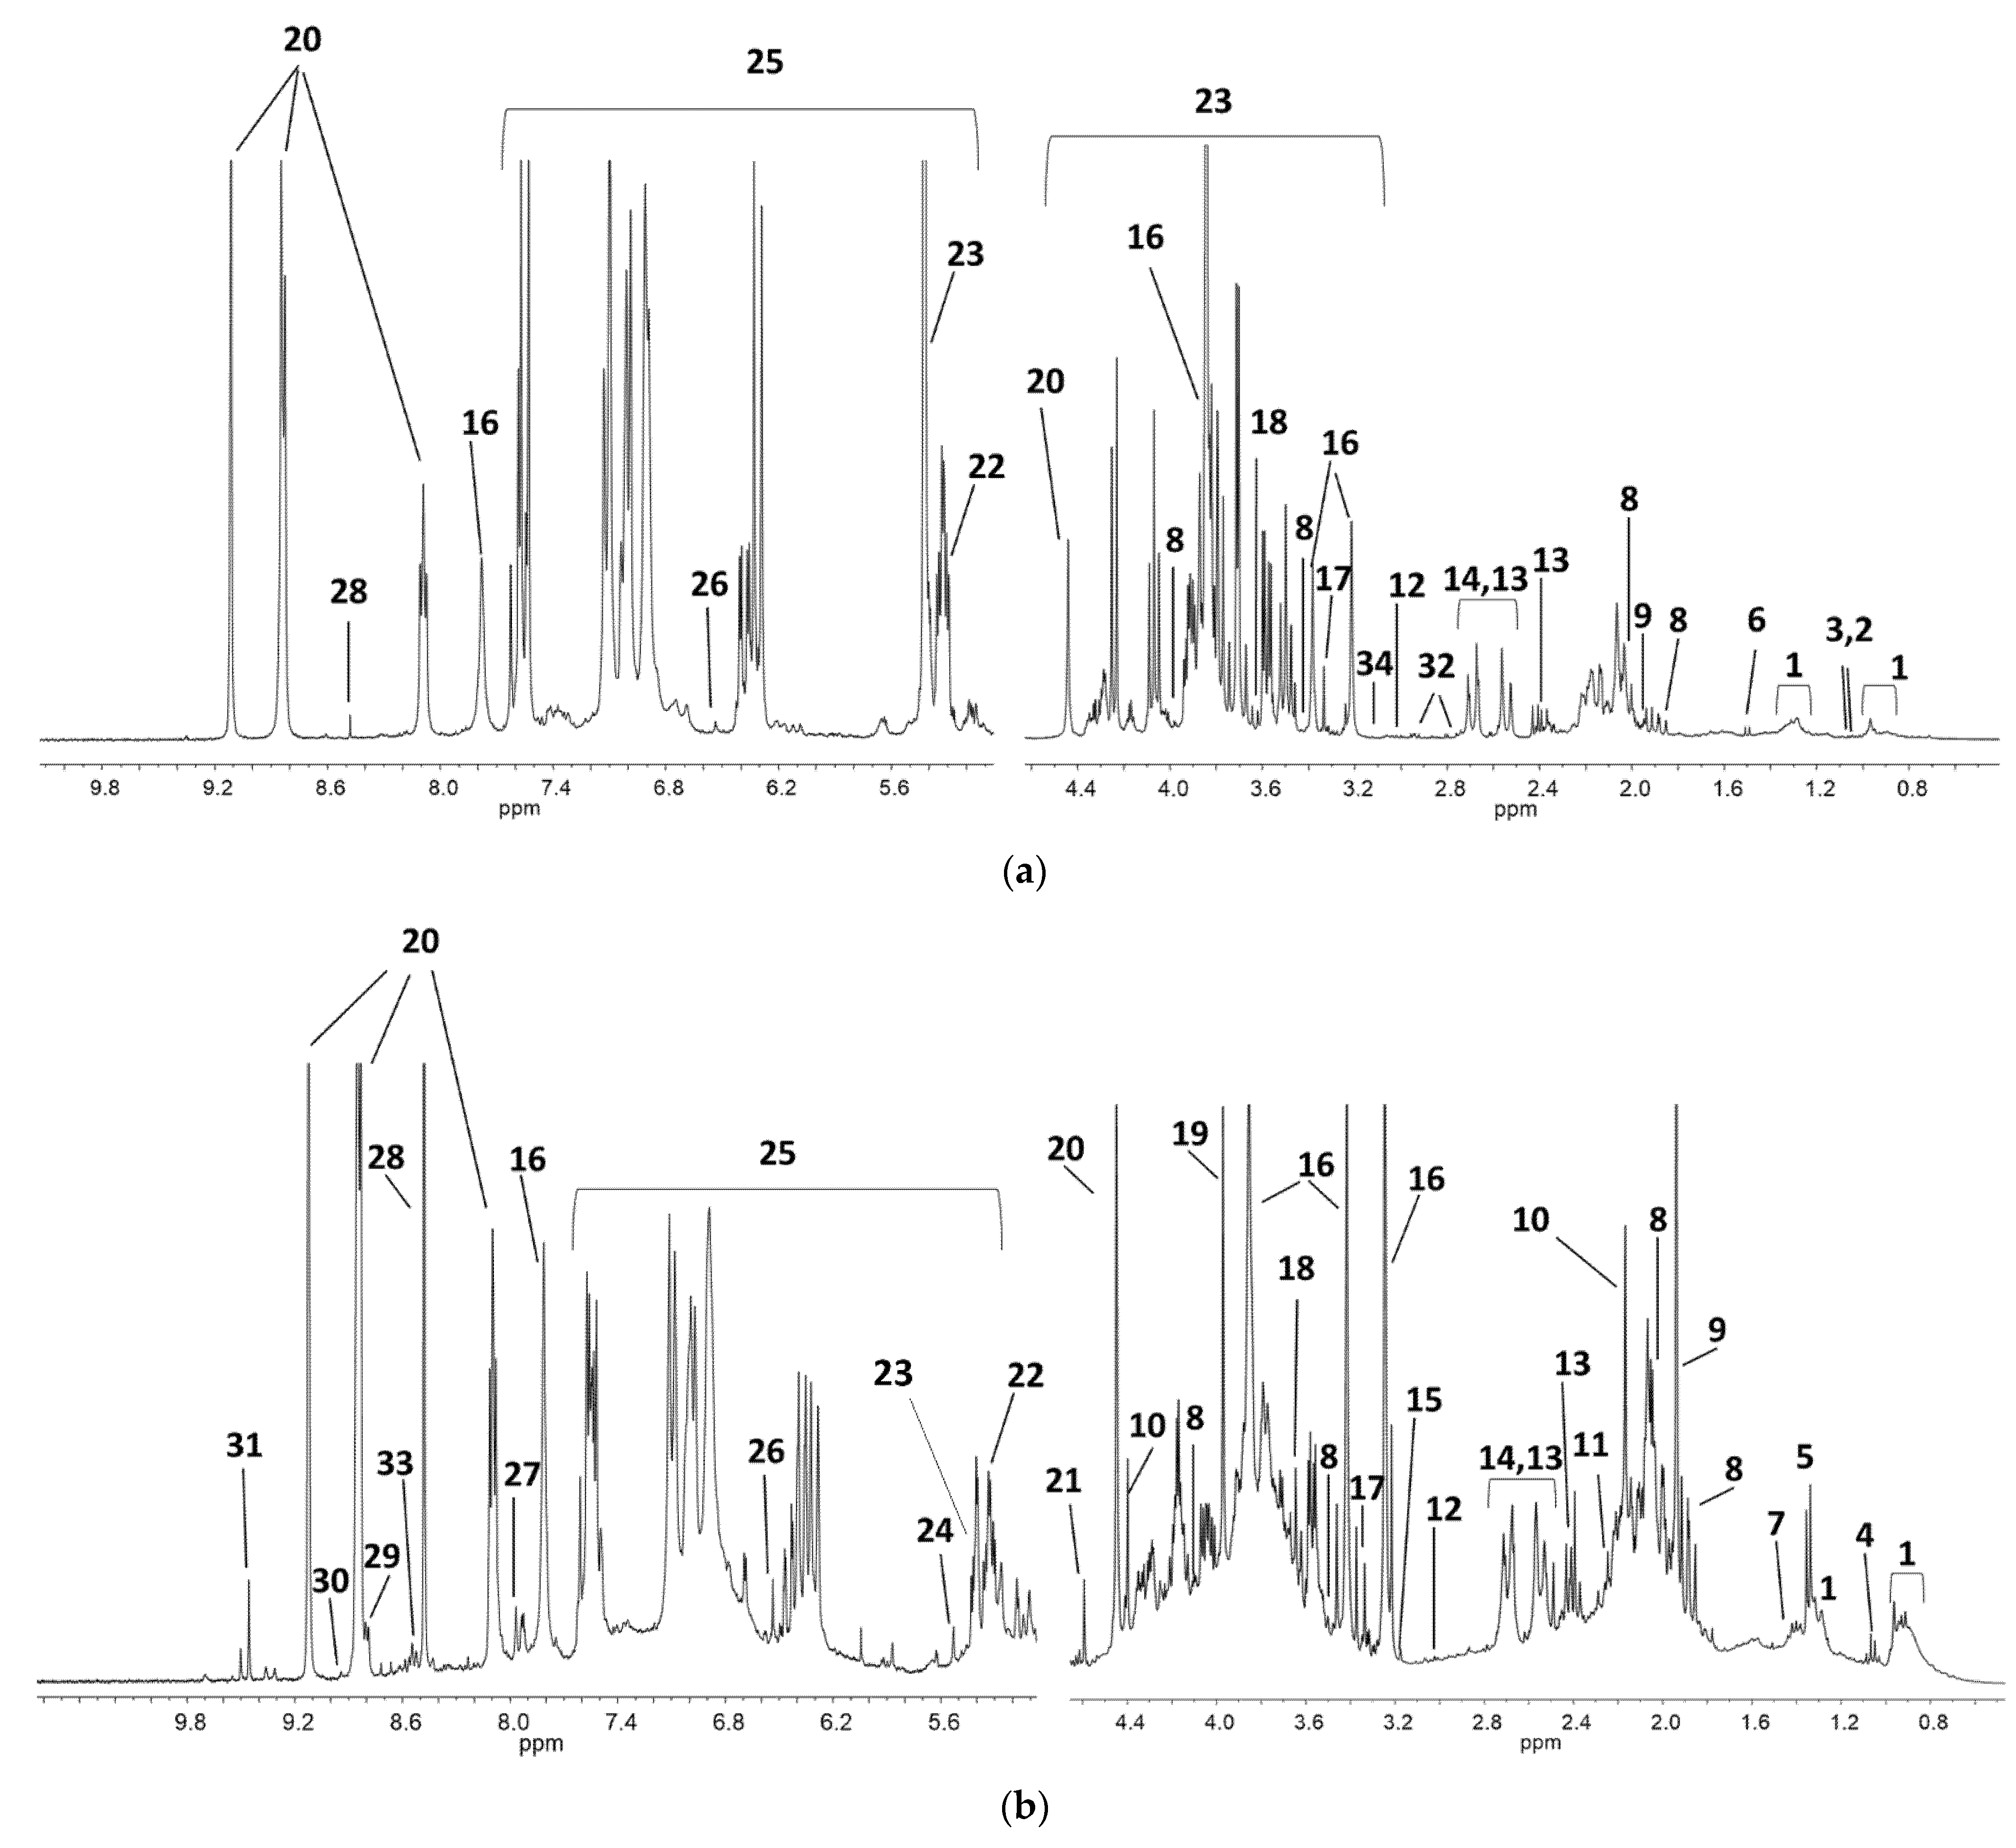
3.1. Unsupervised Analysis of 1H NMR Coffee Beans Spectra

As preliminary evaluation, PCA was performed on the datasets of bucketed 1H-NMR spectra (5 independent samples for each batch), to investigate the quality and the overall behaviour of the acquired green and roasted coffee spectra (Supplementary Materials Figure S2). The sum of the variance of PC1 and PC2 accounts for a total of 89.9% and 76.5% in green and roasted coffee score plots, respectively (Supplementary Materials Figure S2a,b). PCA shows a tendence to form clusters according to the variety (Supplementary Materials Figure S2a,b). The farm effect seems to emerge particularly in BO variety (Supplementary Materials Figure S2a,b), while e subtle differentiation by the fermentation time (12 h vs. 24 h) emerges, especially for the MC and PA green coffee beans water extracts (Supplementary Materials Figure S2a). This is in line with the observation that there are varieties that, being more metabolically susceptible, could also change more significantly in taste depending on the way in which they are processed [24]. Even less marked, these differences are present also in the spectra of roasted beans.

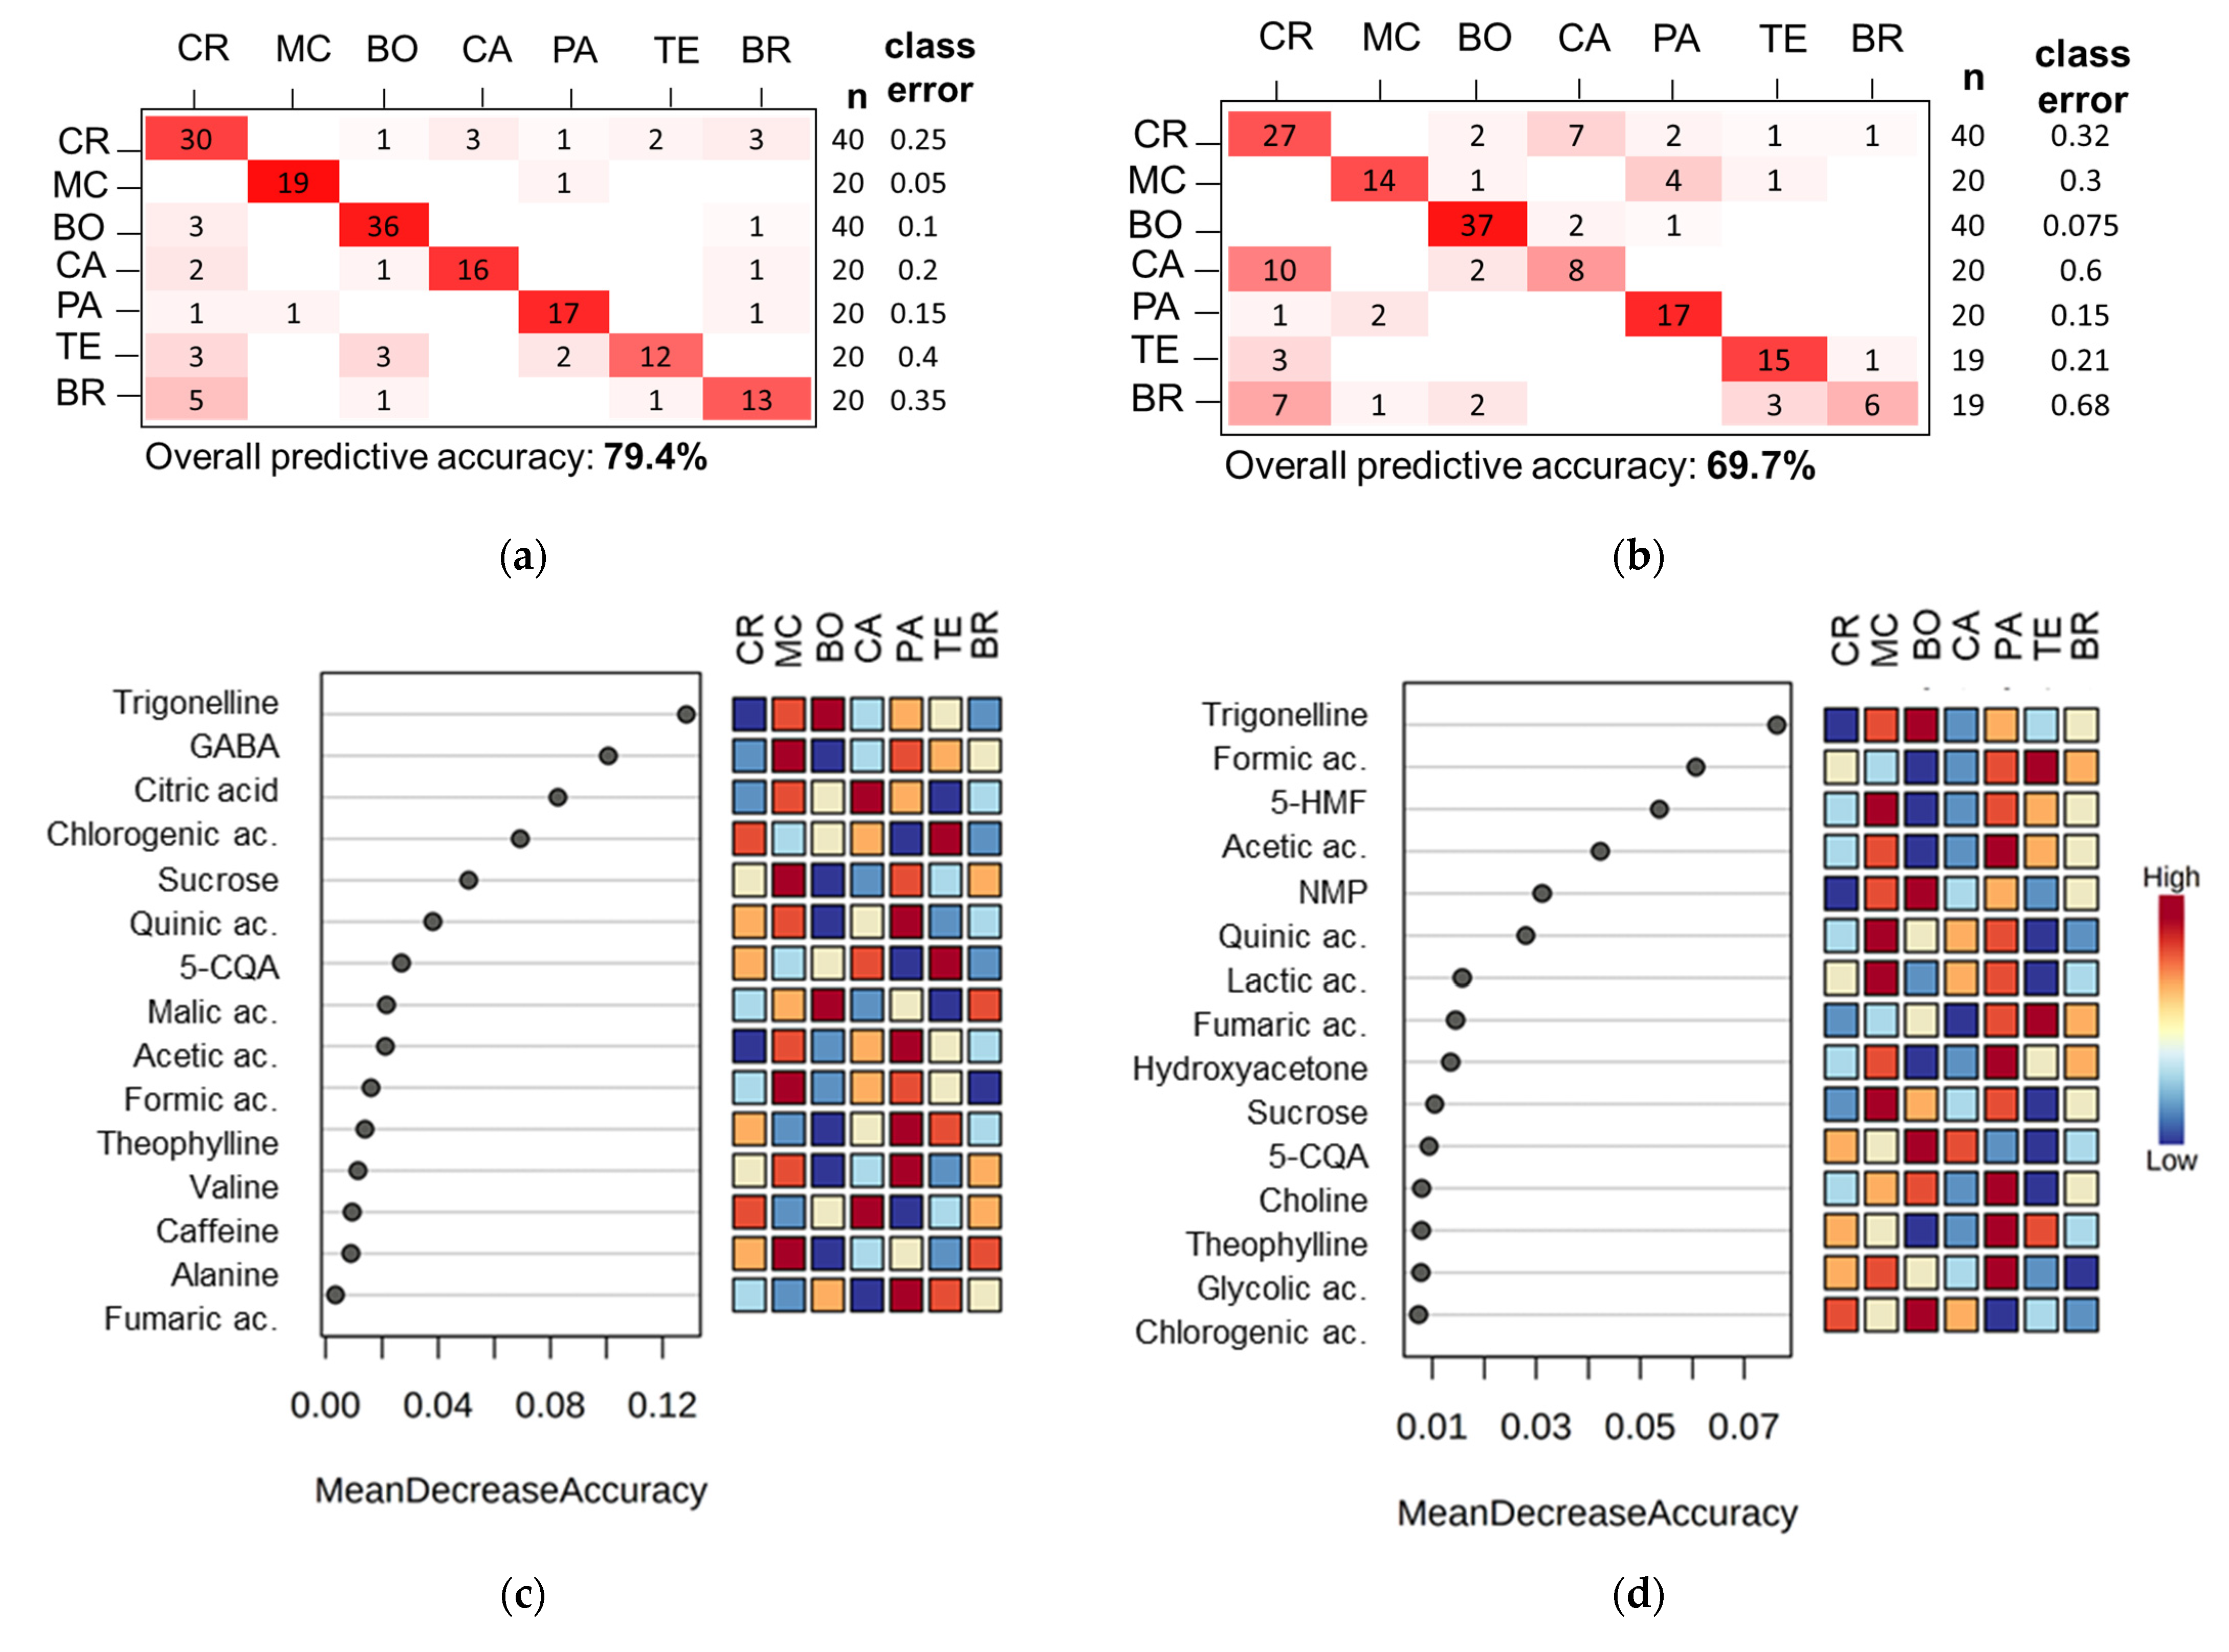
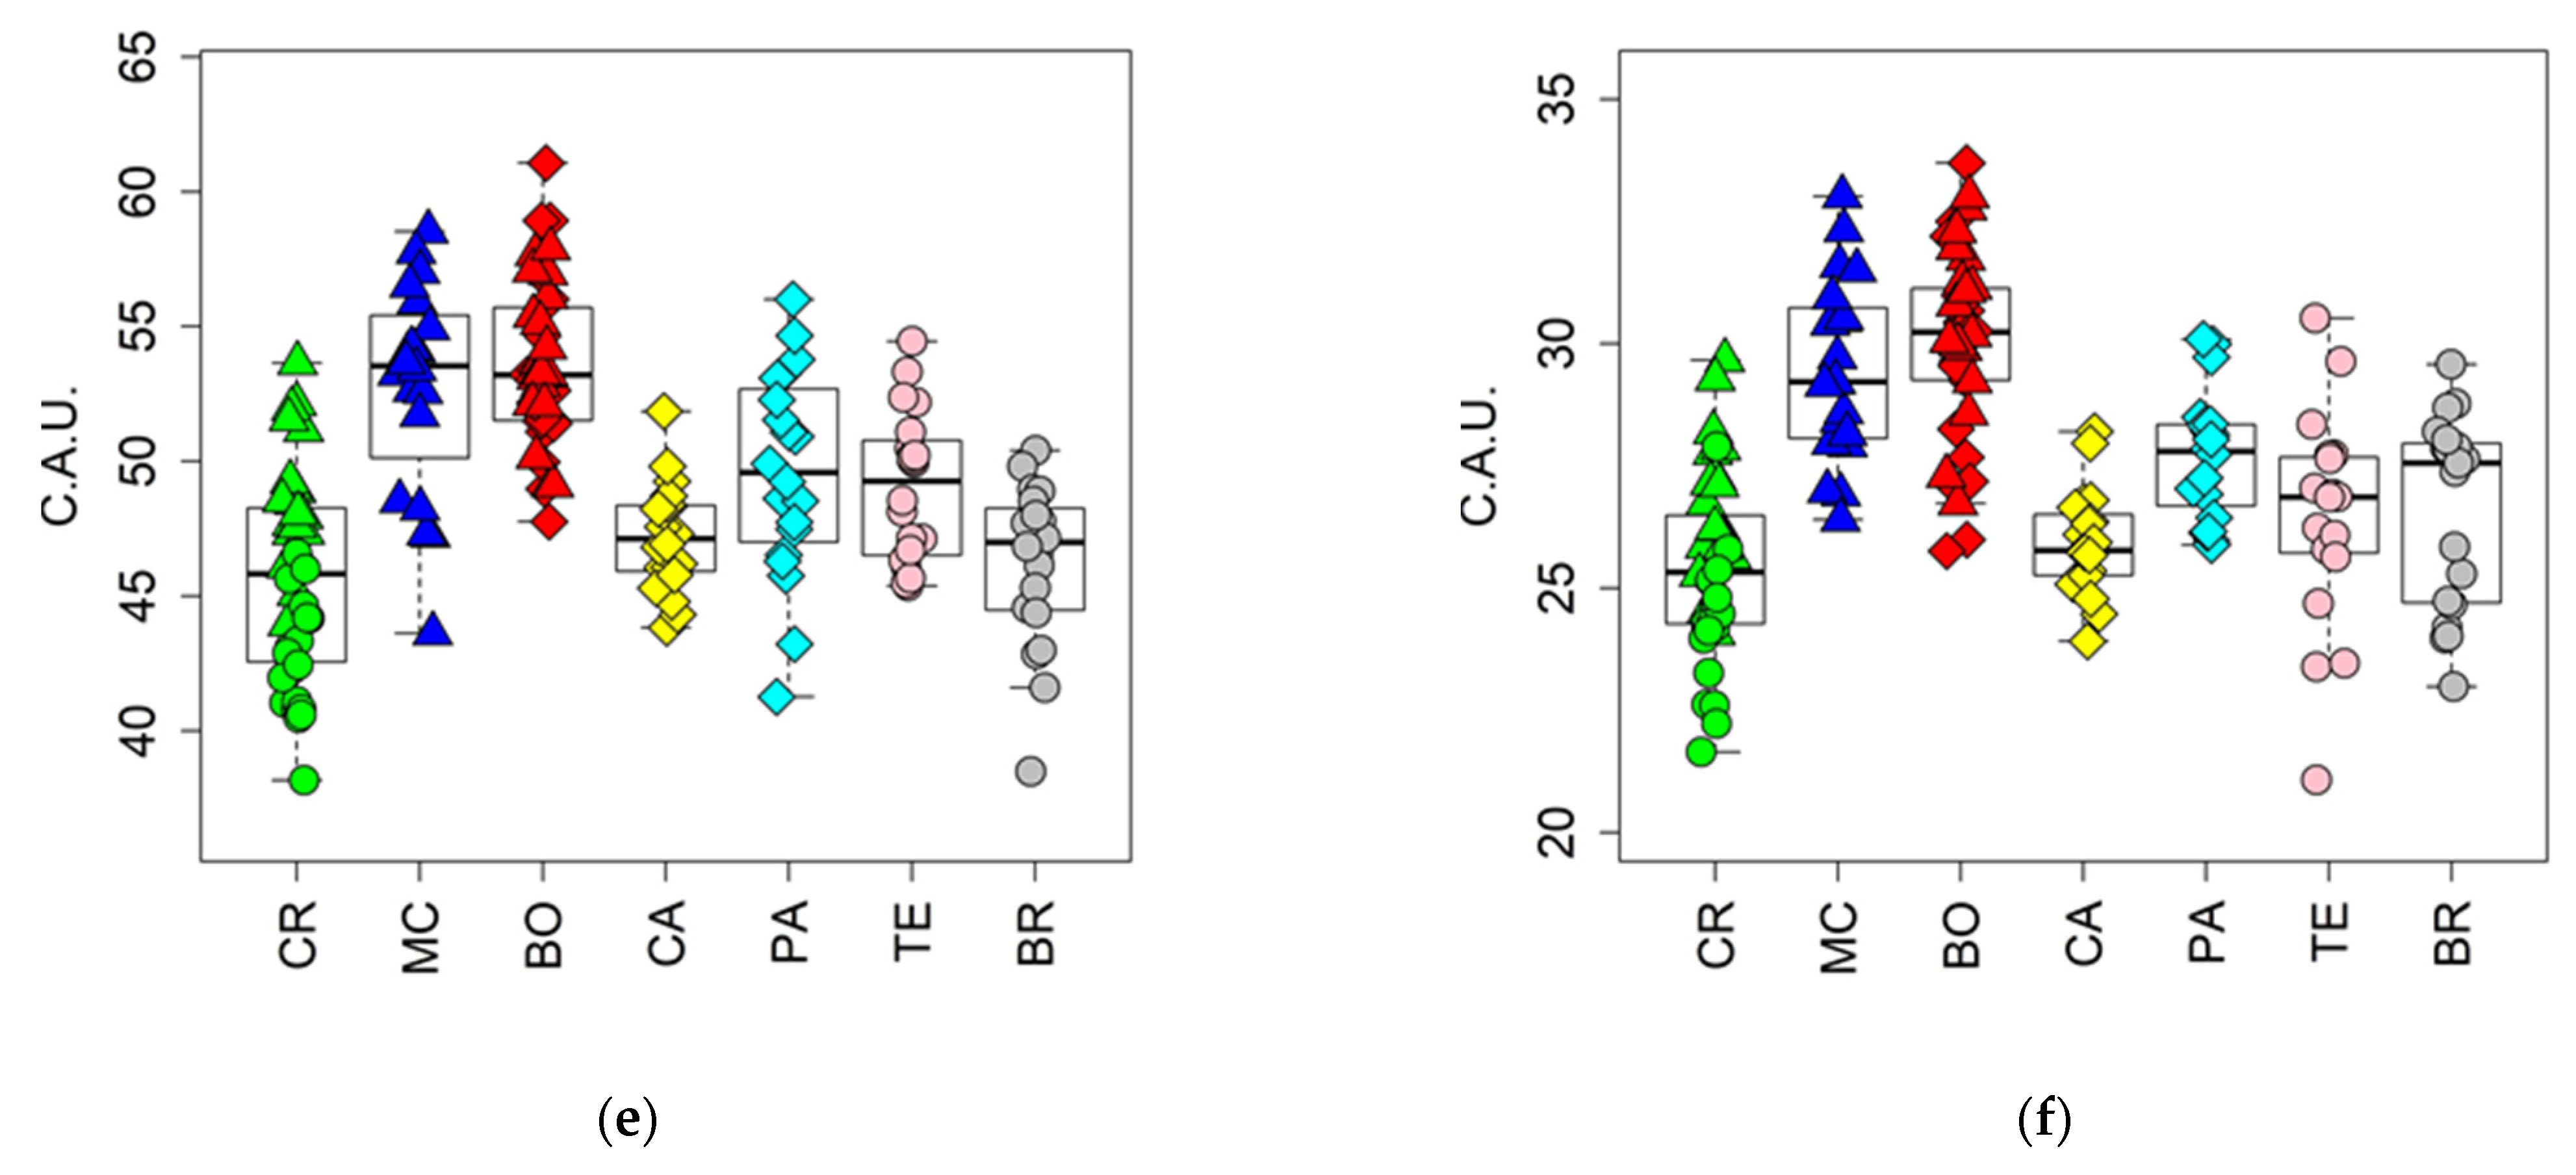
3.2. Coffee Varieties
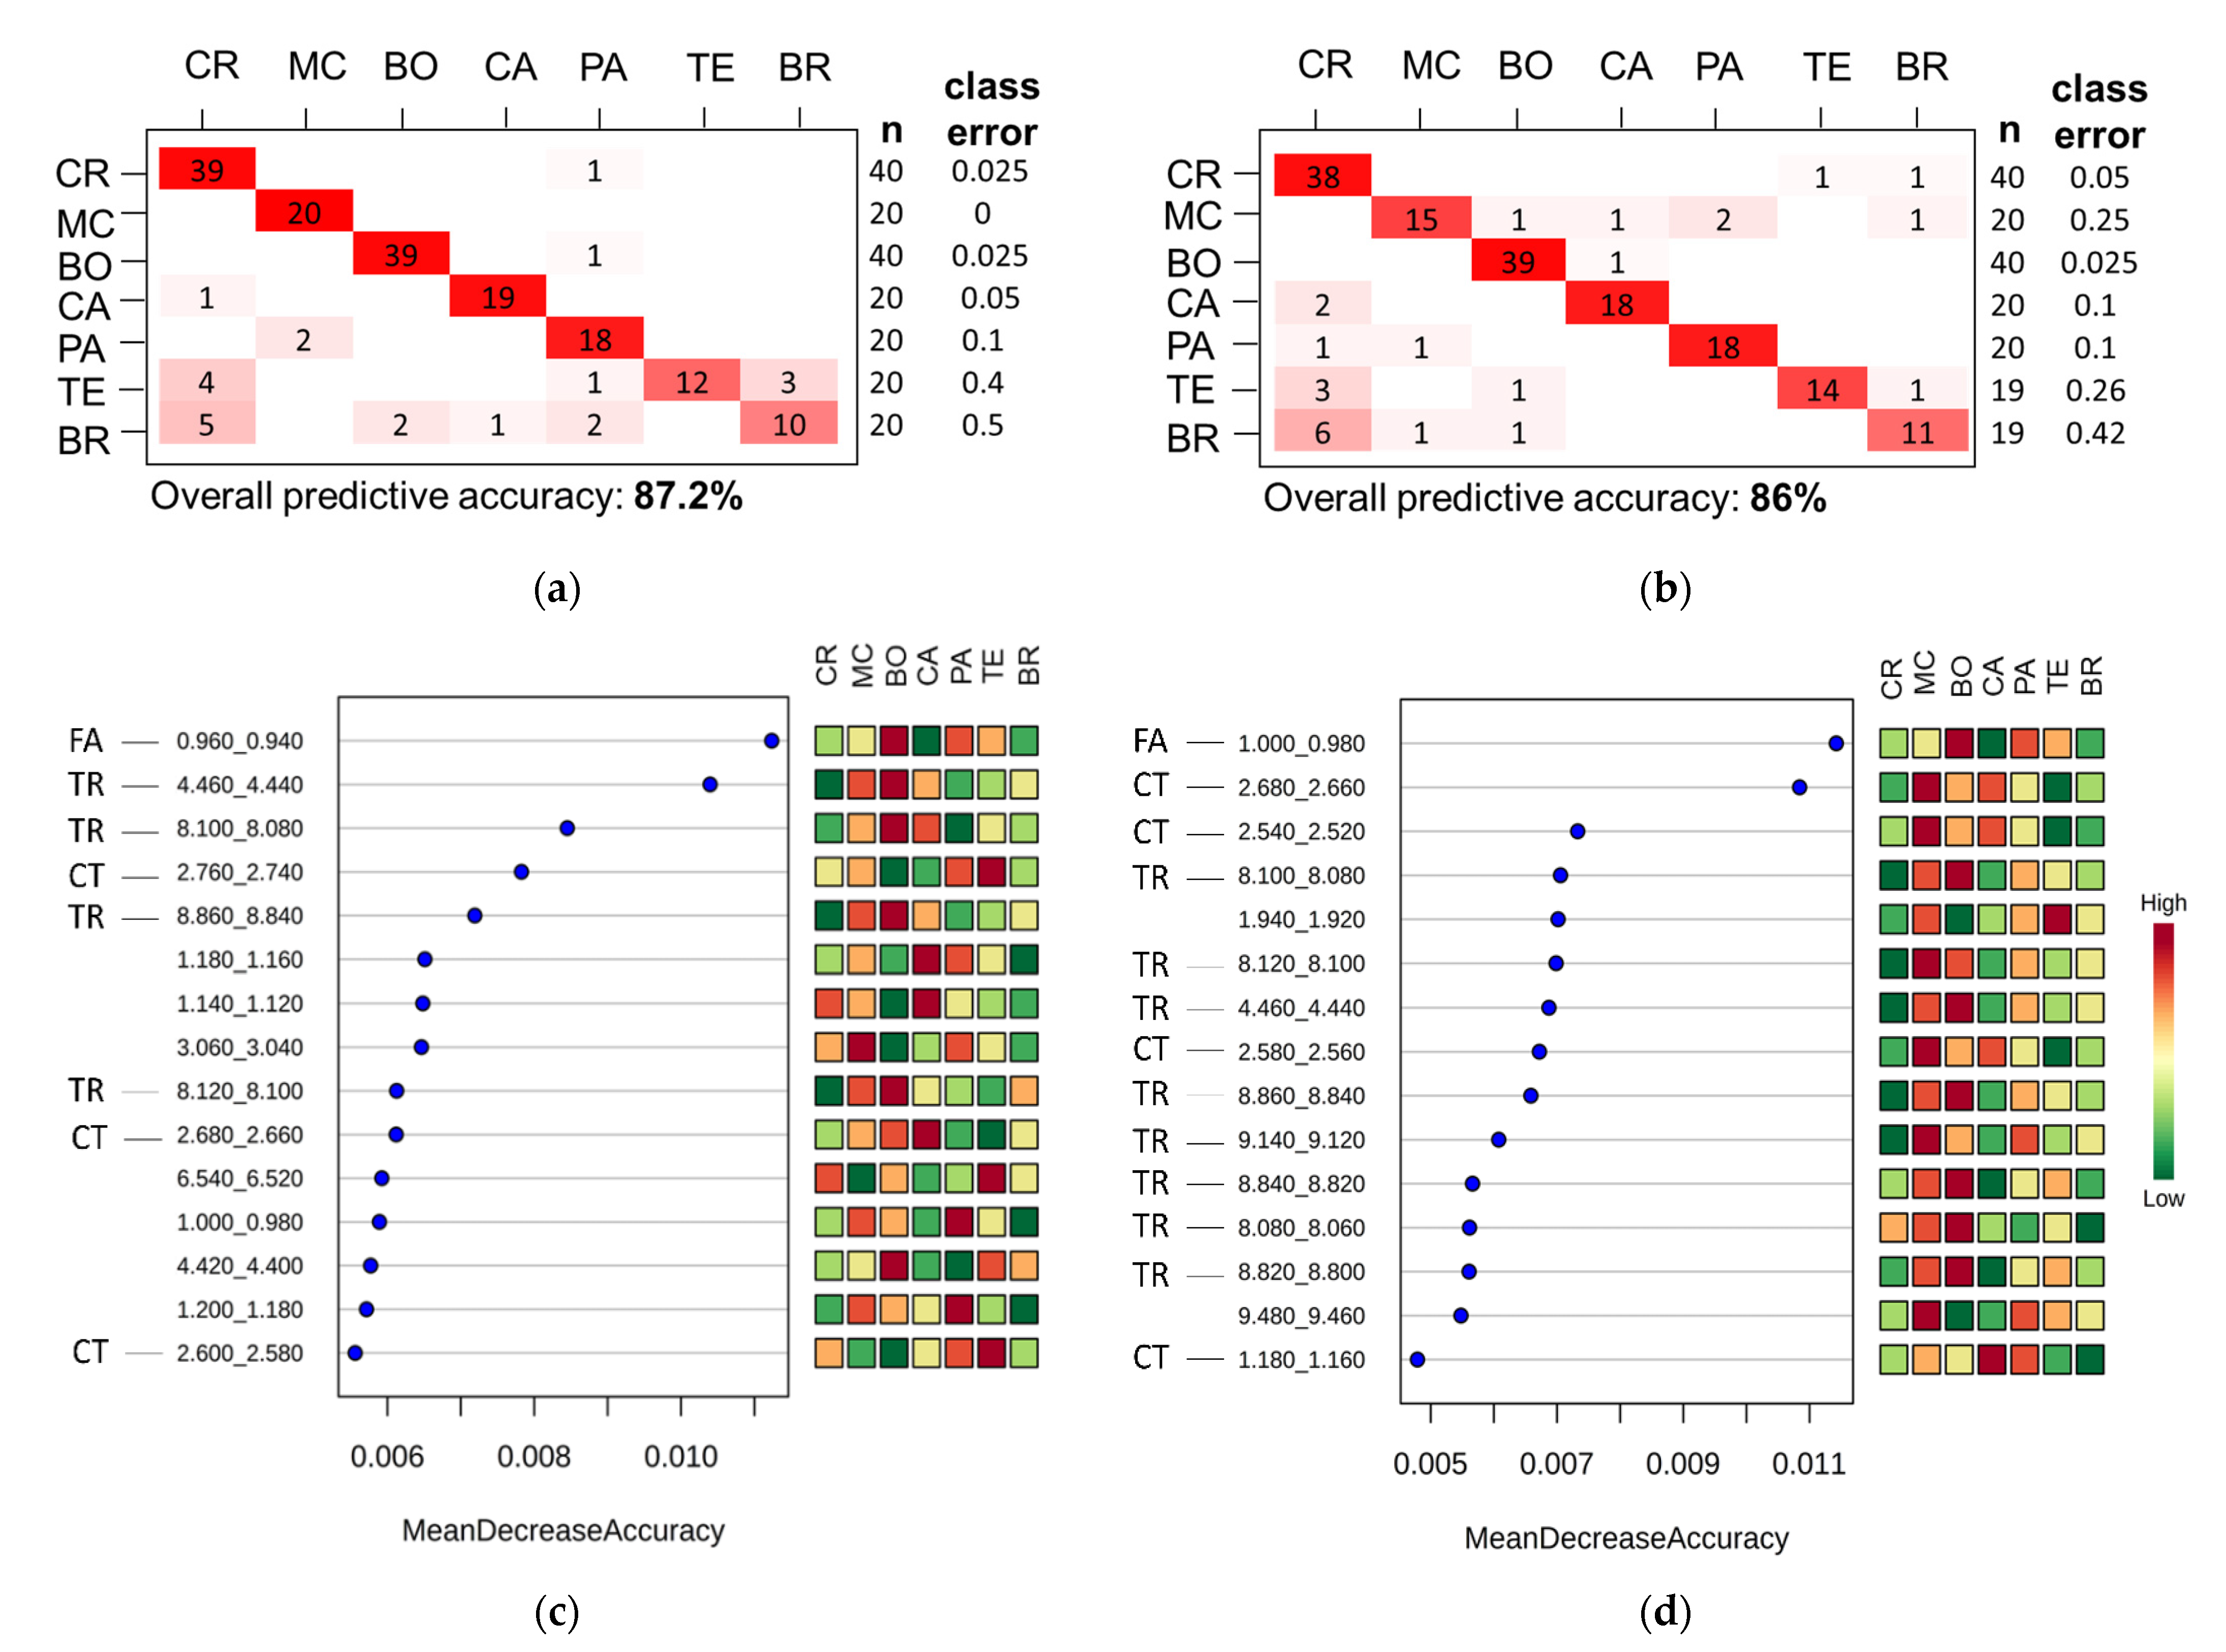
Each variety was analyzed, using RF as the supervised machine learning approach, to demonstrate the presence of the fingerprint of coffee varieties both in green and in roasted coffee using all NMR data (mean predictive accuracy 91.7%, Table S1). This type of analysis conducted within the same farm, certainly highlights the strong differences between varieties.
Then, the presence of the varietal fingerprint was investigated regardless of the farm of provenance, using bucketed spectra (Figure 2a,b). The predictive accuracies of green (Figure 2a) and roasted (Figure 2b) coffee beans models are similarly good (87.2% in green and 86.0% in roasted), confirming, as previously seen (Supplementary Materials Table S1), that even after roasting the varietal metabolomic fingerprint could be derived. Among all variety classes, TE and BR class error is the highest (Figure 2a,b). The RF variable importance is calculated for green and roasted coffee beans batches, and the overall importance is assessed by determining the maximum for each descriptor over all classes (Figure 2c,d). As shown in Figure 2c,d, there are some conserved regions (ppm), present both in green and roasted coffee spectra, that mostly contribute as important features ranked by RF: the region between 0.94 and 1.2 ppm could be mainly ascribed to the broad signals of methyl and methylene protons of fatty acids (FA) chains [9], the regions within 4.44 and 4.46 ppm, 8.08–8.12 ppm, 8.80–8.86 ppm and 9.12–9.14 ppm, attributable to trigonelline (TR) protons, and the bucket range from 2.52 ppm to 2.76 ppm corresponding to citric acid (CT) signals. Therefore, fatty acids, trigonelline and citric acid, can be considered descriptors of the varieties both in green and in roasted NMR spectra. It emerges that fatty acids and trigonelline maintain also the same trend between the considered varieties in green and in roasted coffee.
In addition, with the aim to compare the efficacy of the fingerprinting and profiling approaches [8], RF was applied, even on the matrices of the corresponding peak areas of the identified metabolites in green and roasted spectra (Figure 3a–d). Compared to the RF models built on bucketed spectra (entire spectra, fingerprinting, Figure 2), models built on metabolites resulted to be less accurate (green model, Figure 3a, pred. acc: 79.4%; roasted model, Figure 3b, pred. acc: 69.7%). This suggests that the fingerprint approach is preferable for variety classification/recognition [8].
The most important metabolites in discriminating varieties are ranked in Figure 3c,d. This analysis reports trigonelline as the most contributing metabolite in the discrimination of varieties, both in the profile of green (Figure 3c) and in the profile of roasted coffee (Figure 3d).
Univariate statistical analysis (Figure 3e,f, Supplementary Materials Figures S4 and S5) supports that trigonelline trends are conserved between coffee varieties, even after roasting (BO > MC > PA > TE = BR > CA > CR).
An increment of quinic, acetic, fumaric and formic acids and a decrement of gamma-aminobutyric acid (GABA), malic acid, theophylline, trigonelline, 5-CQA, sucrose and chlorogenic acids occur following the roasting process (Supplementary Materials Figure S6). Although it is already known that roasting leads to the alteration of these metabolites [12,25,26], there are no data regarding the behavior of such components among different coffee varieties after roasting. As previously seen, trigonelline is particularly interesting in this respect, as it demonstrated a characteristic trend among varieties and was preservable even after roasting. Characteristically higher amounts of trigonelline are usually detected in C. arabica with respect to C. canephora [27]. This is in line with reports by Mengistu et al., 2020 on Ethiopian coffee, suggesting a characteristic trend of trigonelline among different varieties. The significance of trigonelline has been well established in previous studies, not only as a precursor of flavor and aroma compounds (as one of the main contributors to coffee’s bitter taste), but also as a beneficial nutritional compound [28].
The fact that the trigonelline trend is conserved among varieties after roasting could suggest trigonelline as a potential candidate biomarker for variety determination.

3.3. Coffee Farms

RF models were also created to assess whether the characteristic fingerprint and/or profile of the corresponding coffee farm can be derived from coffee batches of the same variety. However, this hypothesis has been tested only in catuai rojo (CR) and bourbon (BO), since among the seven varieties collected, only these two are produced by more than one farm (see Table 1). RF models have been built to distinguish CR batches of farm 1 and farm 3 and BO batches of farm 1 and farm 2. All the four RF models built to distinguish farms of CR show optimal predictive accuracies (pred. acc%. 94 ± 3.15) both for green and roasted coffee (Supplementary Materials Figure S7a–d). Consistently with the summaries of the most important variables (Supplementary Materials Figure S7a1–d1), univariate analysis on metabolites shows significant higher content of quinic acid, alanine, trigonelline, caffeine, and lower amounts of theophylline, 5-CQA, citric and chlorogenic acid in green coffee beans of the catuai rojo variety of farm 1 when compared to farm 3 (Figure 4a). Higher levels of choline, sucrose, xanthine, and lower levels of 5-hydroxymethyl furfural (5-HMF), fumaric acid, hydroxyacetone and formic acid can be observed in CR roasted coffee of farm 1 (Figure 4b). Even the four RF models built to classify BO coffee batches according to the farm of origin (farm 1 vs. farm 2) show optimal classification accuracies (pred. acc%. 98.1 ± 2.4, Supplementary Materials Figure S7e–h). The summary of variables importance (Supplementary Materials Figure S7f1) and univariate analysis on metabolite levels (Figure 4c) report higher amounts of alanine, 5-CQA, malic and chlorogenic acid, and lower levels of theophylline, quinic acid, GABA and sucrose in green beans of farm 1 when compared to farm 2. The trends of theophylline, 5-CQA and chlorogenic acid are conserved even after roasting (see Figure 4d). Moreover, in roasted BO coffee beans of farm 1 compared to farm 2, lower amounts of 5-HMF, lactic acid, hydroxyacetone, formic and acetic acid and myo-inositol are detected. Taken together, these results suggest that farm 1 is characterized by higher levels of theophylline when compared with the other farms. Theophylline is a xanthine alkaloid and it is usually detected in higher amount in Robusta than in Arabica beans [29,30]. It has already been demonstrated by Mehari et al., that the concentrations of xanthine alkaloids (such as theophylline, theobromine, trigonelline and caffeine) could change significantly in coffee according to geographical origin [31]. Higher levels of theophylline could derive from different caffeine metabolisms of the plant, but also from caffeine degradation performed by natural occurring microorganisms during bean fermentation [32,33].

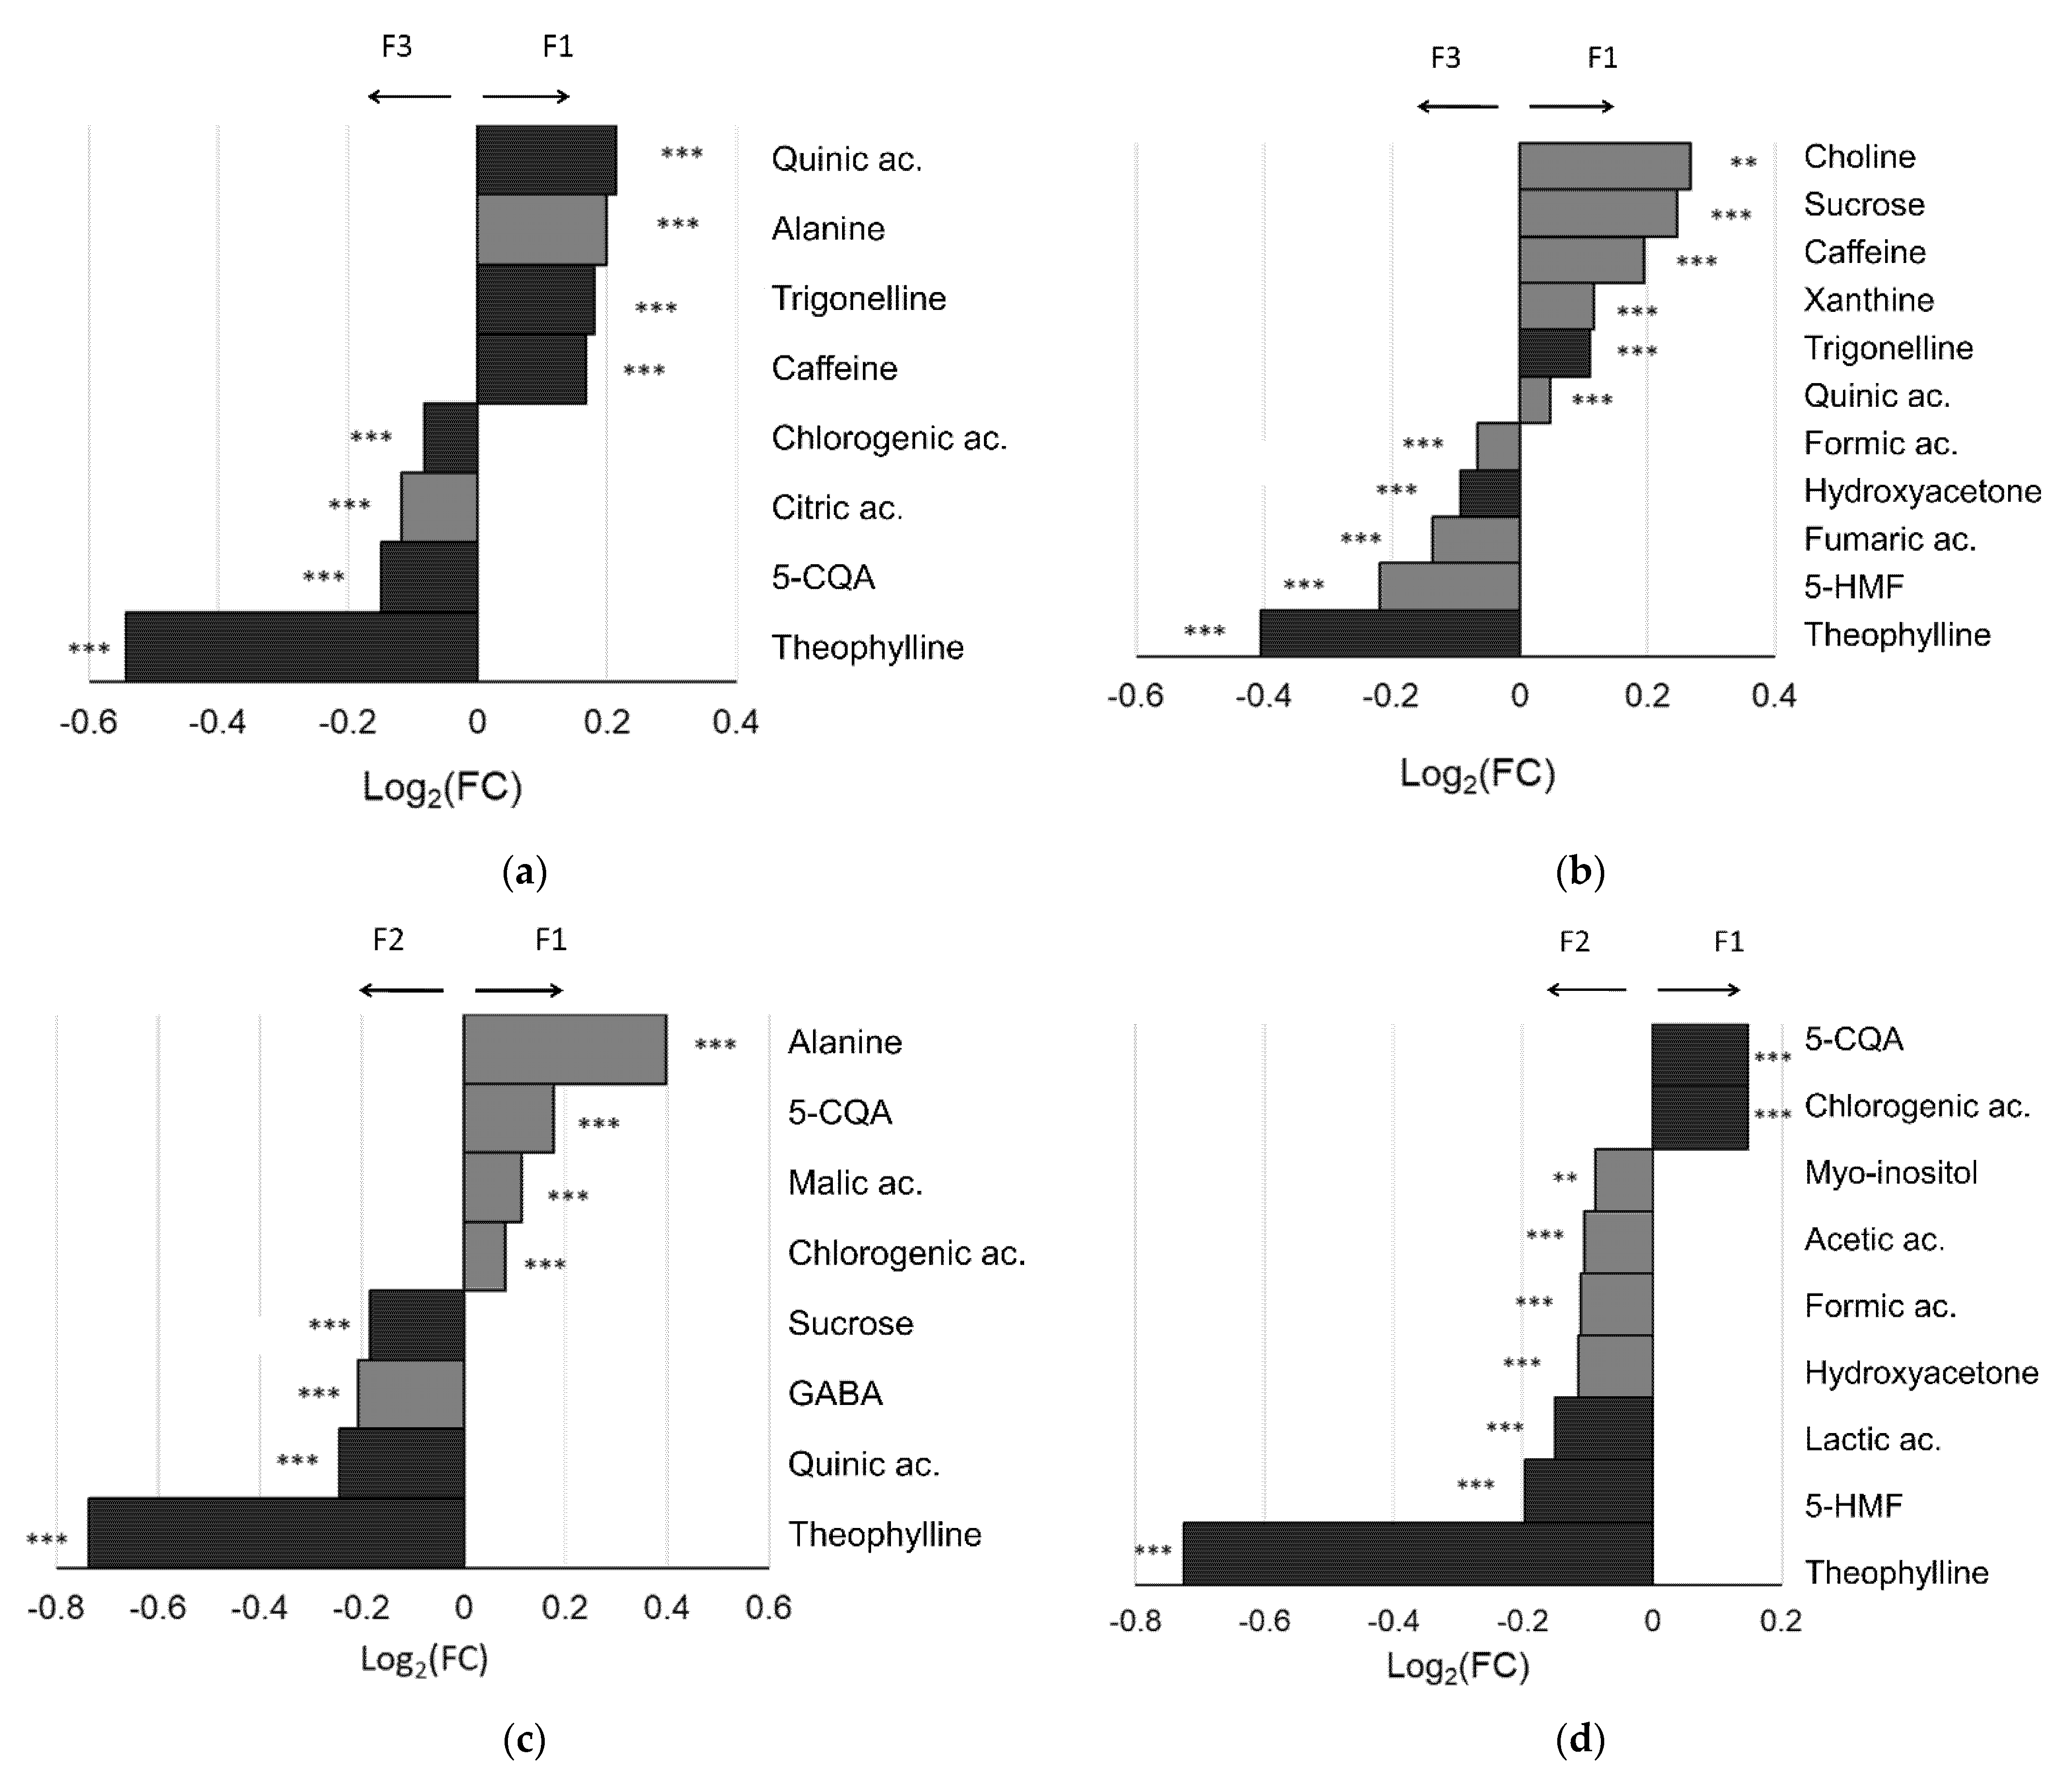
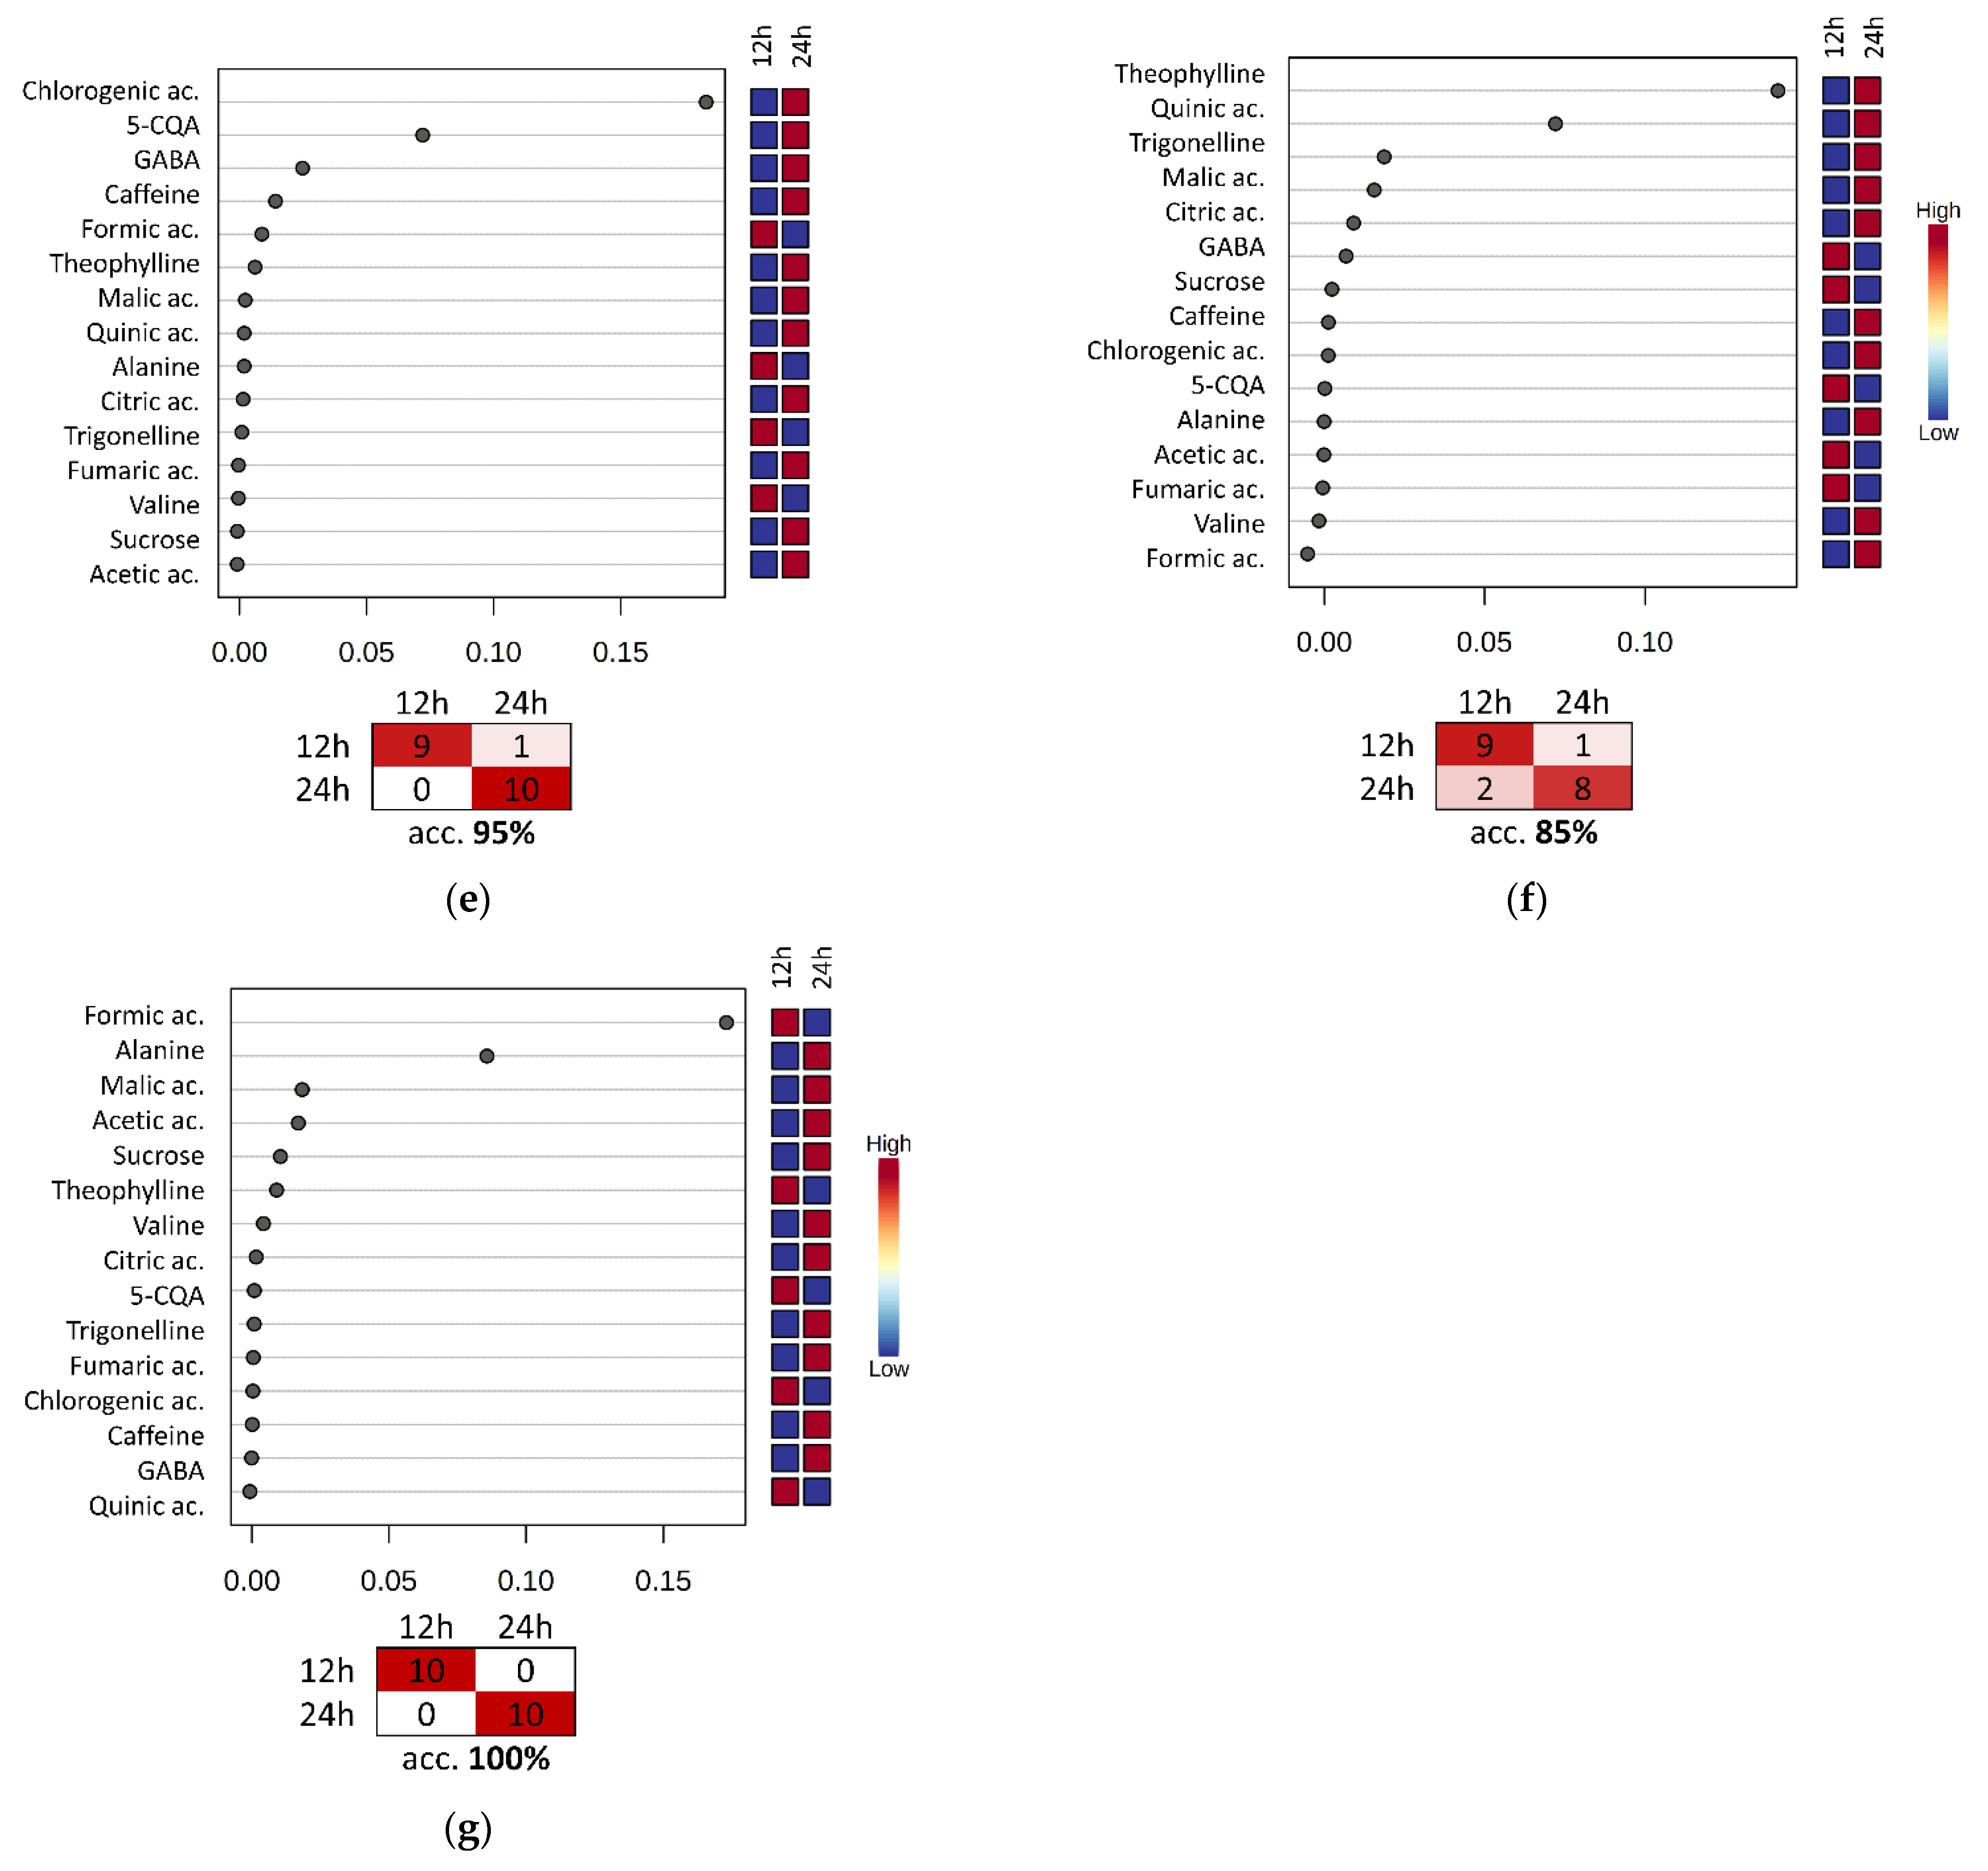
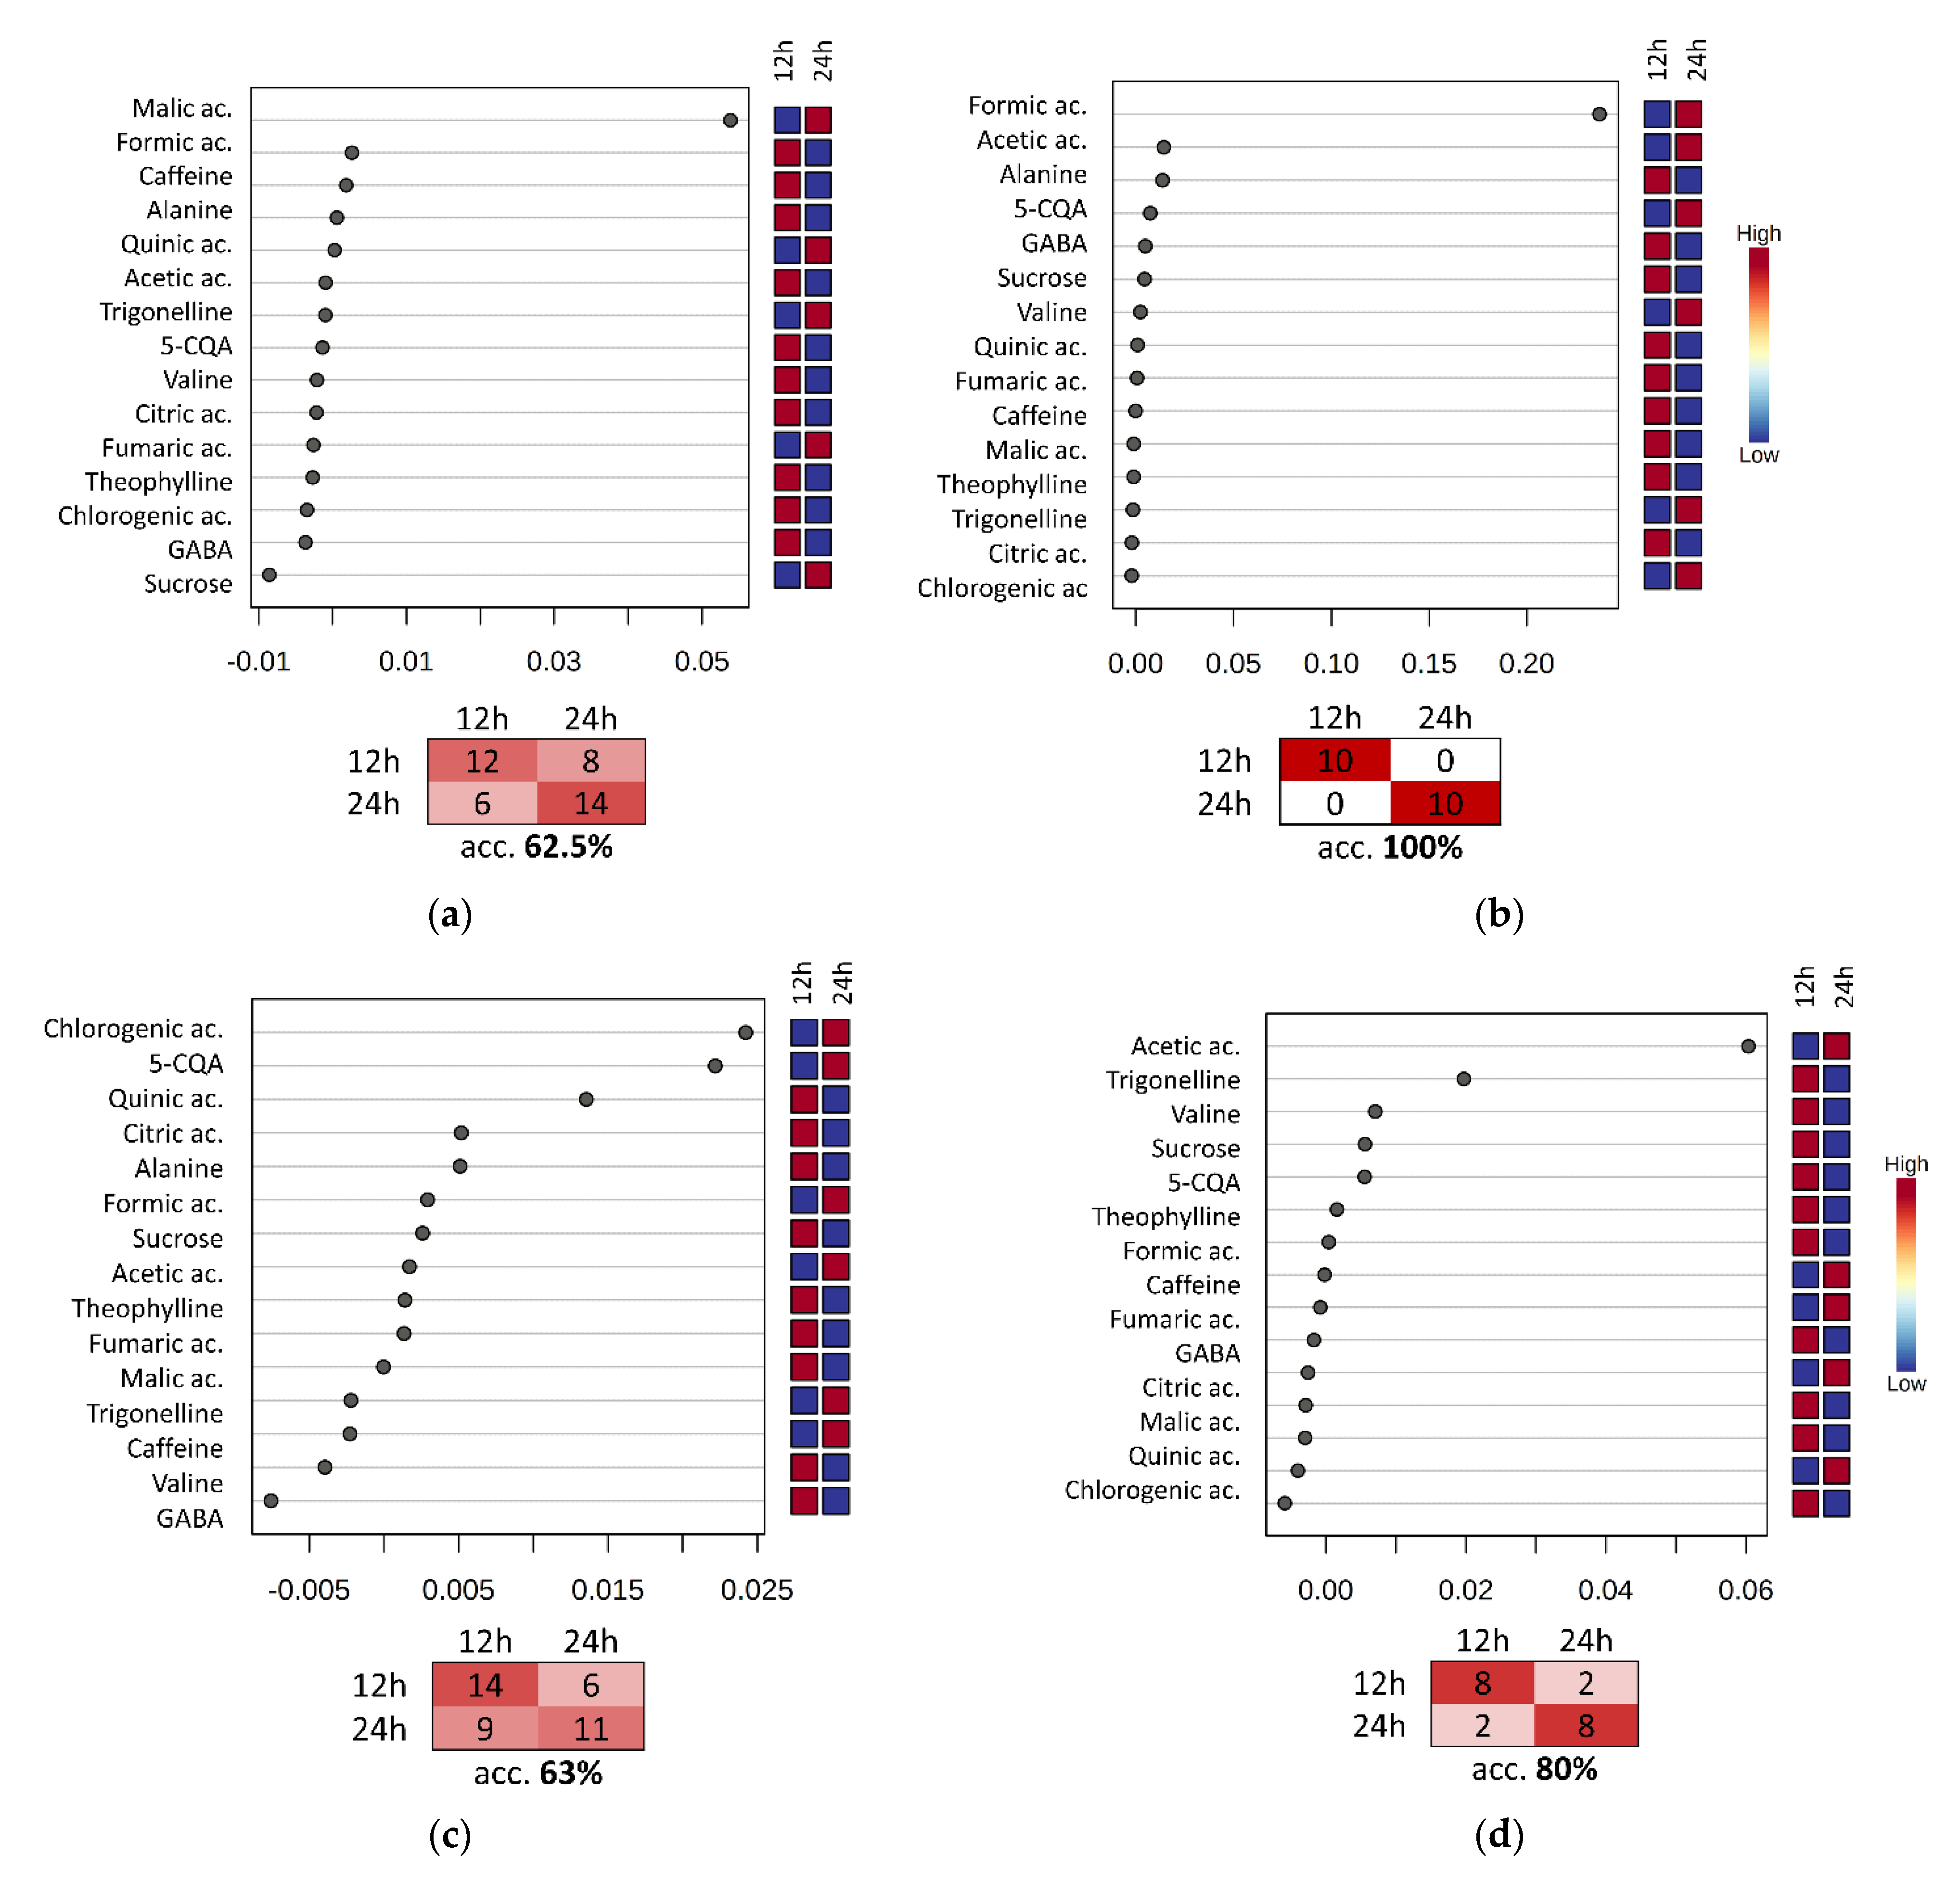
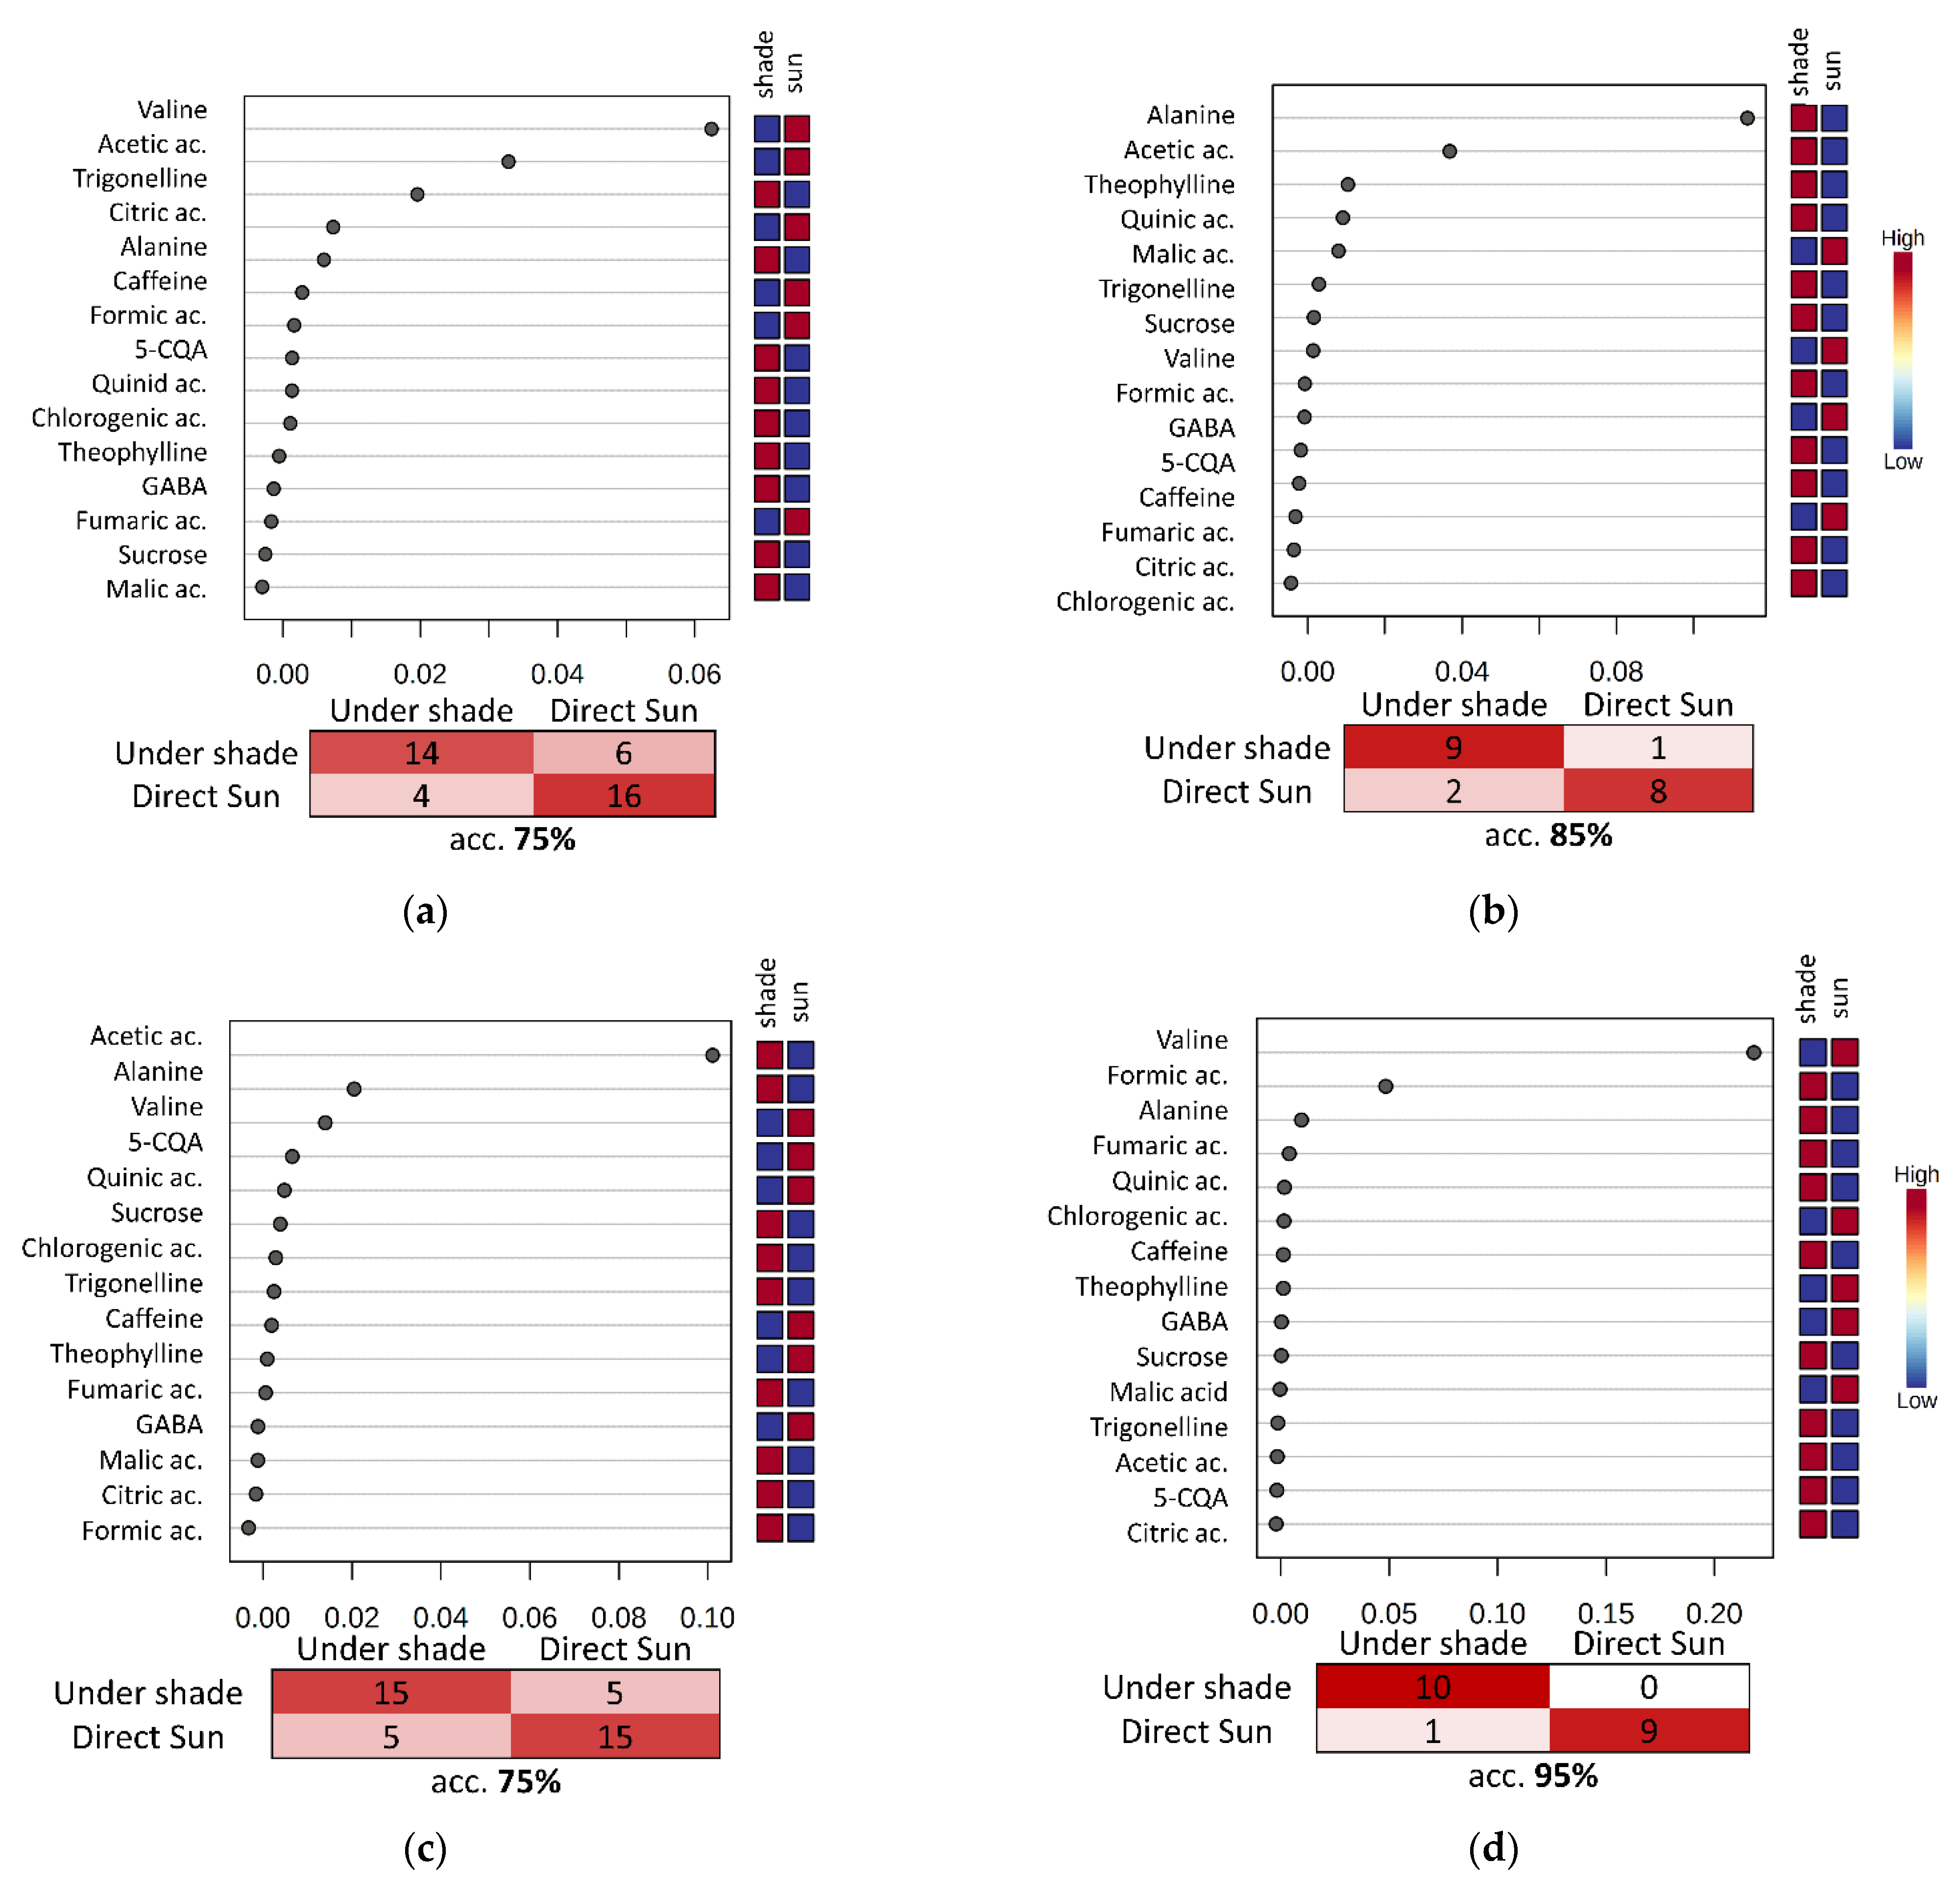
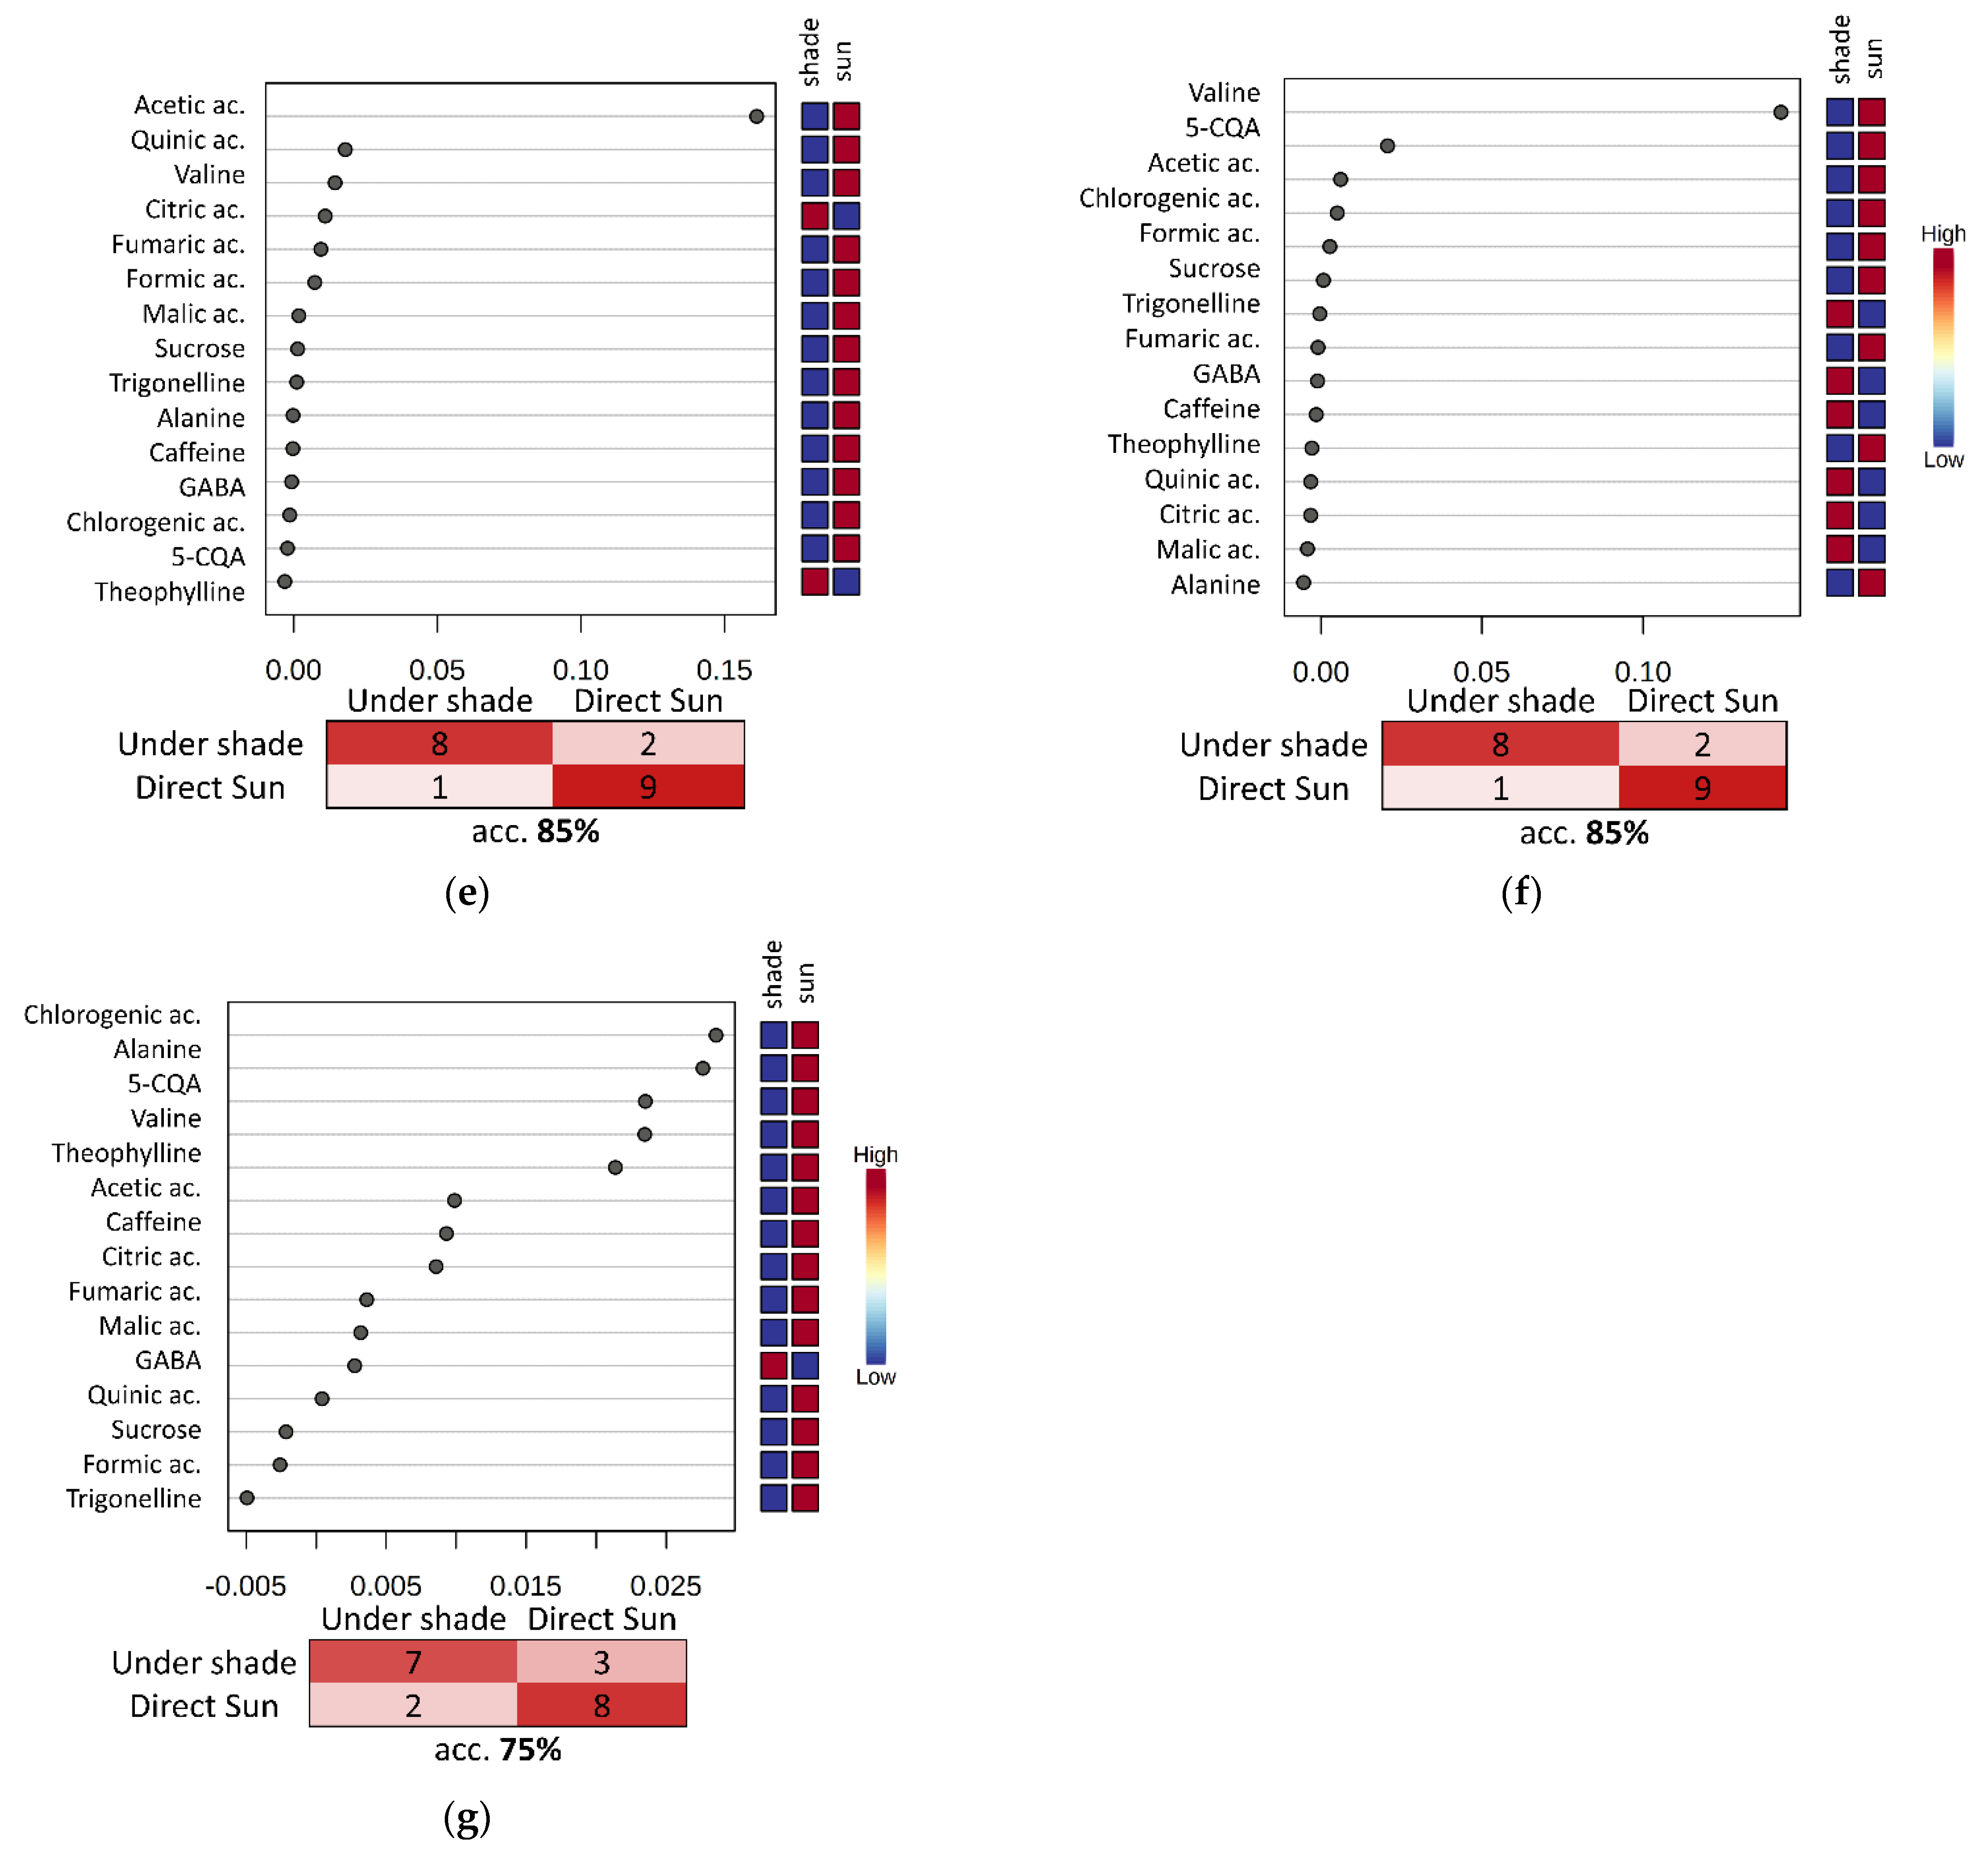
3.4. Evaluation of the Fermentation and Drying Effects on Coffee Metabolomic Profile

To evaluate the effect of the two times of fermentation (12 h and 24 h), the RF approach was applied on green and roasted coffees, using either the matrices of bucketed spectra or the matrices of metabolites (Supplementary Materials Figure S8a–d). Considering all four models created, the fermentation time mostly affected the profile of green coffee, while the effect was not remarkable in roasted coffee. The RF model built on green metabolites resulted to be the most effective in discriminating the fermentation times (pred. acc%. 72.2, Supplementary Materials Figure S8b). A total of 24 h fermented coffee beans were characterized by higher levels of acids (in particular: malic acid, acetic acid, chlorogenic acids, 5-CQA, citric acid, fumaric acid, GABA, quinic acid, as reported in Supplementary Materials Figure S8b1).
Univariate analysis corroborates the fact that malic acid levels are statistically different in the two groups. Among all the fifteen quantified metabolites in green coffee beans, only malic acid remained statistically significant after the false discovery rate (FDR) correction (malic acid: p-value = 0.0002, FDR = 0.003, cliff’s delta = small). Based on the good performance of the model reported as b in Supplementary Materials Figure S8, to check if distinct varieties reacted differently to 12 h or 24 h of fermentations, the effect was evaluated on green coffee metabolites considering each variety separately. As can be seen in Figure 5, each variety reacts differently to the time of fermentation. In particular, the profiles of fermentation times can be distinguished with a predictive accuracy ~100% in maracaturra, pacamara and bourbon rojo (Figure 5b,e,f), suggesting a remarkable change induced by the time of fermentation. As previously reported, the coffee batches longer fermented are characterized by higher levels of acids.
The drying effect was also evaluated considering coffee batches processed “under shade” and those at “direct sun” exposure. Four RF models were created using available data (Supplementary Materials Figure S9a–d): also, in this case the effect of the different drying procedure is more remarkable in green coffee (Supplementary Materials Figure S9a,b), and in particular the RF model built on metabolites provided a better discrimination of green coffee batches processed in the two different manners (overall predictive accuracy: 71%, Supplementary Materials Figure S9b). Among the quantified metabolites, amino acids (valine and alanine) seem to be the most affected by these procedures (Supplementary Materials Figure S9b1). Univariate analysis confirms valine as the only metabolite which remained significantly altered after the FDR correction (valine: p-value = 0.0006, FDR = 0.008, cliff’s delta = small). The effect of the drying procedure is detectable in each variety Figure 6. In Figure 6 it emerges that valine levels are higher in all coffee beans batches dried at direct sun. Alanine, acetic and chlorogenic acid levels are generally altered in all the considered models, but there is not a unique trend common for all the varieties (Figure 6a–e), demonstrating that each variety differently reacts to the type of drying.

4. Conclusions

Coffee metabolomics research has primarily focused on green and roasted coffee beans from the two main varieties, C. arabica and C. canephora. To the best of our knowledge, there are no metabolomic based studies about the characterization of coffee varieties considering both green and roasted coffee. Here, we have presented detailed and comprehensive information regarding the different metabolomic composition of seven Arabica coffee varieties, using an NMR-based metabolomic approach. For each variety, two points of fermentation time (12 h vs. 24 h) and two types of drying procedures (under shade and direct sun) have been considered. The analyses were performed both considering the entire spectra to evaluate the fingerprint of each variety, and on the identified metabolites, both for green and for roasted coffee beans.
The results demonstrated that NMR spectra of both green and roasted coffee beans can be used to recognise coffee varieties with high accuracies (87.2% and 86% using, respectively green and roasted NMR spectra to build the model).
Moreover, it was also possible to characterize, using this approach, the metabolomic profile of distinct coffee farms within the same restricted geographical area of Nicaragua cultivating the same varieties. Our results demonstrate that, even when coffee batches are processed following the same post-harvest procedure, the characteristic fingerprint of each farm could be derived with high predictive accuracies. The opportunity to quickly obtain NMR spectra with a minimal sample preparation, and to use them to classify samples according to the variety, makes the NMR-based metabolomic approach a suitable approach to recognize original products. Moreover, NMR spectroscopy may be considered as a “magnetic tongue” that analyses and predicts food flavours without being targeted and disruptive.
Therefore, the effects of the time of fermentation and drying types were also evaluated, suggesting that both post-harvest procedures are capable of inducing changes in the metabolic profile of coffee beans that are responsible for different flavours in the cup. In particular, the amount of malic acid, which contributes to a tart acidulous and sour taste, is increased in 24 h of fermentation batches of CR, PA, TE, and BR; trigonelline, instead, related to a bitter taste, is increased in 12 h fermentation in CA, while the other varieties show weaker variation based on the treatments; formic acid which gives a sour/lemon taste, is increased in MC green beans at 24 h of fermentation, while it is decreased in BR cultivar at 24 h of fermentation. Caffeine content seems also to be slightly increased by longer fermentation time. The content of acetic acid, which contributes to a sour vinegar taste, seems to be higher, particularly in CR and PA if exposed to the sun drying, instead, for the other varieties, higher content can be obtained if beans are exposed under shade. The present study suggests that post-harvest treatment procedures can differently affect the amount of aroma precursors within distinct coffee varieties and that the kind of processing should be optimized specifically for each variety.

Supplementary Materials

The following are available online at https://www.mdpi.com/article/10.3390/app112411779/s1, Figure S1: 1H NMR spectra of coffee beans. Figure S2: First two components of PCA score plots of 1H NMR bucketed spectra of green (a) and roasted (b) coffee beans. Figure S3: Random Forest multidimensional scaling (MDS) plots. Figure S4: Univariate analysis on metabolites: cultivars’ comparison (green coffee beans). Figure S5: Univariate analysis on metabolites: cultivars’ comparison (roasted coffee beans). Figure S6: Roasting effect on coffee beans’ metabolites. Figure S7: Farms’ fingerprint and profiling assessment through RF. Figure S8: RF models built on green and roasted NMR bucketed spectra and metabolites: beans fermented 12 h vs. beans fermented 24 h. Figure S9: RF models built on green and roasted NMR bucketed spectra and metabolites: beans dried under shade vs. beans dried at direct sun.Supplementary data tables: containing NMR data (bucketed spectra and area under the peaks of identified molecules) of green and roasted coffee batches used in this study. Table S1: Variety classification within the three farms through RF.

Author Contributions

Conceptualization G.M., C.L., E.G. and L.T.; Data curation G.M.; Formal analysis G.M.; Investigation G.M. and L.T.; Visualization G.M.; Writing Original Draft G.M.; Supervision L.T. and C.L.; Provision of samples A.C.; Funding acquisition C.L.; writing review L.T. and C.L. All authors have read and agreed to the published version of the manuscript.

Funding

This research received no external funding.

Institutional Review Board Statement

Not applicable.

Informed Consent Statement

Not applicable.

Data Availability Statement

Data are contained within the supplementary data table.

Conflicts of Interest

The authors declare no conflict of interest.

References

  1. Vegro, C.L.R.; de Almeida, L.F. Chapter 1—Global Coffee Market: Socio-Economic and Cultural Dynamics. In Coffee Consumption and Industry Strategies in Brazil; De Almeida, L.F., Spers, E.E., Eds.; Woodhead Publishing Series in Consumer Sci & Strat Market; Woodhead Publishing: Sawston, UK, 2020; pp. 3–19. ISBN 978-0-12-814721-4. [Google Scholar]
  2. Samoggia, A.; Riedel, B. Consumers’ Perceptions of Coffee Health Benefits and Motives for Coffee Consumption and Purchasing. Nutrients 2019, 11, 653. [Google Scholar] [CrossRef] [Green Version]
  3. Hameed, A.; Hussain, S.A.; Ijaz, M.U.; Ullah, S.; Pasha, I.; Suleria, H.A.R. Farm to Consumer: Factors Affecting the Organoleptic Characteristics of Coffee. II: Postharvest Processing Factors. Compr. Rev. Food Sci. Food Saf. 2018, 17, 1184–1237. [Google Scholar] [CrossRef] [Green Version]
  4. Worku, M.; de Meulenaer, B.; Duchateau, L.; Boeckx, P. Effect of Altitude on Biochemical Composition and Quality of Green Arabica Coffee Beans Can Be Affected by Shade and Postharvest Processing Method. Food Res. Int. 2018, 105, 278–285. [Google Scholar] [CrossRef]
  5. De Bruyn, F.; Zhang, S.J.; Pothakos, V.; Torres, J.; Lambot, C.; Moroni, A.V.; Callanan, M.; Sybesma, W.; Weckx, S.; De Vuyst, L. Exploring the Impacts of Postharvest Processing on the Microbiota and Metabolite Profiles during Green Coffee Bean Production. Appl. Environ. Microbiol. 2017, 83, e02398-16. [Google Scholar] [CrossRef] [Green Version]
  6. Guizellini, F.C.; Marcheafave, G.G.; Rakocevic, M.; Bruns, R.E.; Scarminio, I.S.; Soares, P.K. PARAFAC HPLC-DAD Metabolomic Fingerprint Investigation of Reference and Crossed Coffees. Food Res. Int. 2018, 113, 9–17. [Google Scholar] [CrossRef]
  7. Kwon, D.-J.; Jeong, H.-J.; Moon, H.; Kim, H.-N.; Cho, J.-H.; Lee, J.-E.; Hong, K.S.; Hong, Y.-S. Assessment of Green Coffee Bean Metabolites Dependent on Coffee Quality Using a 1H NMR-Based Metabolomics Approach. Food Res. Int. 2015, 67, 175–182. [Google Scholar] [CrossRef]
  8. Vignoli, A.; Ghini, V.; Meoni, G.; Licari, C.; Takis, P.G.; Tenori, L.; Turano, P.; Luchinat, C. High-Throughput Metabolomics by 1D NMR. Angew. Chem. Int. Ed. Engl. 2019, 58, 968–994. [Google Scholar] [CrossRef]
  9. Consonni, R.; Cagliani, L.R.; Cogliati, C. NMR Based Geographical Characterization of Roasted Coffee. Talanta 2012, 88, 420–426. [Google Scholar] [CrossRef]
  10. Wei, F.; Furihata, K.; Hu, F.; Miyakawa, T.; Tanokura, M. Complex Mixture Analysis of Organic Compounds in Green Coffee Bean Extract by Two-Dimensional NMR Spectroscopy. Magn. Reson. Chem. 2010, 48, 857–865. [Google Scholar] [CrossRef]
  11. Wei, F.; Furihata, K.; Koda, M.; Hu, F.; Kato, R.; Miyakawa, T.; Tanokura, M. 13C NMR-Based Metabolomics for the Classification of Green Coffee Beans According to Variety and Origin. J. Agric. Food Chem. 2012, 60, 10118–10125. [Google Scholar] [CrossRef]
  12. Wei, F.; Furihata, K.; Koda, M.; Hu, F.; Miyakawa, T.; Tanokura, M. Roasting Process of Coffee Beans as Studied by Nuclear Magnetic Resonance: Time Course of Changes in Composition. J. Agric. Food Chem. 2012, 60, 1005–1012. [Google Scholar] [CrossRef]
  13. Monakhova, Y.B.; Ruge, W.; Kuballa, T.; Ilse, M.; Winkelmann, O.; Diehl, B.; Thomas, F.; Lachenmeier, D.W. Rapid Approach to Identify the Presence of Arabica and Robusta Species in Coffee Using 1H NMR Spectroscopy. Food Chem. 2015, 182, 178–184. [Google Scholar] [CrossRef]
  14. Bicho, N.C.; Leitão, A.E.; Ramalho, J.C.; de Alvarenga, N.B.; Lidon, F.C. Impact of Roasting Time on the Sensory Profile of Arabica and Robusta Coffee. Ecol. Food Nutr. 2013, 52, 163–177. [Google Scholar] [CrossRef]
  15. World Coffee Research. Available online: https://worldcoffeeresearch.org/ (accessed on 26 November 2021).
  16. Mengistu, M.W.; Workie, M.A.; Mohammed, A.S. Biochemical Compounds of Arabica Coffee (Coffea arabica L.) Varieties Grown in Northwestern Highlands of Ethiopia. Cogent Food Agric. 2020, 6, 1741319. [Google Scholar] [CrossRef]
  17. Wang, Y.; Wang, X.; Hu, G.; Hong, D.; Bai, X.; Guo, T.; Zhou, H.; Li, J.; Qiu, M. Chemical Ingredients Characterization Basing on 1H NMR and SHS-GC/MS in Twelve Cultivars of Coffea Arabica Roasted Beans. Food Res. Int. 2021, 147, 110544. [Google Scholar] [CrossRef]
  18. Tenori, L.; Santucci, C.; Meoni, G.; Morrocchi, V.; Matteucci, G.; Luchinat, C. NMR Metabolomic Fingerprinting Distinguishes Milk from Different Farms. Food Res. Int. 2018, 113, 131–139. [Google Scholar] [CrossRef]
  19. D’Amelio, N.; Fontanive, L.; Uggeri, F.; Suggi-Liverani, F.; Navarini, L. NMR Reinvestigation of the Caffeine–Chlorogenate Complex in Aqueous Solution and in Coffee Brews. Food Biophys. 2009, 4, 321–330. [Google Scholar] [CrossRef]
  20. Abdi, H.; Williams, L.J. Principal Component Analysis. WIREs Comp. Stat. 2010, 2, 433–459. [Google Scholar] [CrossRef]
  21. Breiman, L. Random Forests. Mach. Learn. 2001, 45, 5–32. [Google Scholar] [CrossRef] [Green Version]
  22. Liaw, A.; Wiener, M. Classification and Regression by RandomForest. R News 2002, 2, 18–22. [Google Scholar]
  23. Posthoc.Kruskal.Dunn.Test: Pairwise Test for Multiple Comparisons of Mean Rank Sums (Dunn’s-Test). Available online: https://www.rdocumentation.org/packages/PMCMR/versions/4.3/topics/posthoc.kruskal.dunn.test (accessed on 27 November 2021).
  24. Ribeiro, B.B.; de Carvalho, A.M.; Cirillo, M.Â.; Câmara, F.M.d.M.; Montanari, F.F. Sensory Profile of Coffees of Different Cultivars, Plant Exposure and Post-Harvest. Afr. J. Agric. Res. 2019, 14, 1111–1113. [Google Scholar] [CrossRef] [Green Version]
  25. Casal, S.; Oliveira, M.B.P.P.; Alves, M.R.; Ferreira, M.A. Discriminate Analysis of Roasted Coffee Varieties for Trigonelline, Nicotinic Acid, and Caffeine Content. J. Agric. Food Chem. 2000, 48, 3420–3424. [Google Scholar] [CrossRef]
  26. Farag, M.A.; El-Kersh, D.M.; Ehrlich, A.; Choucry, M.A.; El-Seedi, H.; Frolov, A.; Wessjohann, L.A. Variation in Ceratonia Siliqua Pod Metabolome in Context of Its Different Geographical Origin, Ripening Stage and Roasting Process. Food Chem. 2019, 283, 675–687. [Google Scholar] [CrossRef]
  27. Campa, C.; Ballester, J.F.; Doulbeau, S.; Dussert, S.; Hamon, S.; Noirot, M. Trigonelline and Sucrose Diversity in Wild Coffea Species. Food Chem. 2004, 88, 39–43. [Google Scholar] [CrossRef]
  28. Wei, F.; Tanokura, M. Chapter 10—Chemical Changes in the Components of Coffee Beans during Roasting. In Coffee in Health and Disease Prevention; Preedy, V.R., Ed.; Academic Press: San Diego, CA, USA, 2015; pp. 83–91. ISBN 978-0-12-409517-5. [Google Scholar]
  29. Alonso-Salces, R.M.; Serra, F.; Reniero, F.; HÉberger, K. Botanical and Geographical Characterization of Green Coffee (Coffea Arabica and Coffea Canephora): Chemometric Evaluation of Phenolic and Methylxanthine Contents. J. Agric. Food Chem. 2009, 57, 4224–4235. [Google Scholar] [CrossRef]
  30. Clifford, M.N.; Kazi, T. The Influence of Coffee Bean Maturity on the Content of Chlorogenic Acids, Caffeine and Trigonelline. Food Chem. 1987, 26, 59–69. [Google Scholar] [CrossRef]
  31. Mehari, B.; Redi-Abshiro, M.; Chandravanshi, B.S.; Atlabachew, M.; Combrinck, S.; McCrindle, R. Simultaneous Determination of Alkaloids in Green Coffee Beans from Ethiopia: Chemometric Evaluation of Geographical Origin. Food Anal. Methods 2016, 9, 1627–1637. [Google Scholar] [CrossRef]
  32. Jeszka-Skowron, M.; Frankowski, R.; Zgoła-Grześkowiak, A. Comparison of Methylxantines, Trigonelline, Nicotinic Acid and Nicotinamide Contents in Brews of Green and Processed Arabica and Robusta Coffee Beans—Influence of Steaming, Decaffeination and Roasting Processes on Coffee Beans. LWT 2020, 125, 109344. [Google Scholar] [CrossRef]
  33. Zhou, B.; Ma, C.; Ren, X.; Xia, T.; Li, X. LC–MS/MS-Based Metabolomic Analysis of Caffeine-Degrading Fungus Aspergillus Sydowii during Tea Fermentation. J. Food Sci. 2020, 85, 477–485. [Google Scholar] [CrossRef]
Figure 1. 1H NMR spectra (400 MHz) of water-soluble green (a) and roasted (b) coffee beans. (1) fatty acids; (2) isoleucine; (3) valine; (4) propionic acid; (5) lactic acid; (6) alanine; (7) unknown1; (8) quinic acid; (9) acetic acid; (10) hydroxy acetone; (11) acetone; (12) gamma-aminobutyric acid (GABA); (13) malic acid; (14) citric acid; (15) choline; (16) caffeine; (17) theophylline; (18) myo-inositol; (19) glycolic acid; (20) trigonelline; (21) 2-furylmethanol; (22) 5-caffeolylquinic acid (5-CQA); (23) sucrose; (24) citraconic acid; (25) chlorogenic acids; (26) fumaric acid; (27) xanthine; (28) formic acid; (29) N-methylpyridinium (NMP); (30) nicotinic acid; (31) 5-hydroxymethylfurfural (5-HMF); (32) anserine; (33) methyl xanthines; (34) putrescine.
Applsci 11 11779 g001
Figure 2. Variety fingerprint assessment through RF. Confusion matrices of RF algorithm of green (a) and roasted (b) coffee bean spectra. A summary of the variable importance measures for the buckets of coffee NMR spectra with variety as the response variable in the RF model is reported: (c) for green coffee model (a,d) for roasted coffee model (b). Buckets are ranked according to the mean decrease in classification accuracy when they are permuted. Calculated RF class error and mean decrease accuracy units can be also read as percentage (e.g., class error of 0.05, means 5%). Most important buckets regions corresponding to assignable resonance present both in green and roasted coffee RF models (c,d) are labeled accordingly: fatty acid, FA; trigonelline, TR; citric acid, CT. Corresponding RF score plots are reported in Supplementary Materials Figure S3.
Applsci 11 11779 g002
Figure 3. Variety profiling. Confusion matrices of RF algorithm of green (a) and roasted (b) metabolites of coffee beans. A summary of the variable importance measures for the identified metabolites with variety as the response variable in the RF model (a) of green coffee (c) and model (b) of roasted coffee (d). Metabolites are ranked according to the mean decrease in classification accuracy. At the bottom are reported the boxplots of the trigonelline levels in green (e) and roasted beans (f) among the seven different coffee varieties.
Applsci 11 11779 g003aApplsci 11 11779 g003b
Figure 4. Log2(FC) of metabolites’ concentrations characteristic of distinct farms. Positive Log2(FC) values represent higher level of green coffee (a) and roasted coffee (b) metabolites in farm 1 compared to farm 3 (negative Log2(FC) values) considering catuai rojo batches; positive values represent higher levels of green coffee (c) and roasted coffee (d) metabolites in farm 1 compared to farm 2 (negative Log2(FC) values) considering bourbon batches. Dark gray bars represent the metabolites which are statistically significant after the FDR p-value correction (FDR < 0.05), gray bars for those metabolites that show a p-value < 0.05 but lose significance after the False Discovery Rate correction. Asterisks represent the Cliff’s delta effect-size, were “***” means large effect, “**” medium effect.
Applsci 11 11779 g004
Figure 5. RF models on green coffee metabolites characterizing each variety according to 12 or 24 h of beans fermentation. (a) catuai rojo; (b) maracaturra; (c) bourbon; (d) caturra; (e) pacamara; (f) tekesic; (g) bourbon rojo. Mean decrease accuracy values are reported on the orthogonal axis of each plot.
Applsci 11 11779 g005aApplsci 11 11779 g005b
Figure 6. RF models on green coffee metabolites characterizing each variety according to the different drying procedures used: “under shade” and “direct sun”. (a) catuai rojo; (b) maracaturra; (c) bourbon; (d) caturra; (e) pacamara; (f) tekesic; (g) bourbon rojo. Mean decrease accuracy values are reported on the orthogonal axis of each plot.
Applsci 11 11779 g006aApplsci 11 11779 g006b
Table 1. List of the Nicaraguan coffee batches analyzed.
FarmVarietyFermentation Time (h)DryingMunicipalityBatch Code
1CR12UsDipilto346
1CR12DsDipilto347
1CR24UsDipilto348
1CR24DsDipilto349
1MC12UsDipilto352
1MC12DsDipilto353
1MC24UsDipilto350
1MC24DsDipilto351
1BO12UsDipilto356
1BO12DsDipilto357
1BO24UsDipilto354
1BO24DsDipilto355
2CA12UsDipilto337
2CA12DsDipilto336
2CA24UsDipilto335
2CA24DsDipilto334
2PA12UsDipilto341
2PA12DsDipilto340
2PA24UsDipilto339
2PA24DsDipilto338
2BO12UsDipilto345
2BO12DsDipilto344
2BO24UsDipilto343
2BO24DsDipilto342
3CR12UsMozonte362
3CR12DsMozonte363
3CR24UsMozonte364
3CR24DsMozonte365
3TE12UsMozonte366
3TE12DsMozonte367
3TE24UsMozonte368
3TE24DsMozonte369
3BR12UsMozonte358
3BR12DsMozonte359
3BR24UsMozonte360
3BR24DsMozonte361
Publisher’s Note: MDPI stays neutral with regard to jurisdictional claims in published maps and institutional affiliations.

