1. Introduction
Low-frequency Raman spectra (<200 cm−1) are interesting for studies of intramolecular vibrational modes of large molecules or heavy functional groups, and for studies of intermolecular force constants. This vibrational region can be accessed with the necessary rejection of elastically scattered light by spontaneous Raman techniques using triple monochromators, which, however, represent an expensive and cumbersome solution with a relatively low signal yield. More recently, special Bragg filters replacing the dispersive systems have been developed to overcome these shortcomings, but they have the disadvantage of being laser excitation wavelength specific.
A different approach takes advantage of Raman coherence, in the so-called impulsive stimulated Raman scattering (ISRS) method, which allows excitation of coherent vibrational modes within the bandwidth of ultrashort laser pulses [
1] and, accordingly, is capable of producing intense signals. This capability is particularly useful in imaging applications, where signal acquisition speed is an asset, and in characterization of biological, unstable or photodegradable samples, which require low excitation power [
2]. In ISRS, different Fourier components contained in the broad spectrum of an ultrafast laser (pump) pulse interact simultaneously with the Raman medium to create a coherent Raman state when their frequency difference matches a vibrational resonance. The associated polarization wave interacts with a subsequent (weak) probe pulse, whose resulting modifications are used to retrieve the sample Raman spectrum. Among other applications, ISRS has proven useful in the detection of intramolecular Raman resonances and of librational and diffusive modes of molecules in liquids [
3,
4].
In recent papers [
5,
6,
7,
8,
9], several methods to detect ISRS signals were proposed in setups using a single low-energy femtosecond oscillator, thus avoiding the use of amplified systems, which, besides being expensive, are generally not suitable for characterization of biological or unstable samples. The common experimental arrangement is based on Fourier-transform (FT) degenerate pump–probe setups, where an ultrashort laser pulse is split to derive both the pump and the probe pulses. Spectral and refractive (phase) changes of the latter, induced by the interference with the sample Raman polarization, are then monitored as a function of the pump–probe delay, and the sample Raman spectrum is finally obtained from the Fourier transform of the delay-dependent data. The tiny modifications induced on the probe beam can be measured for each delay point using lock-in techniques by chopping the pump beam (delay averaging); alternatively, the delay-dependent signal can be obtained by averaging the time-dependent signal produced by continuous periodic scanning of the delay (scan averaging), avoiding the necessity of pump modulation. Advantages and shortcomings of the two averaging methods have been discussed in the literature [
10]; in particular, scan averaging systems have been shown to be more effective in reducing the data noise and increasing the data acquisition speed, and also in decreasing the amount of spurious effects otherwise produced by the pump modulation associated with delay averaging methods [
5]. Here, we make use of the scan averaging technique as reported in [
5].
Recently, there has been a surge in interest in the use of different detection techniques suitable to reveal the spectral and phase modifications of the probe pulse. While spectral information relies on stimulated Raman gain and loss effects, phase information depends on the Raman-induced Kerr effect (RIKE), due to the electronic polarizability coupling with the nuclear coordinates and producing refractive effects governed by the Raman modes of the material [
11,
12]. The first comparison of sensitivity and response of the spectral and refractive detection approaches was proposed by Wahlstrand [
13], who made use of a Sagnac interferometer for detection of the probe phase changes; however, much simpler systems using Kerr lens-induced beam displacement or beam propagation effects have been investigated as early as the 1990s [
14,
15] and subsequently used extensively in other papers by the same and other groups [
16,
17,
18,
19], and more recently by Ranaan et al. in [
12]. Here, the radially dependent phase changes are detected by measuring the Raman-induced Kerr lens effect on the probe beam propagation using a detector placed behind a pinhole in the beam far field. Detection of the nonlinear Kerr lens by measurements of the beam propagation modification using a small-size detector in the far field is the basis of the well-known Z-scan technique [
20], originally proposed for third-order nonlinear optical characterization of transparent samples. In this technique, the sample position (Z) is scanned along the propagation direction of a focused laser beam, and the changes in the beam profile due to the nonlinear Kerr lens produced by the beam itself are detected by measuring the transmitted intensity through a pinhole in the far field (so-called closed-aperture detection).
A direct relationship between “true” Z-scan measurements, i.e., obtained by scanning the sample position, and femtosecond impulsive stimulated Raman experiments was proposed in [
21]. However, in that paper, the occurrence of cumulative thermal effects [
22] due to the use of a high-repetition rate laser oscillator was not properly addressed, thus preventing correct interpretation of the observed signals. In fact, in [
21], an 80 MHz repetition rate oscillator was used, corresponding to 12.5 ns laser pulse spacing, and during the measurements, the sample was illuminated for 1 ms, i.e., with a train of closely spaced pulses; however, as shown in [
22,
23], in these conditions, the observed Z-scan is essentially due to thermo-optical effects, which actually produce a large negative “nonlinear” refractive index that overwhelms the much smaller RIKE contribution. As a matter of fact, one major difficulty in experiments aimed at detecting ultrafast effects such as femtosecond SRS by Z-scan measurements in setups based on low-energy femtosecond oscillators is the occurrence of thermo-optical effects produced by the inherently high repetition rate of self-Kerr lens modelocked oscillators. The unambiguous detection of the RIKE component in Z-scan measurements is the goal of the current work. This objective was pursued by means of a Fourier-transform ISRS setup based on a femtosecond laser oscillator equipped with a cavity dumper, allowing control of the repetition rate to virtually eliminate cumulative thermal effects. By performing Z-scan measurements with the modulated Z-scan technique (MZ-scan) in different pump–probe conditions and delays on a dibromomethane (CH
2Br
2) sample, we were able to observe clear variations in the Z-scan traces, showing the unmistakable signature of coherent Raman oscillations.
2. Materials and Methods
The experimental apparatus is based on the interferometer design used in [
6] as modified with the fast scan mechanism proposed in [
5], with further modifications to allow for MZ-scan measurements, and modifications in the signal detection assembly, as detailed below; the scheme is shown in
Figure 1.
Briefly, the excitation beam was produced by a femtosecond oscillator (MIRA 900 F, Coherent Inc., Santa Clara, CA, USA) operating at 780 nm wavelength, equipped with a cavity dumper (APE GmbH, Berlin, Germany) with electronic control for selection of the repetition rate; operation at 1 kHz was chosen to completely exclude cumulative thermo-optical effects. The laser bandwidth was 10 nm FWHM as measured with a spectrometer (Horiba Jobin-Yvon, Horiba SAS, Palaiseau, France), allowing impulsive excitation of Raman modes below approximately 200 cm−1. After passing through a prism compressor for dispersion compensation, and through a half-wave plate for polarization control, the beam was fed into a Michelson interferometer with orthogonally polarized arms by using a polarizing beam splitter. To realize the scan averaging technique, one of the interferometer arms, the pump/Stokes arm, includes a fast scanning delay line, realized by a retroreflector mounted on an actuator driven by a triangular wave, capable of oscillating at a few tens of hertz, producing a delay up to several picoseconds, and placed on a computer-controlled linear stage. The two beams were recombined and focused by a 5 cm focal length lens onto the sample contained in a 1 mm-thick quartz cuvette placed on an actuator to allow oscillation of the sample around the focus position, as is necessary for MZ-scan measurements; the actuator itself was mounted on a manual linear stage to allow fine setting of the rest position of the sample. The beam on the sample had a 120 fs autocorrelator-measured pulse width with typical energies of a few nanojoules for each beam and a 10:3 pump/probe energy ratio.
After the sample, the pump/Stokes beam was filtered out by a Glan-laser polarizer, and the surviving probe beam was directed, using a 50/50 beam splitter, to two signal detection systems, in order to simultaneously detect the ISRS-induced spectral shift and the Raman-induced Kerr lens effects. The spectral shift detection system was composed of a collimating lens and a 780 nm long-wave pass edge filter (LP02-780RU-25 Semrock, IDEX Health & Science, LLC, Rochester, NY, USA) tilted in order to transmit approximately 50% of the incoming beam to a large-area photodiode (DET100 A/M, Thorlabs GmbH, Bergkirchen, Germany). The Kerr lens detection system was composed of a closed-aperture Z-scan-like arrangement, i.e., a photodiode (DET100 A/M Thorlabs) placed in the beam far field after a pinhole, thus capable of detecting the changes in the beam profile.
Due to the use of the cavity dumper, reducing the laser repetition rate, the signals generated by the photodiodes are well-isolated narrow pulses, different from the common high-repetition rate case, where, owing to the few-nanosecond pulse interval, a small amount of integration is sufficient to produce a continuous signal. Therefore, a fast resettable sample-and-hold module (611A-2-20-50, Analog Modules Inc., Longwood, FL, USA) was used to transform the low-duty cycle signals in quasi-continuous waveforms. A USB digitizer (USB1608 GX, Measurement Computing Corp., Norton, MA, USA) finally provided data acquisition and display under a LabView program which performs data averaging, as is necessary to exploit the scan averaging noise reduction and sensitivity enhancement [
5], and data storage.
For ISRS measurements, the pump delay was periodically modulated at 10 Hz by the oscillation of the actuator placed in the pump arm, and the signals produced by the detection photodiodes were digitized as a function of time. Using the scan averaging method with 200 averages and about 20 s acquisition time, we obtained the data shown in
Figure 2a,b for the spectral and refractive detection channels respectively; from the Raman spectra shown in
Figure 2c we calculated a signal-to-background ratio equal to 460 and 195 by dividing the Raman peak intensity values at 173 cm
−1 by the average values of the background in the 200–500 cm
−1 region, for the two detection channels respectively. The absolute pump–probe delay due to the actuator movement, i.e., the conversion of the apparent time scale (see
Figure 2a,b), was calibrated using the ISRS signal produced by a routinely used reference sample with a known low-frequency Raman resonance, i.e., a CH
2Br
2 sample in the present case (see [
5] for details).
For the Z-scan measurements, the sample position was made to oscillate around the beam focus using the actuator which holds the cuvette, and the signal produced by the probe beam on the closed-aperture photodiode (i.e., the Kerr lens detection assembly) was registered as a function of time. To obtain the Z-scan trace as a function of the sample position, the actuator movement was calibrated by matching the data with those measured in the usual way, i.e., moving the sample with a linear stage. This arrangement (MZ-scan) allowed highly sensitive and noiseless measurements of the Z-scan traces [
24], as is necessary in the present work to observe the very small effects of the Raman-induced Kerr lens. The two arms of the interferometer can be used to perform both the usual single-beam measurements using the probe pulse alone, or pump–probe measurements at various delays, by moving the linear stage placed in the pump arm, with the delay actuator at rest. Demonstration of the Z-scan operation mode is shown in
Figure 3, where a single-beam measurement on a carbon disulfide (CS
2) standard reference sample, obtained by closing the pump beam, is reported.
As evidenced by an attempt to fit the data with the commonly used simple theoretical model [
20], assuming a TEM
00 Gaussian beam, thin sample and small nonlinearities, the experimental traces deviated substantially from the model. Actually, we verified that in our experimental setup, the excitation beam profile could not be described as a fundamental Gaussian beam; moreover, the thin sample approximation was not fully verified. Therefore, we used the known value of the CS
2 sample nonlinear refractive index for hundred-femtosecond pulses, i.e.,
γref = 2 × 10
−6 cm
2/GW [
23,
25,
26,
27], as a reference value to calibrate our system and to obtain the Kerr nonlinearity of other samples, using the method described in [
28], essentially exploiting the linear dependence of the Z-scan peak–valley amplitude Δ
Tpv on the nonlinear refractive index for small nonlinearities. Here, the peak–valley amplitude of the CS
2 reference sample was
, and thus, given the measured value
of an unknown sample in the same excitation conditions, the associated refractive index is given by
It is worth underlining that while the absolute value of the nonlinearity can be of importance, the results reported below can actually be discussed in relative terms without affecting their validity.
3. Results
The typical ISRS signals obtained on the CH
2Br
2 sample from both the spectral and the Kerr lens detection arms are shown in
Figure 2a,b, for the sample positions corresponding to the maximum signal intensity for each method, together with the corresponding Fourier transform (
Figure 2c), showing the sample spectrum. The observed peak is due to the well-known scissoring mode of the CH
2Br
2 molecule.
The phase of the Raman oscillations in
Figure 2a,b shows the expected sine and cosine dependence on the delay for the spectral and refractive nonlinearities, respectively, as predicted by ISRS models [
13,
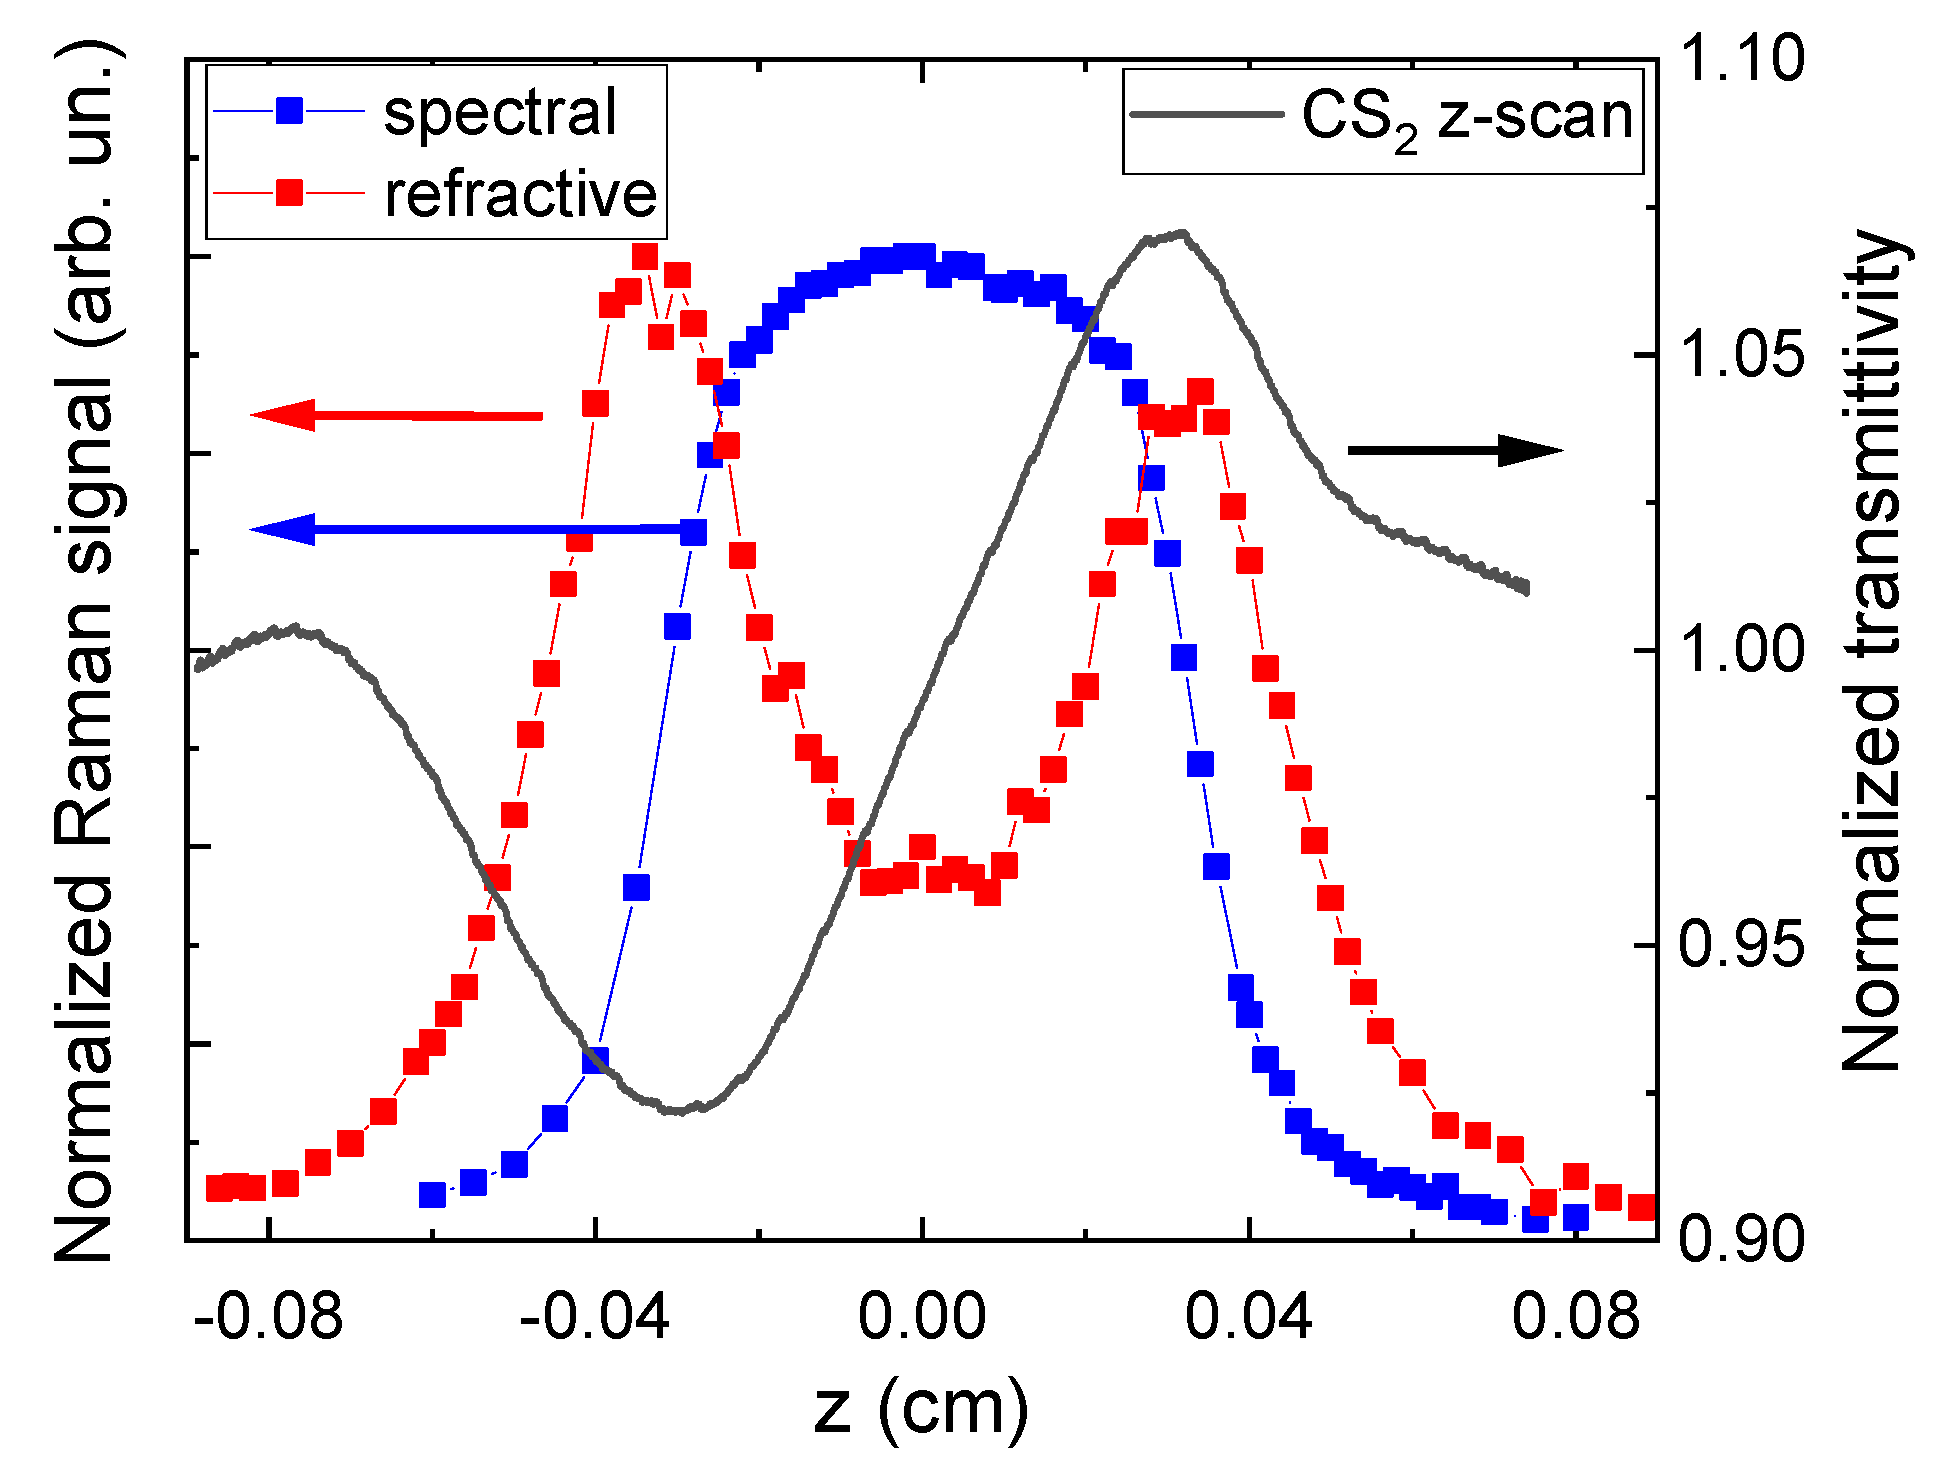
29]. While the Raman signal intensity obtained from spectral shift detection showed a single maximum when the sample was placed in the L1 lens focus, in the case of refractive detection (see
Figure 2b), we observed two signal maxima at pre-focal and post-focal positions (
z− and
z+, respectively) equidistant from the L1 lens focus, with opposite focusing behavior.
The two signal maxima observed for refractive detection correspond to the positions where the effect of the nonlinear Kerr lens on the beam propagation is maximized, i.e., to the positions of the peak and valley in Z-scan signals. The dependence of the Raman signal intensity on the sample position for the two detection methods is shown in
Figure 4, together with a reference Z-scan trace evidencing the correspondence of the two signal maxima observed using the Kerr lens detection method with the valley and peak in Z-scan measurements.
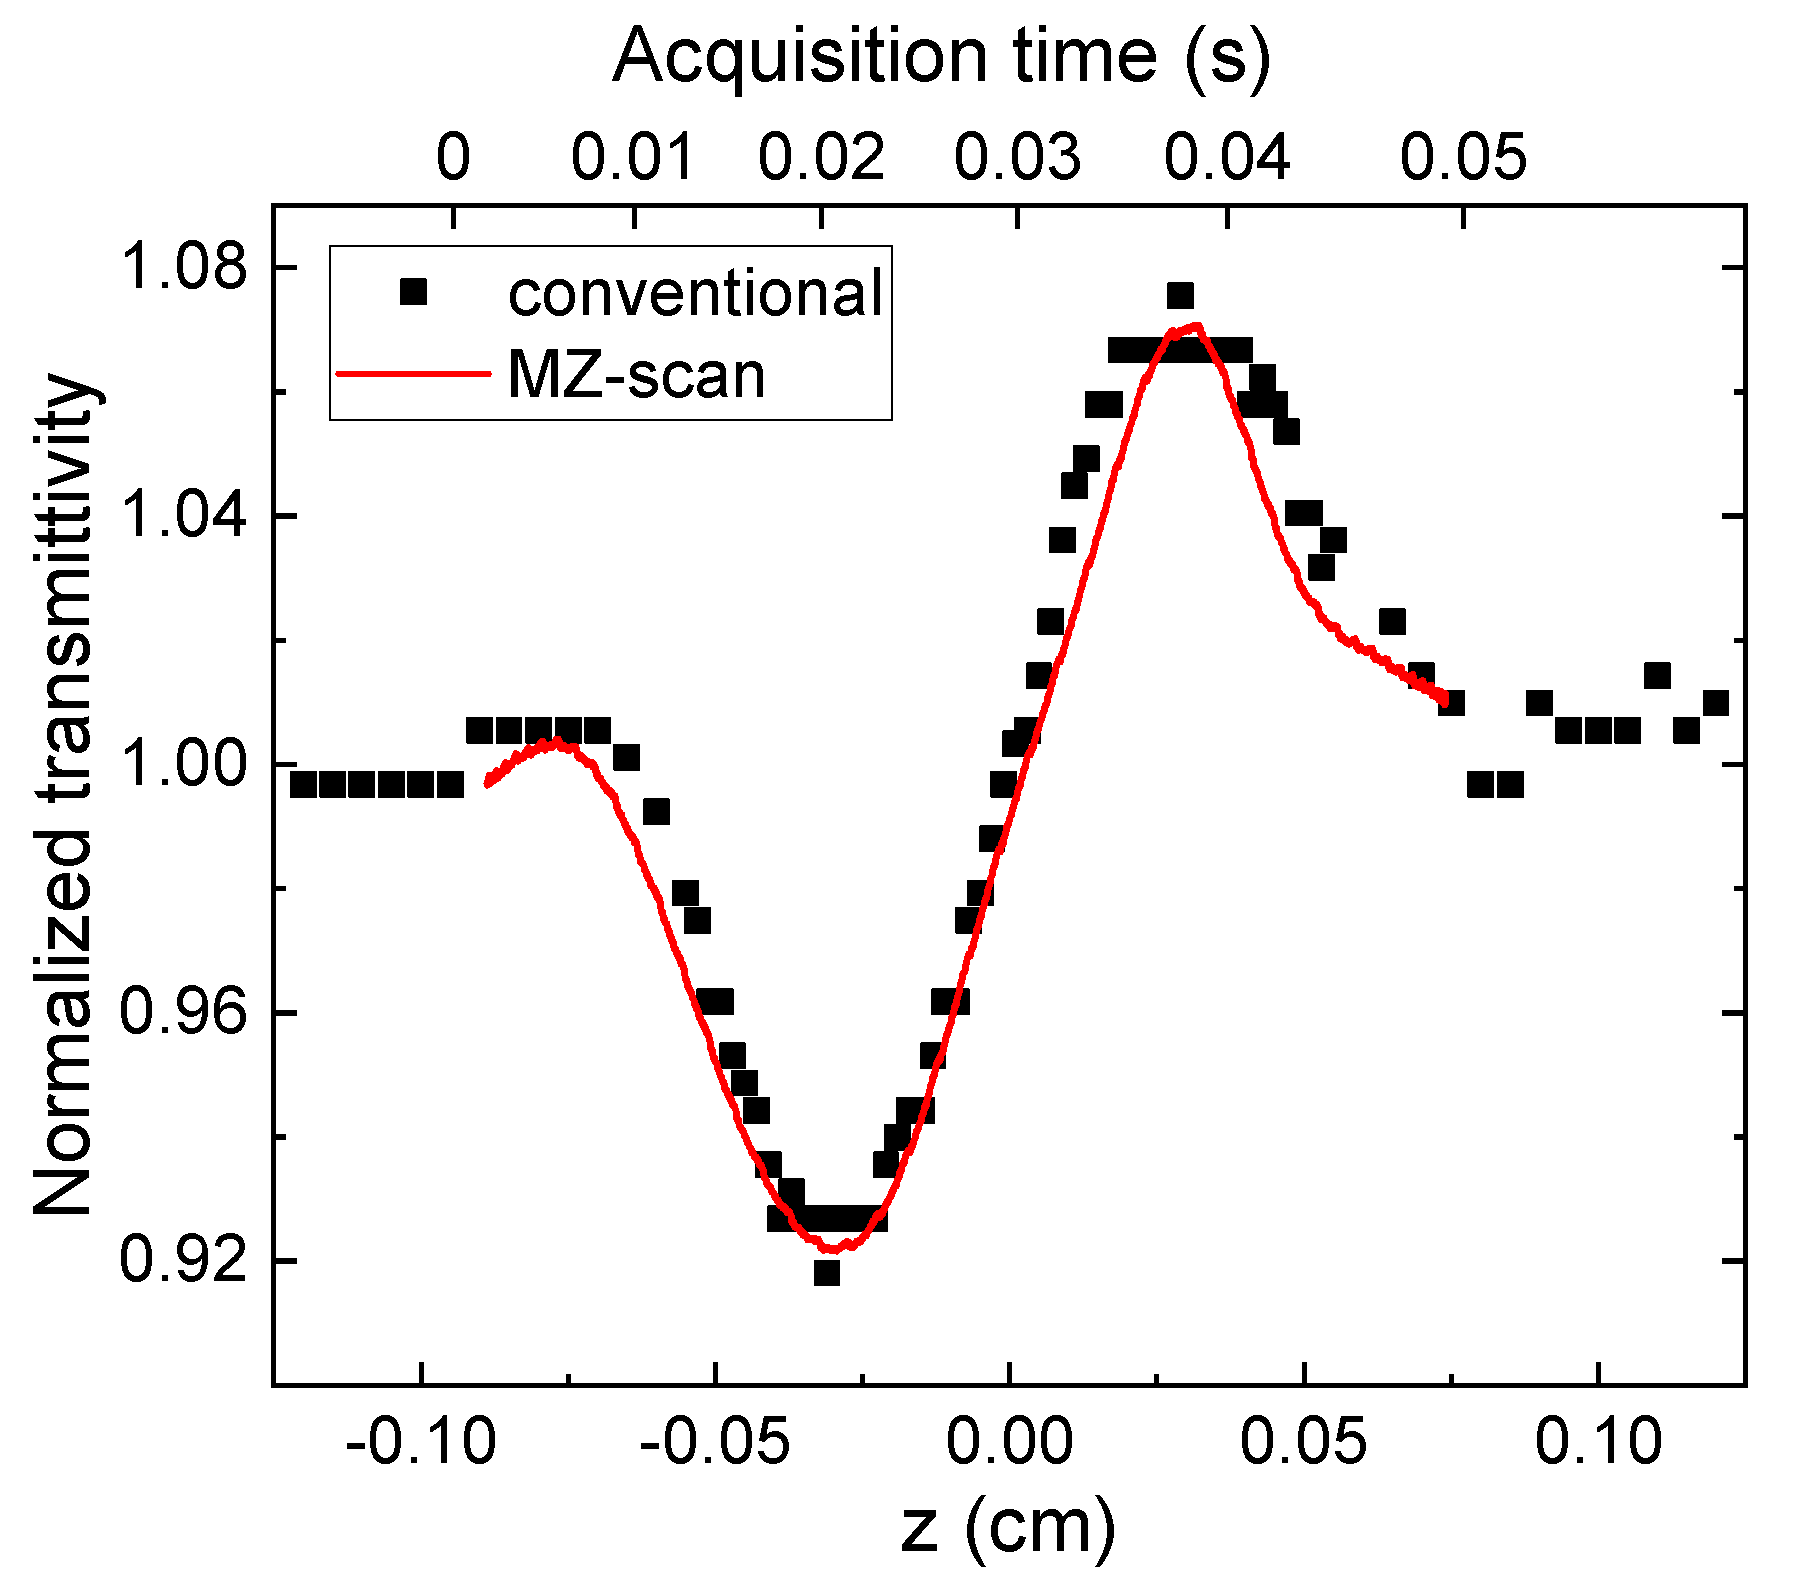
Having demonstrated and characterized the operation of the experimental apparatus as an ISRS interferometer and as a femtosecond Z-scan system on reference samples, we now show the Z-scan traces obtained from the CH
2Br
2 sample in the single-beam (probe alone) configuration, and in the presence of a pump pulse preceding the probe pulse by 1.5 ps, in
Figure 5. The precise value of the pump–probe delay was selected by first finding the position corresponding to coincidence, with the help of the strong cross-phase modulation signal produced in this case. The single-beam trace shows a valley–peak configuration corresponding to a positive Kerr lens phase shift, as expected for a non-resonant nonlinearity, with
, and, using Equation (1), we can infer a nonlinear refractive index
γp = 7.2 × 10
−7 cm
2/GW.
In the presence of the pump pulse (see
Figure 5), the overall shape of the trace does not change, but a slight reduction of the peak–valley amplitude is clearly seen: the corresponding nonlinear refractive index calculated for
is
γPp = 6.0 × 10
−7 cm
2/GW. The difference between
(pump–probe) and
(probe alone) is a negative nonlinear refractive index contribution caused by the presence of the pump pulse, i.e., by the coherent molecular motions.
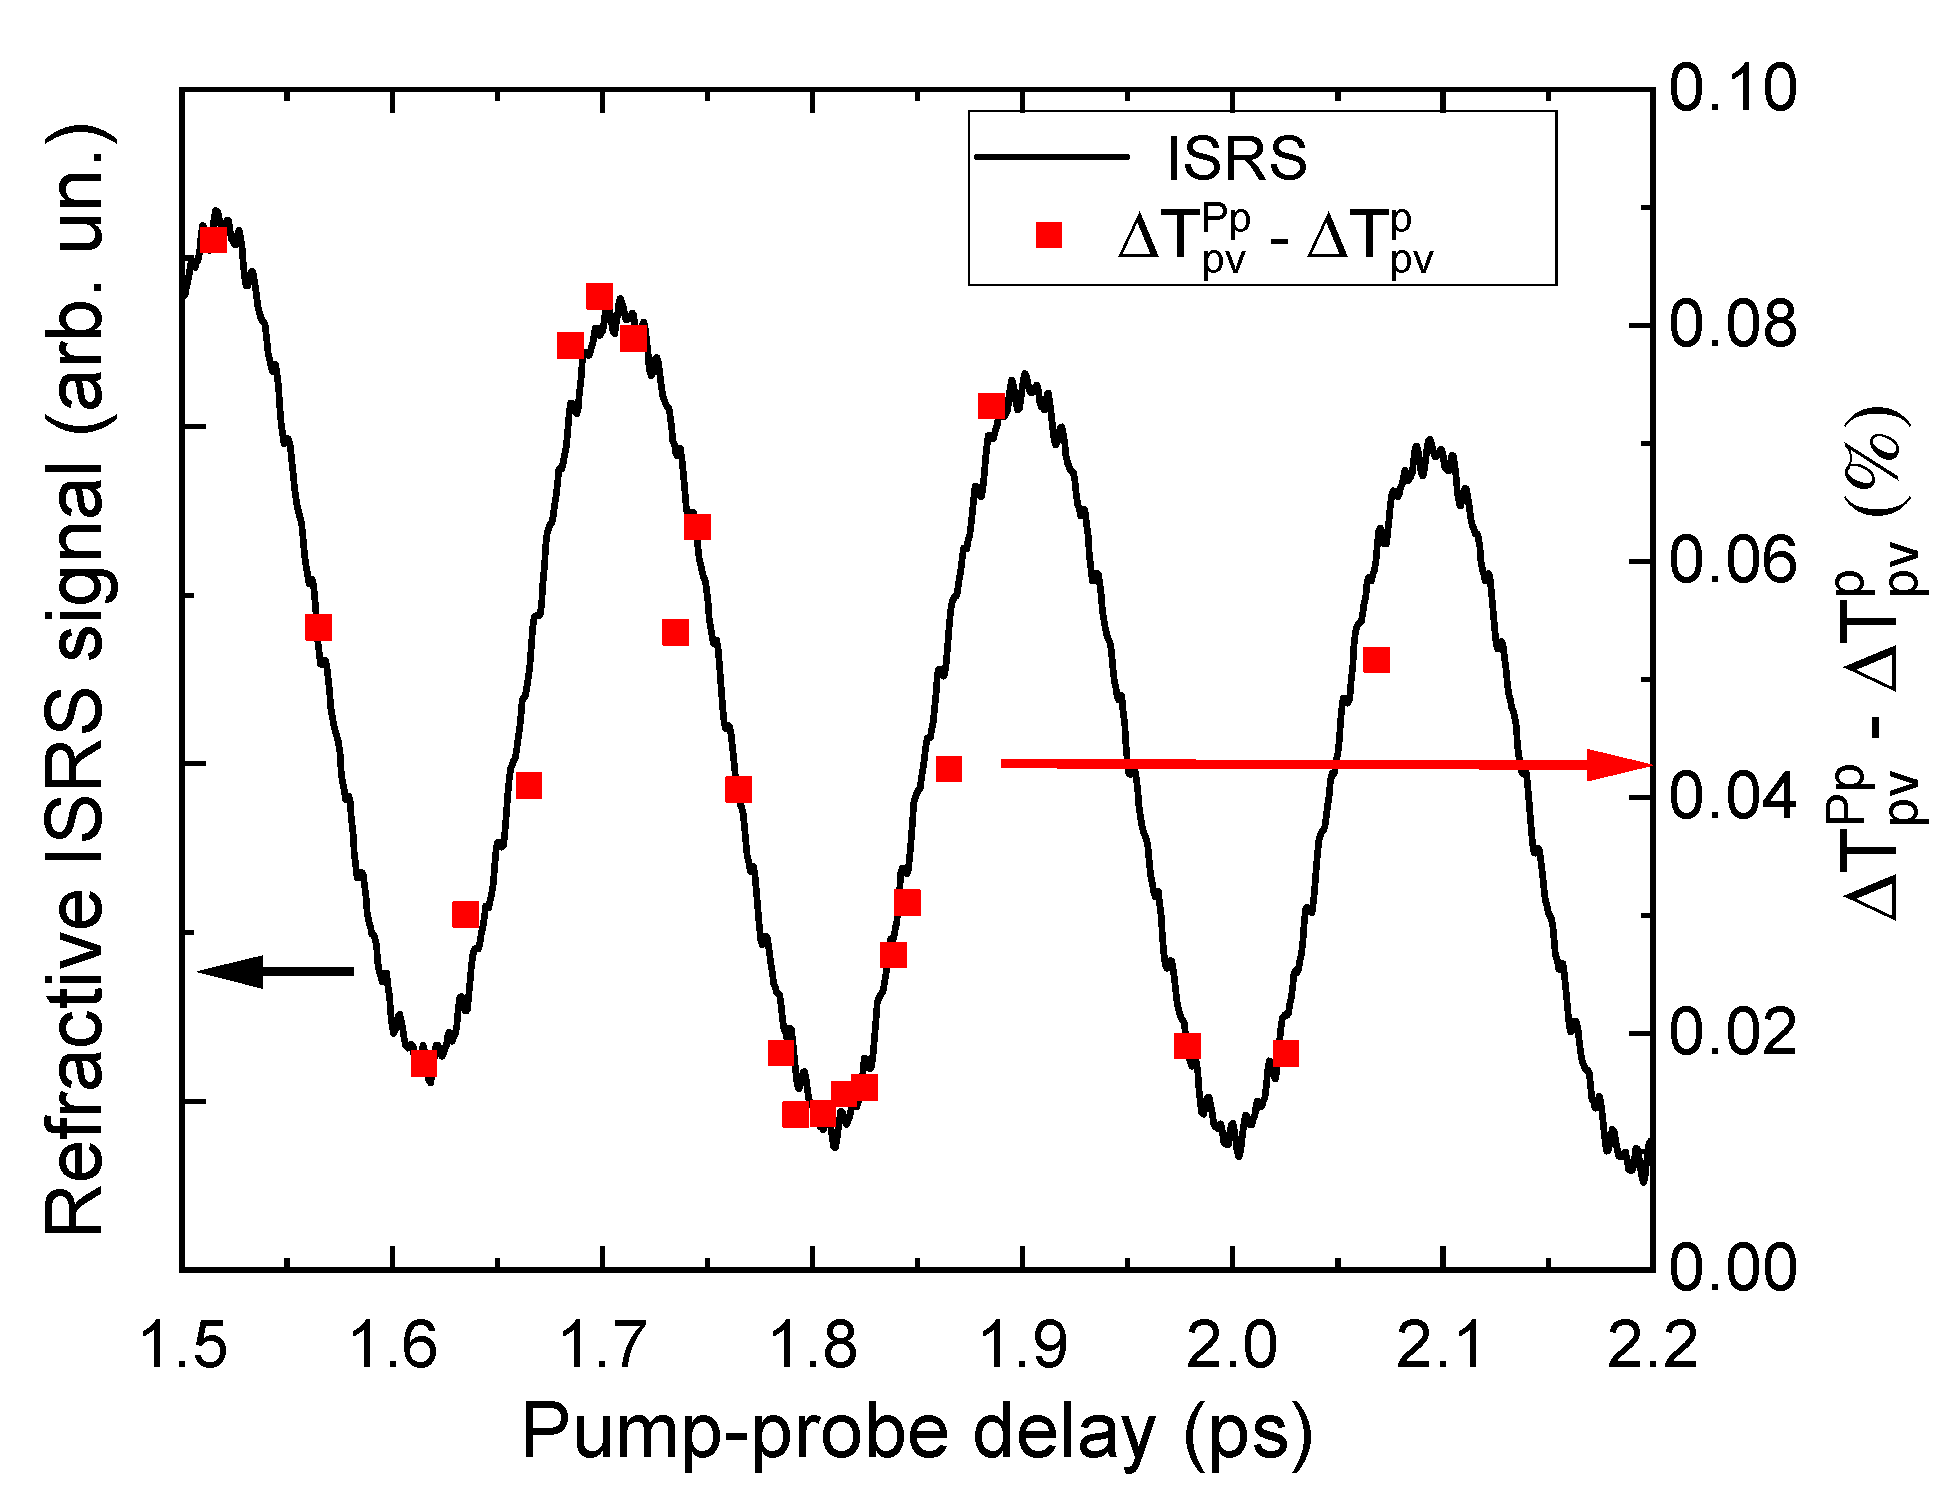
In order to observe the Raman (oscillatory) part of the nonlinear refractive index, we repeated the differential pump on/off measurements at several selected pump–probe delays. The resulting peak–valley amplitude difference
is shown in
Figure 6 as a function of the pump–probe delay. Clear oscillations are visible, with a period equal to about 200 fs, as obtained by a sine fit of the experimental data; this period coincides within the experimental uncertainty with that (193 fs) of the oscillations due to the CH
2Br
2 Raman mode at 173 cm
−1, thus unambiguously demonstrating that the Z-scan difference signal is produced by the RIKE effect due to the coherent Raman field established by the pump pulse.
To further illustrate this result, we also show the corresponding portion of the ISRS signal measured using the Kerr lens detection (fully reported in
Figure 2c) in
Figure 6; it can be seen that the nonlinear refractive index determined from the Z-scan difference signal accurately reproduces the refractive ISRS signal.
4. Discussion
The experimental ISRS results reported in
Figure 2b show that when the sample is in the pre-focal maximum signal position (
z−), the signal on the photodiode has a sharp drop for pump–probe coincidence, followed by an increase for positive delays. This corresponds to an initial defocusing and a subsequent focusing behavior of the nonlinear Kerr lens. Recalling that, for a pre-focal Kerr lens defocusing behavior, the associated nonlinear refractive index is positive [
20], we deduced from
Figure 2b that the Kerr nonlinearity created by the pump pulse has a positive instantaneous value (due to the cross-phase modulation originated by the non-resonant electronic nonlinearity) followed by an opposite behavior. The same conclusions can obviously be drawn from the analysis of the post-focal (
z+) signal. The behavior at positive delays is due to the superposition of the intermolecular modes, such as diffusive re-orientational motions and libration, and of intramolecular modes due to the impulsively excited Raman vibrations [
15].
As far as the single-beam Z-scan measurement shown in
Figure 5 is concerned, our result is consistent with the data reported in
Figure 2b, where the ultrafast instantaneous nonlinearity is positive. We underline that this result is the first determination of the electronic non-resonant nonlinearity in dibromomethane and is completely unaffected by thermo-optical effects, differently from the results [
21] reported using a high-repetition rate laser, where the strong thermo-optical effects produce a peak–valley Z-scan trace. Noticeably, single-beam Z-scan measurements on transparent solvents, when not affected by thermo-optical effects, unavoidably show a positive Kerr lens (i.e., valley–peak Z-scan trace), due to the strong ultrafast non-resonant electronic nonlinearity [
30]. The small negative contribution due to molecular modes can only be sorted out by differential pump on/off measurements, as shown in
Figure 6. Analogously to what was conducted to obtain the instantaneous electronic non-resonant Kerr nonlinearity using single-beam measurements, the easy calibration procedure of Z-scan measurements can be used to quantify the Raman and intermolecular contributions to the Kerr nonlinearity from the pump–probe data shown in
Figure 5 and
Figure 6.
Therefore, we demonstrated what we believe to be the first unambiguous “true” Z-scan measurements of the stimulated Raman scattering phenomenon. Our proposed technique allows, in principle, the quantitative evaluation of the contribution of the internal (Raman) and external molecular modes to the nonlinear refractive index [
31], a task which will be the subject of a future paper, as it is beyond the scope of the present work.


 ,
, 