Featured Application
This study could be applied to the spar-type floating offshore wind turbine to improve its wave-resistance ability and to reduce its wave-resultant vibration.
Abstract
Spar-type floating offshore wind turbines commonly vibrate excessively when under the coupling impact of wind and wave. The wind turbine vibration can be controlled by developing its mooring system. Thus, this study proposes a novel mooring system for the spar-type floating offshore wind turbine. The proposed mooring system has six mooring lines, which are divided into three groups, with two mooring lines in the same group being connected to the same fairlead. Subsequently, the effects of the included angle between the two mooring lines on the mooring-system’s performance are investigated. Then, these six mooring lines are connected to six independent fairleads for comparison. FAST is utilized to calculate wind turbine dynamic response. Wind turbine surge, pitch, and yaw movements are presented and analyzed in time and frequency domains to quantitatively evaluate the performances of the proposed mooring systems. Compared with the mooring system with six fairleads, the mooring system with three fairleads performed better. When the included angle was 40°, surge, pitch, and yaw movement amplitudes of the wind turbine reduced by 39.51%, 6.8%, and 12.34%, respectively, when under regular waves; they reduced by 56.08%, 25.00%, and 47.5%, respectively, when under irregular waves. Thus, the mooring system with three fairleads and 40° included angle is recommended.
1. Introduction
As one of the clean and renewable energy resources, wind energy has been harvested extensively worldwide. In contrast with onshore wind turbines, offshore wind turbines are generally located in a better wind environment that has a higher wind speed and lower turbulence intensity than on land; there is also no need to worry about noise caused by offshore wind turbines because they are away from the coast. Thus, the offshore wind turbine is one of the wind engineering research hotspots. However, compared with onshore or fixed-bottom offshore wind turbines, floating offshore wind turbines generally vibrate more violently when under the coupling impact of wind and wave. Their surge movement amplitudes commonly exceed 10 m when under extreme environmental conditions, potentially resulting in the wind turbine overtopping and mooring system damage. The excessive vibrations of floating offshore wind turbines also significantly increase their cost (Kikuchi and Ishihara [1] found that offshore wind turbines generally cost two to three times more than that of onshore or fixed-bottom offshore wind turbines). Therefore, it would be valuable to find out how to effectively reduce the structural displacements of the floating offshore wind turbine (floating offshore wind turbine is simply called offshore wind turbine in the following sections).
A blade pitch control system was first found to be helpful for wind turbine vibration control. Yin et al. [2] proposed a novel electrical-hydraulic blade pitch control system, which consisted of a hydraulic pump, hydraulic motor, and pitch control gear. That pitch control system could help the wind turbine harvest wind energy as much as possible, and it could also reduce wind turbine vibration by tuning the blade pitch angle. Next, Zhang et al. [3] presented an adaptive super-twisting generator controller based on an integral blade pitch control strategy for floating offshore wind turbines; their numerical results showed that their developed pitch angle controller could be applied to tune wind turbine rotor speed and to control floating wind turbine platform vibration. Lan et al. [4] then utilized an adaptive sliding mode pitch angle controller to tune blade pitch angle. Their control strategies were effective in reducing wind turbine vibration. Although pitch angle control can reduce significant wind load on the floating offshore wind turbine and can increase wind turbine energy output, wave load can hardly be reduced. Further, frequently tuning blade pitch angle will obviously reduce blade lifetime resulting in additional blade maintenance cost.
Next, some researchers applied a tuned mass damper (TMD) in the floating offshore wind turbine nacelle to control wind turbine vibration. Lackner et al. [5] installed a TMD in the wind turbine nacelle. The TMD’s structural parameters were optimized through parametric analysis. Their numerical results implied that a TMD could passively control wind turbine vibration, and tower top and nacelle movements could be significantly reduced by 10%. Stewart et al. [6] also applied a TMD in a wind turbine nacelle, and they developed a simulation tool called HAWC2-TMD to numerically simulate the wind interaction of the wind turbine with a TMD. They reached the same conclusion that wind turbine vibration could be controlled by applying a TMD in the nacelle. Innovatively, Liu et al. [7] used a radial basis function neural network to predict TMD performance, and utilized a genetic algorithm to globally and systematically optimize the TMD structural parameters. They also investigated the effects of upstream wind turbine wake on downstream wind turbine TMD optimization. They concluded that upstream wind turbine wake effects on downstream TMD optimization should be considered when wind turbine spacing is approximately twice that of rotor diameter. Subsequently, Liu et al. [8] applied a rotational inertia double-tuned mass damper (RIDTMD) in the wind turbine nacelle. RIDTMD was found to be more effective than TMD when they had the same physical mass. Alkmin et al. [9] and Xu et al. [10] applied tuned liquid column dampers in the wind turbine nacelle, which could reduce tower top and nacelle displacement. However, installing dampers in the wind turbine nacelle incurs additional construction costs; meanwhile, the wind turbine tower should be strengthened when applying dampers. Thus, applying dampers, to some extent, is not economic.
Subsequently, some researchers proposed to improve the hydrodynamic performance of the floating offshore wind turbine platform, in order to reduce floating wind turbine vibration under the coupling impact of wind and wave. For spar-type wind turbine, Wang et al. [11] added a heave plate on the spar-type platform. The heave plate was found to be useful in controlling platform heave movement, owing to that it could provide great added mass. Chen et al. [12] also applied a heave plate on the spar-type platform, and they optimized heave plate structural parameters through a bunch of numerical simulations. The newly proposed platform had smaller wind turbine vibration and mooring tension than those of the original OC3-Hywind spar-type wind turbine platform. Innovatively, Shin et al. [13] developed the original spar-type platform by attaching circular columns onto it but remaining its total volume and mass. Compared with the original spar-type platform, the developed platform could reduce wind turbine vibration in different directions simultaneously due to larger overtopping stiffness. Interestingly, Zheng and Lei [14] combined spar-type platform and fish cage. They used FAST [15] to calculate wind turbine dynamic responses. Their numerical results indicated that fish cage could limit wind turbine vibration and the proposed platform performed better than the original one. Although the developed platforms [11,12,13,14] could improve platform hydrodynamics, their construction and maintenance costs increased simultaneously.
Thus, this study tries to reduce spar-type floating offshore wind turbine vibration by developing an original mooring system which has negligible effects on the wind turbine’s construction and maintenance costs. When quantitatively evaluating the performance of the developed mooring systems, experiments in a real wave basin and numerical simulations in a virtual wave basin can be carried out. The experiment can only test some typical cases because the mooring system configuration can hardly be randomly changed during the experiment. Meanwhile, a real wave maker can only generate a few typical waves. Hence, the experiment is not suitable for the mooring system optimization that is needed to evaluate the various cases in this study. To this end, numerical simulation was adopted; specifically, FAST [15] was utilized to simulate the wind and wave interactions of floating offshore wind turbines.
In summary, in this study, the original spar-type floating offshore wind turbine mooring system with three mooring lines and three fairleads was developed; specifically, six mooring lines were utilized to moor the wind turbine, which were divided into three groups, and two mooring lines from the same group were connected to the same fairlead (resulting in a total of three fairleads). The effects of the included angle between the two mooring lines in each group on the mooring system’s performance were examined. Further, these six mooring lines were connected to six independent fairleads for comparison with the mooring system with six mooring lines and three fairleads. FAST [15] was utilized to calculate the wind turbine’s dynamic response with these developed mooring systems. Wind turbine surge, pitch, and yaw movements are presented and analyzed in time- and frequency-domain to quantitatively evaluate the mooring system performance.
2. Numerical Methods
FAST [15] was adopted to simulate the wind turbine dynamic response. Specifically, in FAST, the blade element momentum method (BEM) is used to calculate external wind load on the wind turbine blade. Potential flow theory is used to calculate the external wave load on the wind turbine tower and spar-type platform. A numerical wave maker can generate regular and irregular waves. The floating wind turbine is moored onto the seabed by a mooring system, which is modeled as catenary and is solved using a quasi-static method. The wind turbine is assumed to be rigid in this study because its structural deformation is much smaller than its rigid displacement. A wind turbine movement equation when under the coupling impact of wind, wave and mooring system is also introduced. Details about the numerical methods can be found in the following sections.
2.1. Blade Element Momentum Method
BEM [16] divides the wind turbine blade into a limited number of blade elements along its axial direction. When neglecting three-dimensional wind effects, the wind loads exerted on the blade elements can be calculated according to their two-dimensional airfoil characteristics. Then, the total wind loads on the blade can be calculated by integrating the loads of each blade element along the blade axial direction. Assuming that wind turbine rotor is divided into N segments whose widths are labeled as dr (Figure 1a), blade element lift force (dL), drag force (dD), thrust force (dT), and torque (dM) (Figure 1b) can be respectively calculated as
in which, is air density; Vrel means local relative wind velocity at specified blade element; c denotes blade element chord length; Cl and Cd are lift and drag coefficients, respectively; B represents the number of blades, which is 3 in this study; V1 means incoming wind velocity; indicates inflow wind angle or called attack angle; and Cn and Ct are normal and thrust coefficients, respectively, which can be computed as
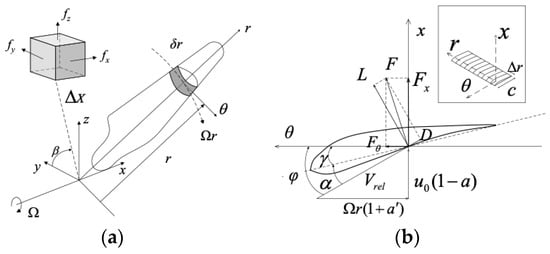
Figure 1.
(a) Schematic of blade element momentum method and (b) blade element forces.
In Equations (3) and (4), a and are axial and tangential induce factors, respectively, which can be calculated as
2.2. Potential Flow Theory
Jonkman et al. [17,18,19] reviewed two mathematical theories for calculating floating body hydrodynamic forces (i.e., Morison’s equation and potential flow theory). Potential flow theory can counter the effects of wave radiation and diffraction, thus can more accurately predict floating body hydrodynamic forces compared with Morison’s equation. Thus, this study adopts potential flow theory to calculate wind turbine hydrodynamic forces. Specifically, a potential function is utilized, whose governing equation can be expressed as
where , , and with u, v, and w as water particle velocities in x, y, and z directions, respectively. After determining free water surface, structural surface, and seabed boundary, the entire water particle velocity distribution in the numerical wave basin can be computed by solving the potential function. Subsequently, the floating body hydrodynamic force () can be calculated as
in which, denotes wave load; means static water pressure; represents the hydrodynamic force resulted from wave radiation; and is the hydrodynamic force caused by added water mass. These four parts of total hydrodynamic force can be respectively computed as
In Equation (11), means the fast Fourier transform result of white noise time series; denotes wave spectrum (JONSWAP spectrum is utilized in this study); is the wave force matrix normalized by unit wave amplitude; ω means wave frequency; and indicates inflow wave direction. In Equation (12), represents floating body buoyancy with as under-water floating body volume; means hydrostatic recovery matrix; and x is floating body rigid displacement. In Equation (13), K1 denotes radiation kernel in potential flow theory; and means floating body rigid displacement velocity. In Equation (14), denotes added mass force caused by wave radiation; and means floating body rigid displacement acceleration.
2.3. Wave Making Theory
2.3.1. Regular Wave
In this study, two-dimensional linear regular waves (Airy wave theory [20]) are generated as incoming waves for the floating wind turbine. Wave surface function in Airy wave theory can be expressed as
where A is wave amplitude; means wave phase; k denotes wave number (k = 2/L with L as wave length). According to the potential flow theory introduced before, the velocity and acceleration of water particles can be calculated using:
in which, and are water particle velocities in x and z directions, respectively; and are water particle accelerations in x and z directions, respectively; d denotes water depth; and indicates the reduction factor of water velocity and acceleration from wave surface to seabed. According to z, d, and k, local water particle velocity and acceleration at specified z can be calculated.
2.3.2. Irregular Wave
Real sea waves are complicated with irregular free surface; hence, only using regular wave to evaluate the developed mooring system performance is not enough and is inconsistent with reality. Irregular waves are generated in this section. Irregular waves can be regarded as a superposition of infinite linear regular waves with different wave amplitudes, frequencies, and initial phases [21]. Wave surface function for an irregular wave can be expressed as
in which , , and are regular wave amplitude, frequency, and initial phase of the nth regular wave.
Assuming that the irregular wave consists of an infinite number of regular waves, the regular wave frequencies are distributed within 0 and . Next, wave energy of all the regular waves within and can be computed as
using to substitute E in Equation (21), Equation (21) then becomes:
P–M and JONSWAP spectra are popular in ocean engineering. This study adopts JONSWAP spectrum to model irregular waves. At this moment, the wave surface function can be expressed as
where is the fast Fourier transform function for Gaussian white noise time series; and are two independent random numbers, which follow normal distribution.
2.4. Mooring System
This study utilizes a quasi-static method to calculate deformation and tension of mooring lines [22]. This method counters distributed mass, stress, and elastic of mooring lines; however, it neglects inertia, viscosity, inner damping, bending, and twisting of mooring lines. When mooring lines partly lie on the seabed, governing equations for mooring lines can be expressed as
in which and are horizontal and vertical distances from fairlead to anchor (Figure 2); and are horizontal and vertical mooring tension components at fairlead; means mooring line relaxation length; represents wet weight per unit length of mooring lines; indicates mooring line unstretched length; EA is mooring line axial stiffness; and means static friction coefficient between mooring lines and seabed. By solving Equations (24) and (25), mooring tensions at fairlead can be calculated.
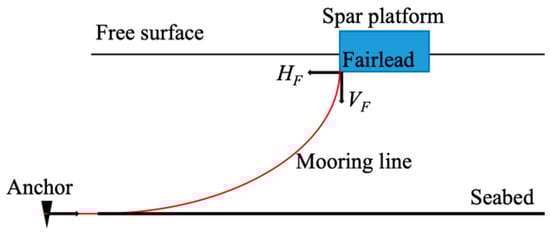
Figure 2.
Schematic of mooring system with one mooring line.
Then, deformation and tension of the entire mooring line can be calculated further. For any point on the mooring line, its horizontal and vertical distances to anchor are labeled as x and z, respectively; meanwhile, mooring tension at a specified point is labeled as Te. They can be computed, respectively, using:
where s means distance from target point to anchor.
2.5. Movement Equation for Floating Wind Turbine
As mentioned before, the floating wind turbine is regarded as a rigid body because its structural elastic deformation is much smaller than its rigid displacement. Then, its movement equation [23] can be expressed as
in which, M and A are mass and added mass matrices of the floating wind turbine; and K mean damping and stiffness matrices, respectively; indicates wind load calculated using BEM as introduced in Section 2.1; represents mooring tension as introduced in Section 2.4.
The entire calculation flow chart for the floating wind turbine dynamic response is presented in Figure 3, including aerodynamic analysis for wind turbine blade, hydrodynamic analysis for wind turbine tower and spar-type platform, quasi-static analysis for mooring system, and overall movement calculation for entire floating wind turbine. All of the external forces (i.e., wind, wave, mooring) are summed up in each time step, and floating wind turbine dynamic response can be solved iteratively.
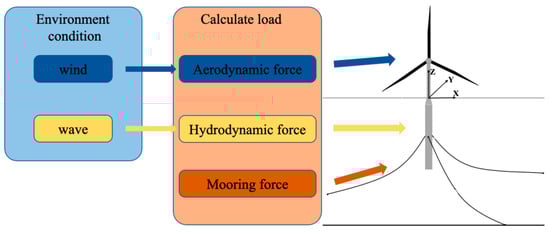
Figure 3.
Flow chart for floating wind turbine dynamic response analysis.
3. Developed Spar-Type Mooring System
This section first introduces the structural parameters of the investigated floating offshore wind turbine: OC3-Hywind spar-type 5 MW floating offshore wind turbine [24]. Subsequently, the developed mooring systems for the spar-type platform are introduced. To optimize the developed mooring systems, several different configurations are presented by varying the mooring line positions in the mooring systems. Details about the investigated floating offshore wind turbine and developed mooring systems can be found in the following sections.
3.1. OC3-Hywind Spar-Type 5 MW Wind Turbine
It is assumed that a positive x direction is consistent with the wind and wave propagation direction; positive z direction points upward; and positive y direction can then be determined using the right-hand rule, as can be seen in Figure 4. Figure 4 shows a typical OC3-Hywind spar-type 5 MW offshore wind turbine, which is moored onto the seabed using three mooring lines. The floating wind turbine can freely move in six directions (i.e., surge, sway, heave, roll, pitch, and yaw). The key structural parameters of the wind turbine are summarized in Table 1. Hub mass, nacelle mass, and tower mass are 56,780, 350,000, and 249,718 kg, respectively. Nacelle is measured to be (14.2, 2.3, and 3.5) m in (x, y, z) directions. Wind turbine draft is 120 m. Tower bottom and hub elevations from still sea level are 10 m and 90 m, respectively.
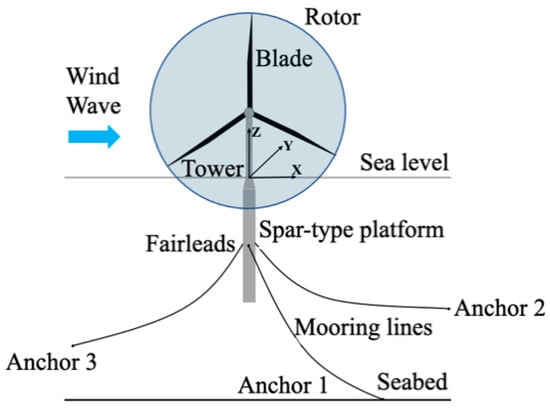
Figure 4.
Schematic of OC3-Hywind spar-type 5 MW offshore wind turbine.

Table 1.
Key structural parameters of OC3-Hywind spar-type 5 MW offshore wind turbine.
Spar-type platform mass is 7,466,330 kg. The platform is moored onto the seabed using three identical mooring lines. Mooring line length, diameter, density, and axial stiffness are 902 m, 0.09 m, 77.71 kg m−1, and 384.24 × 3106 N m−1, respectively. For mooring line 1, fairlead 1 and anchor 1 the coordinates are (5.2, −70) m and (853.87, −320) m in (x, z) directions, respectively. Fairlead draft is 70 m. For mooring lines 2 and 3, their fairlead and anchor coordinates can be computed according to those of mooring line 1 because they are spread uniformly around the spar-type platform with 120° included angle between each other. The static friction coefficient between the mooring line and seabed, CB, is 0.2 in this study.
3.2. Mooring Systems
Figure 5 shows the developed mooring systems. Compared with the original mooring system using three mooring lines (see Figure 4), the developed mooring systems (Figure 5) utilize six mooring lines to connect the floating wind turbine onto the seabed. First, six mooring lines are connected by six anchors and three fairleads, and these six mooring lines are divided into three groups with two mooring lines in the same group being connected to the same fairlead (e.g., in Figure 6a, mooring lines 1 and 2 are connected to fairlead 1). The included angle between two mooring lines in the same group is labeled as . Two mooring lines in the same group have the same included angle to the original mooring line in the original mooring system, which is /2 as can be seen in Figure 6a, implying that two mooring lines in a same group are symmetrical about the original mooring line in the original mooring system. The mooring line length remains the same as that in the original mooring system, which is 902.2 m. Figure 6a presents a top view of the developed mooring system, from which the mooring line configuration in the developed mooring system and included angle can be directly observed. In the following discussions, is varied to 20°, 30°, and 40° to examine the included angle effects on the mooring system’s performance. These three cases are respectively labeled as T1, T2, and T3. Floating wind turbine dynamic responses under these three cases are calculated and compared with those using the original mooring system (labeled as T0).
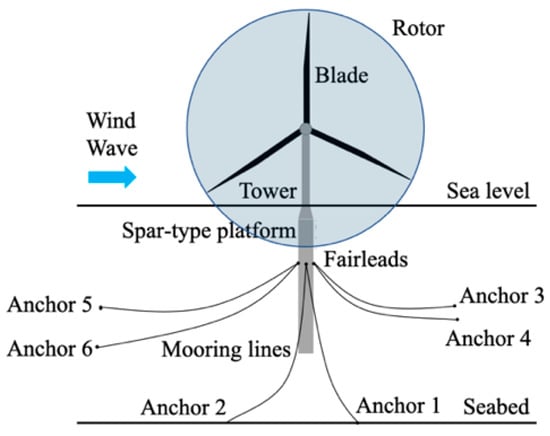
Figure 5.
Developed mooring system that uses six mooring lines to connect floating wind turbine.
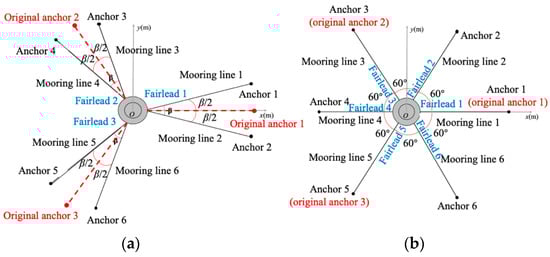
Figure 6.
Developed mooring systems with (a) three fairleads and (b) six fairleads.
Subsequently, another developed mooring system with six mooring lines and six different fairleads is proposed, as presented in Figure 6b. Mooring lines and fairleads are correspondingly connected. They are spread uniformly around the spar-type platform with the included angle between any two neighboring mooring lines being 60°. The developed mooring system shown in Figure 6b is labeled as T4.
The floating wind turbine dynamic responses of T1–3 were first calculated and compared to optimize the included angle for the three-fairlead mooring system. The optimal case in T1–3 was then compared with T4 to obtain the final optimal configuration for the developed mooring system with six mooring lines.
4. Numerical Results
In this section, the floating wind turbine dynamic responses with five different mooring systems (T0–4) under six different environmental conditions were calculated using FAST. The environmental condition settings are summarized in Table 2. C1–3 are regular waves. Their wave height and period ranges are (2.56–6.00) m and (7.00–10.00) s, respectively. C4–6 are irregular waves. Their significant wave height and period ranges are (3.66–6.70) m and (8.6–13.6) s, respectively. Incoming mean wind velocity in these cases remains the same value of 8 m s−1. These cases are determined according to the real wind and wave distributions at Nanao Island, China [25]. In the following sections, the floating wind turbine dynamic responses of C1–3 and C4–6 are compared, respectively.
Table 2.
Environmental condition settings.
4.1. Regular Wave
In C1–3, FAST was utilized to calculate floating wind turbine dynamic responses with T0–4. Total calculation time was 900 s with former 600 s transient results being removed. As a result, 600–900 s floating wind turbine dynamic responses were analyzed. Since both wind and wave are unidirectional, wind turbine sway, heave, and roll movements are smaller than those in surge, pitch, and yaw directions. Thus, wind turbine surge, pitch, and yaw movements are presented and discussed.
Figure 7 presents wind turbine surge movements from 600–900 s in C1–3. It can be obviously seen that wind turbine surge movement with the original mooring system T0 was larger than the developed mooring systems T1–4. Wind turbine surge movement with the original mooring system oscillated near 12 m, while those using the developed mooring systems oscillated near 8 m. For the developed mooring systems T1–3 in C1–3, it can be observed that wind turbine surge movements of T2 and T3 almost coincided with each other. However, the wind turbine surge movement of T1 was larger than those of T2 and T3; quantitatively, surge movement mean value of T1 was approximately 0.5 m larger than those in T2 and T3. This implies that the developed mooring systems can effectively control floating wind turbine surge movement when under regular waves. Mean surge displacement was reduced by approximately 33.33%. Meanwhile, with the increase of the included angle , the developed mooring system with three fairleads performed better and better. Mean surge displacement reduced 0.4 m every time when increased 10°. From the numerical results in Figure 7, it can be said that the included angle of 40° (T3) for the developed mooring system with three fairleads performed better than 20° and 30°, which should be recommended.
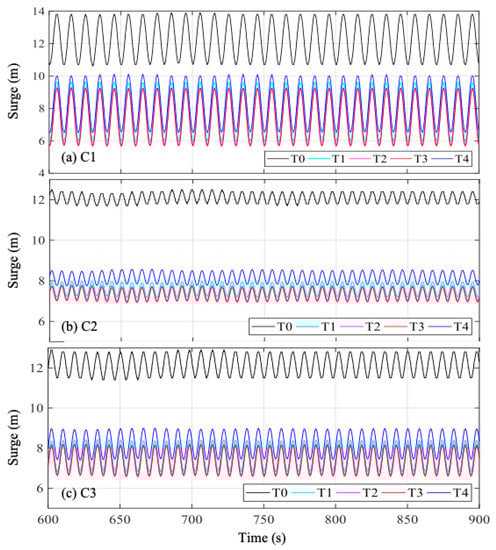
Figure 7.
Wind turbine surge movement time series in (a) C1, (b) C2, and (c) C3.
For T3 and T4 in C1–3, it can be seen that floating wind turbine surge movement with T4 was larger than that with T3, and it was even larger than that with T1. By contrast with the surge movement with T0, the surge movement with T4 was smaller (see Figure 7). This tells us that the developed mooring system with six fairleads could also reduce floating wind turbine dynamic responses, while it performed worse than that with three fairleads. Mean surge movement with T4 was 0.7 m larger than that with T3. Thus, after comparing with the developed mooring system with six fairleads, it can be safely said that T3 was the final optimal configuration for the developed mooring system in this study.
Figure 8 shows wind turbine pitch movements with T0–4 under C1–3. It can be seen that pitch movement of T0 was obviously larger than those of T1–4, especially in Figure 8b, implying that the developed mooring systems could effectively reduce wind turbine pitch movements by approximately 7% when under regular waves. In C1–3, the wind turbine pitch movement times series with T1–3 almost coincided with each other, indicating that the included angle between two mooring lines in the same group had a negligible effect on pitch movement control. The pitch movement of T4 was slightly larger than that of T3 with a difference of 0.03°. Hence, it can be said that when under regular waves, the wind turbine pitch movement could be reduced by both of the developed mooring systems with three and six fairleads, and the included angle has negligible effects on wind turbine pitch movement.
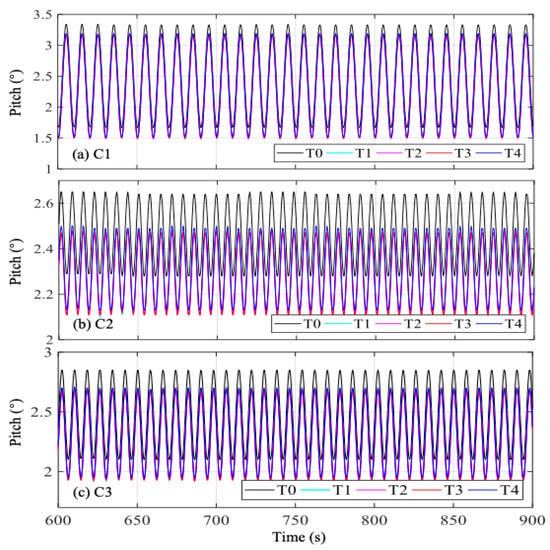
Figure 8.
Wind turbine pitch movement time series in (a) C1, (b) C2, and (c) C3.
Figure 9 presents wind turbine yaw movements with T0–4 under C1–3. It can be observed that yaw movement of T0 had the maximum peak and minimum valley compared with those of T1–4; that is, yaw movement of T0 had the maximum amplitude compared with those of T1–4. The maximum difference between the amplitudes was approximately 10%. Interestingly, the yaw movement of T1–4 all almost coincided with each other, implying that the developed mooring systems had negligible effects on the yaw movement control. Increasing both the included angle and the number of fairleads could hardly improve the mooring system performance on yaw movement control.
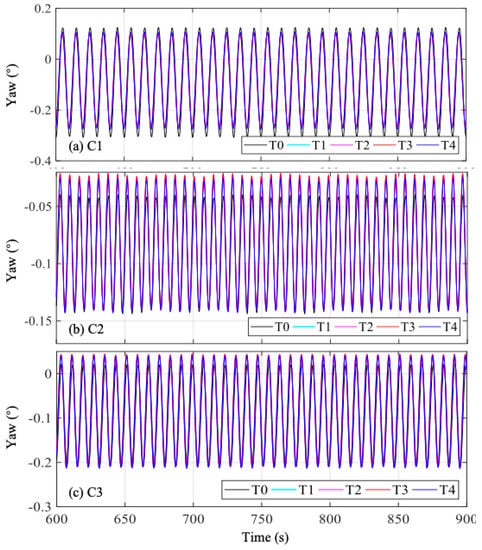
Figure 9.
Wind turbine yaw movement time series in (a) C1, (b) C2, and (c) C3.
To quantitatively examine the developed mooring system performances, the maximum, minimum, and average values of the movement time series were calculated and analyzed. Figure 10 presents the wind turbine surge movement maximum, minimum, and average values with T0–4 under C1–3. It can be directly seen that the surge movement maximum, minimum, and average values of T0 were the greatest compared with those of T1–4. As the included angle increased, the surge movement’s statistical values (maximum, minimum, and average) decreased gradually. T4 performed better than T0, while it performed worse than T1–3. In C1, the surge movement maximum, minimum, and average values of T0 were 13.9 m, 10.7 m, and 12.3 m, respectively. They were 9.23 m, 5.66 m, and 7.44 m, respectively, for T3, and 10.1 m, 6.51 m, and 8.29 m, respectively, for T4. That is, the developed mooring system with three fairleads and 40° included angle (T3) could effectively reduce wind turbine surge movement by 39.51%, and the developed mooring system with six fairleads (T4) could reduce wind turbine surge movement by 32.6%. Compared with the six-fairlead mooring system, three fairleads with a 40° included angle could further reduce the wind turbine surge movement by 6.91%.
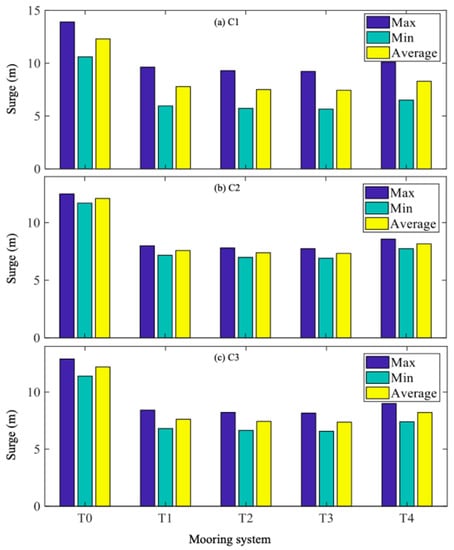
Figure 10.
Surge movement maximum, minimum, and average values in (a) C1, (b) C2, and (c) C3.
Figure 11 shows the wind turbine pitch movement maximum, minimum, and average values for T0–4 under C1–3. It can be seen that these statistic values of T0 were approximately 0.2° larger than those of T1–4, while they were almost at the same level for T1–4. In C1, the pitch movement maximum, minimum, and average values were respectively 3.34°, 1.67°, and 2.5°. They were 3.17°, 1.49°, and 2.33°, respectively, for T3. Meanwhile, they were 3.19°, 1.51°, and 2.35°, respectively, for T4. This quantitatively indicates that the developed mooring systems could only reduce wind turbine pitch movement by 6.8% when under regular waves. Although increasing the included angle could improve its performance, the pitch movement difference resulting from the included angle change was only 0.02° per 10°, which can be ignored because it is significantly smaller than the pitch movement average values.
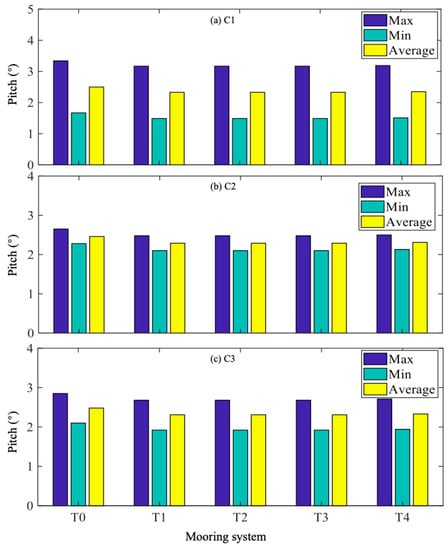
Figure 11.
Pitch movement maximum, minimum, and average values in (a) C1, (b) C2, and (c) C3.
Figure 12 presents wind turbine yaw movement maximum, minimum, and average values for T0–4 under C1–3. The yaw movement maximum value of T0 was slightly larger than those of T1–4, while the yaw movement maximum values of T1–4 were almost the same. In C1, the yaw movement maximum value of T0 was 0.308°, and it was 0.27° for T3. This indicates that the optimal configuration for the developed mooring system (T3) could reduce wind turbine yaw movement by approximately 12.34%. Generally, the developed mooring system with three fairleads and 40° included angle performed better than that with six fairleads.
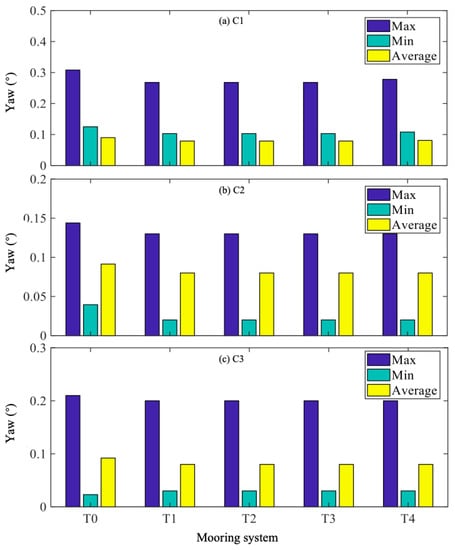
Figure 12.
Yaw movement maximum, minimum, and average values in (a) C1, (b) C2, and (c) C3.
4.2. Irregular Wave
When irregular waves impact the floating wind turbine, their movement time series becomes nonlinear and irregular. Thus, fast Fourier transform should be utilized to convert time-domain dynamic response results into frequency-domain. The frequency−amplitude curves and first peak values on the curves are presented and analyzed.
Figure 13, Figure 14 and Figure 15 present frequency−amplitude curves and first peak values on the frequency−amplitude curves of wind turbine surge, pitch, and yaw movement under C4–6. From the frequency−amplitude curves for surge movement, it can be observed that surge amplitudes for T0 were obviously larger than those with T1–4 within 0–0.02 Hz; the curves for T1–3 exhibited a small difference (approximately 0.05 m difference) from each other; and the curve for T4 was larger than that of T1. These indicate that the developed mooring system could effectively control the wind turbine surge movement when under irregular waves, and the maximum surge movement reduction occurred when using T3, with a reduction of 0.7 m. Compared with the six-fairlead mooring system, the mooring system with three fairleads and 40° included angle between two mooring lines in the same group performed better, which was similar to the observations in the regular wave results. As the included angle increased, the developed mooring system performed better and better. The first peak value for T3 reduced by 0.05 m compared with that for T1. In C4, the first peak values for T0, T3, and T4 were 1.43 m, 0.63 m, and 0.75 m, respectively. Hence, it can be said that the optimal mooring system configuration T3 could significantly reduce wind turbine surge movement by 56.08% when under irregular waves. The six-fairlead mooring system T4 could also reduce wind turbine surge movement by 47.55%, but it performed worse than T3 with 8.53% surge movement reduction difference between them.
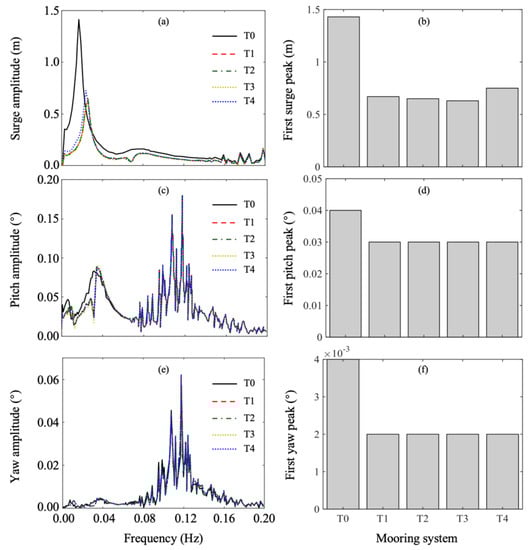
Figure 13.
Frequency−amplitude curve and first peak amplitude in C4: (a) and (b) surge; (c) and (d) pitch; (e) and (f) yaw.
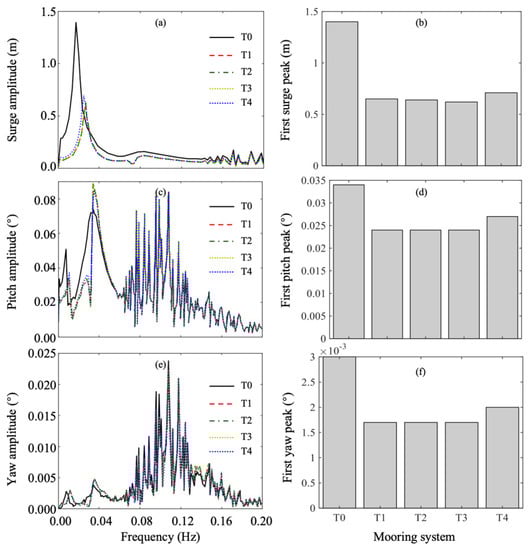
Figure 14.
Frequency−amplitude curve and first peak amplitude in C5: (a) and (b) surge; (c) and (d) pitch; (e) and (f) yaw.
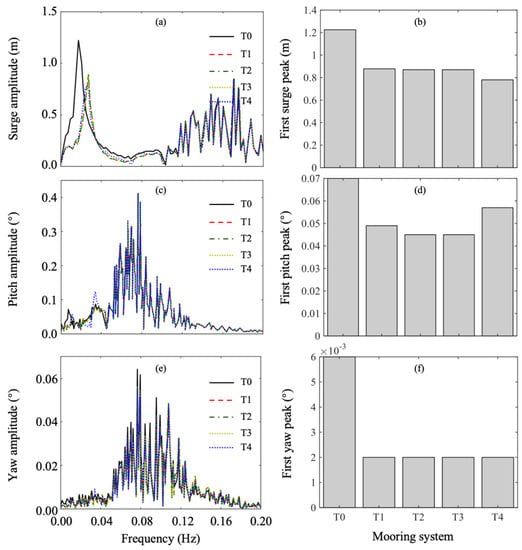
Figure 15.
Frequency−amplitude curve and first peak amplitude in C6: (a) and (b) surge; (c) and (d) pitch; (e) and (f) yaw.
From Figure 13, Figure 14 and Figure 15, the pitch movement frequency-amplitude curves for T0 exceeded those for T1–4 within 0–0.02 Hz, while the curves for T1–4 exhibited little difference between them. From the first peak values for T1–4, it can be directly observed that the first peak values for T1–3 were almost the same, while the first peak value for T4 was slightly greater than that of T3 with a difference of 0.004°. These imply that the developed mooring systems could reduce wind turbine pitch movement when under irregular waves, and the mooring system with three fairleads and a 40° included angle between the two mooring lines in the same group performs better than that with six fairleads. For the mooring system with three fairleads, the included angle between the two mooring lines in the same group had a negligible effect on its performance. In C4, the first peak values for T0, T3, and T4 were 0.04°, 0.03°, and 0.034°, respectively, quantitatively supporting the conclusion that the developed mooring system could reduce pitch movement by 25% when under irregular waves.
From Figure 13, Figure 14 and Figure 15, it can be seen that the wind turbine yaw movement amplitudes under irregular waves were smaller than those under regular waves. The frequency−amplitude curves for T0 exceeded those for T1–4 within 0–0.02 Hz. Frequency−amplitude curves for T1–4 almost coincided with each other. These indicate that the developed mooring system with six mooring lines can effectively reduce wind turbine yaw movement when under irregular waves. For the mooring system with three fairleads, its performance exhibited little sensitivity to the included angle between the two mooring lines in the same group. In C4, the first peak values for T0 and T3 were 0.004° and 0.0022°, respectively; that is, the developed mooring system with three fairleads could reduce wind turbine yaw movement by 47.5%.
Generally speaking, when under irregular waves, the developed mooring systems could effectively reduce wind turbine surge movement by 56.08%, reduce pitch movement by 25%, and yaw movement by 47.5%. Meanwhile, the mooring system’s performance exhibited little sensitivity to the included angle between the two mooring lines in the same group and the number of fairleads. The mooring system with three fairleads and 40° included angle is recommended.
4.3. Further Discussions
To examine the effects of some structural parameters (mooring line stiffness EA and static friction coefficient CB) on the obtained conclusions, the floating wind turbine dynamic responses were further analyzed with different EA (i.e., 350 × 106, 370 × 106, 384.243 × 10⁶, 400 × 106, and 420 × 106) and different CB (i.e., 0.1, 0.15, 0.2, 0.25, and 0.3) when under regular and irregular waves. Regular wave case C1 and irregular wave case C6 were adopted because the wind turbine moves most violently when under these cases. The mooring system configuration T3 was adopted because T3 performed best and is recommended in this study. The simulation results with different mooring line stiffnesses (EA) are presented in Figure 16 and Figure 17. It can be directly seen that with the change of mooring line stiffness, the wind turbine movements exhibited little difference. The surge movement changed more obviously; however, the maximum difference between them was smaller than 5%, indicating that mooring line stiffness has a negligible effect on wind turbine movements. A possible explanation for this is that mooring line stiffness is great, resulting in little elastic stretch of the mooring lines. Although mooring line stiffness changes, the elastic stretch changes slightly. Thus, mooring line stiffness has a negligible effect on the wind turbine’s movement and the conclusions obtained before are generic for different EA.
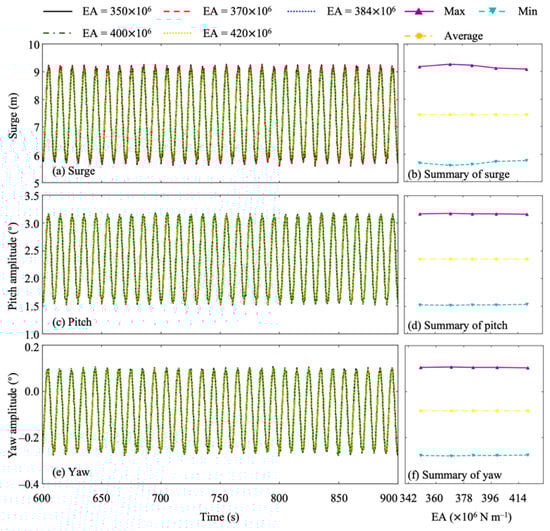
Figure 16.
Wind turbine surge, pitch, and yaw movements with different mooring line stiffnesses when under regular wave case C1: (a,b) surge movement; (c,d) pitch movement; (e,f) yaw movement.
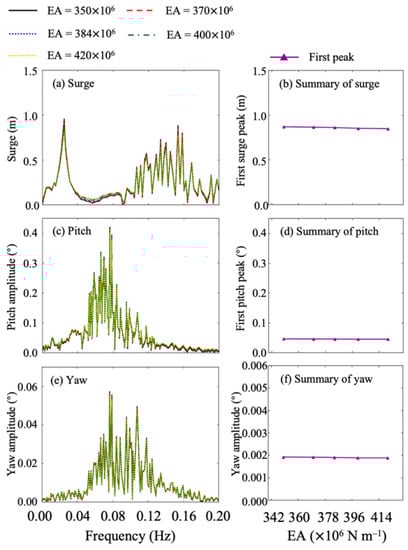
Figure 17.
Wind turbine surge, pitch, and yaw movements with different mooring line stiffnesses when under irregular wave case C6: (a,b) surge movement; (c,d) pitch movement; (e,f) yaw movement.
Figure 18 and Figure 19 show wind turbine movements with different static friction coefficients (CB) when under regular and irregular wave cases C1 and C6. From Figure 18 and Figure 19, it can be seen that as the static friction coefficient changed, the wind turbine movements exhibited little difference between them, similar to that of mooring line stiffness. In particular, the surge movement changed more obviously than the pitch and yaw movements, maybe resulting from the fact that the surge movement amplitude is larger than that of pitch and yaw. A possible explanation is that a spar-type floating wind turbine uses a gravity-based mooring system, which is moored mainly by mooring line gravity but not seabed friction force. Hence, seabed friction force contributes only a small portion of the total mooring system force. Further, the static friction coefficient has negligible effects on the wind turbine movements and the conclusions obtained before are generic for the different static friction coefficients.
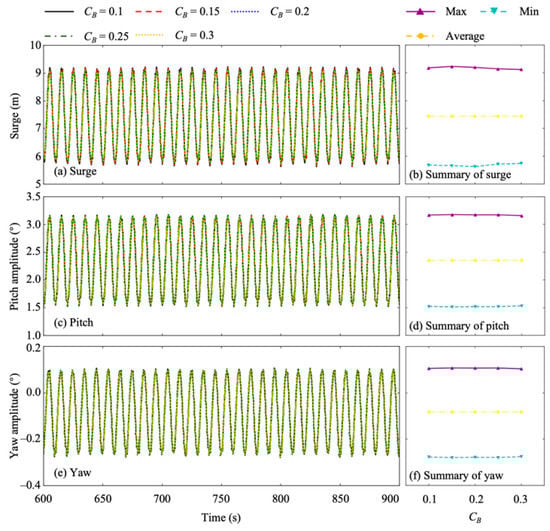
Figure 18.
Wind turbine surge, pitch, and yaw movements with different static friction coefficients when under regular wave case C1: (a,b) surge movement; (c,d) pitch movement; (e,f) yaw movement.
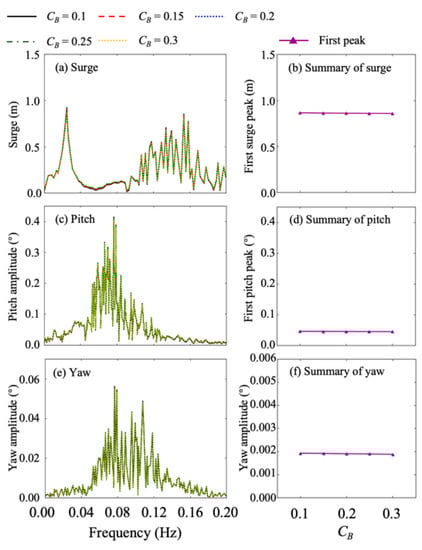
Figure 19.
Wind turbine surge, pitch, and yaw movements with different static friction coefficients when under irregular wave case C6: (a,b) surge movement; (c,d) pitch movement; (e,f) yaw movement.
5. Conclusions
This study proposes a novel mooring system with six mooring lines for a spar-type floating offshore wind turbine. Three and six fairleads were utilized in the developed mooring system. When there were three fairleads, the effects of the included angle between the two mooring lines in the same group on mooring system performance were examined by varying the included angle to 20°, 30°, and 40°. When there were six fairleads, the mooring lines were uniformly connected around the spar-type platform. FAST was employed to simulate the wind and wave interaction of the floating wind turbine. Wind turbine surge, pitch, and yaw movements were analyzed in time and frequency domains to quantitatively examine the developed mooring system performance. The following conclusions are drawn:
- The developed mooring system with six mooring lines can effectively reduce wind turbine movements. The mooring system with three fairleads performs better than that with six fairleads;
- The developed mooring system with six mooring lines and three fairleads is recommended in real application. In this system, the included angle between two mooring lines in a same group should be 40°;
- When under regular waves, the recommended mooring system can effectively reduce wind turbine surge, pitch, and yaw movement by 39.51%, 6.8%, and 12.34%, respectively, compared with the original mooring system;
- When under irregular waves, the recommended mooring system can effectively reduce wind turbine surge, pitch, and yaw movement by 56.08%, 25%, and 47.5%, respectively, compared with the original mooring system;
- Mooring line stiffness and the static friction coefficient between the seabed and mooring line have negligible effects on wind turbine movements. These conclusions are generic for differences in mooring line stiffness and static friction coefficients.
This study proposed a novel mooring system with six mooring lines for spar-type 5 MW floating offshore wind turbines, and its performance was examined. However, its performance on other spar-type floating wind turbines (e.g., 10 MW wind turbine) is not clear at present, and the question of whether wind turbine size affects the developed mooring system’s performance is not solved. Hence, in future work, the developed mooring system will be applied for different spar-type wind turbines to check whether the obtained results are generic. At present, the authors think that the developed mooring system can effectively reduce floating wind turbine movements, and can provide reference for engineers and researchers.
Author Contributions
Conceptualization, C.W., S.L.; methodology, C.W., S.L.; software, C.W., S.L. and Y.T., S.L.; validation, Y.T., S.L. and Y.Y.; formal analysis, Y.T., S.L.; investigation, S.L.; resources, S.L.; data curation, S.L.; writing—original draft preparation, Y.T., S.L.; writing—review and editing, Y.Y.; visualization, Y.Y.; supervision, S.L.; project administration, Y.T., S.L.; funding acquisition, S.L. All authors have read and agreed to the published version of the manuscript.
Funding
This work is supported by research grants from the National Key R&D Program of China under Grant 2019YFB1504402.
Institutional Review Board Statement
Not applicable.
Informed Consent Statement
Not applicable.
Conflicts of Interest
The authors declare no conflict of interest.
References
- Kikuchi, Y.; Ishihara, T. Assessment of initial capital cost for bottom-mounted offshore wind farms by using engineering model and its verification. J. Wind. Energy 2014, 38, 36–43. (In Japanese) [Google Scholar]
- Yin, X.; Zhang, W.; Jiang, Z.; Pan, L. Adaptive robust integral sliding mode pitch angle control of an electro-hydraulic servo pitch system for wind turbine. Mech. Syst. Signal Process. 2019, 133, 105704. [Google Scholar] [CrossRef]
- Zhang, C.; Gutierrez, S.; Plestan, F.; de León-Morales, J. Adaptive super-twisting control of floating wind turbines with collective blade pitch control. IFAC PapersOnLine 2019, 52, 117–122. [Google Scholar] [CrossRef]
- Lan, J.; Patton, R.J.; Zhu, X. Fault-tolerant wind turbine pitch control using adaptive sliding mode estimation. Renew. Energ. 2016, 116, 219–231. [Google Scholar] [CrossRef]
- Lackner, M.A.; Rotea, M.A. Passive structural control of offshore wind turbines. Wind. Energy 2011, 14, 373–388. [Google Scholar] [CrossRef]
- Stewart, G.; Lackner, M.A. The effect of actuator dynamics on active structural control of offshore wind turbines. Eng. Struct. 2011, 33, 1807–1816. [Google Scholar] [CrossRef]
- Liu, Z.; Wang, Y.; Hua, X.; Zhu, H.; Zhu, Z. Optimization of wind turbine TMD under real wind distribution countering wake effects using GPU acceleration and machine learning technologies. J. Wind. Eng. Ind. Aerodyn. 2021, 208, 104436. [Google Scholar] [CrossRef]
- Liu, Z.; Wang, Y.; Nyangi, P.; Zhu, Z.; Hua, X. Proposal of a novel GPU-accelerated lifetime optimization method for onshore wind turbine dampers under real wind distribution. Renew. Energ. 2021, 168, 516–543. [Google Scholar] [CrossRef]
- Alkmin, M.; Morais, M.; Fabro, A.T. Vibration reduction of wind turbines using tuned liquid column damper using stochastic analysis. J. Phys. Conf. Ser. 2016, 744, 012178. [Google Scholar] [CrossRef]
- Xu, Y.; Kwok, K.; Samali, B. The effect of tuned mass dampers and liquid dampers on cross-wind response of tall and slender structures. J. Wind. Eng. Ind. Aerodyn. 1992, 40, 33–54. [Google Scholar] [CrossRef]
- Wang, Y.; Xu, X.; Liu, G. Analysis of effect of heave plate on vertical motion performance of truss spar platform. China Pet. Mach. 2017, 45, 46–50. [Google Scholar]
- Chen, D.; Gao, P.; Huang, S.; Fan, K.; Zhuang, N.; Liao, Y. Dynamic response and mooring optimization of Spar-type substructure under combined action of wind, wave, and current. Renew. Sustain. Energy 2017, 9, 063307. [Google Scholar] [CrossRef]
- Shin, H.; Lee, W.; Jung, K.; Kim, J. Model test and simulation of modified Spar type floating offshore wind turbine with three catenary mooring lines. Renew. Sustain. Energy 2014, 6, 042009. [Google Scholar] [CrossRef]
- Zheng, X.; Lei, Y. Stochastic response analysis for a floating offshore wind turbine integrated with a steel fish farming cage. Appl. Sci. 2018, 8, 1229. [Google Scholar] [CrossRef] [Green Version]
- FAST. Available online: https://www.nrel.gov/wind/nwtc/fast.html (accessed on 7 August 2021).
- Jonkman, J.; Hayman, G.; Jonkman, B.; Damiani, R.R.; Murray, R.E. AeroDyn v15 User’s Guide and Theory Manual; National Renewable Energy Laboratory (NREL): Golden, CO, USA, 2016.
- Jonkman, J.; Robertson, A.; Hayman, G. HydroDyn User’s Guide and Theory Manual; National Renewable Energy Laboratory (NREL): Golden, CO, USA, 2015.
- Jonkman, J. Dynamics Modeling and Loads Analysis of an Offshore Floating Wind Turbine; National Renewable Energy Laboratory (NREL): Golden, CO, USA, 2007.
- Jonkman, J. Definition of the Floating System for Phase IV of OC3; National Renewable Energy Laboratory (NREL): Golden, CO, USA, 2010.
- Roux, J.P.L. An extension of the Airy theory for linear waves into shallow water. Coast. Eng. 2008, 55, 295–301. [Google Scholar] [CrossRef]
- Wu, Q.; Yang, J.; Guo, X.; Liu, L. Influence of irregular waves on the dynamic response of a vertical transport system for deep sea mining. Ocean Eng. 2021, 229, 108443. [Google Scholar] [CrossRef]
- Liu, Z.; Wang, Y. Numerical studies of submerged moored box-type floating breakwaters with different shapes of cross-sections using SPH. Coast. Eng. 2020, 158, 103678. [Google Scholar] [CrossRef]
- Han, W.; Hu, Z.; Xiang, Y. Dynamic performance investigation of a Spar-type floating wind turbine under different sea conditions. China Ocean. Eng. 2018, 32, 256–265. [Google Scholar]
- Jonkman, J.; Musial, W. Offshore Code Comparison Collaboration (OC3) for IEA Task 23 Offshore Wind Technology and Deployment; National Renewable Energy Laboratory (NREL): Golden, CO, USA, 2010.
- GoldWind. Available online: https://www.goldwind.com/cn/ (accessed on 7 August 2021).
Publisher’s Note: MDPI stays neutral with regard to jurisdictional claims in published maps and institutional affiliations. |
© 2021 by the authors. Licensee MDPI, Basel, Switzerland. This article is an open access article distributed under the terms and conditions of the Creative Commons Attribution (CC BY) license (https://creativecommons.org/licenses/by/4.0/).