Abstract
Text-to-speech (TTS) systems provide fundamental reading support for people with aphasia and reading difficulties. However, artificial voices are more difficult to process than natural voices. The current study is an extended analysis of the results of a clinical experiment investigating which, among three artificial voices and a digitised human voice, is more suitable for people with aphasia and reading impairments. Such results show that the voice synthesised with Ogmios TTS, a concatenative speech synthesis system, caused significantly slower reaction times than the other three voices used in the experiment. The present study explores whether and what voice quality metrics are linked to delayed reaction times. For this purpose, the voices were analysed using an automatic assessment of intelligibility, naturalness, and jitter and shimmer voice quality parameters. This analysis revealed that Ogmios TTS, in general, performed worse than the other voices in all parameters. These observations could explain the significantly delayed reaction times in people with aphasia and reading impairments when listening to Ogmios TTS and could open up consideration about which TTS to choose for compensative devices for these patients based on the voice analysis of these parameters.
Keywords:
aphasia; intelligibility; jitter; naturalness; reading impairments; shimmer; text-to-speech systems 1. Introduction
Patients with aphasia (PWA) and acquired reading impairments present difficulties reading and understanding written content in their everyday lives. A review of the literature on research exploring ways to allow or facilitate comprehension of the written text in PWA and acquired reading impairments showed that this population experiences some improvements in comprehension when resorting to combined modality [1,2,3], meaning the combination of two different input modalities (e.g., auditory and written text) to access texts’ content. However, there are cases where patients are not able to process any written text. In these cases, resorting to combined modality does not represent a viable solution, and PWA could only resort to auditory input. From a literature review focused on what devices are available for PWA and acquired reading impairments, the results showed no research on devices built and designed for this specific population [4]. What came out from the review was that this specific population often resorts to compensatory devices for other populations (e.g., ClaroRead for people with developmental dyslexia, https://www.clarosoftware.com/portfolio/claroread/, retrieved on 29 November 2021) or accessibility features in mainstream devices such as smartphones or tablets that, however, often cause difficulties of different kinds in PWA [4]. In fact, PWA might struggle to comprehend artificial voices [5,6]. Both types of support use computer-generated voices for their output voices. In this regard, we carried out a clinical experiment to identify which artificial voice is best suited for PWA and acquired reading impairments. Since the quality of the artificial voices exponentially improved over the years, we also collected the reaction times during the clinical experiment. Reaction time is a parameter of cognitive load and may reflect difficulties and, thus, effort in processing information [7,8].
Hux et al. [6] performed a similar experiment investigating the impact on the auditory comprehension of two different computer-generated voices (David from the Windows platform and Alex from the Macintosh platform) and one digitised human voice. The study compared the comprehension accuracy between the three conditions, showing that the digitised human voice’s comprehension accuracy was significantly better than synthetic speech; however, the nature of the artificial voices was not clearly stated. Unlike Hux et al. [6], the clinical experiment used in the current study collected the reaction times for each item and compared three different voices built with different technologies to investigate whether one voice is more suitable for PWA than the other voices. Another study investigating TTS systems in relation to PWA with acquired reading impairments is the one carried out by Hux et al. [9], analysing participants’ views of desired features, advantages, and downsides of TTS technology following one-on-one teaching and guided practice sessions. The results of the study highlighted that participants found (i) the possibility to select the preferred output voice, (ii) being able to tune the output speech rate, and (iii) text highlight matching the voice output to be crucial features of a TTS system. Other characteristics reported by some participants were the possibility to pause the TTS and to repeat.
While these features could also be interesting for the healthy population, in the case of PWA and acquired reading impairments, being able to personalise the characteristics could be crucial for the use of the tool [9].
This experiment is part of a wider project aiming to identify which features improve or facilitate auditory comprehension in people who acquire aphasia and present acquired reading impairments. The current study has the following research questions: (i) Are the significant results in reaction times caused by one or more acoustic voice characteristics? (ii) If so, which one?
The structure of the current paper unfolds as follows: Section 2 briefly describes the material and methods in which the clinical experiment and the text-to-speech systems’ speech analysis were carried out; Section 3 reports the main results obtained in the clinical experiment and, more extensively, the results of the speech synthesis assessment; and lastly, Section 4 discusses the results.
2. Materials and Methods
2.1. Experimental Design
2.1.1. Participants
The participants were seven native Spanish speakers or bilingual Spanish and Catalan: three females and four males, ranging between 45 and 70 years old. The participants were recruited in a hospital in Barcelona, where they were assessed and diagnosed by the neuropsychologist. The patients acquired aphasia and reading impairments secondary to a vascular event. The patients volunteered to participate in the experiment. The inclusion criteria were the following: (a) chronic aphasia caused by a vascular event, (b) patients reporting either difficulties or the inability to read in their everyday life, (c) aphasia severity ranging from moderate to mild, (d) being a native Spanish speaker, (e) no premorbid dyslexia, (f) no hearing impairment, and (g) sight corrected-to-normal, guaranteeing the perception of images on the computer screen. The participants’ education level ranged from low to university degree. Some of the participants were familiar with the concept of synthetic speech; however, none of them used a TTS system in their everyday tasks (e.g., in their phones or electronic devices). The control group was composed of 15 participants recruited from a department of the university. The only personal information requested was age, which ranged between 30 and 58 years old. The participants are numbered from P1 to P8. P2 is missing, as the participant did not meet the inclusion criteria to participate in the experiment.
2.1.2. Clinical Experiment Stimuli and Procedure
The experiment was carried out in Spanish and was divided into two parts. The first part was a picture-point auditory comprehension test composed of 48 sentences. Each sentence was associated with four images: one target image and three foils. The foil images displayed the object, the location, or the action described in the target sentence. The sentences pertained to four different grammatical categories: (a) transitive, (b) transitive plus adjunct, (c) intransitive plus adjunct, and (d) complex subject + verb “be”. Twelve sentences were assigned to every grammatical category.
Moreover, the sentences were spoken by four different voices: Festival TTS, Ogmios TTS, Bluemix TTS, and a digitised human voice (DHV). Each of the four output voices produced 12 sentences. The 48 sentences were presented in random order for each participant. At the beginning of the experiment, the participants went through a short calibration phase to check the audio volume, decide the speech rate to execute the experiment and check that they understood the researcher’s instructions. The patients were asked which speech rate they preferred when carrying out the experiment: the original rate, mean (SD) = 210.86, 32.5 words per minute; 25% slower; or 50% slower. Four participants chose to perform the experiment with the 25% slower speech rate, while the remaining three chose the 50% slower rate. None of the patients selected the standard speech rate. The speech rate of the sentences was manipulated using Audacity® recording and editing software (Version 2.4.2, https://audacityteam.org, retrieved on 29 November 2021). To slow down the speech rate without causing distortions, we used the “change tempo” option, as it does not affect pitch and frequency. After the calibration passage, the comprehension task started. The patients listened to a sentence while looking at the computer screen, where a four-image set appeared. Afterwards, the patients pointed at the computer screen to the image corresponding to the sentences they heard. A number from 1 to 4 was assigned to every image. Once the participant pointed at one of the four images on the screen, the researchers immediately pressed the number key corresponding to the picture chosen by the patient, and then the experiment automatically proceeded. The researcher pressed the number key on behalf of the participants because some could not press the keyboard keys by themselves. To keep the reaction time (RT) measurements controlled by the individual factors, we decided that the researcher would press the number keys for all participants. The answers and the reaction times in milliseconds were recorded.
The experiment was carried out with a laptop and DMDX [10], a Windows-based software used primarily for language processing experiments, and designed to precisely record the time of the presentation of text, audio, graphical, and video material and record the measurements of RTs [10]. The control group received the experiment, designed using Google Forms, via email. The images, recording, and the general setup was the same as for the other participants, with the only difference being the software used. Since Google Forms does not allow the collection of RTs, the control group was used only to compare the comprehension accuracy, which resulted in a ceiling effect.
2.2. Text-to-Speech Systems
Text-to-speech (TTS) systems are the main focus of the clinical experiment reported and the metrics analysis examined in this paper. Three different TTS systems were selected to represent the different technologies in which such systems are usually built: (a) Festival TTS, from the University of Edinburgh, as an example of statistical parametric speech synthesis [11], (b) Ogmios TTS, from the Universitat Politècnica de Catalunya, a concatenative speech synthesis [12], and (c) Bluemix (now known as Watson), an IBM Research neural TTS containing three deep neural networks to predict prosody features, acoustic features, and the output waveform (https://www.ibm.com/demos/live/tts-demo/self-service/home, retrieved on 29 November 2021). The synthetic speech voices and the recordings of the human voice were all male voices.
2.3. Synthetic Speech Assessment
First of all, for each patient, we observed their test outcomes and presented an overview of the results. Secondly, we automatically evaluated the test samples to score the two main ways of assessing synthesised speech: intelligibility and naturalness. The former defines how well the words spelt in the speech message are understood by the listener, while the latter reflects how natural it is compared to a human voice.
2.3.1. Intelligibility
In the current work, we assessed the intelligibility of a synthetic utterance by means of an automatic speech recognition system (ASR). As shown by the authors in [13], there is a correlation between the accuracy of an ASR system and the intelligibility of a speech utterance. All elements that may cause speech to be difficult to understand directly increase the error rate in an ASR system, such as mispronunciations, audio distortions, or inconsistent variations of speech loudness and rate. Therefore, we transcribed all of the synthetic audio samples with an ASR system, consequently measuring the word error rate (WER) plus the token error rate (TER) per sample. Note that since our ASR system outputs graphemes as tokens, our TER score is just the grapheme error rate. Lower error rates denote higher speech intelligibility, whereas higher error rates may reflect less intelligible speech.
WER and TER measurements are computed by comparing the transcription from the ASR system with the ground truth human transcription. Both scores are based on the Levenshtein distance [14], which is the minimum number of edits that need to be done in a text sequence to match another. For example, the WER score is computed by counting the number of word substitutions (S), deletions (D), and insertions (I) needed to convert the ASR transcription into the ground truth one. Then, these counts are summed up, dividing the result by the number of words in the ground truth transcription.
The computation of TER is done the same way, but by counting token edits instead of whole word edits. Regarding the ASR system specifics, we used a pre-trained transformer-based model from wav2letter [15]. The model was trained with the Spanish Multilingual LibriSpeech dataset [16], and its recipe can be found in wav2letter’s repository. To obtain the transcriptions, we decoded the acoustic model outputs with the Viterbi algorithm, without any additional language model (LM). Given that we wanted to assess pure acoustic intelligibility, we avoided using an LM since it might correct some pronunciation mistakes that we want to detect.
The WER and TER analyses were automatically computed. An input file with the .wav files—audio sentences—and the ground truth transcription was run through the handler programme, an executive file, and the ASR model (a previously trained deep learning model). The output file of this analysis reports (i) the hypothesis prediction text, namely, the ASR output for each audio sentence, (ii) the reference text (the ground truth), and (iii) the WER and TER for each sentence.
2.3.2. Naturalness
Naturalness is defined as the correct use of emphasis, intonation, pitch, intensity, and pauses, according to the message and intention [17]. We used non-intrusive speech quality assessment (NISQA) to predict the naturalness of the voices used in the experiment. NISQA is a model that can automatically evaluate super-wideband speech quality without the need for a clean reference signal [18]. The same model was used to predict the mean opinion score (MOS) in terms of the naturalness of the speech samples [19]. Initially, the MOS test was used to evaluate the global quality and was used for phone speech, and it required human evaluators for subjective measurements. Nowadays, the MOS test is frequently used to score naturalness, intelligibility, and the quality of TTS systems. Since the initial way to conduct the MOS test (i.e., with human evaluators) was expensive and time-consuming, the more recent MOS tests used in synthetic speech are models—such as NISQA—that predict the answers of a human evaluator, without resorting to using them. However, these models are developed and trained using human MOS ratings. Its architecture consists of a stack of CNN layers that predict spectral frame-level quality scores in an intermediate step, followed by an RNN LSTM module to predict the final MOS score, taking the output of the CNN together with the Mel-Frequency Cepstral Coefficients (MFCC). Manually annotated MOS data from Voice Conversion Challenge (VCC) 2018 and Blizzard were used to train the NISQA. The model is publicly available for research purposes.
2.3.3. Jitter and Shimmer Parameters
Jitter and shimmer are two acoustic measurements widely used as metrics for pathological voice detection and acoustic analysis in general [20]. Jitter and shimmer are measurements of the fundamental frequency disturbance, and they have been proven to be useful in describing vocal characteristics [21]. Jitter is defined as the parameter of the fundamental frequency variation of successive periods, while shimmer refers to the amplitude variation of the sound wave [22]. Once the onset time of the glottal pulse is recognised, jitter can be determined using different measures. The current study considered jitter local and jitter relative average perturbation (RAP). The former represents the average absolute difference between two consecutive periods, divided by the average period; its threshold limit to identify pathologies is 1.04%, and it is expressed as a percentage [20]:
The latter is the relative average perturbation, meaning the average absolute difference between a period and the average of it and its two neighbours, divided by the average period; its threshold value for detecting pathologies is 0.68% [23], and it is expressed as:
Shimmer refers to irregular period-to-period variation in the peak amplitude of the signal. In the current study, shimmer local was taken into consideration. Shimmer local is defined as the average absolute difference between the amplitudes of two consecutive periods, divided by the average amplitude. The limit for detecting human voice pathologies is 3.81% [22], and it is expressed as a percentage:
The parameters described here are commonly measured for long sustained vowels. However, in our case, the samples are short sentences. For this reason, the interpretation of the results was made keeping in mind this aspect. Another aspect to consider was that, according to [24], significant differences could occur in jitter and shimmer measurements between different speaking styles, especially concerning the shimmer measure. Praat software was used to extract these measurements from all of our test samples [25].
3. Results
3.1. Clinical Experiment Results
The analysis of the RTs obtained during the clinical experiment showed that Ogmios TTS caused significantly delayed RTs compared to the other three conditions, specifically: Omgios vs. Festival TTS (p < 0.001), Ogmios vs. DHV (p < 0.001), and Ogmios vs. Bluemix (p = 0.057). An overview of the RTs from each patient over each type of sentence is shown in Table 1. The maximum and minimum RTs are detailed together with the system name. The analysis of the reaction times was done using a generalised estimating equation method [26]. The reason for using this model was because the data were not normally distributed, and they represented a repeated measurement. We highlighted Ogmios synthesis sentences that had the worst RTs to emphasise that they were the majority compared with the rest of the TTS systems and the DHV. Moreover, we corroborate in Table 2 that the longest RTs for most of the patients occurred with the Ogmios synthesis samples. In general, Bluemix and DHV achieved closer to average RTs, although Festival TTS took the lead in a couple of patients. Surprisingly, Patient 6 had longer RTs for the DHV and Bluemix.

Table 1.
Patients’ reaction times overview for types of sentences: “DHV” (digitised human voice), “ogm” (Ogmios), “blue” (Bluemix) and “fest” (Festival TTS). The highest values for Ogmios are highlighted in bold to show that, in the majority of cases, this was the TTS system causing consistently longer RTs. RTs are reported in seconds.
Table 2.
Patients’ average RTs per TTS system (system-level). Bold values are the longest RTs of each PWA. RTs are reported in seconds.
3.2. System-Level Analysis
The plots in Figure 1 show the DHV and TTS systems’ performance in terms of WER, TER, and MOS. We assessed all sentences with 25% and 50% reductions in speech rate. As expected, the DHV achieved the best scores in terms of naturalness and intelligibility compared to the TTS systems. However, the WER increased when the speech velocity was reduced to 50%. This may happen because the ASR system is not robust enough for such a reduction. Bluemix obtained very similar MOS scores to the human ones, while WER and TER were higher than Festival, the TTS system that achieved the lowest MOS score. Ogmios obtained the highest WER and TER values, meaning it had lower intelligibility than the other voices, although it presented a better score compared to Festival TTS in terms of naturalness. It must be considered that, differently from the unit selection (Ogmios), the statistical parametric synthesis technology (Festival TTS) tends to be better in terms of intelligibility. However, at the same time, the naturalness of the speech easily degrades, especially in long sentences [27]. In the context of this experiment, the sentences were short enough not to allow a relevant worsening of the naturalness and were still better in terms of intelligibility compared to Ogmios. This might explain the difference in intelligibility and naturalness between Ogmios and Festival TTS.
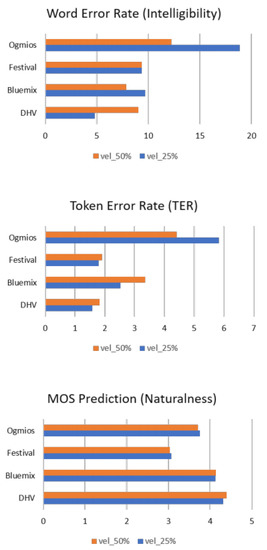
Figure 1.
System-level analysis of the WER, TER, and MOS prediction test of the three synthetic voices and the DHV at 25% and 50% slower speech rates.
3.3. Jitter and Shimmer Analysis
In Table 3, we show the resulting average jitter local, jitter RAP, and shimmer local of each synthesis system and DHV at the 25% slower rate, and Table 4 shows the averages at the 50% slower rate.
Table 3.
Average jitter, jitter RAP, and shimmer (in %) from samples at 25% reduced speed.
Table 4.
Average jitter, jitter RAP, and shimmer (in %) from samples at 50% reduced speed.
The relative values for jitter were found to be higher in the Ogmios synthesis, which denotes that the perturbation in f0 cycles caused by concatenative synthesis artefacts was higher than the other synthetic voices. In fact, the Ogmios system, once again, showed the highest values in all metrics. Considering the mentioned thresholds for the pathological voices, all systems, including DHV, surpassed the jitter and shimmer local, while the jitter RAP threshold was only surpassed by Ogmios. This could have happened as we measured over the whole signal, so pitch and intensity present more variation than measuring a single vowel, for instance. Thus, even though these results do not show that Ogmios is the only voice with value beyond the pathological threshold (except for the jitter RAP), it is the voice that presented the highest values compared to the others, which gives an orientation of TTS systems’ performance. The results, particularly for jitter and shimmer, should be regarded as indicators of speech deterioration when compared against pathological voice threshold—specifically, that Ogmios is more prone to pathological features than the other voices.
3.4. Sentence-Level Analysis
Observing the comprehension test results, 4 out of the 7 patients had difficulties understanding one of the Ogmios samples the first time they heard it, so their RTs increased substantially. Specifically, the sentence that needed a second listen was sentence 36. This phenomenon was further analysed to investigate whether it was the reason why Ogmios presented such a significant difference in RTs compared to the other voices. Figure 2 depicts the RT distribution for every item per person aggregated by the different voices to investigate if the seven items (one for each participant) corresponding to sentence 36 were outliers, indicating that this sentence exclusively caused the significant RT difference between them Ogmios and the other voices. However, after investigating the possible outliers related to sentence 36, the results do not indicate the items corresponding to this sentence (items 177, 189, 201, 213, 225, 237, and 249) are outliers (Figure 2). In fact, from Figure 2, it is possible to observe that the highest value in RT (an extreme outlier) was achieved by item 222, which was an item corresponding to sentence 21 in participant 6. In the case of item 222, the considerably higher RT could explain why, in the clinical experiment, the significance between Ogmios and Bluemix in terms of RTs is not as clear as in the case of Festival TTS and the DHV.
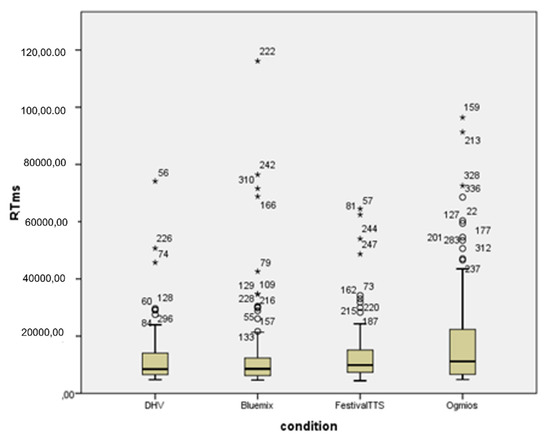
Figure 2.
Box plot illustrating the RT distribution of the single items per participant, divided by the four voices. The circles correspond to outliers and the asterisk to extreme outliers.
The correlation between the RTs and MOS, WER, and TER measurements was also investigated. However, Pearson’s correlation analysis results did not show any correlation between the parameters considered.
4. Discussion and Conclusions
This study aimed to answer the following research questions: (i) Are the significant results in reaction times in Ogmios TTS caused by one or more acoustic voice characteristics? (ii) If so, which one? After conducting a system-level automatic assessment of the intelligibility and naturalness, the sample voices were analysed using jitter and shimmer parameters. Ogmios, in general, performed worse than the other voices in these measurements; therefore, there are indeed acoustic voice characteristics that contributed to the longer RTs in Ogmios: intelligibility, jitter, and shimmer. The exception was with the naturalness measure in relation to Festival TTS. However, this result was expected due to the better naturalness usually recognised in the statistical TTS (Festival TTS). To conclude, when considering a TTS for PWA and acquired reading impairments, it should be kept in mind that there is no one-fits-all solution. From our experiment, it appeared that for the Spanish language, the concatenative speech synthesis available is not suitable for the target population considered. These results are not generalisable to all concatenative speech systems for every language, and we realise it is TTS-specific. However, our results would suggest that an initial analysis of jitter, shimmer, and WER and TER intelligibility measures could give initial information about whether a synthetic voice could be used with PWA with acquired reading impairments. Nonetheless, repeating the experiment with another TTS for another language with a larger sample size could complete the results gathered in this analysis.
For further investigations, the results obtained from the acoustic analysis and automatic investigation of intelligibility and naturalness could be paired and further investigated based on Cohn and Zellou’s [28] results. Cohn and Zellou [28] reported that in a noisy environment, neural network TTS systems (such as Bluemix in the current study) have lower intelligibility in a healthy population than concatenative systems. This is due to the fact that neural networks have more coarticulated and human-like speech than concatenative systems, which have a more hyper articulated voice. As a result, the concatenative system is more understandable than neural networks in a noisy, competing environment. A further extension of the current study could investigate which acoustic characteristics are not detrimental for PWA and acquired reading impairments in a functional, realistic situation such as a noisy environment and do not cause longer RTs.
Author Contributions
Conceptualization, G.C. (Giorgia Cistola), A.P.-L. and M.F.; methodology, G.C. (Giorgia Cistola), I.v.d.M., A.P.-L. and G.C. (Guillermo Cámbara); software, A.P.-L. and G.C. (Guillermo Cámbara); validation, M.F.; formal analysis, A.P.-L., G.C. (Guillermo Cámbara) and G.C.; investigation, G.C. (Giorgia Cistola), A.P.-L. and G.C. (Guillermo Cámbara); resources, G.C. (Giorgia Cistola), A.P.-L. and G.C. (Guillermo Cámbara); data curation, A.P.-L., G.C. (Giorgia Cistola) and G.C. (Guillermo Cámbara); writing—original draft preparation, G.C. (Giorgia Cistola), A.P.-L. and G.C. (Guillermo Cámbara); writing—review and editing, G.C. (Giorgia Cistola), A.P.-L. and M.F.; visualization, G.C. (Giorgia Cistola); supervision, M.F.; project administration, M.F. and I.v.d.M. All authors have read and agreed to the published version of the manuscript.
Funding
The last author has been funded by the Agencia Estatal de Investigación (AEI), Ministerio de Ciencia, Innovación y Universidades and the Fondo Social Europeo (FSE) under grant RYC-2015-17239 (AEI/FSE, UE).
Institutional Review Board Statement
The study was conducted according to the guidelines of the Declaration of Helsinki, and approved by the Institutional Committee for Ethical Review of Projects (CIREP) of Universitat Pompeu Fabra (Approval Nr. 0118, 06.06.2019).
Informed Consent Statement
Due to the linguistic difficulties characterising the participants in this study, and in accordance with the neuropsychologist of reference, the researchers collected verbal informed consent from the participants. The individuals involved in the experiments could not read or, in some cases, oppose to a signature. Therefore, the consent was requested verbally through the following procedure: (a) the researcher explained and illustrated the aphasia-friendly informed consent module that was previously reviewed and approved by the university’s ethical committee, (b) once the researchers were sure that the participant understood the content of the aphasia-friendly informed consent, the experiment started. In a second stage, the neuropsychologist should have involved the caregivers and asked them to sign the informed consent on behalf of the participant, or assisted the participant to sign the consent form (after reading the informed consent themselves). However, due to the outbreak of COVID-19, this second part of the consent procedure could not be completed.
Data Availability Statement
The materials from the clinical experiment are available on request from the corresponding author.
Acknowledgments
We would add acknowledgements to the “Hospital de la Santa Creu i Sant Pau” in Barcelona and to Carmen García-Sánchez and Nicholas Grunden for the support and help in the clinical experiment. This work has been carried out using an NVIDIA GPU Titan Xp generously provided by NVIDIA Company.
Conflicts of Interest
The authors declare no conflict of interest.
References
- Brown, J.A.; Wallace, S.E.; Knollman-Porter, K.; Hux, K. Comprehension of Single Versus Combined Modality Information by People With Aphasia. Am. J. Speech-Lang. Pathol. 2018, 28, 278–292. [Google Scholar] [CrossRef] [PubMed]
- Knollman-Porter, K.; Wallace, S.E.; Brown, J.A.; Hux, K.; Hoagland, B.L.; Ruff, D.R. Effects of Written, Auditory, and Combined Modalities on Comprehension by People With Aphasia. Am. J. Speech-Lang. Pathol. 2019, 28, 1206–1221. [Google Scholar] [CrossRef] [PubMed]
- Wallace, S.E.; Knollman-Porter, K.; Brown, J.A.; Hux, K. Narrative Comprehension by People with Aphasia given Single versus Combined Modality Presentation. Aphasiology 2019, 33, 731–754. [Google Scholar] [CrossRef]
- Cistola, G.; Farrús, M.; van der Meulen, I. Aphasia and Acquired Reading Impairments: What Are the High-Tech Alternatives to Compensate for Reading Deficits? Int. J. Lang. Commun. Disord. 2021, 56, 161–173. [Google Scholar] [CrossRef] [PubMed]
- Carlsen, K.; Hux, K.; Beukelman, D.R. Comprehension of Synthetic Speech by Individuals with Aphasia. J. Med. Speech Lang. Pathol. 1994, 2, 105–111. [Google Scholar]
- Hux, K.; Knollman-Porter, K.; Brown, J.; Wallace, S.E. Comprehension of Synthetic Speech and Digitized Natural Speech by Adults with Aphasia. J. Commun. Disord. 2017, 69, 15–26. [Google Scholar] [CrossRef] [PubMed]
- McNeil, M.R.; Odell, K.; Tseng, C.-H. Toward the Integration of Resource Allocation into a General Theory of Aphasia. Clin. Aphasiology 1991, 20, 21–39. [Google Scholar]
- Murray, L.L. Attention and Aphasia: Theory, Research and Clinical Implications. Aphasiology 1999, 13, 91–111. [Google Scholar] [CrossRef]
- Hux, K.; Wallace, S.E.; Brown, J.A.; Knollman-Porter, K. Perceptions of People with Aphasia about Supporting Reading with Text-to-Speech Technology: A Convergent Mixed Methods Study. J. Commun. Disord. 2021, 91, 106098. [Google Scholar] [CrossRef] [PubMed]
- Forster, K.I.; Forster, J.C. DMDX: A Windows Display Program with Millisecond Accuracy. Behav. Res. Methods Instrum. Comput. 2003, 35, 116–124. [Google Scholar] [CrossRef] [PubMed] [Green Version]
- Taylor, P.; Black, A.W.; Caley, R. The Architecture of the Festival Speech Synthesis System. In Proceedings of the 3rd ESCA Workshop on Speech Synthesis, Jenolan Caves House, Blue Mountains Australia, 26–29 November 1998; pp. 147–151. [Google Scholar]
- Bonafonte, A.; Agüero, P.D.; Adell, J.; Pérez, J.; Moreno, A. Ogmios: The UPC Text-to-Speech Synthesis System for Spoken Translation. In Proceedings of the TC-Star Workshop on Speech-to-Speech Translation, Barcelona, Spain, 19–21 June 2006; pp. 199–204. [Google Scholar]
- Baby, A.; Vinnaitherthan, S.; Adiga, N.; Jawale, P.; Badam, S.; Adavanne, S.; Konjeti, S. An ASR Guided Speech Intelligibility Measure for TTS Model Selection. arXiv 2020, arXiv:2006.01463. [Google Scholar]
- Levenshtein, V.I. Binary Codes Capable of Correcting Deletions, Insertions, and Reversals. In Soviet Physics Doklady; MAIK Nauka/Interperiodica and Springer Science + Business Media: Moscow, Soviet Union, 1966; Volume 10, pp. 707–710. [Google Scholar]
- Pratap, V.; Hannun, A.; Xu, Q.; Cai, J.; Kahn, J.; Synnaeve, G.; Liptchinsky, V.; Collobert, R. Wav2Letter++: A Fast Open-Source Speech Recognition System. In Proceedings of the ICASSP, IEEE International Conference on Acoustics, Speech and Signal Processing—Proceedings 2019, Brighton, UK, 12–17 May 2019; pp. 6460–6464. [Google Scholar] [CrossRef] [Green Version]
- Pratap, V.; Xu, Q.; Sriram, A.; Synnaeve, G.; Collobert, R. MLS: A Large-Scale Multilingual Dataset for Speech Research. In Proceedings of the Annual Conference of the International Speech Communication Association, INTERSPEECH 2020, Shanghai, China, 25–29 October 2020; pp. 2757–2761. [Google Scholar] [CrossRef]
- Sanders, W.R.; Gramlich, C.; Levinef, A. Naturalness of Synthesized Speech. In University-Level Computer-Assisted Instruction at Stanford: 1968–1980; Suppes, P., Ed.; Insititute for Mathematical Studies in the Social Sciences, Stanford University Publisher: Stanford, CA, USA, 1968. [Google Scholar]
- Soni, M.H.; Patil, H. Non-Intrusive Quality Assessment of Synthesized Speech Using Spectral Features and Support Vector Regression. In Proceedings of the 9th ISCA Speech Synthesis Workshop, Sunnyvale, CA, USA, 13–15 September 2016. [Google Scholar]
- Mittag, G.; Möller, S. Deep Learning Based Assessment of Synthetic Speech Naturalness. In Proceedings of the Annual Conference of the International Speech Communication Association, INTERSPEECH 2020, Shanghai, China, 25–29 October 2020; pp. 1748–1752. [Google Scholar] [CrossRef]
- Farrús, M.; Hernando, J.; Ejarque, P. Jitter and Shimmer Measurements for Speaker Recognition Mireia. In Proceedings of the INTERSPEECH 2007, 8th Annual Conference of the International Speech Communication Association, Antwerp, Belgium, 27–31 August 2007; pp. 778–781. [Google Scholar]
- Teixeira, J.P.; Oliveira, C.; Lopes, C. Vocal Acoustic Analysis—Jitter, Shimmer and HNR Parameters. Procedia Technol. 2013, 9, 1112–1122. [Google Scholar] [CrossRef] [Green Version]
- Zwetsch, I.C.; Fagundes, R.; Russomano, T.; Scolari, D. Digital Signal Processing in the Differential Diagnosis of Benign Larynx Diseases [Abstract in English]. Sci. Med. 2006, 16, 109. [Google Scholar]
- Teixeira, J.P.; Gonçalves, A. Accuracy of Jitter and Shimmer Measurements. Procedia Technol. 2014, 16, 1190–1199. [Google Scholar] [CrossRef] [Green Version]
- Slyh, R.E.; Nelson, W.T.; Hansen, E.G. Analysis of Mrate, Shimmer, Jitter, and F/Sub 0/ Contour Features across Stress and Speaking Style in the SUSAS Database. In Proceedings of the 1999 IEEE International Conference on Acoustics, Speech, and Signal Processing. Proceedings. ICASSP99 (Cat. No.99CH36258), Phoenix, AZ, USA, 15–19 March 1999; Volume 4, pp. 2091–2094. [Google Scholar] [CrossRef]
- Boersma, P.; Weenink, D. PRAAT, a System for Doing Phonetics by Computer. Glot Int. 2001, 5, 341–345. [Google Scholar]
- Ziegler, A. Generalized Estimating Equations; Springer Science & Business Media: Berlin/Heidelberg, Germany, 2011; Volume 204. [Google Scholar]
- King, S. An Introduction to Statistical Parametric Speech Synthesis. Sadhana Acad. Proc. Eng. Sci. 2011, 36, 837–852. [Google Scholar] [CrossRef] [Green Version]
- Cohn, M.; Zellou, G. Perception of Concatenative vs. Neural Text-to-Speech (TTS): Differences in Intelligibility in Noise and Language Attitudes. In Proceedings of the Annual Conference of the International Speech Communication Association, INTERSPEECH 2020, Shanghai, China, 25–29 October 2020; pp. 1733–1737. [Google Scholar] [CrossRef]
Publisher’s Note: MDPI stays neutral with regard to jurisdictional claims in published maps and institutional affiliations. |
© 2021 by the authors. Licensee MDPI, Basel, Switzerland. This article is an open access article distributed under the terms and conditions of the Creative Commons Attribution (CC BY) license (https://creativecommons.org/licenses/by/4.0/).