Article

Quantitative Retrieval of Soil Salinity Using Landsat 8 OLI Imagery

Harbin Normal University, Limin Economic Development Zone, No. 1 Shida Road, Harbin 150025, China
*
Author to whom correspondence should be addressed.
Appl. Sci. 2021, 11(23), 11145; https://doi.org/10.3390/app112311145
Submission received: 24 October 2021 / Revised: 10 November 2021 / Accepted: 22 November 2021 / Published: 24 November 2021
(This article belongs to the Special Issue Advances in Intelligent Control and Image Processing)

Abstract

:
Soil salinization is the main reason for declining soil quality and a reduction in agricultural productivity. We derive the spatial distribution of soil moisture from the temperature vegetation dryness index (TVDI) of Landsat TM-8 OLI images to analyze the effect of spatial heterogeneity of soil moisture on the retrieval accuracy of soil salinity. We establish five soil salinity inversion models for different soil moisture levels (drought levels) based on the canopy response salinity index (CRSI), normalized difference vegetation index (NDVI), and automatic water extraction index (AWEI) derived from Landsat TM-8 OLI images. The inversion accuracy of soil salinity is assessed using 42 field samples. The results show that the average accuracies of the five inversion models are higher than that of the traditional soil salinity inversion model of the entire study area. The proposed model underestimates soil salinity in high-moisture areas and overestimates it in drought areas. Therefore, inversion models of soil salinization should consider spatial differences in soil moisture to improve the inversion accuracy.

1. Introduction

Soil salinization describes the process of soluble salts accumulating on the soil surface. It is the most common type of land degradation in arid, semi-arid, and sub-humid areas, representing an environmental issue of common concern worldwide and a source of ecological problems. Soil salinization is the result of a combination of natural conditions (such as hydrology, topography, and climate), farming practices, and irrigation practices. It typically occurs in areas with dry climates, low rainfall, high surface evaporation, and high levels of soluble salts. Elevated levels of soluble salts (such as Na+, Cl) in the soil are a major threat to agricultural production worldwide [1,2]. Even in small amounts, soluble salts can cause a decline in soil fertility and inhibit the growth of crops, resulting in greatly reduced crop yields [3]. In addition, the pH value of the soil indicates the intensity of soil salinity, regulating the abundance of toxic substances such as aluminum and manganese and essential nutrients, e.g., phosphorus, calcium, magnesium, and potassium [4]. Soil salinity resulted in taking land out of agricultural production, a decline in animal husbandry, the deterioration of the ecological environment, and adverse impacts on the economy and social development.
Remote sensing techniques have several advantages over traditional field sampling and electromagnetic induction methods for measuring soil salinity, such as low cost, large extent, and repeated coverage. Many techniques have been used to measure the spatial distribution of soil salinity using multi-source satellite images, such as MODIS, Landsat 8-OLI, Sentinel-1 A/B, and Hyperion [3,5,6]. For example, Whitney et al. established a soil salinity model in the western San Joaquin Valley (WSJV), California, USA, based on time-series data [3]. Scudiero et al. developed a regional soil salinity prediction model using multiple linear regression, Landsat7 ETM+ canopy reflectivity, and the canopy response salinity index (CRSI) [7]. Wang et al. produced accurate regional salinity maps using partial least-squares regression (PLSR) and spectral indices derived from Sentinel-2 multi-spectral instrument (MSI) data [6].
Previous studies found that many environmental factors influenced the spectral characteristics of saline and alkaline lands, such as soil organic matter, soil type, land use, rainfall, temperature, evapotranspiration, and vegetation cover [8,9,10,11,12]. Many studies have integrated these factors with the spectral features of remote sensing imagery to create salinity inversion models and improve the accuracy of salinity monitoring. Ma et al. developed an empirical salinity simulation model using spectral features, precipitation, evapotranspiration, and a digital elevation model (DEM) [13]. Chi et al. established an improved surface salinity model consisting of spectral indices, spatial location, and land cover type [14]. These study showed that the accuracy of salinization inversion have been affected by environmental indicators such as climate, evapotranspiration, and groundwater [15,16]. The spatial heterogeneity of soil moisture is a manifestation of the changes in these environmental indicators, which will significantly affect the spectral characteristics of remote sensing images and the accuracy of soil salinity inversion results [17,18]. However, few studies focus on the influences of the spatial heterogeneity of soil moisture on the inversion accuracy of the soil salinity. As far as we known, this is the only study to construct a quantitative retrieval model of soil salinity according to the gradients of soil moisture and discuss the influences of the spatial variation of the soil moisture on the uncertainty of the soil salinity inversion based on field gauged samples.
The main objective of the current study is to analyze the influence of the spatial heterogeneity of soil moisture on the inversion accuracy of soil salinity. An understanding of the spatial distribution of soil moisture can improve the inversion accuracy of soil salinity. In addition, detailed information on soil salinization obtained from remote sensing data can prevent further degradation of salinized soil and ensure the sustainable development of regional ecosystems. This approach also provides decision support for various departments to prevent and control salinization.

2. Materials and Methods
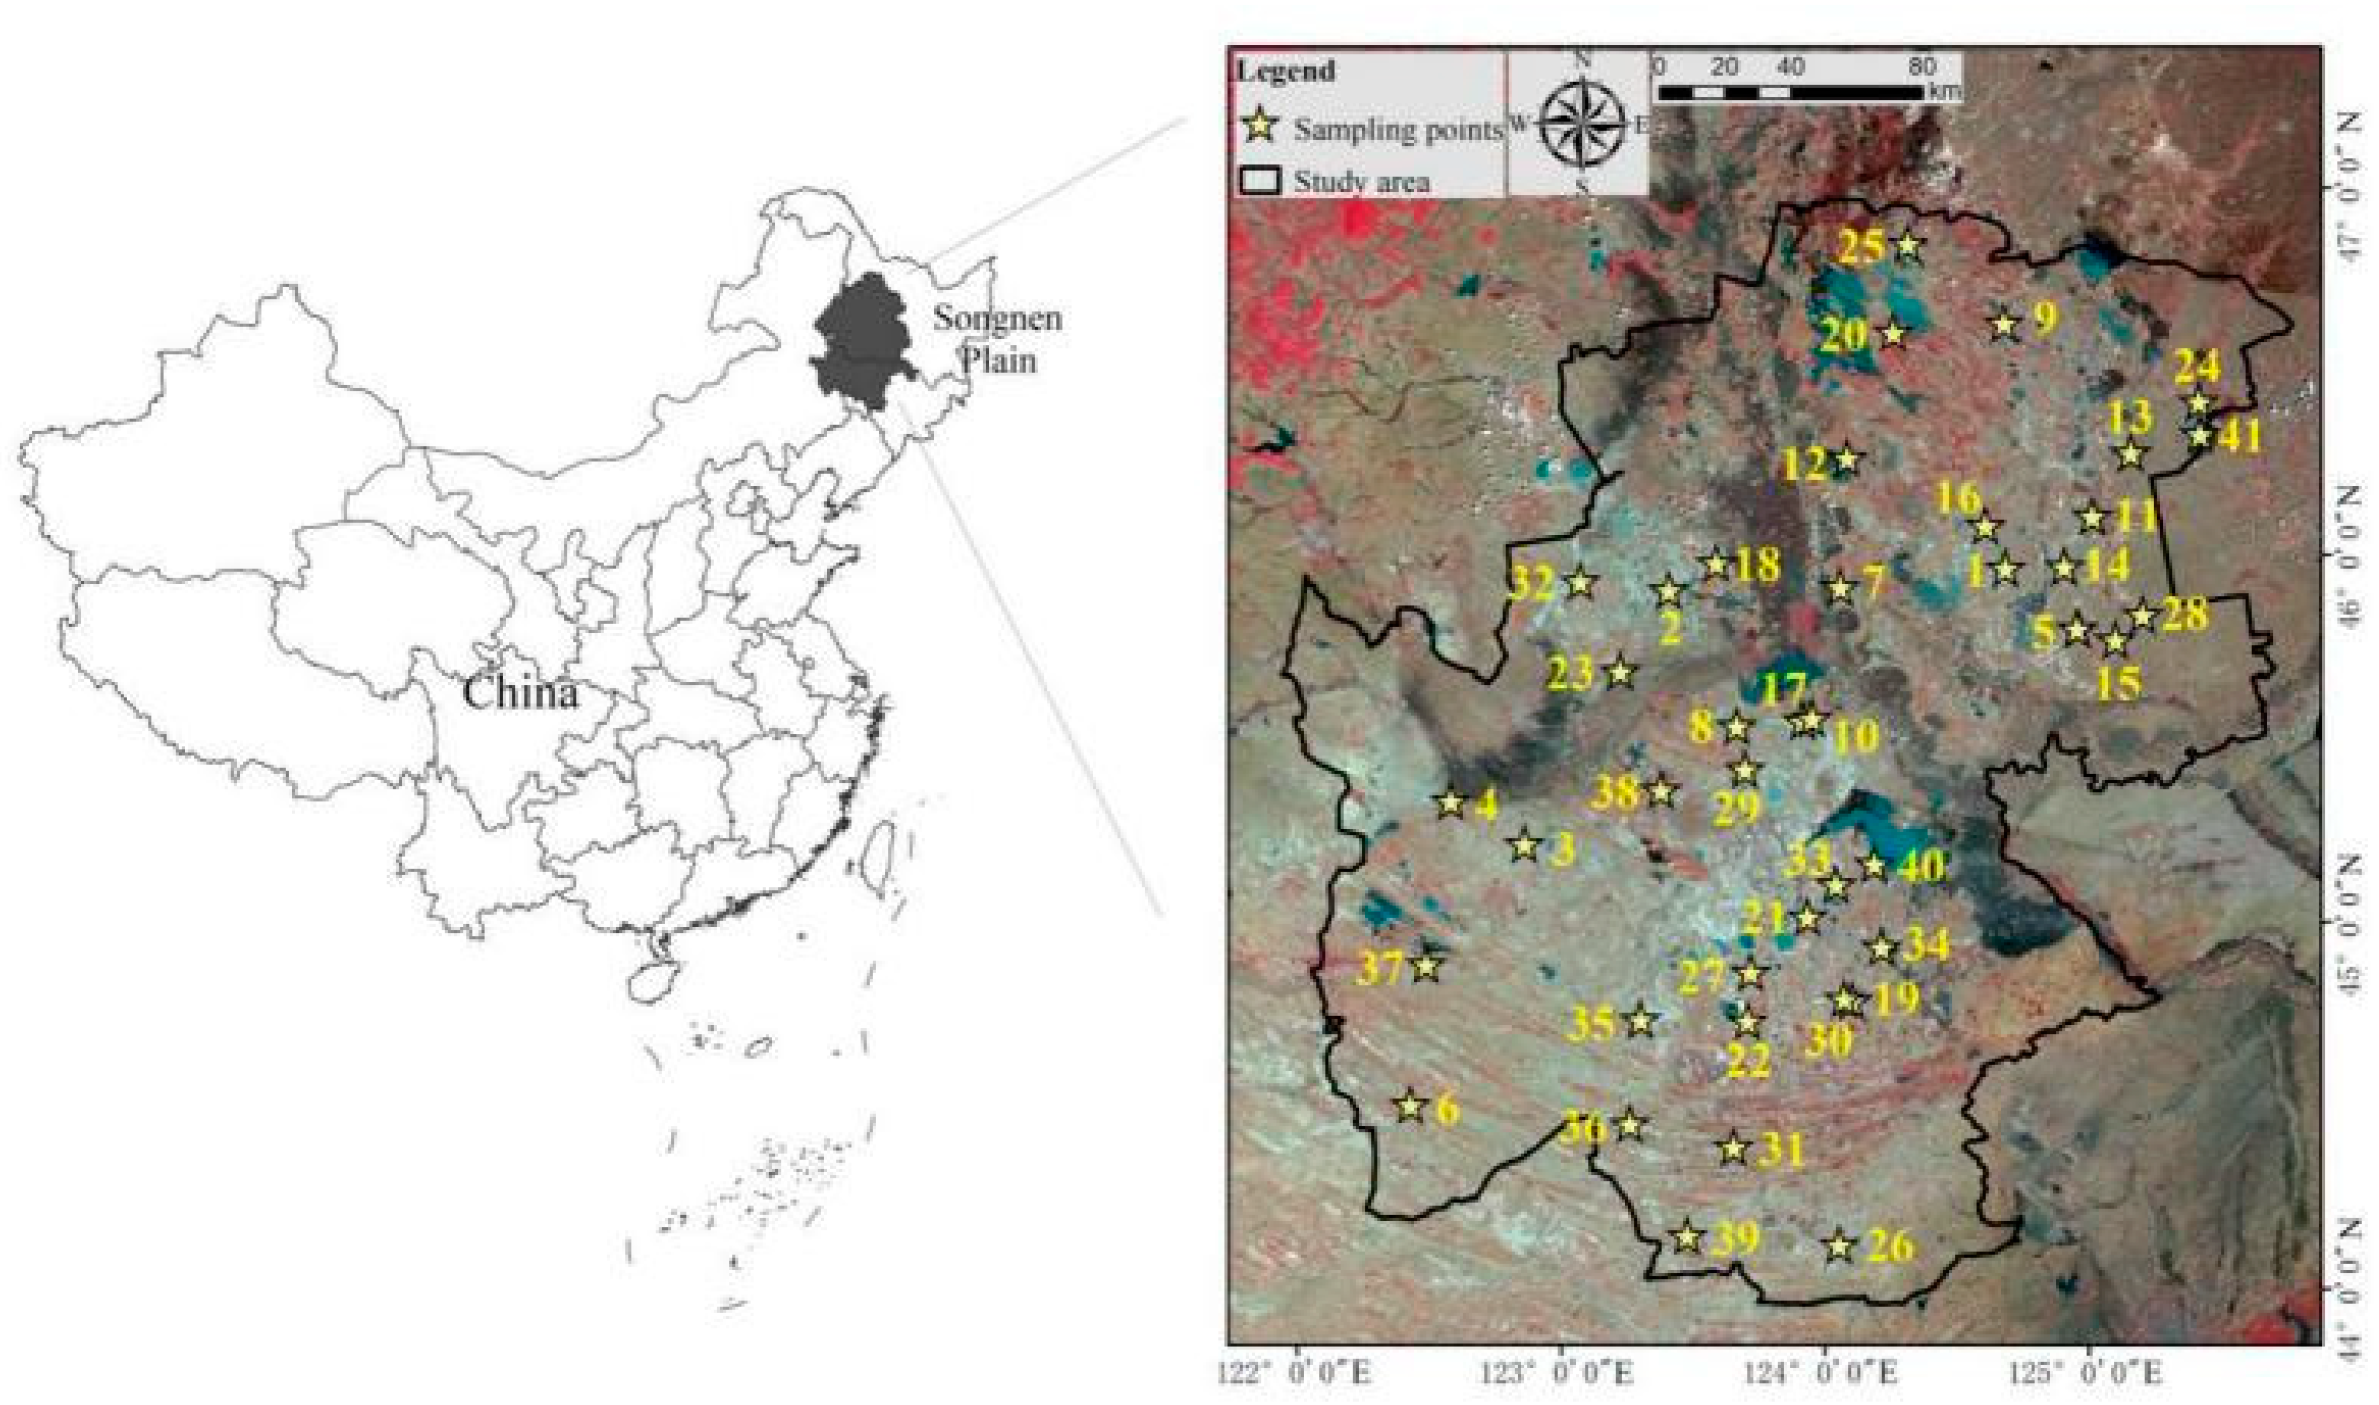
2.1. Study Area

The Songnen Plain is located in the southwestern part of Heilongjiang Province, China, between the Greater Khingan Mountains, Lesser Khingan Mountains, and Changbai Mountains (119°45′~129°36′ E, 42°50′~49°18′ N) and covers an area of about 23.75 × 10⁴ km2 (Figure 1). The study area is located in a semi-arid sub-humid zone and has a temperate continental climate. The annual average precipitation is 400–500 mm, and the annual average evaporation is 1250–1650 mm. According to the field survey conducted by the ministry of water resources and agriculture of China, the area of saline-alkali land in the Songnen Plain was about 2.40 million hm2 in 1950. It was dominated by a slightly salinized reed marsh with almost no alkaline soil. The area of saline-alkali land reached 3.20 million hm2 in 1990 and 3.94 million hm2 in 2006 [19]. Most of the saline-alkaline land is located at altitudes of 150 m or less (primarily at 130–140 m) and near rivers [20]. Land salinization in the Songnen Plain is caused by several factors. Plate tectonics affected the structure and properties of the Earth’s crust, influencing material sources and transport paths [21]. The groundwater acted as the solvent and carrier for the dissolved salts. Since the groundwater level is close to the surface, the salt was deposited on the surface. [22,23]. An arid or semi-arid climate promotes the rise of the water and salt in the soil profile [24,25]. In the last several decades, land salinization has significantly increased and threatened the local food security because grain is an important commodity in Heilongjiang Province.

2.2. Data Sources

2.2.1. Satellite Data

Nine Landsat 8 OLI images acquired from April to May 2015 were used in this study. The Landsat 8 satellite was launched by NASA on 11 February 2013. It carries two sensors, the OLI terrestrial imager and a thermal infrared sensor (TIRS). Landsat 8 images have a high spatial resolution, rapid revisit time, and easy data acquisition. The L1T data product has been radiometrically and geometrically corrected. It includes a metadata file (.txt), 11 single-band files (.tif), and band quality assessment (BQA) information. The spectral bands and resolutions of the Landsat-8 OLI data are listed shown in Table 1. The path/row numbers of the nine images were 118/29, 119/27, 119/28, 119/29, 120/27, 120/28, 120/29, 121/27, and 121/28, and the cloud cover was less than 2% for all images. The images were rectified to the Universal Transverse Mercator (UTM) coordinate system using the World Geodetic System (WGS) 1984 datum in the north UTM Zone 36. The multi-spectral bands were fused with the panchromatic band. Radiometric and atmospheric corrections were performed using the Fast Line-of-sight Atmospheric Analysis of Hypercubes (FLAASH) algorithm in the ENVI 5.1 to remove atmospheric artifacts produced by molecules and aerosols. The images were geometrically corrected (accuracy: ±0.5 pixels).

2.2.2. Ground Truth Data

Field investigations were conducted in late April, 2015 to coincide with the acquisition time of Landsat TM-8 OLI remote sensing images. The date of the field work was selected at the early spring to avoid the impact of frozen and the vegetation on the spectral characteristics of the saline-alkali land. In this case, 42 sampling sites were evenly distributed at the study area and were located on both sides of the roads considered its representatives and accessibility (Figure 1). The geographic coordinates of the sampling sites were obtained using a handheld Trimble Geo Explorer GPS device (Trimble Navigation Ltd., Inc., Sunnyvale, CA, USA). The land cover type and vegetation communities were recorded at the sample sites. Surface soil samples (0–30 cm) were collected, and the soil salinity (electrical conductivity (EC)) was measured with a conductivity meter (REX DDS-307). The water content of the surface soil samples was obtained in the laboratory using the drying weighing method. It was converted to relative humidity (%) using the following formula [26]:
R H = W M ( d s r s d s ) × 100 %
where RH is the relative soil moisture, WM is the mass water content of the soil, ds is the density of soil particles. A constant of 2.65 g/cm3 was used according to the empirical calculation. rs is the soil bulk density.

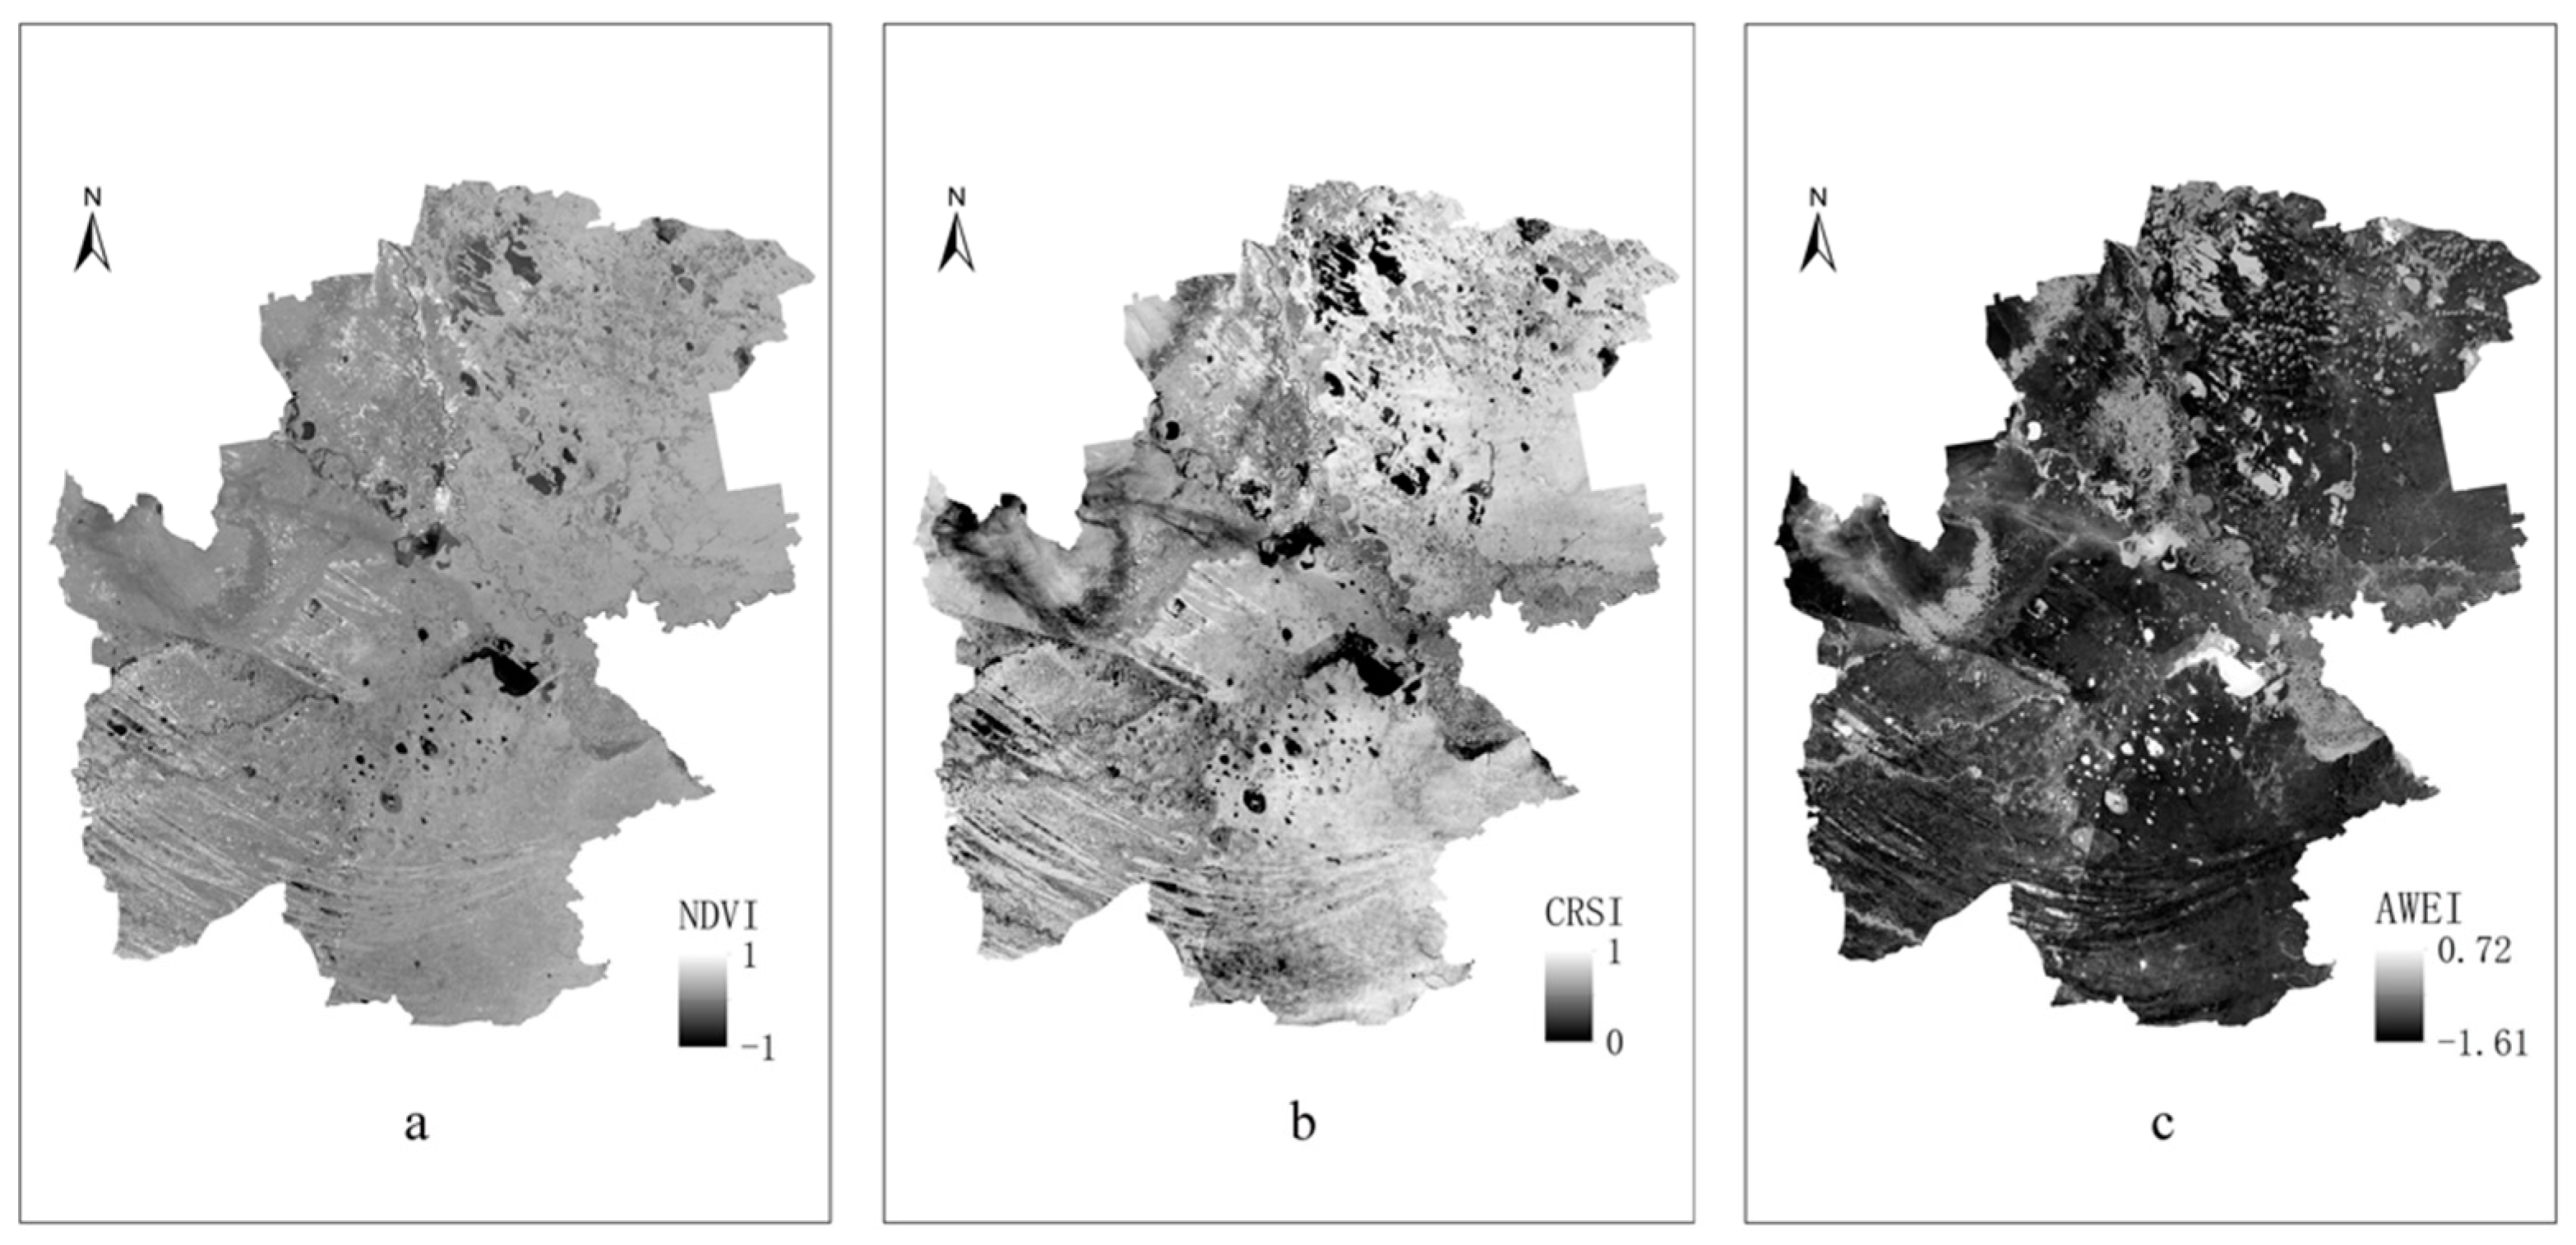
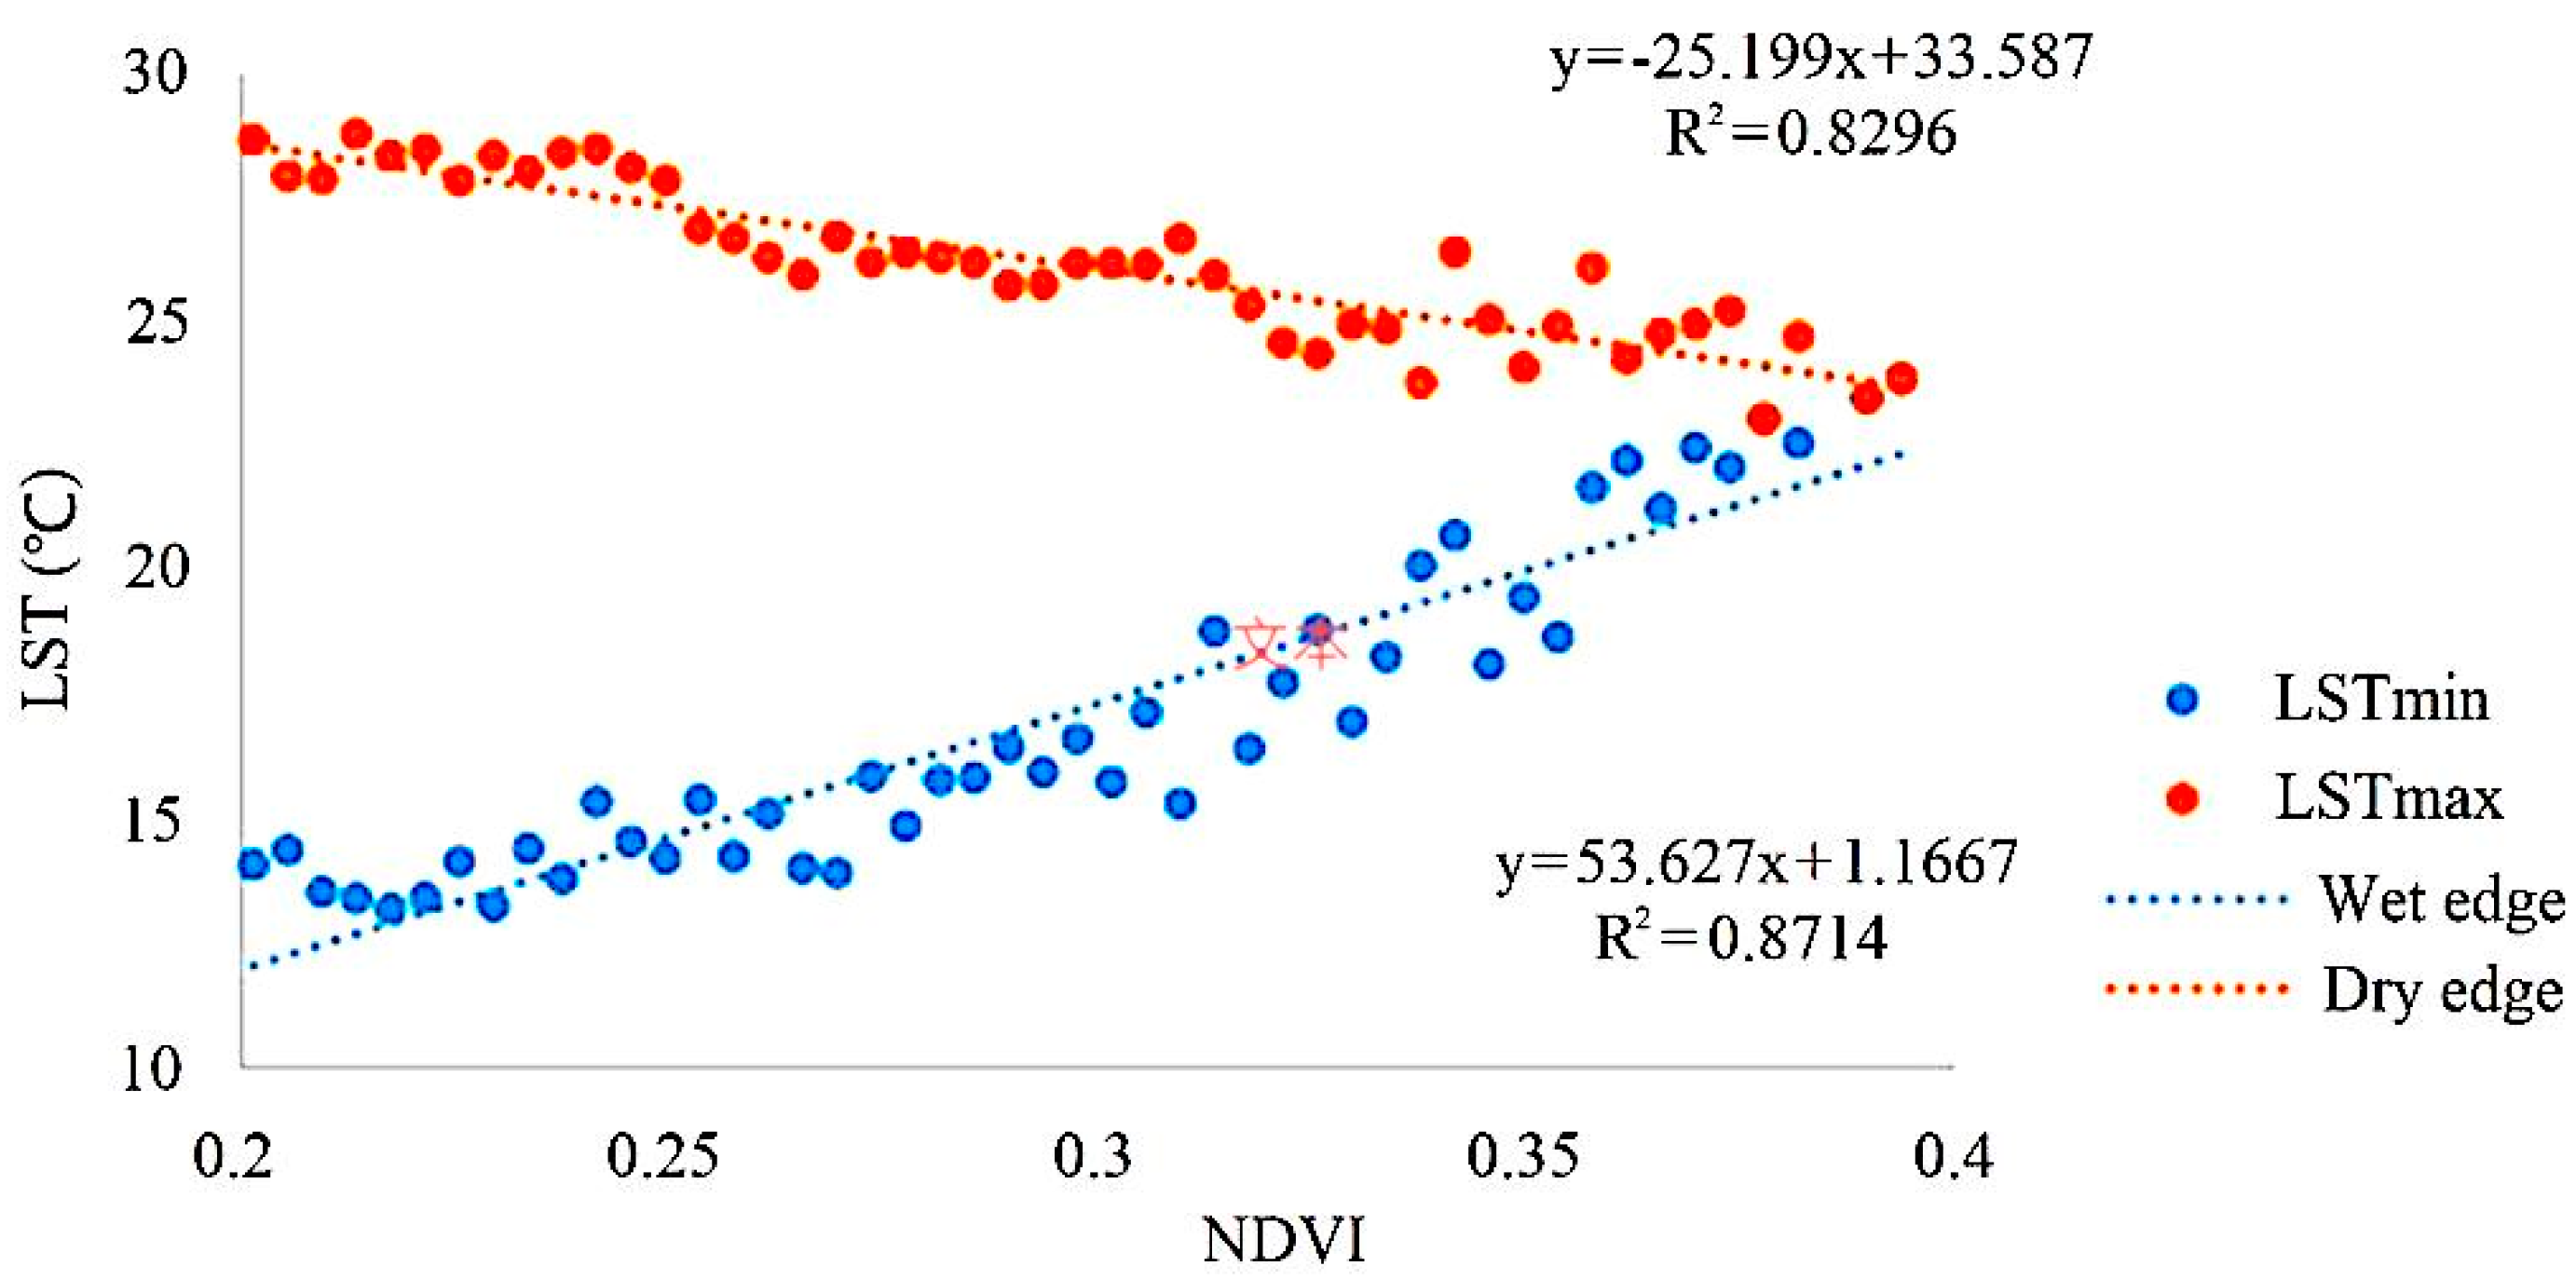
2.3. Inversion of Soil Relative Humidity Based on TVDI from Landsat-8 OLI Image

The simplified temperature vegetation dryness index (TVDI) proposed by Sandholt et al. was used for the inversion of soil relative humidity in the study area based on the Landsat-8 OLI image [27]. The TVDI is calculated as follows:
T V D I = L S T L S T min L S T max L S T min
L S T max = a + b × NDVI
L S T min = c + d × NDVI
where LST is the land surface temperature of a pixel; NDVI is the normalized difference vegetation index. LSTmax and LSTmin are the dry edge (the upper fitted line in Figure 2) and wet edge (lower fitted line in Figure 2), respectively. The data were obtained by least-squares linear regression of the LST and NDVI values with a small NDVI interval (0.05). The Equations (3) and (4) were used to calculate the LSTmin and the LSTmax where a and c are their intercept and b and d are their slope, respectively. Subsequently, curve fitting was performed between the TVDI data obtained from Equation (2) and the field-measured soil moisture to obtain the spatial distribution of soil relative humidity. Compared with other soil moisture inversion methods, the advantage of this method is that the relationship between the relative changes of TVDI and soil moisture is more stable under different climatic conditions and surface cover conditions [28].

2.4. Drought Classification Based on Soil Relative Humidity

The study area was divided into five regions with different moisture gradients according to the drought level standard formulated by the Ministry of Water Resources of the People’s Republic of China (Table 2).

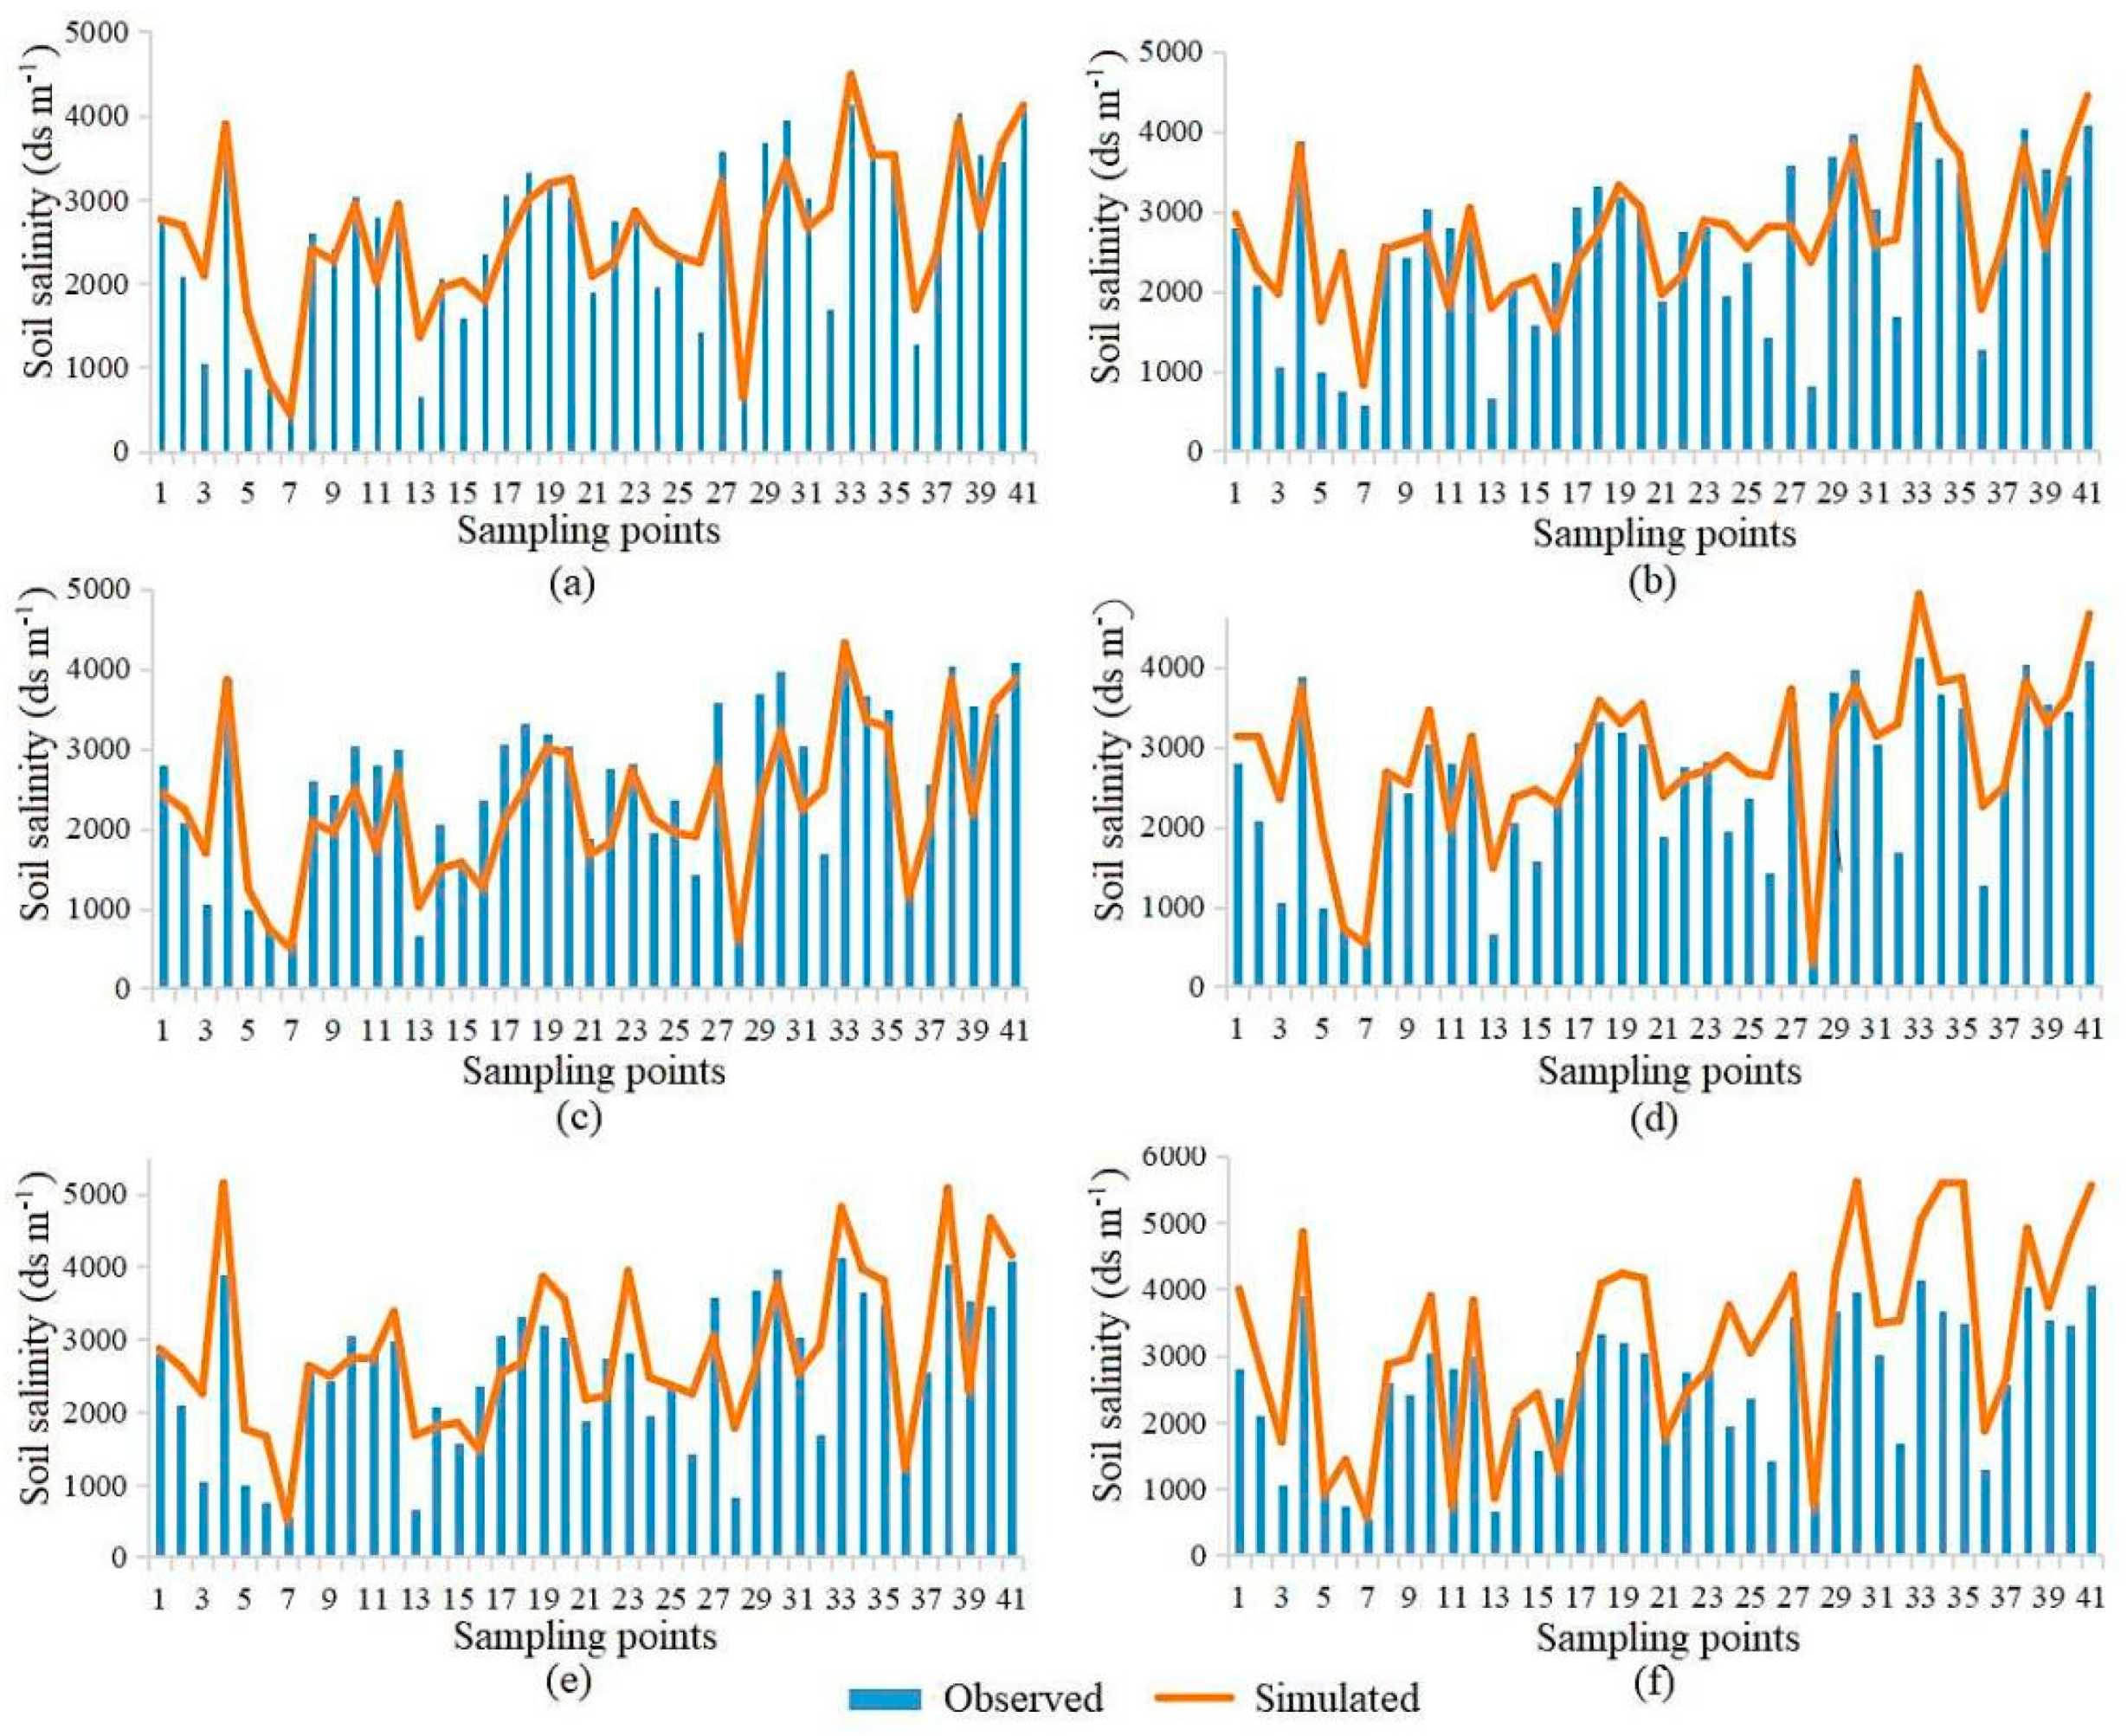
2.5. Establishment and Validation of the Soil Salinity Model

In order to identify the influence of soil moisture on the quantitative retrieval of soil salinity, we established 5 soil salinity models according to the different drought levels based on soil relative humidity listed in Table 2. We also established the soil salinity model with the field survey soil salinity data and remote sensing imagery in the whole study area to compare the retrieval accuracy with that of the model considered the spatial variations of the soil moisture. Multiple linear regressions were used to develop the soil salinity models. The canopy response salinity index (CRSI) were included as explanatory variables to highlight the information related to the soil salinity, while the automate water extraction index (AWEI) and the normalized difference vegetation index (NDVI) were included as independent variables to emphasize the impact of soil water on the soil salinity and depress the noise and the vegetation background information at the same time. The CRSI, NDVI, and AWEI (Figure 3) were calculated as follows:
CRSI = ( N I R × R ) ( G × B ) ( N I R × R ) + ( G × B )
NDVI = ( N I R R ) ( N I R + R )
AWEI = B + 2.5 × G 1.5 × ( N I R + S W I R 1 ) 0.25 × S W I R 2
where NIR is the near-infrared band reflectance, R is the red band reflectance, G is the green band reflectance, B is the blue band reflectance, and SWIR1 and SWIR2 are the short-wave infrared reflectance values derived from the Landsat-8 OLI images (Table 1).
The coefficient of determination (R2) and root mean square error (RMSE) (Equations (8) and (9)) were used to evaluate the accuracy of the soil salinity estimation. The inversion accuracy of the 5 soil salinity were compared with the soil salinity model of the entire study area, which did not consider the impact of soil moisture to determine the impact of the spatial heterogeneity of soil moisture on the inversion accuracy.
R 2 = ( i = 1 N ( X i X ¯ ) ( Y i Y ¯ ) i = 1 N ( X i X ¯ ) 2 i = 1 N ( Y i Y ¯ ) 2 ) 2
RMSE = [ i = 1 N ( X i Y i ) 2 / N ] 1 2
where Xi represents the estimated value of the i sample, X is the estimated mean value, Yi represents the measured value of the i sample, and Y represents the mean of the measured values. N is the number of samples.

3. Results

3.1. Inversion Model of Soil Relative Humidity and Classification

The quadratic curve model to inverse the soil relative humidity is defined as follows:
R H = 3049 . 6 × TVDI 2     4936 . 5 × TVDI + 2078
where RH is the soil relative humidity, TVDI is the temperature vegetation drought index. The accuracy assessment results combined the soil moisture derived from Landsat-8 OLI image with the field gauged soil moisture showed that the RMSE was 13.76 which proved that the method is suitable to extract the soil moisture of the large-scale floodplain. Figure 4 shows the spatial distribution of the soil relative humidity, which have been divided into five drought levels according to the drought standard provided by the Ministry of Water Resources of the People’s Republic of China. The soil moisture of the study area is gradually drying from northeast to southwest. The regions with low soil moisture often occurred in the southwest of the plain, and the regions with high soil moisture are concentrated in the middle of the plain.

3.2. Assessing Soil Salinity for Different Soil Moisture Levels

The linear relationship between soil salinity and CRSI, NDVI, and AWEI was used to evaluate the performance of the models for different soil moisture levels (Table 3). The R2 values of the five soil salinity models that considered the spatial variations of the soil moisture are higher than 0.744, whereas that of the entire study area is 0.712. Therefore, using salinity models based on different soil moisture levels provides higher inversion accuracy than using a model of the entire study area.
We also compared the soil salinity obtained from field measurements with the model results to demonstrate the influence of soil moisture on soil salinity inversion (Figure 5). In the no drought and slight drought areas, 68% and 80% of the samples, respectively, are underestimated by the soil salinity model. In the strong drought and extreme drought areas, 66% and 78% of the samples, respectively, are overestimated by the soil salinity model. The soil salinity inversion model underestimates soil salinity in moist areas and overestimates it in dry areas. The average accuracy of the inversion models of the five different soil moisture levels demonstrate that it is essential to understand the spatial characteristic of the surface soil moisture before assessing soil salinity using spectral vegetation indices from remote sensing imagery.

4. Discussion

We established soil salinity inversion models for different soil moisture levels to evaluate the influence of spatial heterogeneity of soil moisture on the accuracy of soil salinization inversion. The proposed salinity models based on drought levels provide more accurate classification results than traditional soil salinity models. Many studies have found an advantage in using remote sensing data to estimate soil salinity due to lithological and meteorological settings [29]. In the current study, we investigated the influence of soil moisture on the spectral characteristics of remote sensing images. Similar to the results reported by Zhu [30], soil salinity was underestimated when the soil relative humidity was higher than 50%. The likely reason is that the high soil moisture content affects the spectral reflectance of the optical remote sensing images. We observed underestimations of soil salinity in high-moisture regions, as expected. In contrast, we found a significant overestimation of soil salinity in regions with soil relative humidity less than 40%. Oversaturation was observed primarily in areas with bare soil and low vegetation density [31]. Therefore, soil moisture and the associated vegetation conditions can bias salinity assessment models.
During the process of constructing soil moisture model, we found the soil relative humidity decrease gradually with the increasing of TVDI (Figure 5). The TDVI derived from the Landsat TM-8 OLI is highly correlated with the gauged soil moisture data which indicate that it is reasonable to obtain the spatial distribution characteristic of the soil humidity based on the remote sensing imagery and a soil moisture model. We also noticed that some training plots are not coherence with the simulated quadratic curve. That is partly because the bias between the locations of field survey soil moisture data with the correspondent pixels in the remote sensing imagery. The difference time of field survey and images derivations may also influence the in simulated results of the soil relative humidity. However, the TVDI derived from the remote sensing imagery could reflect the spatial distribution characteristics of the soil moisture in a large extent.
We believe that our approach of emphasizing the impact of environmental factors on the inversion accuracy of soil salinity can improve the inversion accuracy of estimating soil properties from remote sensing data using limited field sampling. However, soil salinity is a complex process that integrates many environmental factors, such as soil type, soil retention capacity, vegetation phenology and so on. There are different soil types in the Songnen Plain, i.e., black soil, chernozem, meadow soil, dark brown soil etc. The spatial distribution of soil moisture are influenced by the different soil retention capacity and soil water suction for various soil types. However, the relationship between each element is still not clear enough. In the following research, we should further integrate the soil factors, the vegetation phenological factors, the agricultural production intervention factors and other factors to provide more accurate soil salinity data.

5. Conclusions

Soil salinization is a serious land degradation problem. It adversely affects the ecological balance, causes large-scale desertification and the decline or loss of land productivity, and negatively impacts agriculture and the economy. Therefore, soil salinization monitoring is crucial. However, inversion models of soil salinization are affected by soil type, rainfall, temperature, evapotranspiration, vegetation cover, and other factors. This paper investigated the influence of spatial heterogeneity of soil moisture on the inversion accuracy of soil salinization. The results showed the following: (1) the spatial distribution of soil moisture in the floodplain could be accurately estimated using the TVDI derived from Landsat 8 OLI images. Due to the influence of temperature, precipitation, soil type, and vegetation cover, the soil moisture in the Songnen Plain showed a trend of wet-dry-wet from the southwest to the northeast. (2) The spatial difference in the soil moisture significantly impacted the inversion accuracy of the soil salinity model. The inversion model underestimated soil salinity in regions with soil relative humility higher than 50% and overestimated it in very dry regions. (3) The spatial heterogeneity of soil moisture should be considered in retrieval models of soil salinization. The establishment of soil salinity inversion models in areas with different soil moisture levels can improve the inversion accuracy.

Author Contributions

Conceptualization, X.N. and R.D.; methodology, X.N.; software, X.N.; validation, X.N.; formal analysis, X.N.; investigation, X.N.; resources, X.N.; data curation, R.D.; writing—original draft preparation, R.D.; writing—review and editing, X.N.; visualization, X.N.; supervision, X.N.; project administration, X.N. All authors have read and agreed to the published version of the manuscript.

Funding

This research was funded by Natural Science Foundation of Heilongjiang Province, China grant number YQ2020D005.

Institutional Review Board Statement

Not applicable.

Informed Consent Statement

Not applicable.

Data Availability Statement

The data presented in this study are available on reasonable request from the corresponding author.

Acknowledgments

We than anonymous reviewers who suggested several improvements to the article, and facilities who provided technical supports to the field experiment.

Conflicts of Interest

The authors declare no conflict of interest.

References

  1. Ivits, E.; Cherlet, M.; Tóth, T.; Lewińska, K.E.; Tóth, G. Characterisation of Productivity Limitation of Salt-Affected Lands in Different Climatic Regions of Europe Using Remote Sensing Derived Productivity Indicators. Land Degrad. Dev. 2013, 24, 438–452. [Google Scholar] [CrossRef]
  2. Metternicht, G.I.; Zinck, J.A. Remote sensing of soil salinity: Potentials and constraints. Remote. Sens. Environ. 2003, 85, 1–20. [Google Scholar] [CrossRef]
  3. Whitney, K.; Scudiero, E.; El-Askary, H.M.; Skaggs, T.H.; Allali, M.; Corwin, D.L. Validating the use of MODIS time series for salinity assessment over agricultural soils in California, USA. Ecol. Indic. 2018, 93, 889–898. [Google Scholar] [CrossRef]
  4. Roelofsen, H.D.; van Bodegom, P.M.; Kooistra, L.; van Amerongen, J.J.; Witte, J.-P.M. An evaluation of remote sensing derived soil pH and average spring groundwater table for ecological assessments. Int. J. Appl. Earth Obs. Geoinf. 2015, 43, 149–159. [Google Scholar] [CrossRef]
  5. Abuelgasim, A.; Ammad, R. Mapping soil salinity in arid and semi-arid regions using Landsat 8 OLI satellite data. Remote Sens. Appl. Soc. Environ. 2019, 13, 415–425. [Google Scholar] [CrossRef]
  6. Wang, J.; Ding, J.; Yu, D.; Ma, X.; Zhang, Z.; Ge, X.; Teng, D.; Li, X.; Liang, J.; Lizaga, I.; et al. Capability of Sentinel-2 MSI data for monitoring and mapping of soil salinity in dry and wet seasons in the Ebinur Lake region, Xinjiang, China. Geoderma 2019, 353, 172–187. [Google Scholar] [CrossRef]
  7. Scudiero, E.; Skaggs, T.H.; Corwin, D.L. Regional-scale soil salinity assessment using Landsat ETM + canopy reflectance. Remote Sens. Environ. 2015, 169, 335–343. [Google Scholar] [CrossRef] [Green Version]
  8. Elnaggar, A.; Noller, J. Application of Remote-sensing Data and Decision-Tree Analysis to Mapping Salt-Affected Soils over Large Areas. Remote Sens. 2009, 2, 151–165. [Google Scholar] [CrossRef] [Green Version]
  9. Akramkhanov, A.; Martius, C.; Park, S.J.; Hendrickx, J.M.H. Environmental factors of spatial distribution of soil salinity on flat irrigated terrain. Geoderma 2011, 163, 55–62. [Google Scholar] [CrossRef]
  10. Scudiero, E.; Skaggs, T.H.; Corwin, D.L. Regional scale soil salinity evaluation using Landsat 7, western San Joaquin Valley, California, USA. Geoderma Reg. 2014, 2-3, 82–90. [Google Scholar] [CrossRef]
  11. Vermeulen, D.; Van Niekerk, A. Machine learning performance for predicting soil salinity using different combinations of geomorphometric covariates. Geoderma 2017, 299, 1–12. [Google Scholar] [CrossRef]
  12. Joiner, J.; Yoshida, Y.; Anderson, M.; Holmes, T.; Hain, C.; Reichle, R.; Koster, R.; Middleton, E.; Zeng, F.W. Global relationships among traditional reflectance vegetation indices (NDVI and NDII), evapotranspiration (ET), and soil moisture variability on weekly timescales. Remote Sens Environ. 2018, 219, 339–352. [Google Scholar] [CrossRef] [PubMed] [Green Version]
  13. Ma, L.; Yang, S.; Simayi, Z.; Gu, Q.; Li, J.; Yang, X.; Ding, J. Modeling variations in soil salinity in the oasis of Junggar Basin, China. Land Degrad. Dev. 2018, 29, 551–562. [Google Scholar] [CrossRef]
  14. Chi, Y.; Sun, J.; Liu, W.; Wang, J.; Zhao, M. Mapping coastal wetland soil salinity in different seasons using an improved comprehensive land surface factor system. Ecol. Indic. 2019, 107, 105517. [Google Scholar] [CrossRef]
  15. Moussa, I.; Walter, C.; Michot, D.; Adam, I.A.; Nicolas, H.; Pichelin, P.; Guero, Y. Remote Sensing Soil Salinity Assessment in Irrigated Paddy Fields of the Niger Valley Using a Four-Year Time Series of Sentinel-2 Satellite Images. Remote Sens. 2020, 12, 3399. [Google Scholar] [CrossRef]
  16. Douaouia, A.E.K.; Nicolas, H.; Walter, C. Detecting salinity hazards within a semiarid context by means of combining soil and remote-sensing data. Geoderma 2006, 134, 217–230. [Google Scholar] [CrossRef]
  17. Wu, X.R. Spatial and Temporal Dynamics of Soilrelative Moisture in Songnen Plain from 2000 to 2015. Master’s Thesis, Harbin Normal University, Harbin, China, 2019. [Google Scholar]
  18. Sandholt, I.; Rasmussen, K.; Andersen, J. A simple interpretation of the surface temperature/vegetation index space for assessment of surface moisture status. Remote. Sens. Environ. 2002, 79, 213–224. [Google Scholar] [CrossRef]
  19. Sun, G.Y.; Wang, H.X. Large scale development to saline-alkali soil and risk control for the Songnen Plain. Resour. Sci. 2016, 38, 407–413. [Google Scholar] [CrossRef]
  20. Xu, Z.Q.; Xu, X.H. Research Progress on the Causes, Characteristics and Treatment Measures of Soda Saline-alkali Land in Songnen Plain. China Soil Water Conserv. 2018, 2, 54–59. [Google Scholar] [CrossRef]
  21. Wang, Z.X.; Su, Q.S.; Lin, S.Z. Groundwater and Quaternary Geology at Baicheng; Geological Publishing House: Beijing, China, 1985. [Google Scholar]
  22. Song, C.C.; Deng, W. Characters of groundwater and influence on the interior salt-affected soil in the West of Jilin Province. Sci. Geogr. Sin. 2000, 20, 246–250. [Google Scholar]
  23. Zhang, D.F. Study on Soil Salinization in the Western Plain of Jilin Province Based on GIS. Master’s. Thesis, Changchun University of Science and Technology, Changchun, China, 2000. [Google Scholar]
  24. Yu, R.P.; You, W.R. Monitor and Prevention of Salt-Affected Soil; Science Press: Beijing, China, 1993; pp. 41–49. [Google Scholar]
  25. Liu, G.M.; Yang, J.S.; Li, D.S. Evaporation regularity and its relationship with soil salt. Acta Pedol. Sin. 2002, 39, 384–389. [Google Scholar]
  26. Haj-Amor, Z.; Tóth, T.; Ibrahimi, M.-K.; Bouri, S. Effects of excessive irrigation of date palm on soil salinization, shallow groundwater properties, and water use in a Saharan oasis. Environ. Earth Sci. 2017, 76, 1–13. [Google Scholar] [CrossRef]
  27. Haj-Amor, Z.; Bouri, S. Use of HYDRUS-1D–GIS tool for evaluating effects of climate changes on soil salinization and irrigation management. Arch. Agron. Soil Sci. 2019, 66, 193–207. [Google Scholar] [CrossRef]
  28. Tagesson, T.; Horion, S.; Nieto, H.; Zaldo Fornies, V.; Mendiguren González, G.; Bulgin, C.E.; Ghent, D.; Fensholt, R. Disaggregation of SMOS soil moisture over West Africa using the Temperature and Vegetation Dryness Index based on SEVIRI land surface parameters. Remote Sens. Environ. 2018, 206, 424–441. [Google Scholar] [CrossRef] [Green Version]
  29. Jeppesen, E.; Beklioğlu, M.; Özkan, K.; Akyürek, Z. Salinization Increase due to Climate Change Will Have Substantial Negative Effects on Inland Waters: A Call for Multifaceted Research at the Local and Global Scale. Innovation 2020, 1, 100030. [Google Scholar] [CrossRef] [PubMed]
  30. Zhu, Y.X. Selection of Soil Moisture Sensitivity Bands and Estimation of Soil Moisture in Plough Layer. Master’s Thesis, Central China Normal University, Wuhan, China, 2018. [Google Scholar]
  31. Glatzle, A.; Reimer, L.; Núñez-Cobo, J.; Smeenk, A.; Musálem, K.; Laino, R. Groundwater dynamics, land cover and salinization in the dry Chaco in Paraguay. Ecohydrol. Hydrobiol. 2020, 20, 175–182. [Google Scholar] [CrossRef]
Figure 1. The study area and sampling plots in the Songnen Plain.
Applsci 11 11145 g001
Figure 2. Linear regression between LST and NDVI to obtain the dry edge and wet edge fitted line to estimate the temperature vegetation dryness index (TVDI).
Applsci 11 11145 g002
Figure 3. Maps of the normalized vegetation index (NDVI) (a), canopy response salinity index (CRSI) (b), and automatic water extraction index (AWEI) (c) obtained from the Landsat-8 images.
Applsci 11 11145 g003
Figure 4. TVDI retrieval of soil relative humidity.
Applsci 11 11145 g004
Figure 5. Soil salinity obtained from field measurements and models. (a) Entire study area, (b) no drought, (c) slight drought, (d) moderate drought, (e) strong drought, and (f) extreme drought.
Applsci 11 11145 g005
Table 1. The 11 bands and their resolutions of the Landsat-8 OLI data.
Band NameSpectral Range/μmSpatial Resolution/m
Band1 Coastal0.43–0.4530
Band2 Blue0.45–0.5130
Band3 Green0.53–0.5930
Band4 Red0.64–0.6730
Band5 NIR0.85–0.8830
Band6 SWIR11.57–1.6530
Band7 SWIR22.11–2.2930
Band8 Pan0.50–0.6815
Band9 Cirrus1.36–1.3830
Band10 TIRS110.60–11.19100
Band11 TIRS211.50–12.51100
Table 2. Drought classification based on soil relative humidity.
RHSoil Moisture ConditionsDrought Level
RH > 60%The surface is moist.No drought
50% < RH ≤ 60%The soil moisture is normal and the soil surface is dry.Slight drought
40% < RH ≤ 50%The soil surface is dry, and the vegetation lacks water and is yellow.Moderate drought
30% < RH ≤ 40%A dry soil layer exists, and the leaves are dry and yellow.Strong drought
RH ≤ 30%Extreme dryness and vegetation death.Extreme drought
Table 3. Linear relationship between soil salinity and CRSI, NDVI, and AWEI for different drought levels (soil relative humidity) and the entire study area.
Drought LevelModel FormulaR2RMSE
Entire study areaEC = 5098.246 × CRSI + 10290.813 × NDVI + 0.323 × AWEI − 1019.6320.7120.472
No droughtEC = 2347.511 × CRSI + 8924.583 × NDVI + 0.790 × AWEI + 2810.8630.9210.505
Slight droughtEC = 7283.681 × CRSI + 29848.471 × NDVI + 0.333 × AWEI − 4778.4100.9010.551
Moderate droughtEC = 1019.427 × CRSI + 12226.786 × NDVI + 0.371 × AWEI + 1463.0970.8520.501
Strong droughtEC = 6862.115 × CRSI + 12120.566 × NDVI + 0.106 × AWEI − 2906.2570.9300.492
Extreme droughtEC = 4266.514 × CRSI + 10798.926 × NDVI + 0.456 × AWEI − 432.8600.7440.491
EC is the electrical conductivity, CRSI is the canopy response salinity index, NDVI is the normalized difference vegetation index, and AWEI is the automate water extraction index.
Publisher’s Note: MDPI stays neutral with regard to jurisdictional claims in published maps and institutional affiliations.

