Article

Designing Light for Night Shift Workers: Application of Nonvisual Lighting Design Principles in an Industrial Production Line

by
Johannes Zauner
1,2,* and
Herbert Plischke
1,*
1
Department of Applied Sciences and Mechatronics, Munich University of Applied Sciences, 80335 Munich, Germany
2
3lpi Lichtplaner + Beratende Ingenieure mbB, 81379 Munich, Germany
*
Authors to whom correspondence should be addressed.
Appl. Sci. 2021, 11(22), 10896; https://doi.org/10.3390/app112210896
Submission received: 15 October 2021 / Revised: 12 November 2021 / Accepted: 16 November 2021 / Published: 18 November 2021
(This article belongs to the Special Issue Advances in Human-Centric Lighting)

Abstract

:

Featured Application

Nonvisual lighting design for shift work.

Abstract

Chronodisruption deteriorates the health and wellbeing of shift workers. Artificial light at night and the lack of light during the day are major contributors to chronodisruption and need to be optimized in shift work scenarios. Here, we present one solution for a lighting and automation system in an industrial production workplace. The setting is a rapidly rotating shift work environment with morning, evening, and night shifts. We describe a procedure to specify the new lighting through a software-agnostic nonvisual lighting simulation for artificial and daylighting scenarios. Through this process, a new luminaire is created, called Drosa, that allows for a large melanopic stimulus range between 412 and 73 lx melanopic equivalent daylight (D65) illuminance vertically at eye level, while maintaining a neutral white illuminance at task level between 1250 and 900 lx, respectively. This is possible through a combination of glare-free spotlights with adjustable areal wing lights. An individually programmed automation system controls the light dosage and timing during the day and night. The work is relevant for other shift work scenarios, where the presented example and the discussed rationale behind the automation might provide insights. The work is further relevant for other lighting scenarios beyond industrial shift work, as the nonvisual lighting simulation process can be adapted to any context.

1. Introduction

Circadian rhythms are likely the evolutionary result of increased fitness when following the natural light and dark day cycle. In humans, circadian rhythms shape rest and activity patterns through nychthemeral changes in specific hormone levels, neuronal activity, and body temperature [1]. Through artificial light at night (LAN), the practical necessity to closely follow the natural cycle has waned in recent generations. The departure has been most prominent in shift and especially night shift workers, a group that suffers from severe detriments of their physiological and psychological health [2]. Here, we propose one exemplary solution for artificial lighting in an industrial production facility to help alleviate these negative effects, alongside an easy-to-use method for the nonvisual lighting design.
Long-term night shift workers have an increased risk of suffering from poor sleep and neurological disorders [2,3] and cardiovascular and metabolic diseases [4], and they are possibly more vulnerable to certain types of cancer [5]. All of this is not simply the result of a circadian phase change toward nightly activity. Rather, the aberrant patterns, such as between work and social life or changing shifts, prevent a stable rhythm [6]. Biological processes that otherwise occur at the “right” internal time, such as immune reactions, DNA replication, and food processing, are then reduced or susceptible to harmful changes. The negative effects of shift work stated above are thought to be a direct effect of this affliction, called chronodisruption [6]. Minimizing chronodisruption is thus one major goal when creating a work environment for shift workers.
The internal biological clock, located in the hypothalamic suprachiasmatic nucleus (SCN), can adjust to changes in phase over time and, to some extent, to the period [7]. The main Zeitgeber (time giver) to the SCN is light [8], although physical activity, social cues, and, possibly, food intake also set the internal clock. Information about (day)light status reaches the SCN through the retinohypothalamic tract, with intrinsically photosensitive retinal ganglion cells (ipRGCs) serving as the main light receptor [9,10]. These photoreceptors contain the pigment melanopsin and have a peak wavelength sensitivity of about 480 nm at the retinal level or about 490 nm at the corneal level for a 32-year-old standard observer [11]. IpRGCs have a high sensitivity threshold compared to rods and cones [12], and ipRGCs in the inferior retinal half seem to be more sensitive compared to those in the superior half [13]. Light responses that originate in or are mediated by ipRGCs are called nonvisual or non-image-forming (NIF) effects of light. Relevant NIF effects for night shift work are the suppression of the sleep hormone melatonin [14] and acute alertness [15,16] through ipRGC stimulation, as are circadian phase shift [17] and circadian amplitude attenuation [18]. Managing these effects through artificial lighting by inducing a stable rhythm might go a long way toward reduced chronodisruption in shift workers.
At present, there are only tentative recommendations on what the “right” light for shift workers is [19,20], and there may never be a conclusive one due to the complexity of differing requirements. However, with (night) shift work as a major part of the job market [21], working toward “better” lighting is a necessity. It is also clear that any lighting design must strike a balance between visual requirements and the aforementioned NIF effects, as well as emotional aspects—a concept which the CIE termed as integrative lighting [22].
In 2018, we were tasked with the design and evaluation of an artificial lighting system for a shift workspace in an industrial production facility in Bavaria, Germany. The lighting design should incorporate the current knowledge of nonvisual effects in the context of (night) shift work and should be adaptable to other workspaces. The project was a collaboration initiated by the German statutory accident insurance institution for the administrative sector (VBG) with the Munich University of Applied Sciences (MUAS), the industry partner RHI Magnesita (RHIM), and the lighting design company 3lpi lichtplaner + beratende ingenieure (3lpi). Here, we present the realized solution for the lighting design and discuss our rationale in the design of the lighting fixtures and the automation strategy. We further discuss limitations and hurdles as part of the design and implementation process. Whether the light intervention has the desired effects on the shift workers is evaluated at the time of publication. The examined effects range from increased alertness during the day to better sleep quality and wellbeing.
Besides demonstrating one exemplary lighting design for shift work, we aim to achieve two things, both of which are also advantageous in other lighting applications besides industrial lighting and shift work. First, we aim to show that nonvisual lighting design is possible with standard tools and that the applied design leads to satisfactory visual and nonvisual properties in situ. Second, fixed light distributions commonly lead to tensions between the visual requirements and the possible range of nonvisual intensity at eye level, even when changing the light spectrum. We aim to demonstrate the considerable differences that are possible when using more than one light distribution as part of the lighting design.

2. Materials and Methods

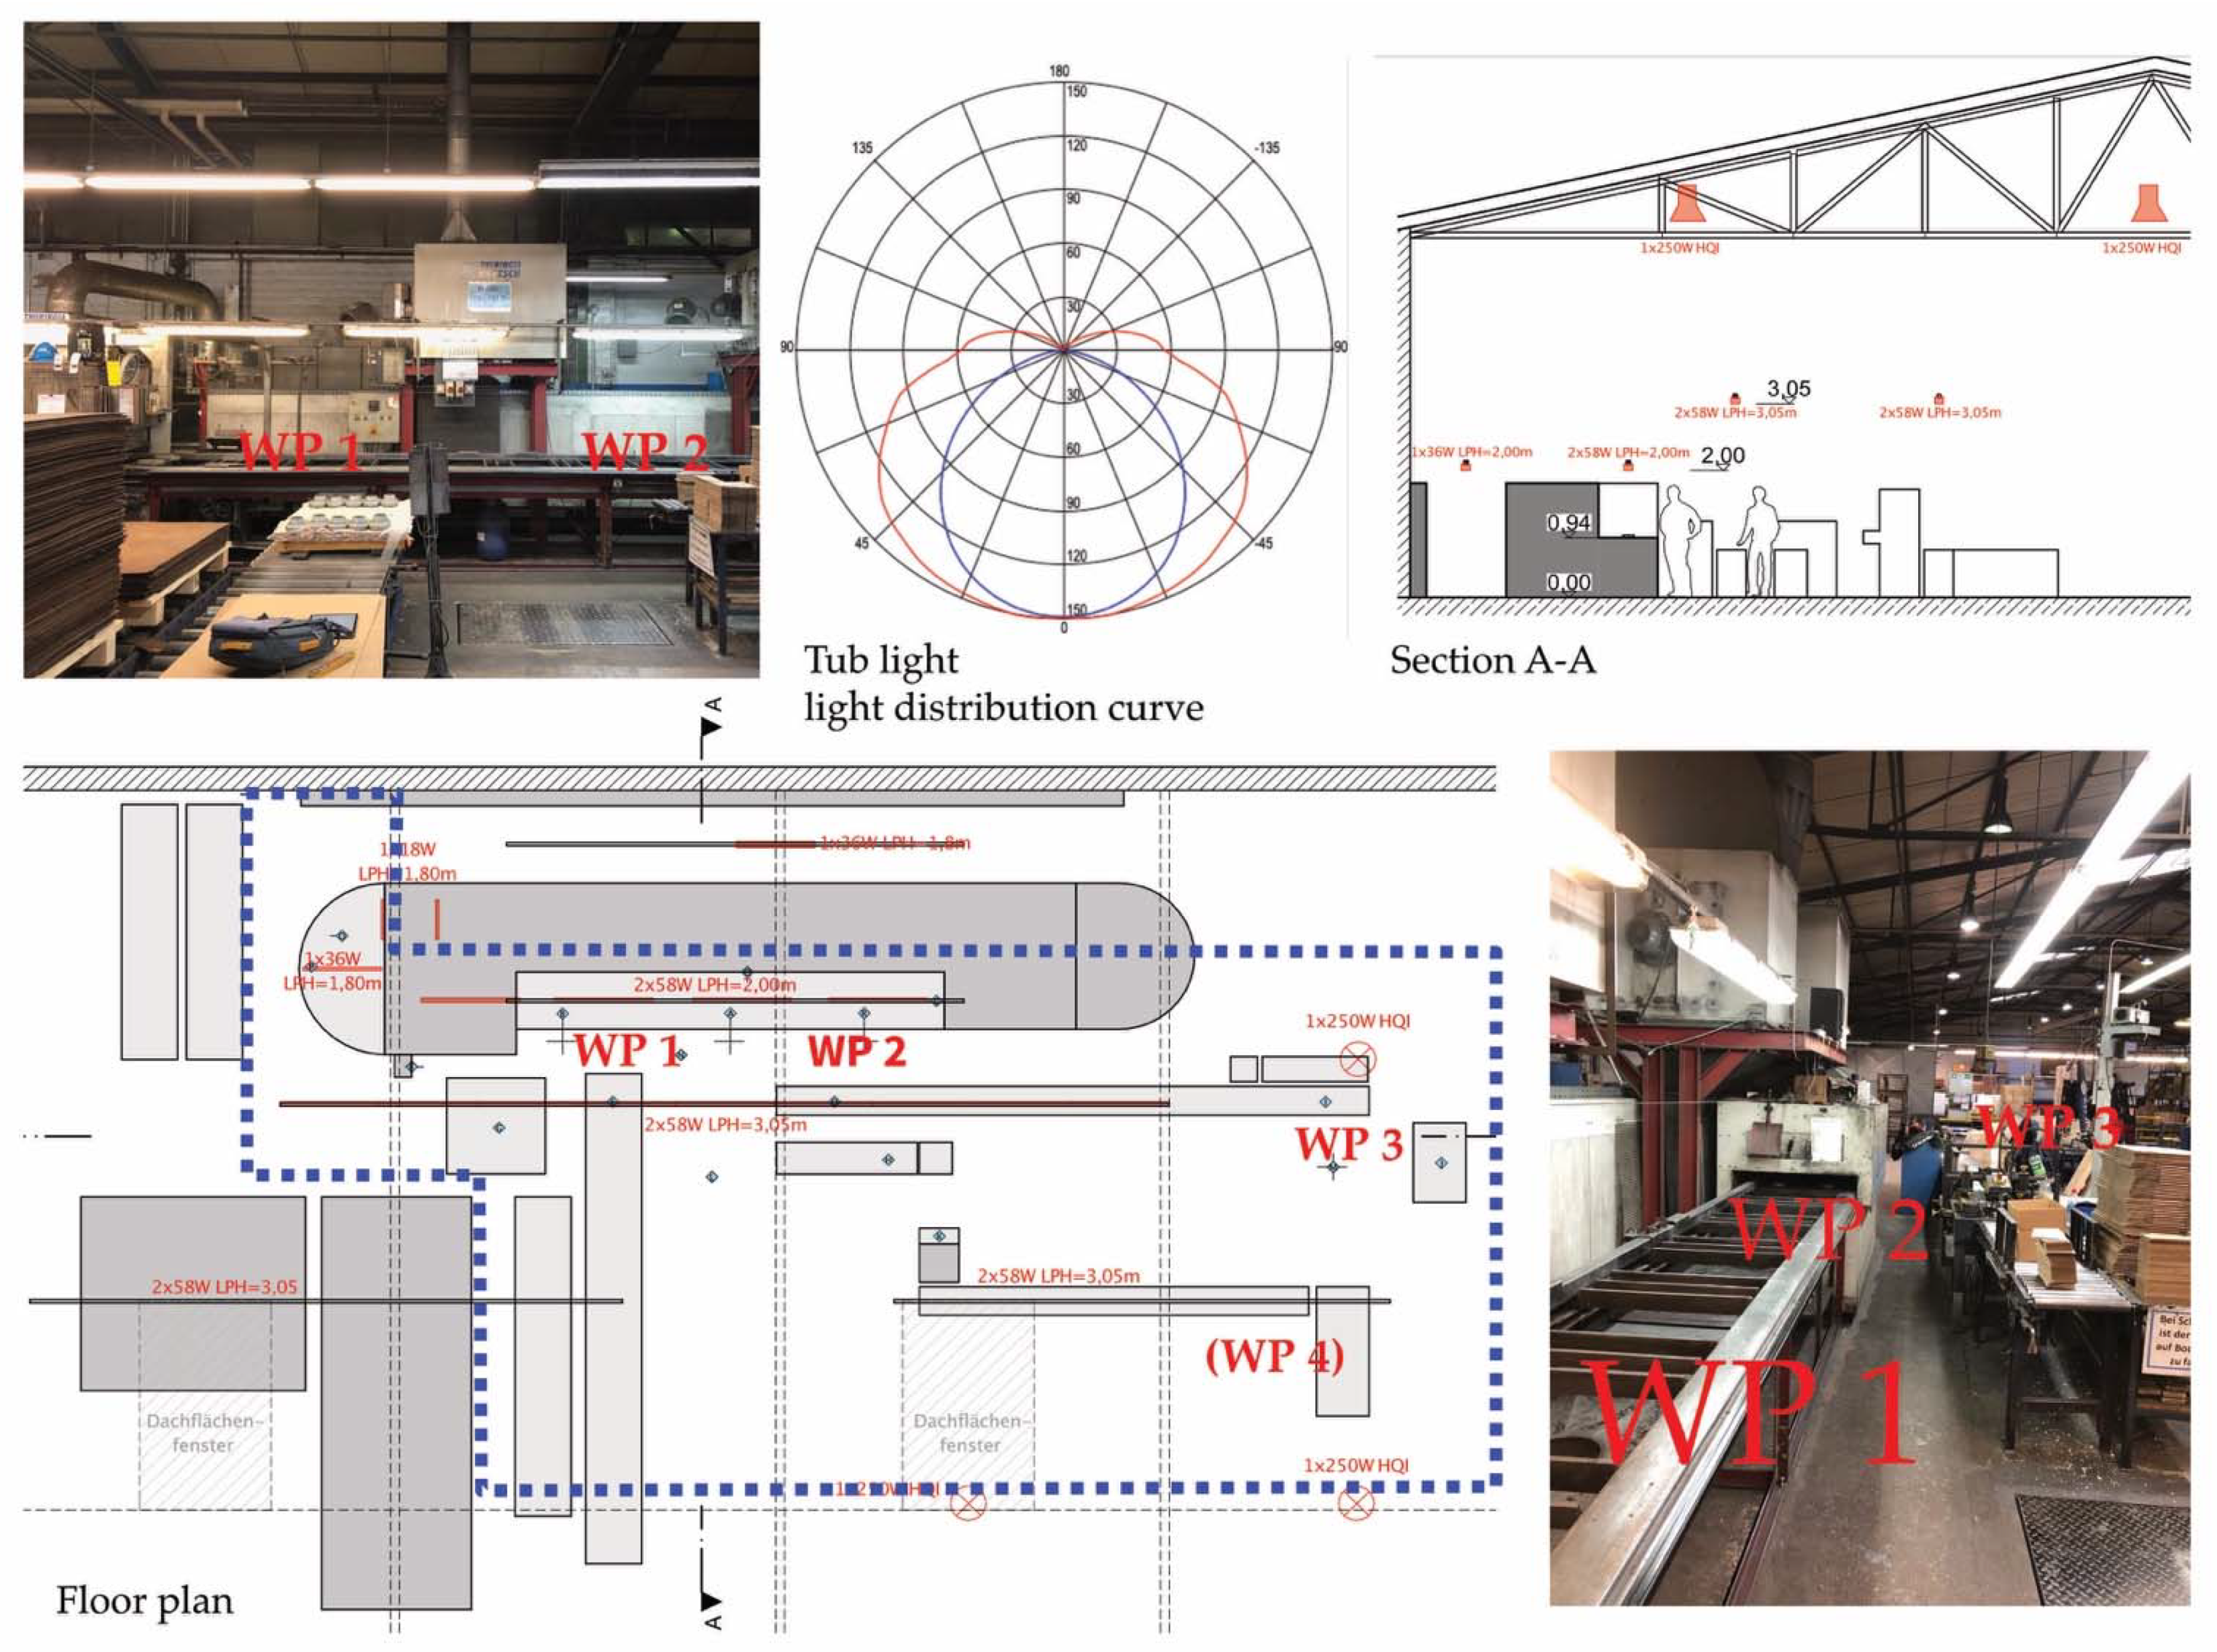
2.1. Project Description

The project was realized on site in an industrial production facility belonging to RHI Magnesita AG, located in Marktredwitz, Germany. The relevant workspace is an open area of about 130 m2, called the finish line, inside a large industrial hangar. The workspace’s floor plan, sections, and pictures are shown in Figure 1. Except for a small number of ventilation skylights, there is no daylight available at the workspace (see below for a more quantitative evaluation of daylight availability). The finish line is the last production step for high-temperature oven components before shipping. Workers set the products on a conveyor belt that takes the components through an automated sanding process. The products must then be visually checked for cracks, flaking, and other imperfections. After quality control, the components are packaged in crates for shipping in a different area of the same workspace.
The main workplace, where sanding and quality control take place, contains two workers and requires a minimum of about 750 lx mean illuminance on the visual task. In packaging, one worker usually suffices, but a second workplace is used at times with high throughput. Packaging requires 300 lx mean illuminance on the visual task, and the movement area in between workplaces requires 150 lx [23].
The stock lighting system mainly consisted of three rows of suspended tub lights with fluorescent lamps (4000 to 6500 Kelvin correlated color temperature (CCT)) at 2.0 and 3.05 m mounting height in the quality control workplaces and the rest of the area, respectively. Three HQI hall spotlights at the border of the relevant workspace contributed little to the overall lighting. The light distribution curve for the tub lights (see Figure 1) led to an even illumination across the whole workspace. Fine black particle dust from the sanding process requires considerable dust resistance from the luminaires, and they need to cope with rainwater coming from the skylights (IP64 rating required).
Workers are placed in one of four rapidly backward rotating shifts: morning shift (6 a.m. to 2 p.m.), evening shift (2 p.m. to 10 p.m.), night shift (10 p.m. to 6 a.m.), and off shift. As there are usually three people working at the finish line at a given time, a total of twelve workers are subject to its lighting environment. Workers from two shifts are present during a fifteen-minute time window at shift changes.

2.2. Task Definition

The project task was divided into three parts, the first two of which are relevant to this publication. First, the stock lighting situation was to be evaluated in terms of nonvisual and basic visual aspects. These were the vertical melanopic equivalent daylight (D65) illuminance (MEDI) at workers’ eye level and the horizontal illuminance value at their task level, respectively. Second, a new lighting design was required. The new lighting had to be visually viable and substantially improve the nonvisual aspects based on the evaluation of the stock lighting, current knowledge, and technology. If possible, the new lighting should use standard luminaires to increase the multiplicative opportunities of the lighting design to other workspaces and industrial fields. Third, the effect of the new lighting design compared to the stock lighting on the workers had to be evaluated. The last part is underway at the time of publication.

2.3. Software and Measurement Equipment

Measurements of spectral irradiance were taken with a JETI Specbos 1201 spectroradiometer (JETI Technische Instrumente GmbH, Jena, Germany) and analyzed through JETI LiVal V6.14.2 software on a connected personal computer. Spectral calculations were performed by the software, i.e., for CCT, color rendering index (CRI), photopic illuminance, and MEDI [24]. If not stated otherwise, MEDI values refer to a standard measurement with an unobstructed sensor (180°). MEDI values denoted as with FOV in the Results Section stem from measurements with a field-of-view obstruction according to the standard CIE S 026 [24]. Luminance distribution measurements were taken with an LMK mobile air (Canon 70D camera with a 180° fisheye lens, calibrated by TechnoTeam Bildverarbeitung GmbH, Ilmenau, Germany). Pictures were analyzed with LMK LabSoft software. Figures containing spectral measurements or derived parameters were produced with R V4.1.0 software [25]. Lighting simulations were performed with RELUX V2019.1.1.0 software (Relux Informatik AG, Muenchenstein, Switzerland). Numeric results were analyzed with Microsoft Office Excel 2019 software.

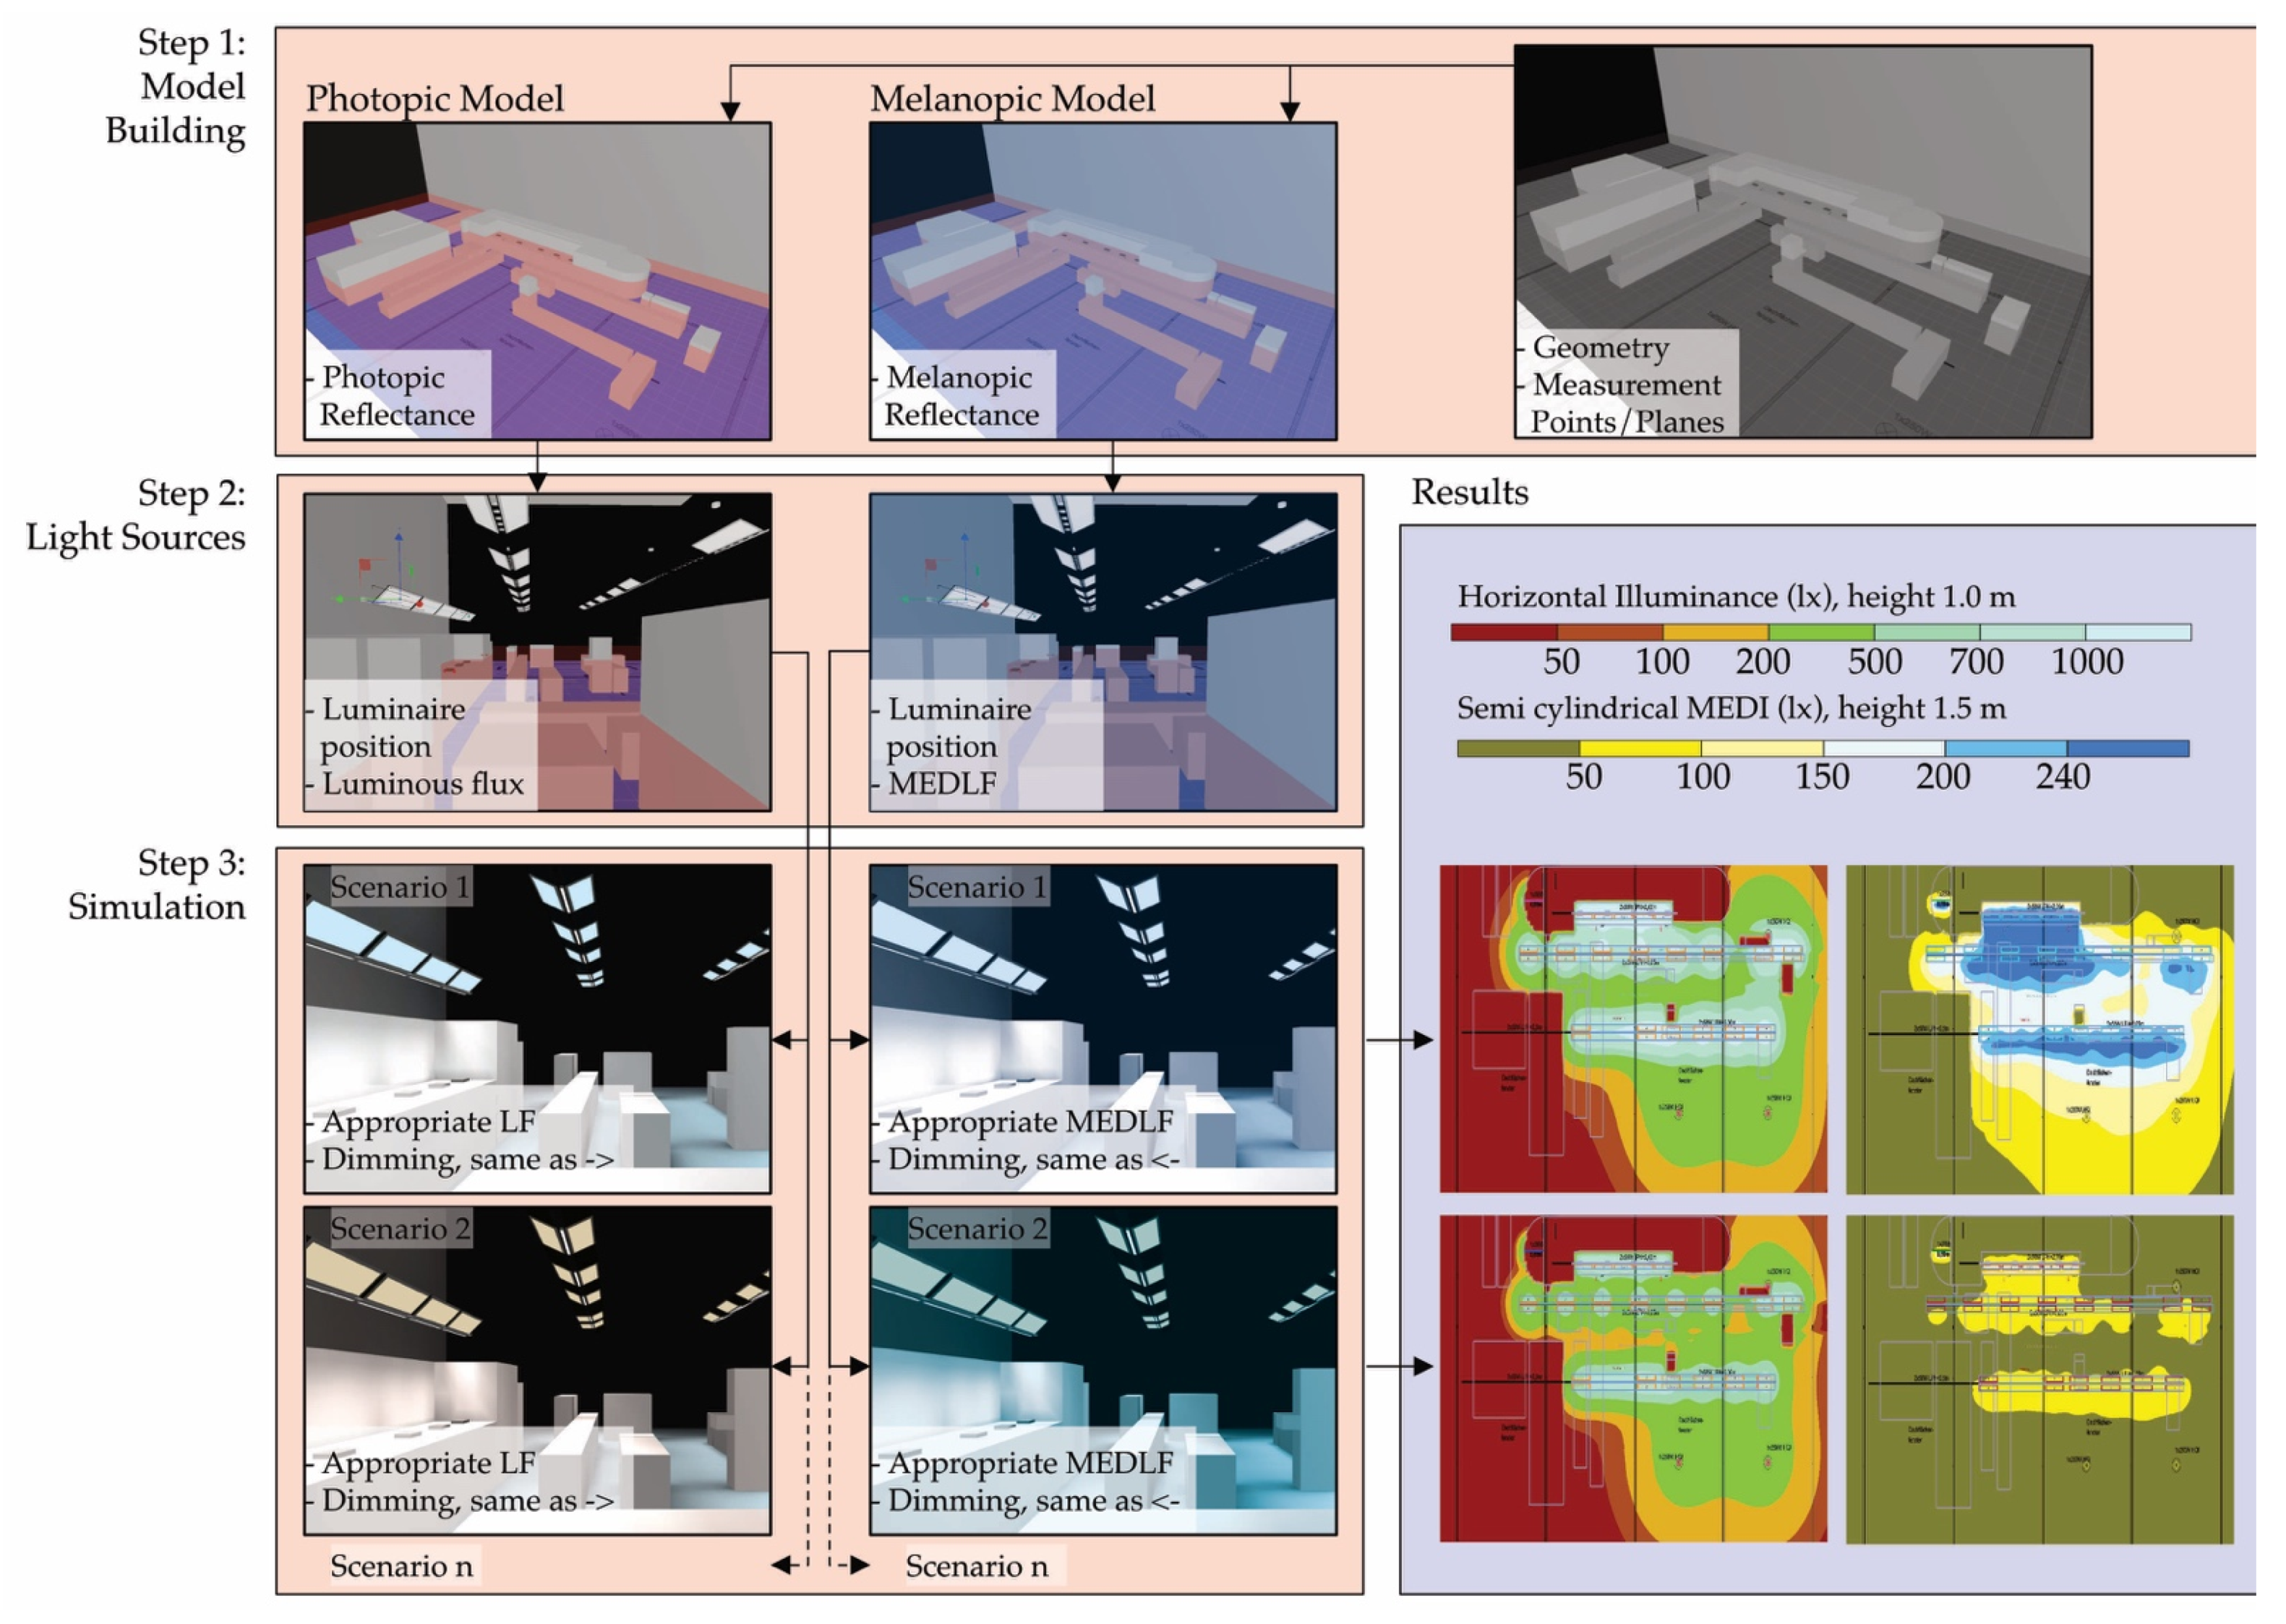
2.4. Nonvisual Lighting Simulation

Nonvisual lighting simulations were performed with a standard and free-of-charge lighting design tool. The specific software we used (see above) is irrelevant for this process, as it can be adapted to any lighting simulation tool. There are benefits and limitations to this approach, which we discuss below in the Discussion Section. The steps are described in detail and visualized in Appendix A. The method has already been used with success several times in other projects (e.g., [26,27]).
We used surface reflectance values of 0.2 for the floor, 0.3 for the walls, 0.4 for the machinery, and 0.5 for the ceiling. In our case, the relevant surface materials were melanopically neutral; i.e., reflectance values were the same in the melanopic model as in the photopic model. The maintenance factor was set at 0.8. The transmittance of the skylight was set at 0.51, and the melanopic action factor of daylight was set at 0.907. For artificial lighting, simulation settings were set to Artificial light (Radiosity) with high indirect lighting (highest accuracy). For daylighting, simulation settings were set to Raytracing, illumination: Daylighting, sky: CIE overcast sky at 21 March 12:16 true local time. Raytracing parameters were set for interreflections (five), spatial resolution (0.2 m), and initial rays (5000).

3. Results

This section first describes the measurement and simulation results from the stock lighting scenario, as these results inform the new lighting design. The section continues with a description of the luminaire Drosa, which was designed for this project. Next, simulation results for the viable range of visual and melanopic parameters are presented. Finally, the automation strategy is described alongside spectral measurements and luminance distribution after implementation.

3.1. Stock Lighting Evaluation

3.1.1. Measurements

Table 1 shows the illuminance measurements under stock lighting without the influence of daylight. Workplace positions correspond to Figure 1.

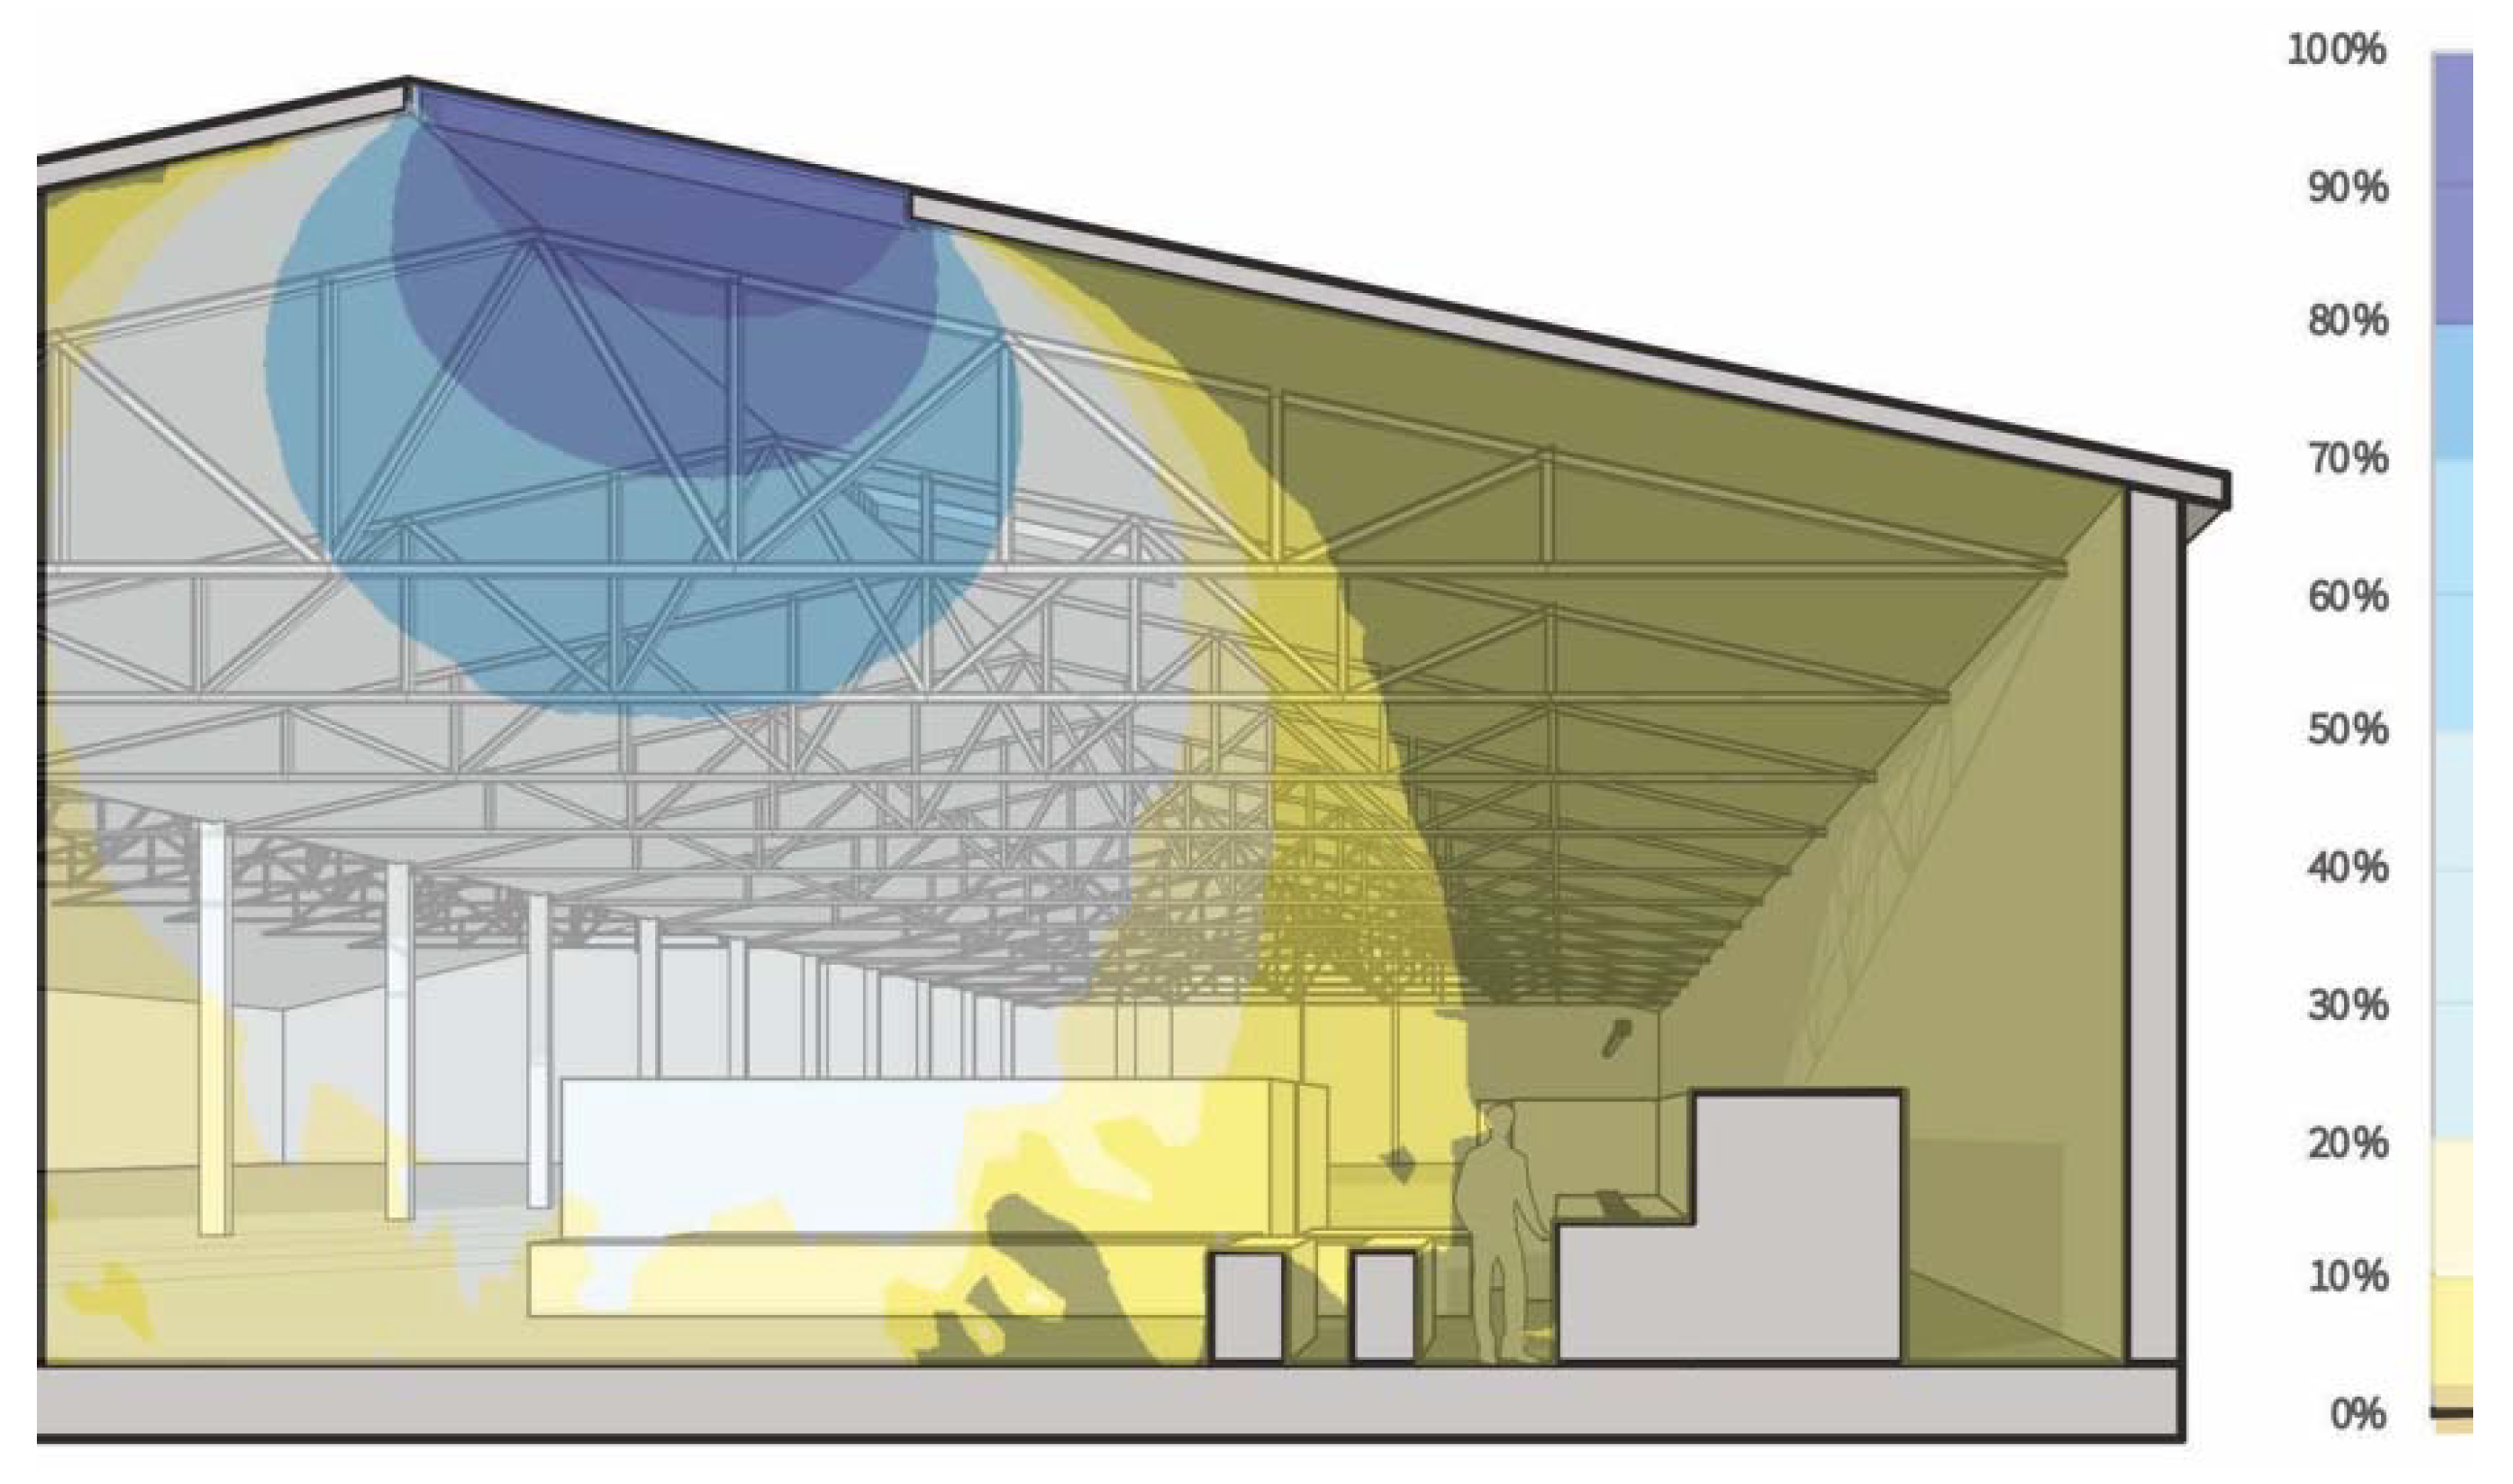
3.1.2. Daylight Simulation

Figure 2 shows the simulation results for a vertical cut through the quality control workplace and the skylight. The false-color scale shows the daylight autonomy (see Appendix A) in percent for a 240 lx threshold during a time window of 8–11 a.m. The relevant point is at the eye level of the workplace, marked by the silhouetted figure, where there is about 1% daylight autonomy.

3.1.3. Evaluation Result

The visual lighting requirements were mostly met by the stock lighting system, as can be seen in Table 1. The comparatively high illuminance requirements in workplaces 1 and 2 led to quite high MEDI values at eye level. Both statements are the opposite at workplace 3 (and 4). In all cases, MEDI values are acceptable at some, albeit different, times of the 24 h day, but not others. This has the potential to further chronodisruption, as every time window brings the same melanopic stimulus. The static nature of the lighting had to change based on the time of day under a new circadian lighting regime. As melanopic stimuli, we set 240 lx MEDI or above during the morning hours and below 100 lx MEDI during the night. See further below, in the Discussion Section, for our rationale of these thresholds.

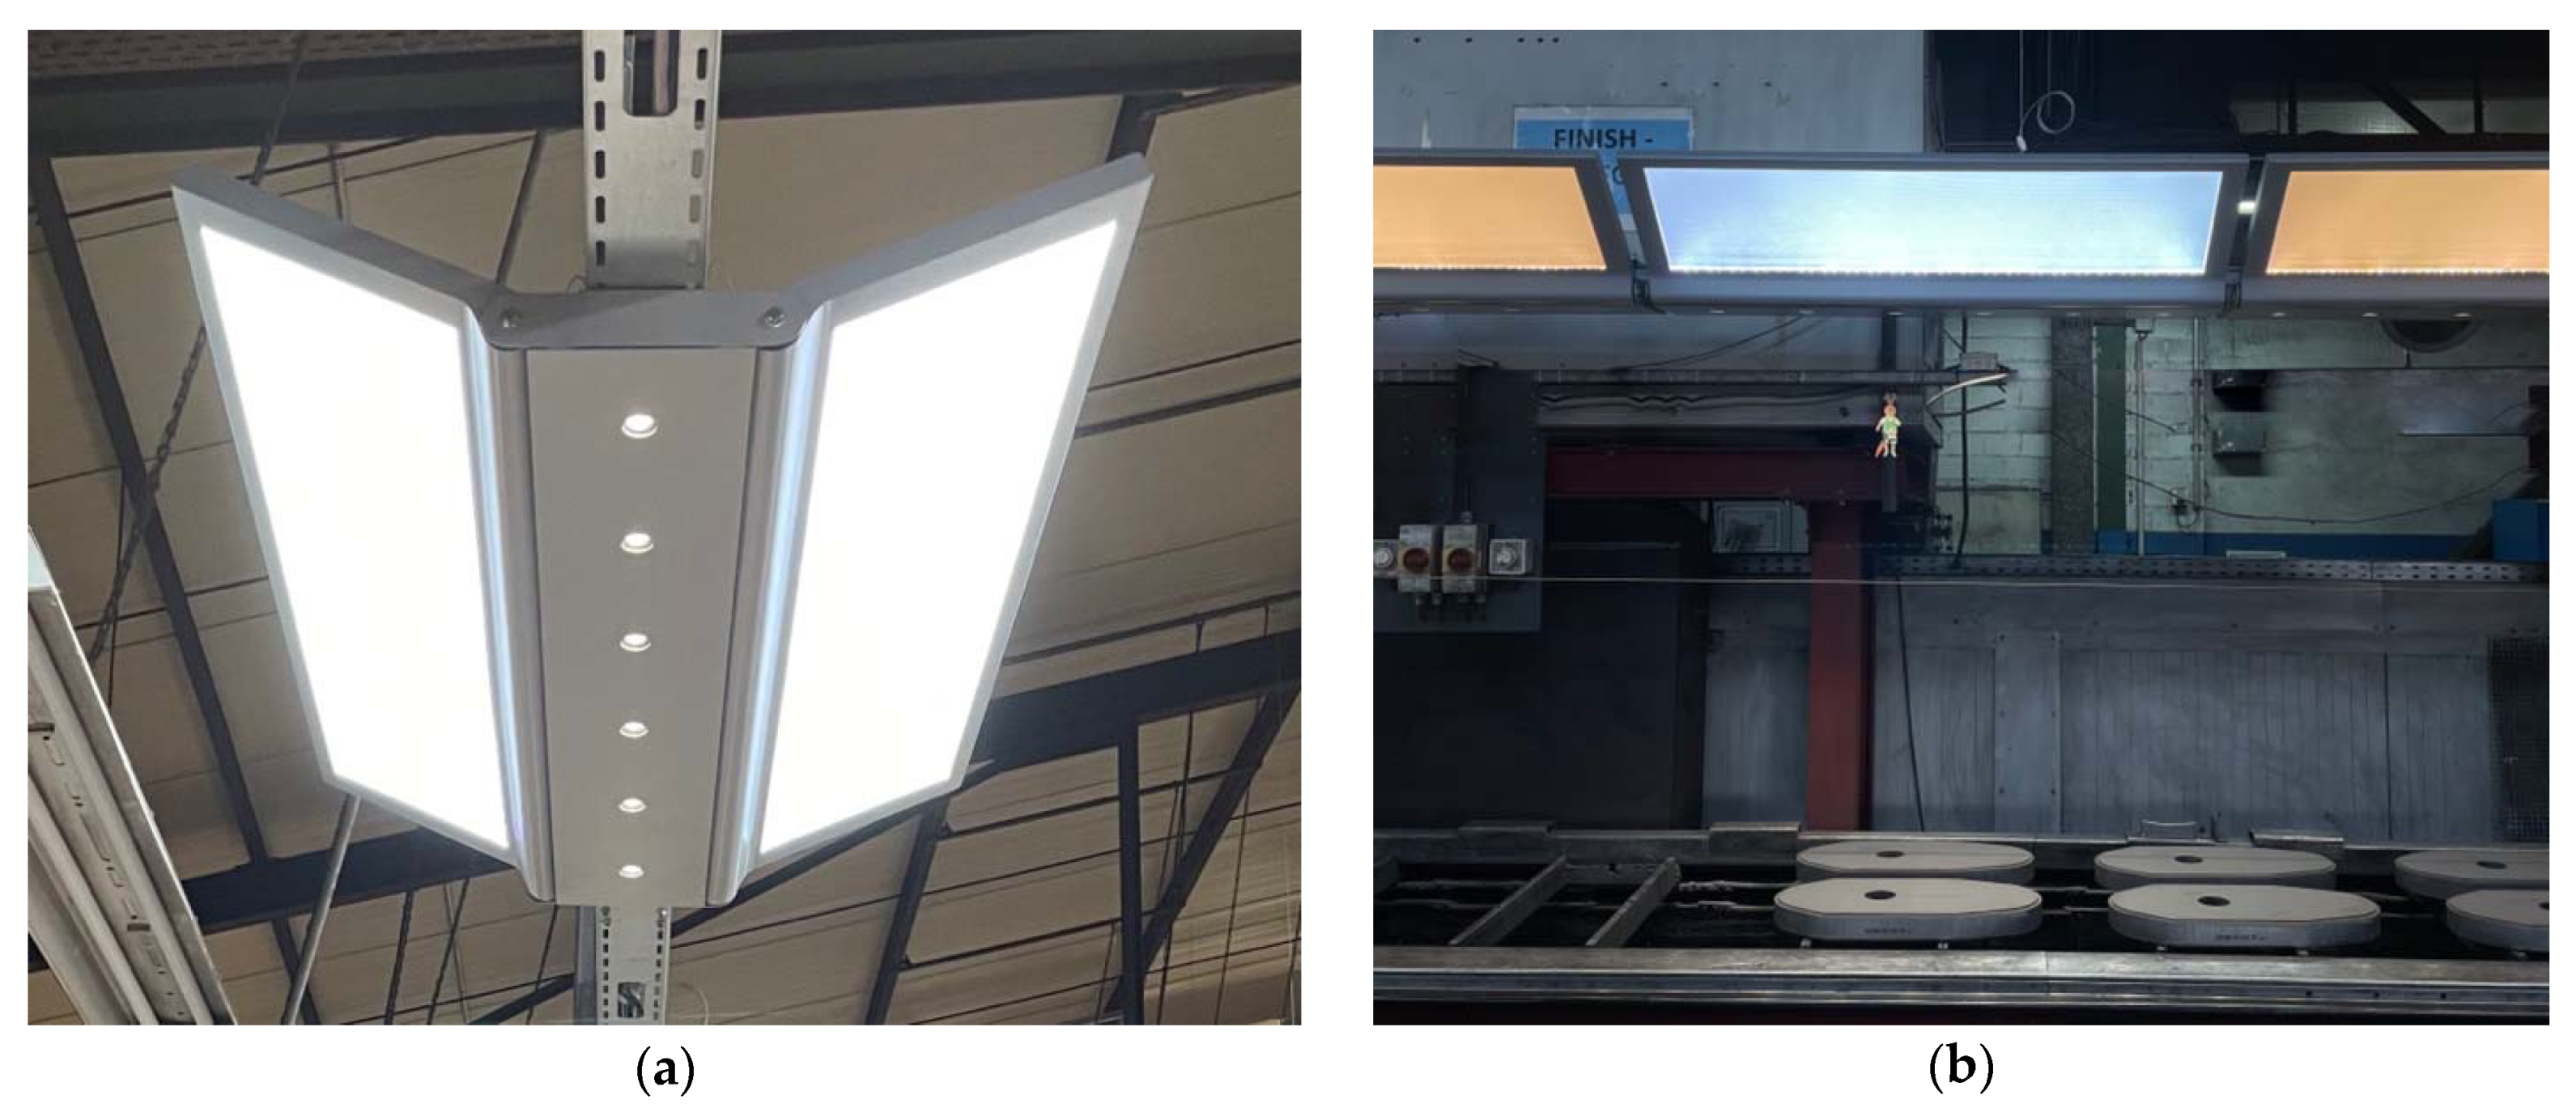
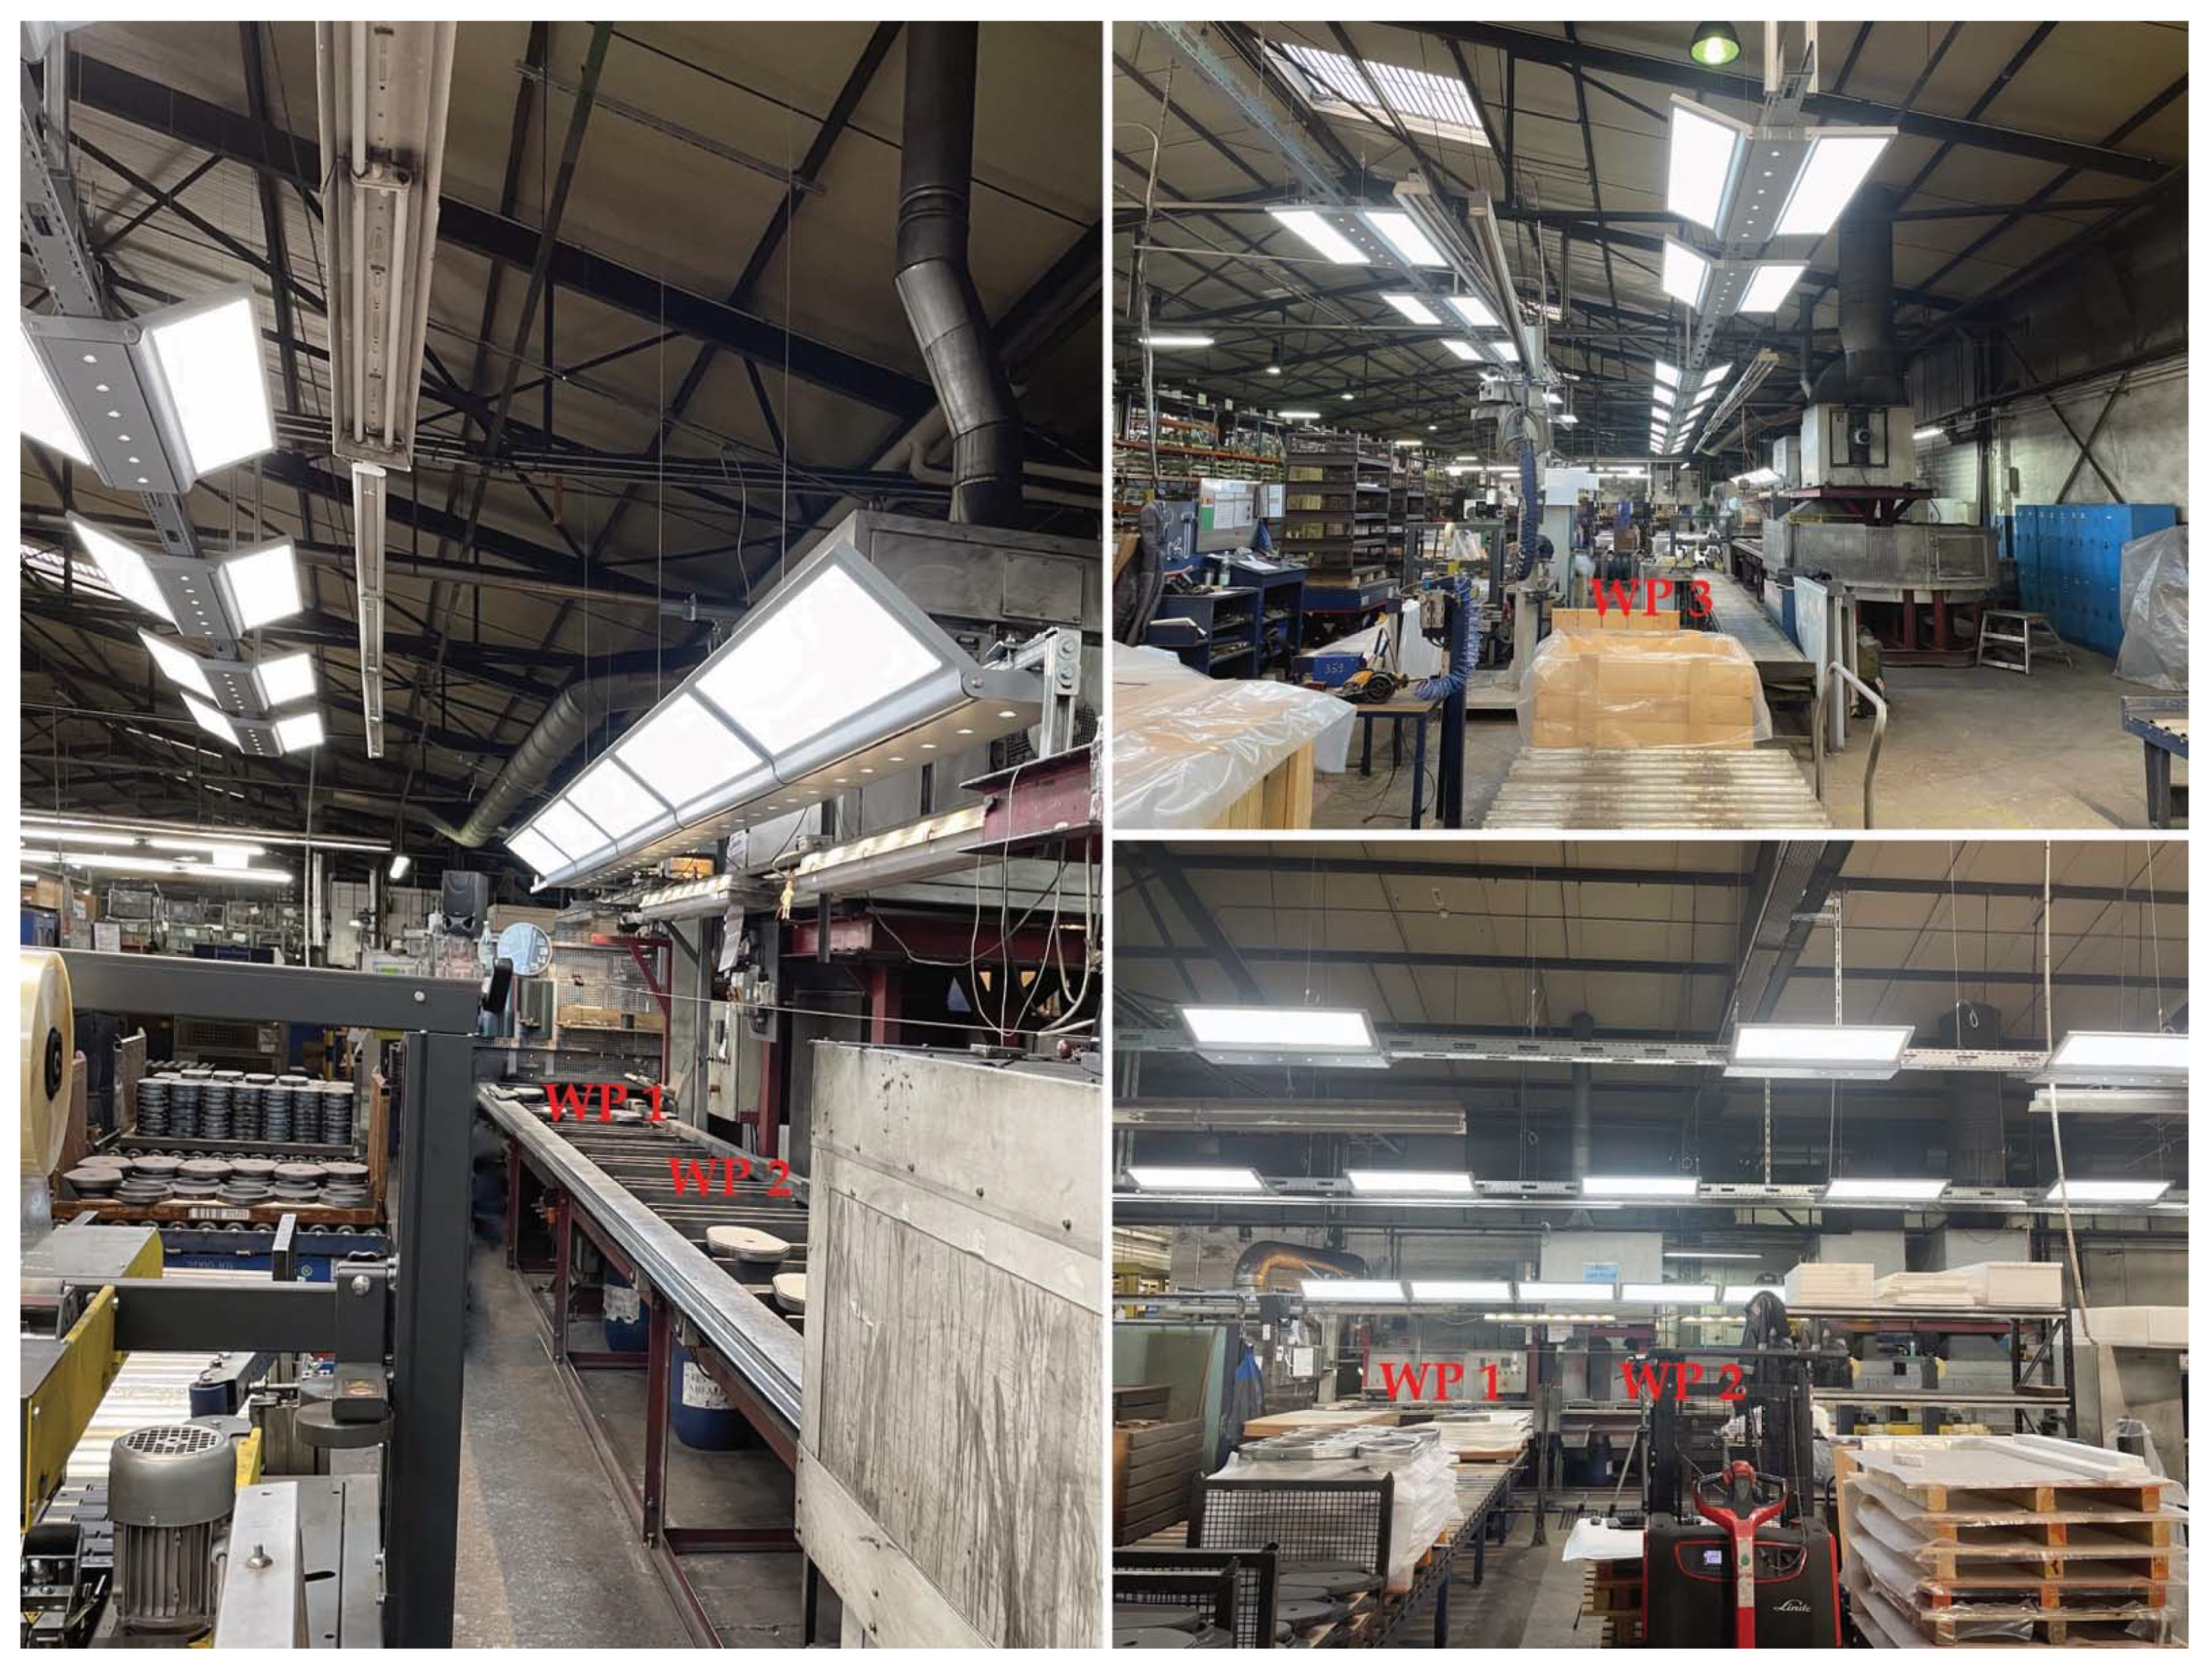
3.2. Luminaire Drosa
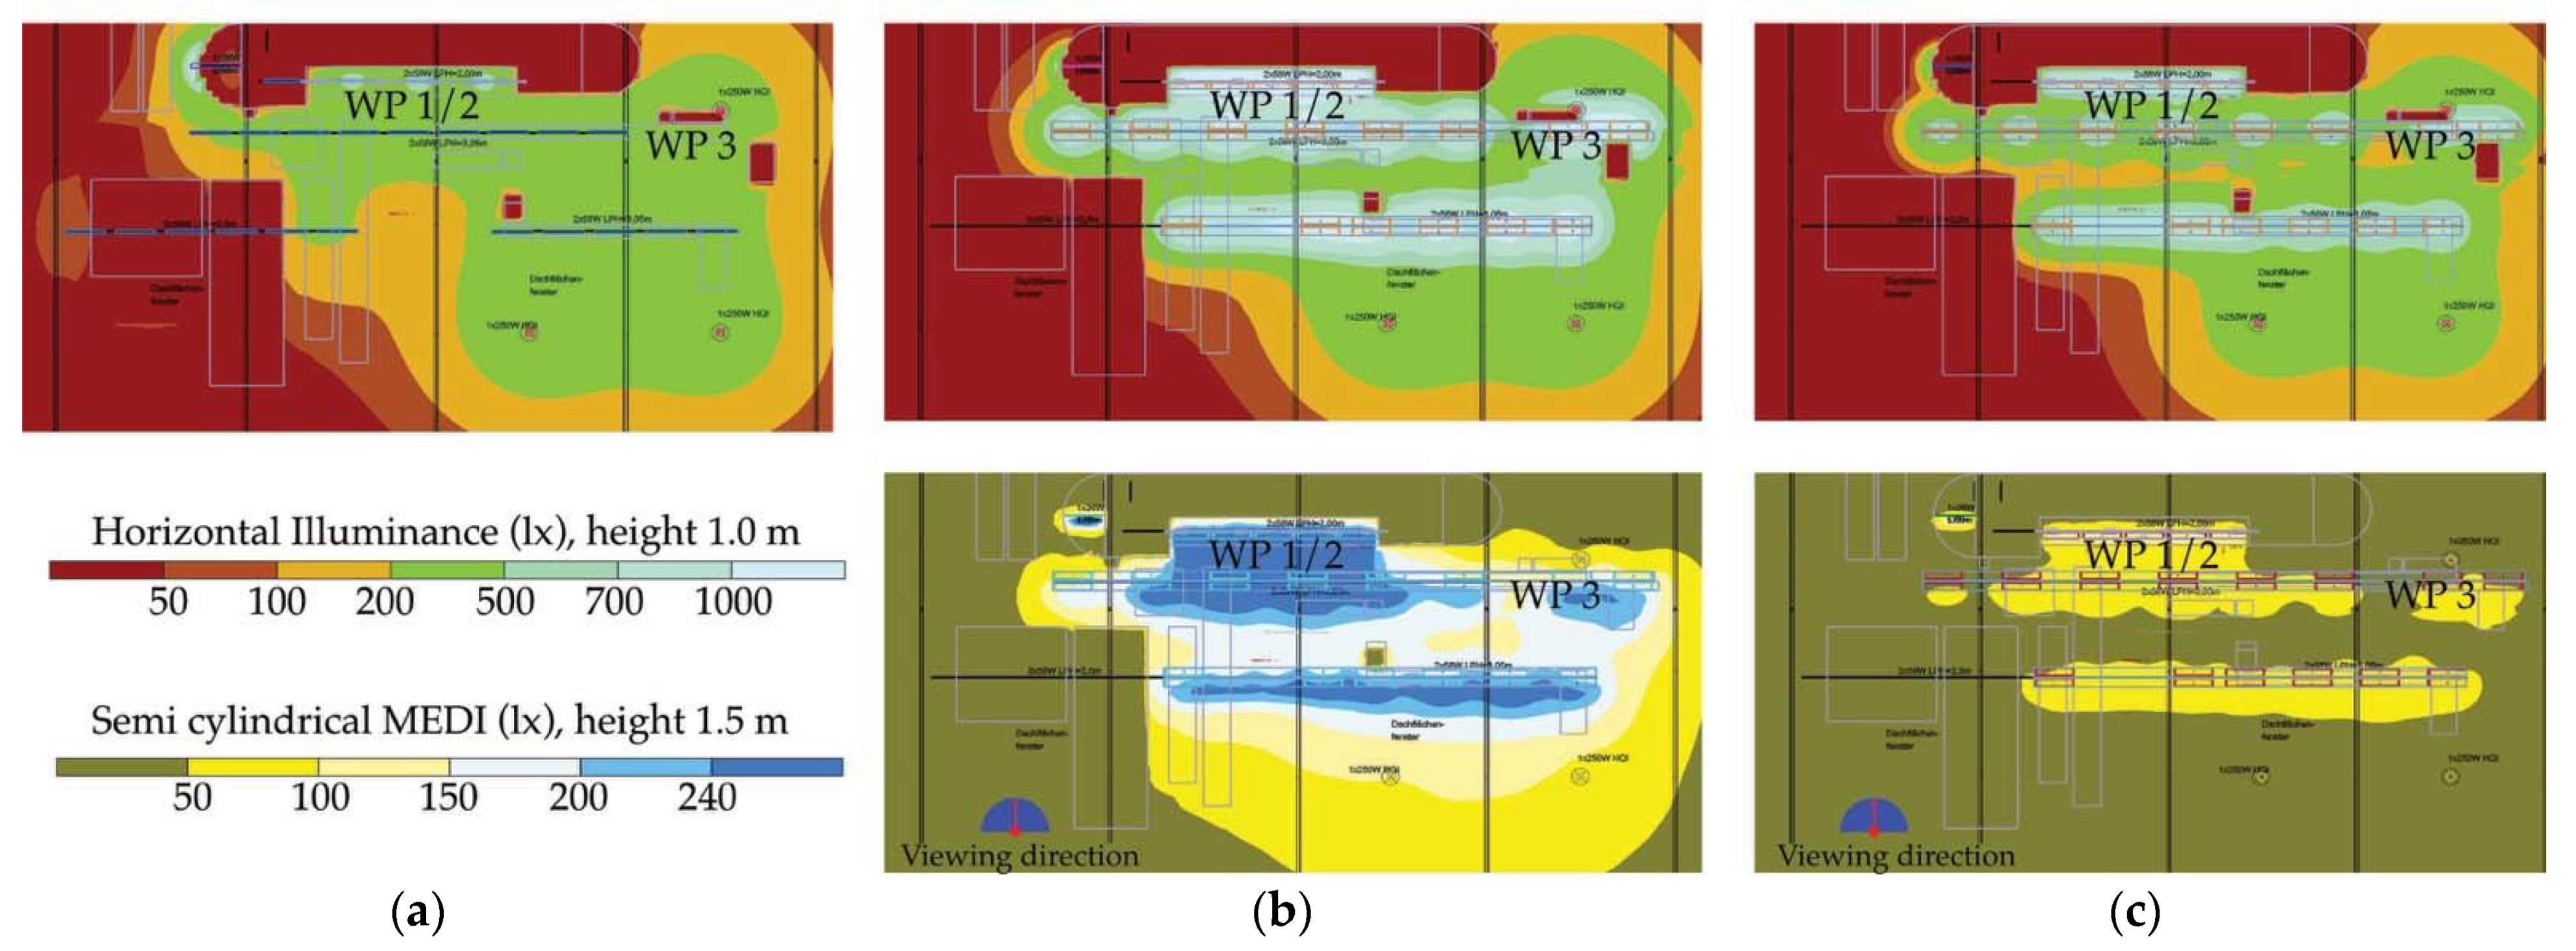
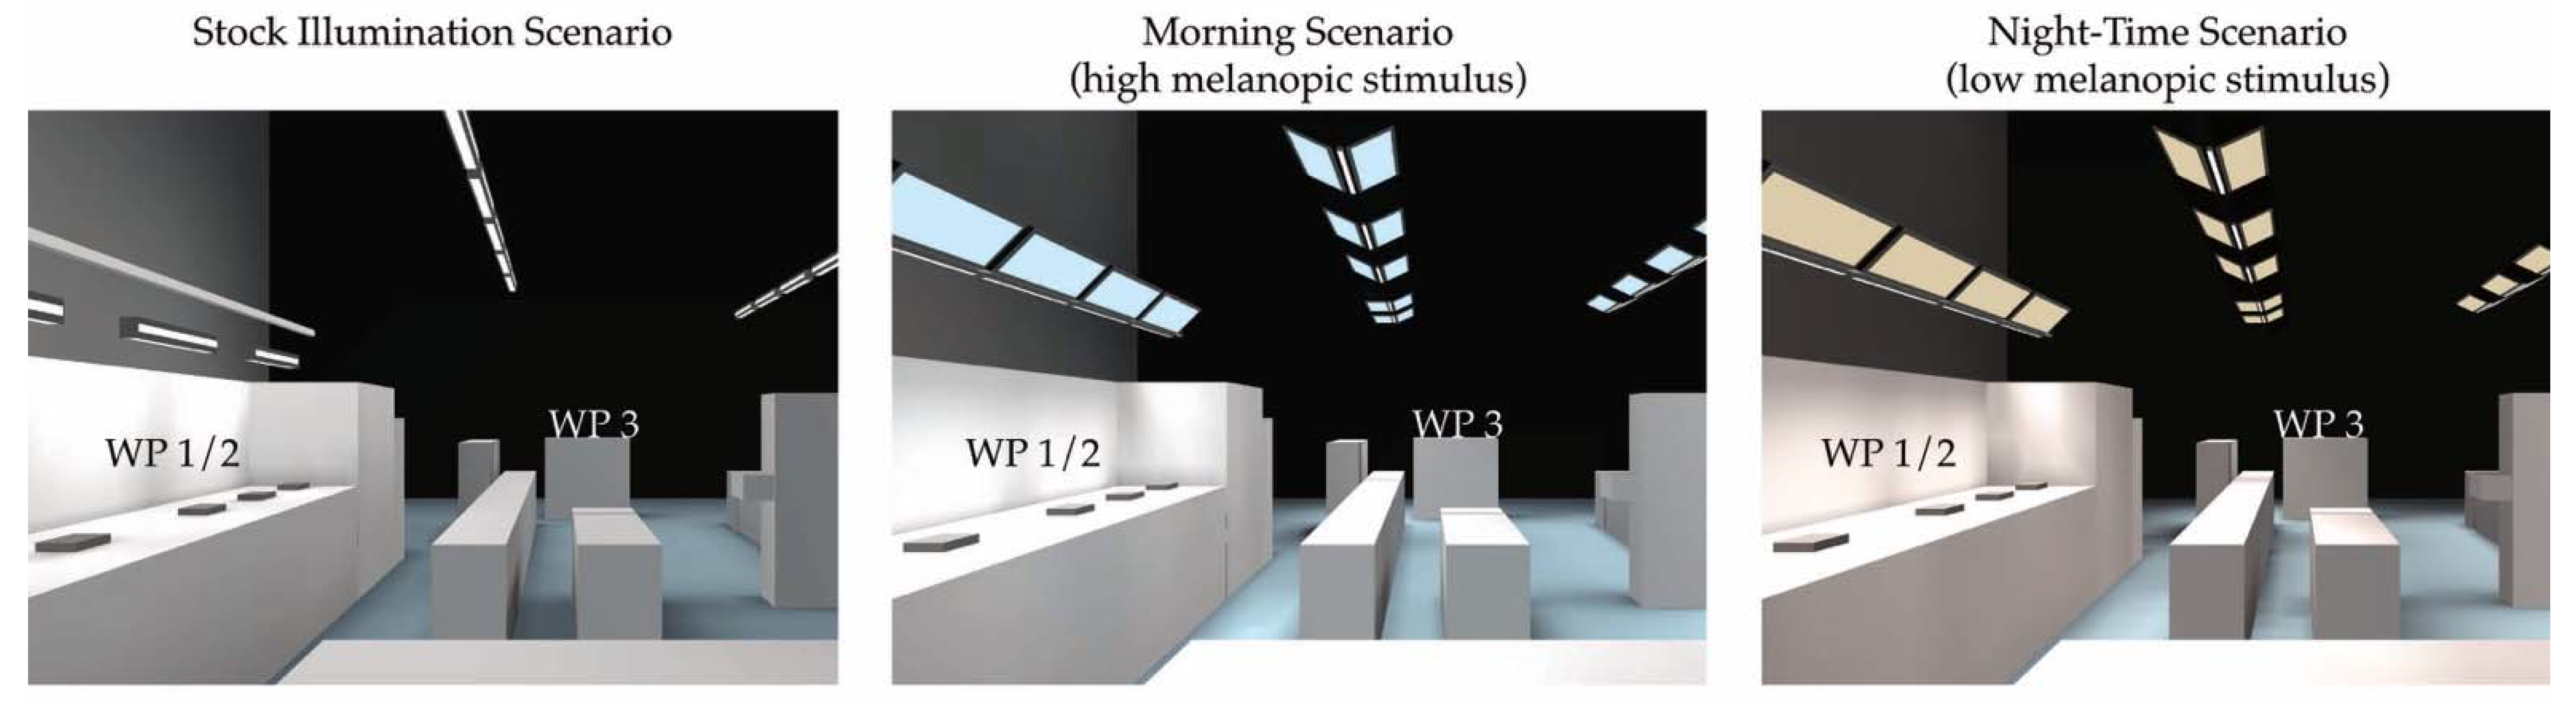
A new lighting system was particularly challenging for the quality control workplaces, as it was not an option to simply reduce the lighting during the night, which would negatively impact the visual aspects of the task. Lighting tools that can be adjusted in their light spectrum are available in a limited variety for industrial application. This seems to offer an off-the-shelf solution to the circadian requirement, in tandem with an appropriate automation system that determines when, how, and for how long the spectrum changes. We did not choose this solution. Firstly, adjusting the light spectrum is only one of four general ways to affect the NIF system through the light source besides adjusting irradiance, solid angle, and incidence angle [28,29]. By limiting the solution to one aspect (or two, if dimming is included), the circadian effect would likely be substantially smaller than possible. Secondly, adjusting the spectrum in a meaningful way might directly and negatively influence the quality control task if certain aspects are less visible under extreme CCTs. Thirdly, the term “appropriate automation” contains a whole range of requirements for flexibility and stability that, in our experience, are often missing in standard systems. We, therefore, decided to design a new lighting system, integrating the demanding requirements for the changing light parameters as mentioned above. The luminaire Drosa is named after Drosophila Melanogaster and the related circadian rhythm research.
Drosa consists of two components (shown in Figure 3a). The base (direct component) is a linear body of 1.2 m length that can be attached to a standard (suspended) cable tray and contains six glare-free downlights with a CCT of 4000 K, a CRI greater than 90, and a luminous flux of 3000 lumen. Attached to the base are one or two wings (area component) of 1.2 by 0.35 m size that can be adjusted in their angle to the base between 0 (horizontal) and 90 (vertical) degrees. Every wing contains a 1.1 by 0.25 m area light that can be adjusted in the light spectrum between 1800 and 8000 K (shown in Figure 3b) and has a CRI greater than 90 and a luminous flux of about 3200 lumen. The direct component is used to efficiently illuminate the task without any glare and with little contribution to vertical MEDI. The area component is supposed to primarily set the vertical MEDI but also provide uniformity to the workspace illumination. The base contains the drivers, including a chip for automation, which keeps the time for more than 24 h in case of a power loss. The automation logic (see below) was programmed in Node-RED software. The manufacturing and programming of the luminaires were carried out by a third party (LMT GmbH, Hilpoltstein, Germany) according to our specifications.

3.3. Simulation

We deduced the specifications of the Drosa luminaire from the nonvisual lighting simulation. The number of luminaires stayed identical between the stock situation and the new lighting (21 luminaires). Although distribution changed a little, the lights were still arranged along three lines above the workspace, at the same height as before. The wings were adjusted for a maximum viewing angle from the point of view of workers. Figure 4 shows the simulation results for the photopic and melanopic models, each for a morning and a night-time scenario. Compared to the stock lighting simulation and one another, the new simulation shows little differences on the photopic side, although the peak illuminance values are increased, and the lighting is more accentuated than before, especially in the night-time scenario. However, the melanopic model results reveal a stark contrast between the morning and the night-time scenarios. In the morning scenario, vertical MEDI values at eye level in the primary viewing direction (up in Figure 4) consistently reach the set threshold of 240 lx at the workplaces. In the night-time scenario, the simulation shows values between 50 and 100 lx MEDI in the same spots.

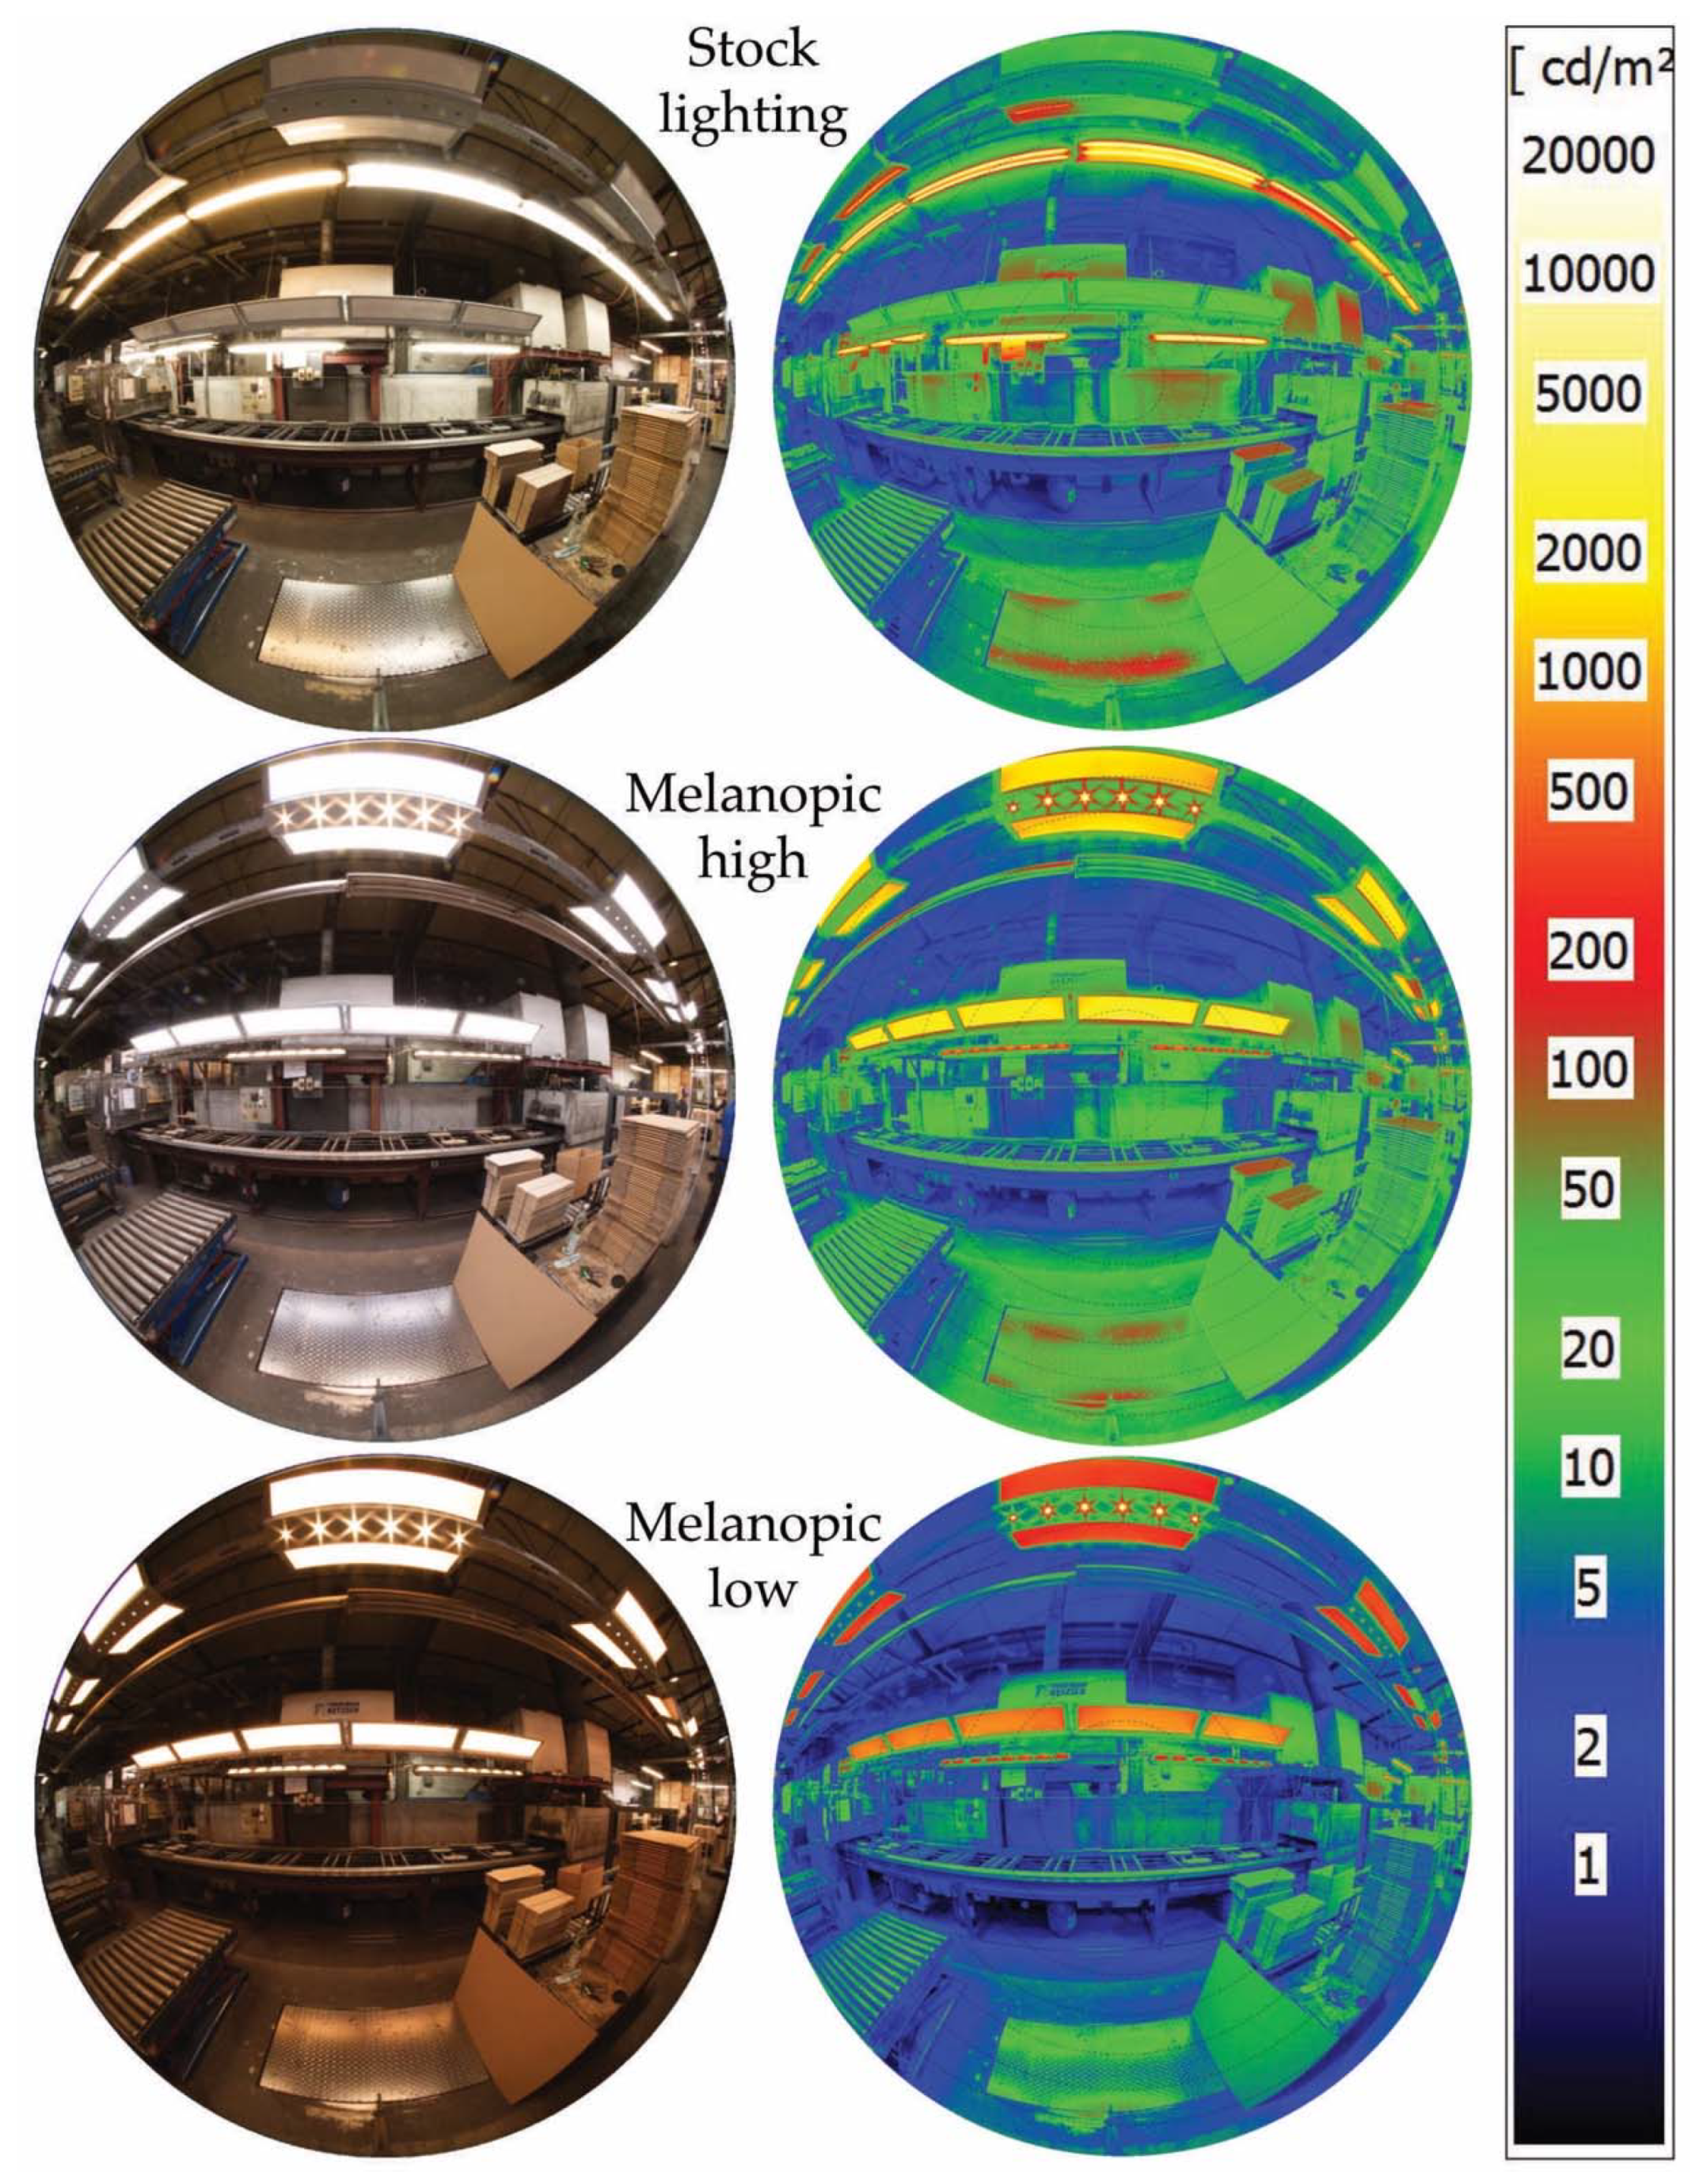
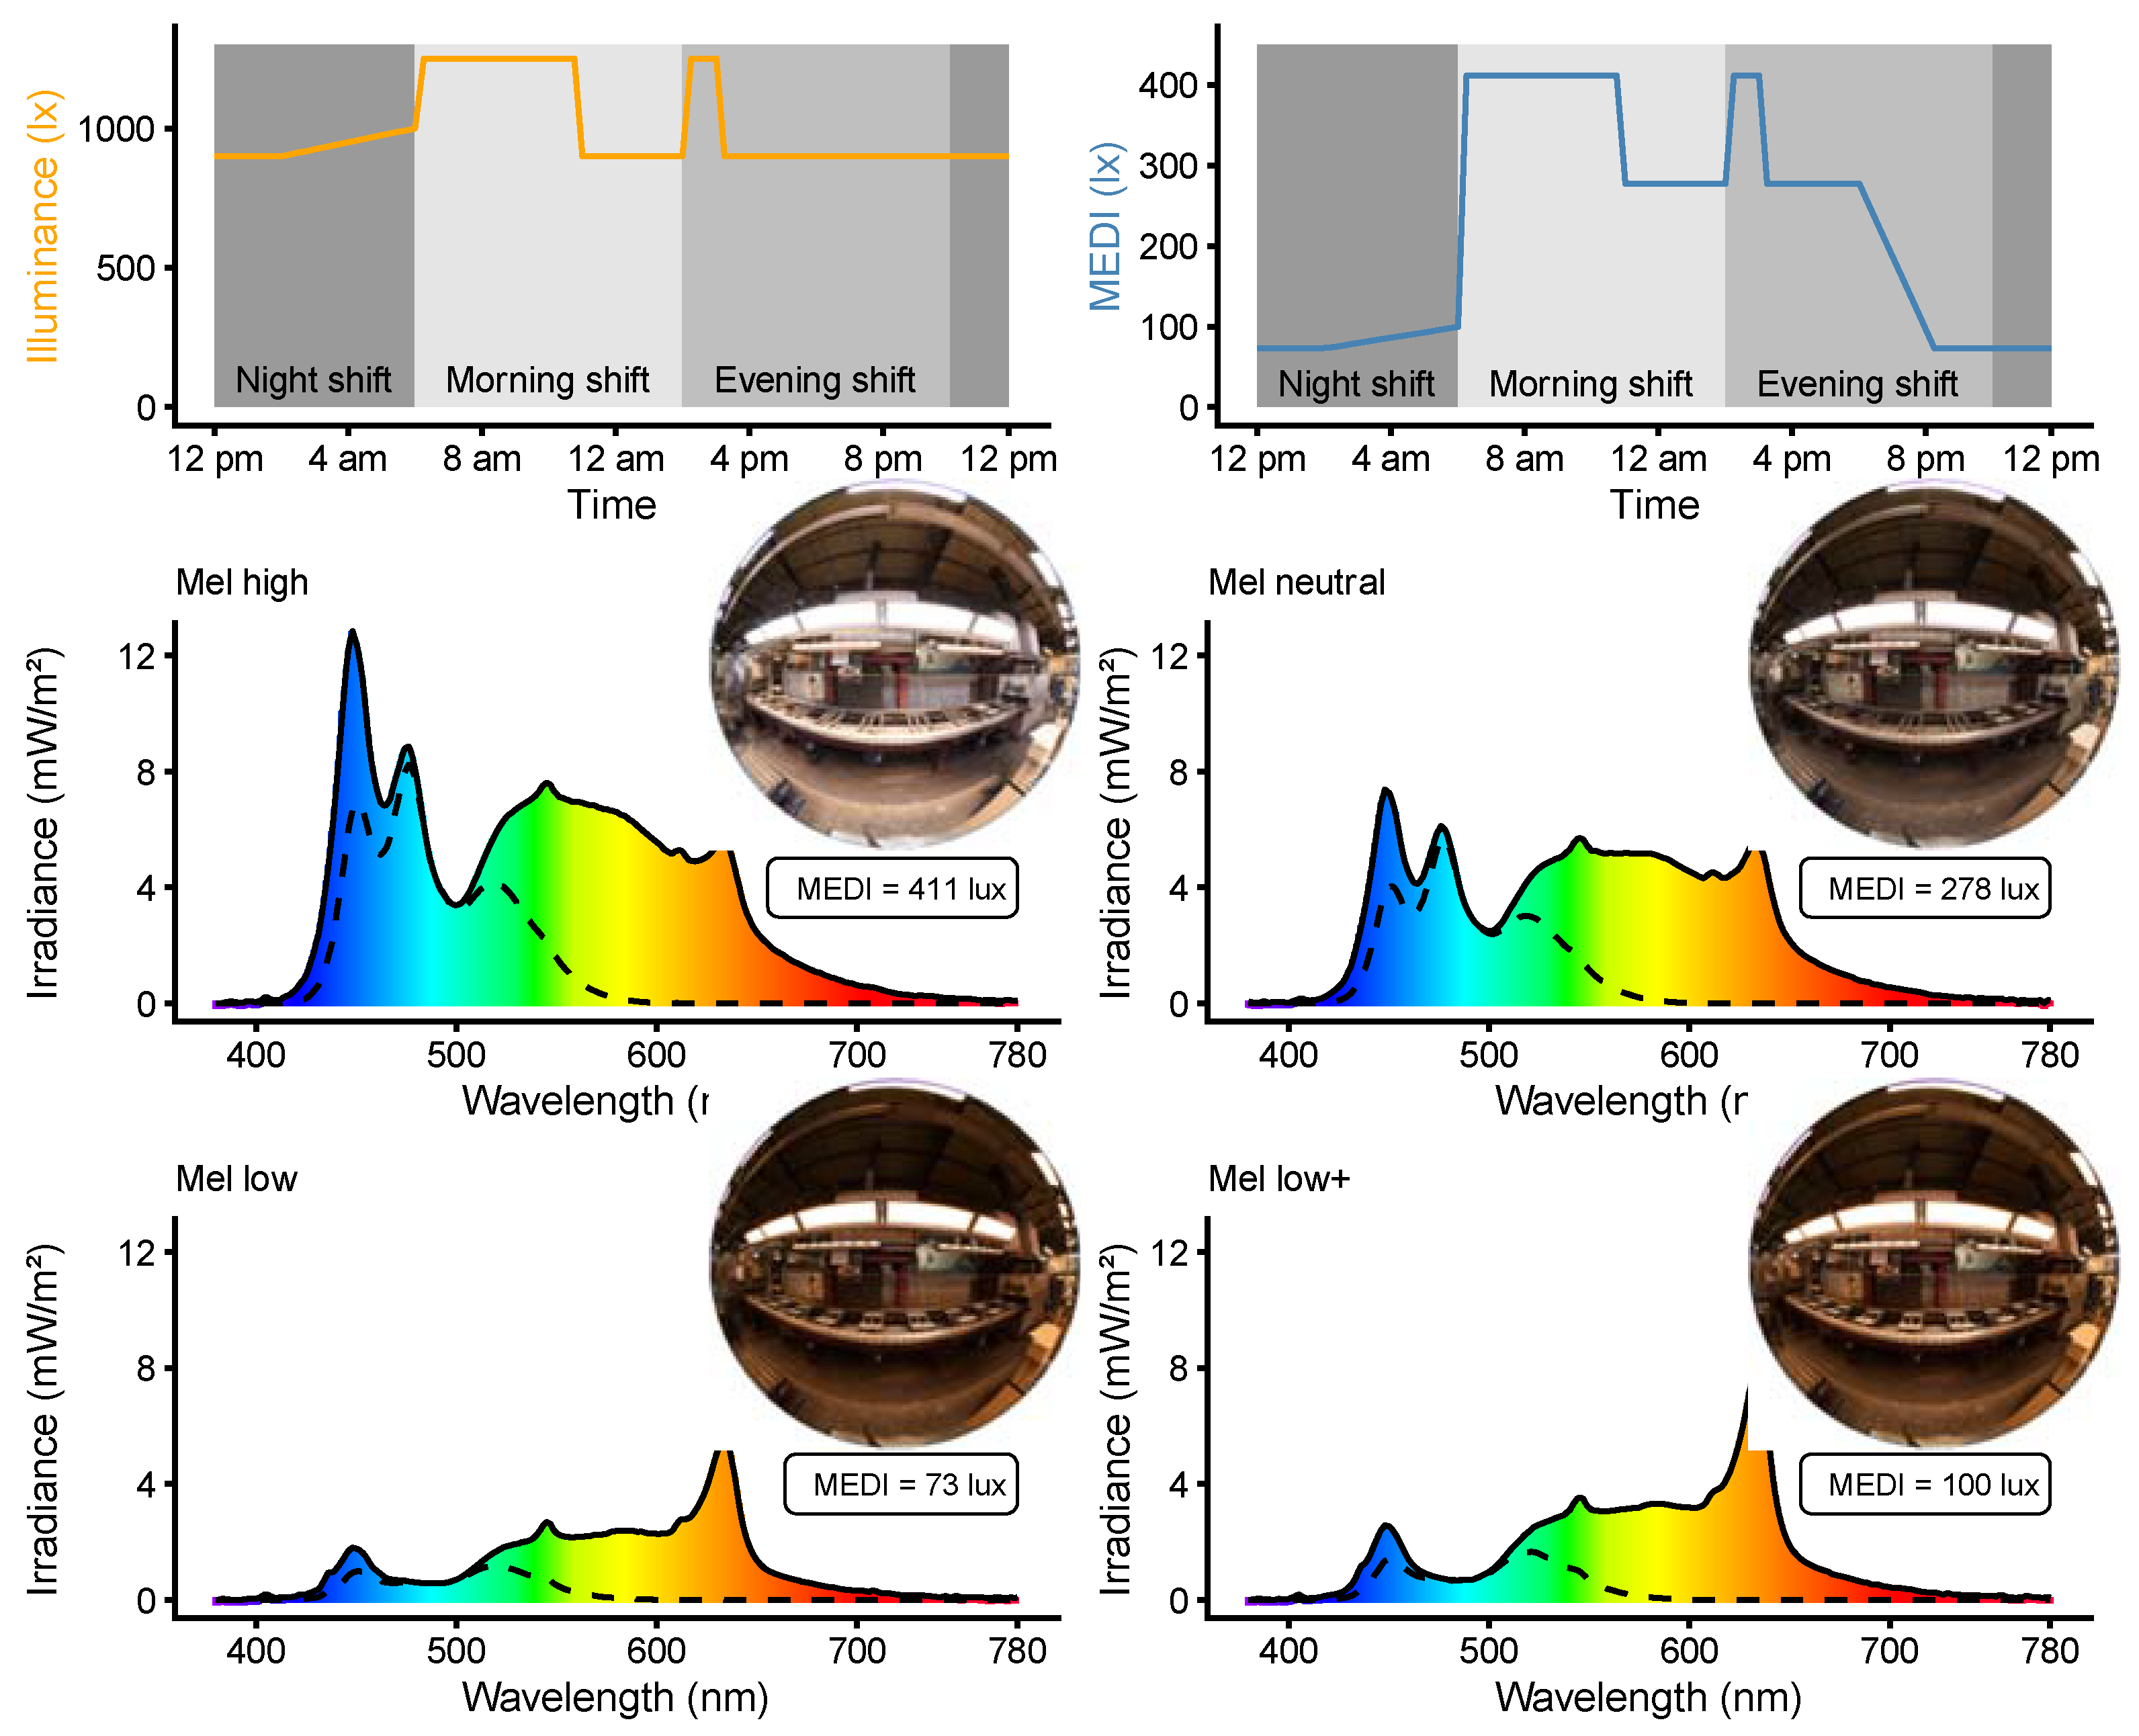
3.4. Spectral Illuminance Measurements, Automation Scenario, and Luminance Distribution

The new lighting system was installed according to the outlined design. Impressions are shown in Figure 5. Dimming levels were set in each area by simultaneously measuring illuminance and MEDI at the workplaces. The dimming level and CCT can be set separately for every luminaire and every component (direct and area). The automation consisted of the following sections discussed below. The time gaps between the sections are fading times.
  • From 6:15 a.m. to 10:45 a.m., the melanopic stimulus was set high for the morning shift for activation and synchronization (Mel high).
  • From 11:00 a.m. to 2:00 p.m., the light was in a neutral setting for the morning shift (Mel neutral).
  • From 2:15 p.m. to 3:15 p.m., the setting was identical to A., but for the evening shift for activation (Mel high).
  • From 3:30 p.m. until one hour before sundown, the setting was identical to B., but for the evening shift (Mel neutral).
  • From one hour after sunset, until 2:00 a.m., the melanopic stimulus was set minimal for the night shift (Mel low).
  • At 6:00 a.m., the melanopic stimulus was still set low, but higher compared to E (Mel low+).
The exact measurements for the quality control and packaging workplaces are shown in Figure 6 and Table 2. The large differences in melanopic values at eye level with comparatively little differences in photopic values at task level are possible by selectively dimming the direct and area components of Drosa, although changing the CCT of the area component plays an important role (within a reasonable limit of 3000–7000 K). Since the direct component always stays at 4000 K CCT, the visual task is not impaired by changes in color temperature.
As can be readily seen from Table 2, the lighting system works very differently between the two workplaces. For one, the background illuminance in both places is different, stemming from other lights in the industrial hangar. Background illuminance is quite minimal at quality control (9 lx MEDI) and substantial at packaging (75 lx MEDI). As there were no tub lights above packaging before the new design, the backlight illuminance is equal to the stock illuminance (see Table 1). Consequently, this acts as a lower threshold for the packaging workplace that interferes with the MEDI goals for the night shift.
Another interesting observation is the comparison of measurements with and without FOV obstruction. In the case of the quality control workplaces, these values differ only by about 3–4%, meaning almost all of the light at this viewing position reaches the eye within the field of view. In the case of the packaging workplace, they differ between 23% and 114%, meaning that a substantial amount of light does not reach the field of view. The latter is desirable in the low melanopic settings, as it reduces the melanopic stimulus, but not in the high setting, for the same reason. The differences in the FOV obstruction can be explained by the positioning of the luminaires compared to a worker’s position. The packaging workplace is at the border of the relevant area (see Figure 1). Besides the lights above the workplace, no dynamic light is visible to a worker (unless the area next to it is outfitted with the new lighting in the future). The quality control workplaces, on the other hand, are surrounded by Drosa luminaires, and the ones above the workplace are at an ideal height within the field of view. All spectral measurements are available in 1 nm resolution in File S1.
Through a central display, workers can change the illuminance level up to ±20% of the current setting, but only until the end of their shift, when normal levels fade back in. This is meant to increase user acceptance of the solution by giving the user the possibility to intervene with the automated system. At the same time, the extent of this possibility is small enough so as not to equalize the circadian curve.
Figure 7 shows the luminance distribution of the high and low melanopic settings beside the stock lighting system as false-color scales alongside the 180° fisheye photographs.
The stock lighting system is quite similar in luminance distribution to the high melanopic setting, although both the melanopic stimulus and the illuminance at task level are more than one-third higher compared to the stock lighting (Table 2 compared to Table 1). The low melanopic setting, on the other hand, provides about the same task illuminance as the stock system but far less on vertical surfaces. This contributes to the three-fold difference in melanopic stimulus intensity between the stock lighting and low melanopic setting in the new lighting. In the high and low melanopic settings, the stock luminaires can be seen to reflect some of the light of the direct component. The measurements were taken during commissioning, after which, the stock lighting system was removed.

4. Discussion

4.1. Nonvisual Lighting Simulation

In the first section of the Discussion, we outline the benefits and limitations of our nonvisual lighting simulation process. The process in Appendix A allows for a lighting specification in advance of a lighting intervention targeted at the nonvisual effects of light. While some specialized software allows this more directly by working with spectral parameters, such as ALFA (Solemma LLC, Cambridge, MA, USA) [30] and Lark Spectral Lighting (collaboration of University of Washington and ZGF Architects LLP) [31], the outlined process is software agnostic. This means that the process depends on functions that are part of most standard lighting design tools, some of which are free of charge [32,33]. Compared to specialized software, the process has some disadvantages. First, while the process is comparatively easy, it is not guided by the software, as standard lighting software only depends on single-value photopic parameters (sometimes split into RGB values). This increases the possibility of user error while setting up the different models and measurement points or plains and when interpreting the simulation results. Second, specialized software provides a database for materials and light sources. In our process, the user has to take measurements or use third-party sources for this information. This can be a benefit as well as a limitation, as the specific information that the dedicated programs provide might not necessarily reflect the materials and light spectrum of the project. An untrained user might put too much trust in the specific information at a point in the design process when only a broad assumption is warranted. Third, our process increases inaccuracy by simplifying spectral parameters to single-value parameters. For example, the spectral distribution of a light source might lead to greater or lesser reflection from a material of a given reflectance, depending on where in the spectrum reflection dominates. This information is lost in the process and, therefore, is not part of the simulation results. However, this has always been the case for standard lighting design, where reflection values of materials stem from a standard illuminant or equal energy spectrum. A user might also calculate the single-value reflection based on the used illuminant, which increases the accuracy for the first reflection. As long as broadband white light sources are used, we argue for the more simplistic approach, as the additional error will have little impact on the results. The overall success of the process can be shown, e.g., by comparing the simulation results for the high melanopic setting (Figure 4 and File S2) with the measurement results (Table 2). We used lighting distribution and the necessary luminous flux deduced from the simulation result to specify the luminous flux of the Drosa components. We reach up to 390 lx MEDI in the simulation for the quality control workplace with a maintenance factor of 80% (0.8), comparable to 403 lx from the measurements (412 lx minus 9 lx background illuminance) with the lights at an 80% dimming level. In the packaging workplace, we reach up to 239 lx in the simulation, comparable to 249 lx from the measurements (324 lx minus 75 lx background illuminance). These values sound remarkably similar, but we caution the comparison insofar as the simulation values are “up to”, and a different position for comparison would lead to different values. The simulation process described in Appendix A is not meant for pinpoint accuracy but rather to offer a comparatively easy-to-use way to specify lighting components for nonvisual aspects as part of the design process. In this way, the process is similar to that of standard lighting design, where the simulation goal is not a 1:1 representation of reality, but a good enough abstraction to make educated decisions for luminaire specification, position, and orientation. (Vangimalla et al. [34] give a tolerance of about 15% between lighting simulation and real measurements, although the generalizability is limited). The process also allows for the estimation of the possible role of daylight in a design, although the used daylight autonomy should be used tentatively, as there is no one daylight spectrum, and orientation and sky conditions heavily influence any indoor daylight illumination [35]. The process could be adapted, however, to more complex climate-based lighting design processes [36].
Compared to other research dealing with lighting simulations in the industrial context, our method provides additional information about the work environment. For example, Dupláková et al. [37] described the lighting simulation and lighting optimization for a cutting workplace. They used the free software Dialux evo, which is comparable to the Relux software used in this publication. The authors first performed a comparison between several illuminance measurements and the respective simulation results, before optimizing the illumination through simulation. They focused on visual aspects, such as illuminance and glare rating. Our method adds a nonvisual parameter within the same software. The same holds true for a publication of Dupláková et al. [38] in the context of an aluminum piece production facility. In addition to the prior publication [37], the authors provide a rationalization algorithm for the redesign of the working environment light. The authors also mention the possibility of circadian quantities to assess and improve the health aspects of lighting.
Other studies have dealt more in detail with nonvisual lighting simulation. Acosta et al. [39] simulated the daylight illumination in a hospital room, which was then translated to a circadian stimulus. He used the Daysim software [40], which allows for a detailed daylight simulation across one year but requires a third-party application for model generation and is limited to daylighting. Compared to our method, the authors did not discuss the influence of spectral transmission or reflectance differences, e.g., due to color [41]. However, the authors investigated several eye-level planes, and their method seems robust for daylighting purposes. Konis [42] used a similar method and software to simulate the daylight availability of indoor scenarios depending on position and viewing direction. As such, it has the same benefits and limitations as Acosta et al. [39]. Cai et al. [43] showed a similar approach as the previous two papers but specifically looked at the influence of room surface reflectance on corneal illuminance. Finally, Potočnik and Košir [44] impressively showed the nonvisual-light-stimulus differences resulting from variations in wall colors and spectral glazing transmittance. They investigated changes in daylighting through both a physical model and a simulation model. For simulation, they used Rhinoceros software and the above-mentioned ALFA software. See above for a discussion on this type of dedicated software compared to our method.

4.2. Lighting Design and Automation Rationale

Brown [45] showed that the nonvisual effect of light mainly depends on the MEDI. However, scientific research suggests that the solid angle of an illuminant and the incidence angle in the field of view also play a role (see the German technical specification DIN SPEC 67600 [29] for a summary of effectors). Through a greater solid angle, more ipRGCs are hit by light, which is thought to increase the nonvisual effect. Additionally, ipRGCs in the lower retina are supposed to be more sensitive to light compared to those in the upper retina. This is deduced from experiments, such as those by Lasko et al. [13] and Glickman et al. [46], where an equal illuminance showed a marked difference in melatonin suppression depending on whether the light came from above or below the gaze axis. We designed the new lighting in the workspace to adjust all these parameters to maximize the effect potential for the workers. If not stated otherwise, values in the following section refer to the main workplaces in quality control.
The first aspect is the light’s intensity, which provides a maintenance level (80% after installation) of up to 448 lx at eye level (high melanopic setting, with 1250 lx at the task level). This can be reduced to 157 lx at the eye level (low melanopic setting, with 900 lx at the task level). The 2.8-fold difference (448/157) is possible through a shift in dimming levels between the wing and the direct component of the luminaire. The second aspect is the spectrum of light, which varies on the wing component between 3000 and 7000 K; this changes the melanopic action factor at eye level between about 0.4 and 0.8, respectively. This provides another two-fold difference (0.8/0.4) for the melanopic stimulus. The total MEDI ratio reaches 5.6 between the high and the low melanopic setting (412/73). Lowden and Kecklund [19] report a scenario of shift illumination, which is dimmable and has adjustable CCT (between 3000 and 5200 K). They reach a MEDI ratio of 4.4 between a 100% at 5200 K setting and a 15% at 3000 K setting (310 lx/70 lx). However, they are only able to do this by simultaneously reducing workplace illuminance from 910 lx to 240 lx. The authors argue that the lower light setting at night might be sufficient for a computer task, where the screen is itself luminous. In our case, this would not be possible, as the production line task is reliant on the workplace lighting. The third and fourth aspects are the size and position of light inside the field of view. By shifting between the two lighting components in the Drosa luminaire, light either reaches the eye from above the gaze angle with a larger solid angle from the wing components (high melanopic setting) compared to standard light sources in the industry, such as the stock lighting, or the wing component only provides enough light for a sufficiently lit surrounding, and most of the light comes from the direct component (low melanopic setting). The light source of the direct component is small and has a negligible luminous intensity toward the observer under normal viewing angles (Figure 3, Figure 5 and Figure 7). Then, much of the light is reflected from the task surface, reaching the eye from below.
The first two aspects show the high plasticity of the melanopic stimulus while keeping the visual task light at satisfactory levels. Spitschan [47] showed a possible eight-fold difference in the melanopic stimulus when looking at a database of 401 white-light illuminant spectra. This would suggest that changing the spectrum alone could be more potent in terms of the MEDI ratio than what is shown here. However, the illuminants also include spectra outside acceptable boundaries for the workplace (such as CCT and CRI) and include different illuminant technologies. In our case, an about two-fold MEDI ratio through a CCT shift alone is feasible within acceptable boundaries. The last two aspects can only be weighed qualitatively at present, but they meet the criteria outlined at the beginning of this section. As such, their effect might beneficial in the high and low melanopic settings.
The implications of the differences in MEDI between an unobstructed sensor to one with a field-of-view obstruction (Table 2) are not clear at present, as recommendations for melanopic stimuli stem from experiments without a FOV obstruction. Zauner et al. [26] showed MEDI differences between 12% and 74% for an office setting. These values are in between those of the quality control and packaging workplaces showed here. A large reduction, such as that present at the packaging workplace (23–114%), likely benefits a low melanopic setting, as at least some light reaches the eye outside the field of view. For the same reasons, it will likely reduce the nonvisual effect for a high melanopic setting. When the Drosa luminaire is placed near the worker and the task, such as in the quality control workplace, the difference between the two measures is negligible (3–4%).
The potential to change the melanopic stimulus in a meaningful way must be realized through a robust automation system. This ensures the intended light dosage and timing, which are of supreme importance [17,48]. Our goal for the automation was to strengthen the circadian rhythm of the rapidly rotating shift workers, thereby reducing the negative effects of chronodisruption. The strategy is opposed to recommendations of bright, blue light at night, which would increase alertness and acute performance [49] but come at the cost of unintended phase shifts, reduced sleep quality, and long-term health detriments [19]. Compared to the stock lighting, which provided a high melanopic stimulus throughout day and night, we designed the automation system with the following rationale for nonvisual aspects:
  • Provide an activating and synchronizing stimulus during the morning hours. According to the technical specification DIN SPEC 67600 [29], a melanopic stimulus of 240 lx MEDI is recommended for synchronization, and it activates the user by increasing alertness, wellbeing, and performance. The specification predates the MEDI notation; therefore, the recommendation was converted from 250 lx at 8000 K fluorescent light. Khalsa et al. [17] showed that the morning hours are best to phase shift the internal clock backward, with a phase response curve constructed from a laboratory experiment. This is supposed to counter opposing phase shifts through light and activity at night.
  • Provide an activating and circadian amplitude strengthening stimulus at the beginning of the evening shift. The activating effect mirrors the one in the morning. At that time of day, workers would also still be able to receive at least similar levels of daylight, if they were outside. Kozaki et al. [18] showed that increased daytime illuminance reduces the suppression of melatonin through the light the following night. This stimulus might similarly benefit the workers in our project.
  • At night (starting at one hour after sunset), the melanopic stimulus is to be minimal. This reduces both the suppression of melatonin and the forward phase shift induced by light at night [50,51]. On the negative side, the stronger activating effect of the stock lighting is also reduced. As a target stimulus, we set 100 lx as the upper threshold. While there is no recommendation for this particular value, we decided on it as a realistic lower threshold regarding the high visual illuminance requirement (Table 1) [26].
  • Starting with the middle of the night shift, the visual stimulus is increased to promote alertness. Sleepiness inevitably rises during the night shift [49]. Some studies show, however, that alertness can be increased by a brighter light, independent of the melanopic stimulus and its detrimental effect on phase shift and melatonin suppression at night [50,52,53]. We do not expect this effect to fully compensate for the increasing sleepiness during the shift, but it might have an attenuating effect. If possible, the melanopic stimulus should not cross the threshold of 100 lx set for the night.
In general, the stimulus goals set out above were met after commissioning (Table 2, Figure 6), although packaging shows some deviations due to the background illumination and its position at the edge of the newly lit space. Lowden and Kecklund [19] discuss the melanopic stimulus thresholds set out by Brown et al. [20], in particular the daytime stimulus of 250 lx MEDI and the evening stimulus of 10 lx MEDI. While the daytime stimulus is very close to our threshold, the evening stimulus is very low and probably not tenable in concert with good visual lighting. Lowden and Kecklund [19] discuss switching off the standard lighting and using amber light beams to reach the threshold. As the authors are mostly referring to computer work, this is not transferable to our scenario as already discussed above. Further, Brown et al. [20] explicitly exclude the shift work context from their recommendation. In summary, the suggested automation curve from Lowden and Kecklund [19] is remarkably close to our automation curve (Figure 6), indicating a similar conclusion based on the available scientific evidence for lighting in night shift work.
Regarding user customization, there is the above-mentioned tablet that allows a shift group to change the set illuminance value ±20% along the curve until the end of the shift. One limitation of the present automation system is the lack of stronger customization to the user. This refers to a (long-term) shift in the curve or its set values because of chronotype, age, or health. There are reasons for this lack thereof, however. First, the possibility for individualization is limited, since more than one worker is using the relevant space at a given time. Second, besides the broad strokes, there is little in terms of recommendations on how to exactly change the lighting based on these traits. For example, should light levels be increased according to the reduced transmission of the optical media with increasing age [24] and disputed effect on the NIF system [54,55], when the glare susceptibility rises at the same time [56]. Third, the complexity of the automation is already exceeding the capabilities of most standard systems. While it would be possible to program these functions with Node-RED, the yet untested functionality would present a source for instability and might negatively affect user acceptance. The formal evaluation will show how users accept the new lighting design and when and how often a user input is made. The first anecdotal feedback suggests that some users find the low melanopic setting too dark, even though the horizontal illuminance is higher than with the stock lighting. This might be due to the lighting in the rest of the hangar, which looks brighter during the night compared to the relevant workspace. It might also be due to a subconscious urge for brighter surroundings to counteract sleepiness. These aspects will be examined alongside the nonvisual effects as part of the formal evaluation.

5. Conclusions

We showed an in-depth example of a possible solution for lighting in shift work scenarios, including night shifts. The solution consists of the two-component luminaire Drosa, which can adjust the light spectrum, irradiance, solid angle, and incidence angle by adjusting the components in relation to one another. Through these measures, a 5.6-fold difference in vertical MEDI at eye level is possible between the highest and lowest melanopic settings (412 lx compared to 73 lx MEDI). The lighting is complemented by an automation strategy that aims to strengthen and stabilize the circadian rhythm of workers in rotating shifts. The new lighting was designed and specified through a nonvisual lighting simulation process (Appendix A), which can be used for artificial and daylighting scenarios. Both the principles behind the luminaire Drosa and the nonvisual simulation process can be adapted for other applications, e.g., office work and nursing homes. The luminaire and the project contribute to practice mainly by providing a clear example on how to apply the scientific background on lighting and health to a specific case. The project has the potential to contribute to science through the ongoing field study about the effects of the new lighting on the workers. The nonvisual lighting simulation may be beneficial not only for practice, where it as a clear application in the lighting design process, but also in science. Researchers designing a study with a room-scale nonvisual light intervention can benefit from a low entry process to specify lighting parameters for a given stimulus prior to installation.

Supplementary Materials

The following are available online at https://www.mdpi.com/article/10.3390/app112210896/s1, File S1: Microsoft Excel file containing the spectral irradiance measurements (W/m2) in 1 nm steps in one worksheet and the derived parameters in a second worksheet. File S2: Microsoft Excel file containing the vertical MEDI (lx) results from Figure 4 in two worksheets. The first row and column of every worksheet contain x and y coordinates in meters, and the other values are MEDI values at the respective coordinates.

Author Contributions

Conceptualization, J.Z. and H.P.; methodology, J.Z. and H.P.; software, J.Z.; validation, J.Z.; formal analysis, J.Z.; investigation, J.Z.; resources, J.Z. and H.P.; data curation, J.Z.; writing—original draft preparation, J.Z.; writing—review and editing, J.Z. and H.P.; visualization, J.Z.; supervision, J.Z. and H.P.; project administration, J.Z. and H.P.; funding acquisition, J.Z. and H.P. All authors have read and agreed to the published version of the manuscript.

Funding

The project was funded by the German statutory accident insurance institution for the administrative sector (VBG). This work was financially supported by the Munich University of Applied Sciences and the German Research Foundation (DFG) through the “Open Access Publishing” program.

Data Availability Statement

Spectral measurements reported in this publication are part of the Supplementary Materials.

Acknowledgments

We thank VBG for the project initiation, and we thank VHB, RHIM, and LMT for their help in realizing this project. We thank two anonymous reviewers for their insightful comments and feedback.

Conflicts of Interest

H.P. declares no conflict of interest. J.Z. holds the copyright and design of the Drosa luminaire and has applied for a utility model. The funders had no role in the design of the study; in the collection, analyses, or interpretation of data; in the writing of the manuscript; or in the decision to publish the results.

Appendix A. Nonvisual Lighting Simulation Process

For this process, a lighting simulation tool is required that allows (1) model construction (or model import); (2) setting reflection values to surfaces; (3) working with luminaire distribution files (such as LDT and IES files), including manipulating the luminous flux; (4) setting up measurement points and planes, especially in the gaze angle direction; and (5) simulation with physically correct or with acceptable abstraction (backward raytracing or radiosity method, respectively) for daylight and artificial light scenarios. Additional functions, such as table export and handling multiple scenes from the same model, are helpful but not required.
Step 1: Model building. As far as geometry is concerned, the model is constructed as it would be for standard lighting design. When assigning materials, or, more specifically, reflection values ρ (rho), to the surfaces, two sets of values are used instead of one. Besides the photopic reflection values, melanopic reflection values ρ m e l   are generated from spectral reflection measurements ρ λ λ according to the following equation:
ρ m e l = 380   nm 780   nm ρ λ λ * s m e l λ × d λ  
where s m e l λ denotes the melanopic spectral sensitivity curve [24]. If the spectral reflectance values of the materials cannot be obtained through measurements or databases, the latest version of the technical specification DIN/TS 67600 provides melanopic reflection values for some sample materials [57]. If transparent materials are used (such as glazing), transmittance values τ (tau) are handled analogously. “Measurement” grids are added to the model as would be carried out in a standard simulation. Points or Grids at relevant eye levels are added. These can be oriented vertically, semi cylindrically, or in the exact gaze direction of the user. The orientation should depend on how well known and how variable a user’s gaze is during their work processes. The simulation model is then split up into one file (or, scene, if available) using the photopic values and one using the melanopic values, called from here on the photopic model and melanopic model, respectively.
Step 2: Light sources. Standard light distribution files are used, and light sources are placed inside all models. For the melanopic model, their luminous flux values are calculated from the following equation:
ϕ m e l , v D 65   = ϕ v × a m e l , v × 1.10375 = ϕ v × 380   nm 780   nm X λ λ × s m e l λ × d λ 380   nm 780   nm X λ λ × V λ × d λ × 1.10375
thereby deriving the melanopic equivalent daylight (D65) luminous flux ϕ m e l , v D 65 (MEDLF, adapted from [24,28]) from the luminous flux ϕ v and the melanopic action factor a m e l , v . If a m e l , v . is not known, the rightmost side of the equation calculates ϕ m e l D 65 from a basic measurement X λ λ , such as spectral radiance or irradiance, together with the spectral sensitivity curve s m e l λ and the photopic brightness sensitivity curve V λ [58]. If the spectral values of the light sources cannot be obtained through measurements or databases, the technical specification DIN/TS 5031-100 provides melanopic action factors for standard types of light sources [28]. If the light source can be spectrally tuned, a separate MEDLF must be calculated for every configuration of interest, e.g., a 2700 K, a 4000 K, and a 6500 K setting. The luminous flux ϕ v has to also be adjusted if it varies with the spectral tuning. In the case of daylight, the luminous flux ϕ v , and, therefore, the MEDLF, can generally not be set in simple simulation tools. When an a m e l , v value of 1/1.10375 is used for daylight, this does not matter, as the MEDLF and the luminous flux are identical. As a workaround in other cases, the glazing transmittance can be multiplied by the relative value of a m e l , v to 1/1.10375.
Step 3: Simulation. Both the photopic and melanopic models are further split up into as many scenes as necessary. In our experience, the extreme cases are the most relevant, e.g., in this project, the morning and the night-time scene. The appropriate luminous flux must be set in every scene. Dimming levels, if they are changed, have to be the same for corresponding photopic and melanopic models. Before starting the simulation, an appropriate maintenance factor must be set. The simulation results are then directly interpretable in terms of photopic illuminance at the task level or the MEDI at eye level from the photopic or melanopic models, respectively. Differing false-color scales between the two model types help to discern the results.
Daylight simulation results can be used to derive an approximate daylight autonomy, i.e., the percentage of time for one year when daylight is sufficient to fulfill the lighting threshold alone. The following equation can be used to derive the adapted daylight factor  A D F   for a given indoor illuminance:
A D F   =   E i E o
where E i is the interior daylight illuminance at a point of interest, and E o is the unobstructed horizontal exterior daylight illuminance. Both illuminance values have to use a standardized overcast sky model for simulation [59]. Some lighting simulation tools can estimate the daylight autonomy based on the Daylight Factor, and the ADF can simply be used instead. Compared to the commonly used Daylight Factor, the ADF is not constrained to horizontal plains for E i . The thus calculated daylight autonomy from the melanopic model is a crude but useful metric in determining the possible impact daylight can have.
Figure A1. Schematic of the nonvisual lighting simulation process with standard lighting design tools. The schematic is complementary to the text in Appendix A. LF is the luminous flux, and MEDLF is the melanopic equivalent of daylight (D65) luminous flux. The result interpretation benefits from different false-color scales depending on the model.
Applsci 11 10896 g0a1

References

  1. Patke, A.; Young, M.W.; Axelrod, S. Molecular mechanisms and physiological importance of circadian rhythms. Nat. Rev. Mol. Cell Biol. 2020, 21, 67–84. [Google Scholar] [CrossRef] [PubMed]
  2. Foster, R.G. Sleep, circadian rhythms and health. Interface Focus 2020, 10, 20190098. [Google Scholar] [CrossRef] [PubMed] [Green Version]
  3. Walker, W.H., II; Walton, J.C.; DeVries, A.C.; Nelson, R.J. Circadian rhythm disruption and mental health. Transl. Psychiatry 2020, 10, 28. [Google Scholar] [CrossRef] [Green Version]
  4. Schilperoort, M.; Rensen, P.C.; Kooijman, S. Time for Novel Strategies to Mitigate Cardiometabolic Risk in Shift Workers. Trends Endocrinol. Metab. 2020, 31, 952–964. [Google Scholar] [CrossRef] [PubMed]
  5. Stevens, R.G.; Hansen, J.; Costa, G.; Haus, E.; Kauppinen, T.; Aronson, K.J.; Castaño-Vinyals, G.; Davis, S.; Frings-Dresen, M.H.W.; Fritschi, L.; et al. Considerations of circadian impact for defining ‘shift work’ in cancer studies: IARC Working Group Report. Occup. Environ. Med. 2011, 68, 154–162. [Google Scholar] [CrossRef] [PubMed]
  6. Vetter, C. Circadian disruption: What do we actually mean? Eur. J. Neurosci. 2020, 51, 531–550. [Google Scholar] [CrossRef] [Green Version]
  7. Roenneberg, T.; Merrow, M. Entrainment of the Human Circadian Clock. Cold Spring Harb. Symp. Quant. Biol. 2007, 72, 293–299. [Google Scholar] [CrossRef] [PubMed] [Green Version]
  8. Foster, R. Fundamentals of circadian entrainment by light. Light. Res. Technol. 2021, 53, 377–393. [Google Scholar] [CrossRef]
  9. Hattar, S.; Liao, H.-W.; Takao, M.; Berson, D.M.; Yau, K.-W. Melanopsin-containing retinal ganglion cells: Architecture, projections, and intrinsic photosensitivity. Science 2002, 295, 1065–1070. [Google Scholar] [CrossRef] [Green Version]
  10. Berson, D.M.; Dunn, F.A.; Takao, M. Phototransduction by Retinal Ganglion Cells That Set the Circadian Clock. Science 2002, 295, 1070–1073. [Google Scholar] [CrossRef] [PubMed] [Green Version]
  11. Lucas, R.J.; Peirson, S.N.; Berson, D.M.; Brown, T.; Cooper, H.M.; Czeisler, C.A.; Figueiro, M.G.; Gamlin, P.; Lockley, S.W.; O’Hagan, J.B.; et al. Measuring and using light in the melanopsin age. Trends Neurosci. 2014, 37, 1–9. [Google Scholar] [CrossRef] [PubMed]
  12. Do, M.T.H.; Yau, K.-W. Intrinsically Photosensitive Retinal Ganglion Cells. Physiol. Rev. 2010, 90, 1547–1581. [Google Scholar] [CrossRef]
  13. Lasko, T.A.; Kripke, D.F.; Elliot, J.A. Melatonin Suppression by Illumination of Upper and Lower Visual Fields. J. Biol. Rhythm. 1999, 14, 122–125. [Google Scholar] [CrossRef] [PubMed]
  14. Thapan, K.; Arendt, J.; Skene, D.J. An action spectrum for melatonin suppression: Evidence for a novel non-rod, non-cone photoreceptor system in humans. J. Physiol. 2001, 535, 261–267. [Google Scholar] [CrossRef] [PubMed]
  15. Cajochen, C.; Münch, M.; Kobialka, S.; Kräuchi, K.; Steiner, R.; Oelhafen, P.; Orgül, S.; Wirz-Justice, A. High Sensitivity of Human Melatonin, Alertness, Thermoregulation, and Heart Rate to Short Wavelength Light. J. Clin. Endocrinol. Metab. 2005, 90, 1311–1316. [Google Scholar] [CrossRef] [PubMed] [Green Version]
  16. Cajochen, C. Alerting effects of light. Sleep Med. Rev. 2007, 11, 453–464. [Google Scholar] [CrossRef] [PubMed]
  17. Khalsa, S.B.; Jewett, M.E.; Cajochen, C.; Czeisler, C.A. A Phase Response Curve to Single Bright Light Pulses in Human Subjects. J. Physiol. 2003, 549, 945–952. [Google Scholar] [CrossRef]
  18. Kozaki, T.; Kubokawa, A.; Taketomi, R.; Hatae, K. Effects of day-time exposure to different light intensities on light-induced melatonin suppression at night. J. Physiol. Anthropol. 2015, 34, 27. [Google Scholar] [CrossRef] [Green Version]
  19. Lowden, A.; Kecklund, G. Considerations on how to light the night-shift. Light. Res. Technol. 2021, 53, 437–452. [Google Scholar] [CrossRef]
  20. Brown, T.; Brainard, G.; Cajochen, C.; Czeisler, C.; Hanifin, J.; Lockley, S.; Lucas, R.; Munch, M.; O’Hagan, J.; Peirson, S.; et al. Recommendations for healthy daytime, evening, and night-time indoor light exposure. Preprints 2020. [Google Scholar] [CrossRef]
  21. Szkiela, M.; Kusideł, E.; Makowiec-Dąbrowska, T.; Kaleta, D. Night Shift Work—A Risk Factor for Breast Cancer. Int. J. Environ. Res. Public Health 2020, 17, 659. [Google Scholar] [CrossRef] [Green Version]
  22. CIE. CIE Position Statement—Proper Light at the Proper Time; CIE: Vienna, Austria, 2019; Available online: http://cie.co.at/publications/position-statement-non-visual-effects-light-recommending-proper-light-proper-time-2nd (accessed on 17 November 2021).
  23. DIN. DIN EN 12464-1:2011-08. Light and Lighting—Lighting of Work Places—Part 1: Indoor Work Places; Beuth Publishing Company: Berlin, Germany, 2011. [Google Scholar]
  24. CIE. CIE S 026/E:2018. CIE System for Metrology of Optical Radiation for ipRGC-Influenced Responses of Light; CIE: Vienna, Austria, 2018. [Google Scholar]
  25. R Core Team. R: A Language and Environment for Statistical Computing; R Foundation for Statistical Computing: Vienna, Austria, 2017. [Google Scholar]
  26. Zauner, J.; Plischke, H.; Stijnen, H.; Schwarz, U.T.; Strasburger, H. Influence of common lighting conditions and time-of-day on the effort-related cardiac response. PLoS ONE 2020, 15, e0239553. [Google Scholar] [CrossRef]
  27. Plischke, H.; Linek, M.; Zauner, J. The opportunities of biodynamic lighting in homes for the elderly. Curr. Dir. Biomed. Eng. 2018, 4, 123–126. [Google Scholar] [CrossRef]
  28. DIN. DIN SPEC 5031-100:2020-05. DIN/TS 5031-100:2020-05—Draft Optical Radiation Physics and Illuminating Engineering—Part 100: Melanopic Effects of Ocular Light on Human Beings—Quantities, Symbols and Action Spectra; Beuth Publishing Company: Berlin, Germany, 2020. [Google Scholar]
  29. DIN. DIN SPEC 67600:2013-04. Biologically Effective Illumination—Design Guidelines; Beuth Publishing Company: Berlin, Germany, 2013. [Google Scholar]
  30. Available online: https://www.solemma.com/alfa (accessed on 17 November 2021).
  31. Available online: https://faculty.washington.edu/inanici/Lark/Lark_home_page.html (accessed on 17 November 2021).
  32. Available online: https://reluxnet.relux.com/ (accessed on 17 November 2021).
  33. Available online: https://www.dialux.com/ (accessed on 17 November 2021).
  34. Vangimalla, P.R.; Olbina, S.J.; Issa, R.R.; Hinze, J. Validation of Autodesk Ecotect™ accuracy for thermal and daylighting simulations. In Proceedings of the 2011 Winter Simulation Conference (WSC), Phoenix, AZ, USA, 11–14 December 2011. [Google Scholar]
  35. Knoop, M.; Stefani, O.; Bueno, B.; Matusiak, B.; Hobday, R.; Wirz-Justice, A.; Martiny, K.; Kantermann, T.; Aarts, M.P.; Zemmouri, N.; et al. Daylight: What makes the difference? Light. Res. Technol. 2019, 52, 423–442. [Google Scholar] [CrossRef] [Green Version]
  36. Mardaljevic, J. The implementation of natural lighting for human health from a planning perspective. Light. Res. Technol. 2021, 53, 489–513. [Google Scholar] [CrossRef]
  37. Dupláková, D.; Hatala, M.; Duplák, J.; Knapčíková, L.; Radchenko, S. Illumination simulation of working environment during the testing of cutting materials durability. Ain Shams Eng. J. 2019, 10, 161–169. [Google Scholar] [CrossRef]
  38. Dupláková, D.; Flimel, M.; Duplák, J.; Hatala, M.; Radchenko, S.; Botko, F. Ergonomic rationalization of lighting in the working environment. Part I: Proposal of rationalization algorithm for lighting redesign. Int. J. Ind. Ergon. 2019, 71, 92–102. [Google Scholar] [CrossRef]
  39. Acosta, I.; Leslie, R.; Figueiro, M. Analysis of circadian stimulus allowed by daylighting in hospital rooms. Light. Res. Technol. 2017, 49, 49–61. [Google Scholar] [CrossRef]
  40. Available online: https://www.radiance-online.org/community/workshops/2012-copenhagen/Day1/Jakubiec/jakubiec%2Creinhart_radiance-workshop-presentation_daysim.pdf (accessed on 17 November 2021).
  41. Bellia, L.; Pedace, A.; Fragliasso, F. Indoor lighting quality: Effects of different wall colours. Light. Res. Technol. 2017, 49, 33–48. [Google Scholar] [CrossRef]
  42. Konis, K. A novel circadian daylight metric for building design and evaluation. Build. Environ. 2017, 113, 22–38. [Google Scholar] [CrossRef]
  43. Cai, W.; Yue, J.; Dai, Q.; Hao, L.; Lin, Y.; Shi, W.; Huang, Y.; Wei, M. The impact of room surface reflectance on corneal illuminance and rule-of-thumb equations for circadian lighting design. Build. Environ. 2018, 141, 288–297. [Google Scholar] [CrossRef]
  44. Potočnik, J.; Košir, M. Influence of commercial glazing and wall colours on the resulting non-visual daylight conditions of an office. Build. Environ. 2020, 171, 106627. [Google Scholar] [CrossRef]
  45. Brown, T.M. Melanopic illuminance defines the magnitude of human circadian light responses under a wide range of conditions. J. Pineal Res. 2020, 69, e12655. [Google Scholar] [CrossRef] [Green Version]
  46. Glickman, G.; Hanifin, J.P.; Rollag, M.D.; Wang, J.; Cooper, H.; Brainard, G.C. Inferior Retinal Light Exposure Is More Effective than Superior Retinal Exposure in Suppressing Melatonin in Humans. J. Biol. Rhythm. 2003, 18, 71–79. [Google Scholar] [CrossRef]
  47. Spitschan, M. Photoreceptor inputs to pupil control. J. Vis. 2019, 19, 5. [Google Scholar] [CrossRef] [Green Version]
  48. Zeitzer, J.; Dijk, D.; Kronauer, R.E.; Brown, E.N.; Czeisler, C.A. Sensitivity of the human circadian pacemaker to nocturnal light: Melatonin phase resetting and suppression. J. Physiol. 2000, 526, 695–702. [Google Scholar] [CrossRef]
  49. Sletten, T.L.; Raman, B.; Magee, M.; Ferguson, S.A.; Kennaway, D.J.; Grunstein, R.R.; Lockley, S.W.; Rajaratnam, S.M. A Blue-Enriched, Increased Intensity Light Intervention to Improve Alertness and Performance in Rotating Night Shift Workers in an Operational Setting. Nat. Sci. Sleep 2021, 13, 647–657. [Google Scholar] [CrossRef]
  50. Regente, J.; de Zeeuw, J.; Bes, F.; Nowozin, C.; Appelhoff, S.; Wahnschaffe, A.; Münch, M.; Kunz, D. Can short-wavelength depleted bright light during single simulated night shifts prevent circadian phase shifts? Appl. Ergon. 2017, 61, 22–30. [Google Scholar] [CrossRef] [PubMed]
  51. Smith, M.R.; Fogg, L.F.; Eastman, C.I. Practical Interventions to Promote Circadian Adaptation to Permanent Night Shift Work: Study 4. J. Biol. Rhythm. 2009, 24, 161–172. [Google Scholar] [CrossRef] [PubMed]
  52. Figueiro, M.G.; Sahin, L.; Wood, B.; Plitnick, B. Light at Night and Measures of Alertness and Performance: Implications for shift workers. Biol. Res. Nurs. 2016, 18, 90–100. [Google Scholar] [CrossRef]
  53. Sahin, L.; Figueiro, M.G. Alerting effects of short-wavelength (blue) and long-wavelength (red) lights in the afternoon. Physiol. Behav. 2013, 116–117, 1–7. [Google Scholar] [CrossRef] [PubMed]
  54. Rukmini, A.V.; Milea, D.; Aung, T.; Gooley, J.J. Pupillary responses to short-wavelength light are preserved in aging. Sci. Rep. 2017, 7, 43832. [Google Scholar] [CrossRef] [PubMed] [Green Version]
  55. Najjar, R.; Chiquet, C.; Teikari, P.; Cornut, P.-L.; Claustrat, B.; Denis, P.; Cooper, H.M.; Gronfier, C. Aging of Non-Visual Spectral Sensitivity to Light in Humans: Compensatory Mechanisms? PLoS ONE 2014, 9, e85837. [Google Scholar] [CrossRef] [PubMed] [Green Version]
  56. Reading, V.M. Disability glare and age. Vis. Res. 1968, 8, 207–214. [Google Scholar] [CrossRef]
  57. DIN. Complementary Criteria for Lighting Design and Lighting Application with Regard to Non-Visual Effects of Light (DIN/TS 67600); DIN: Berlin, Germany, 2021; Available online: https://www.din.de/en/getting-involved/standards-committees/fnl/projects/wdc-proj:din21:342757492?destinationLanguage=&sourceLanguage= (accessed on 17 November 2021).
  58. CIE. ISO/CIE 11664-1:2019(E). Colorimetry—Part 1: CIE Standard Colorimetric Observers; CIE: Vienna, Austria, 2019. [Google Scholar]
  59. CIE. ISO 15469:2004 (E)/CIE S 011/E:2003. Spatial Distribution of Daylight—CIE Standard General Sky; CIE: Vienna, Austria, 2003. [Google Scholar]
Figure 1. Stock lighting situation. The figure shows a floor plan with the workplaces WP 1–WP 4. WP 1 and WP 2 are quality control workplaces. WP 3 and the seldom used WP 4 are packaging workplaces. The rest of the area is storage and movement area. The relevant area is surrounded by a blue dotted line. Two gray hatched rectangles show the position of skylights. Section A-A shows a cut through the quality control workplaces. Red markings in the floor plan and section show stock lighting positions. Two photographs show the main workplace (WP 1 and WP 2).
Applsci 11 10896 g001
Figure 2. Simulation results for a vertical cut through the quality control workplace and the skylight. The false-color scale shows the daylight autonomy in percent for a 240 lx threshold during a time window of 8–11 a.m.
Applsci 11 10896 g002
Figure 3. Photographs of the Drosa luminaire. (a) The linear central component (called direct component) is attached to a standard cable tray and contains six glare-free downlights with a CCT of 4000 K. One or, as shown here, two wings attach to the direct component. Their angle can be freely adjusted between a horizontal and vertical orientation. (b) The wings can be adjusted in CCT between 1800 and 8000 K (here shown for comparison in one picture, which is not a used setting). In the case of the quality control workplaces, where the luminaire is mounted at a height of about 2.0 m, the direct component is almost invisible but responsible for most of the light on the task level.
Applsci 11 10896 g003
Figure 4. Simulation results for the photopic and melanopic models. The top panels show a visualization of the lighting scenario. The use of color is purely qualitative. Middle panels show the photopic illuminance at task level (lx, 1.0 m height) in a false-color scale floor plan. The bottom panels show the scales and the MEDI (lx, 1.5 m height) in a false-color scale floor plan. (a) Stock lighting. An approximate lighting distribution was used for the tub lights. Fluorescent lamp specifications were according to the fitting found on site (mostly 2 × 58 W). (b) Morning scenario with a high melanopic setting. (c) Night-time scenario with a low melanopic setting.
Applsci 11 10896 g004aApplsci 11 10896 g004b
Figure 5. New lighting system after commissioning.
Applsci 11 10896 g005
Figure 6. Measurement results and automation schematics for the new lighting system at the quality control workplaces. The top panels show the horizontal illuminance (lx, orange) and the vertical MEDI (lx, blue). The middle and bottom panels each show the spectral measurement result for one melanopic setting as explained in the main text, alongside a 180° fisheye photograph of the workspace during the light setting. The dashed curves show the raw spectrum (solid line, colored in) when multiplied with the melanopic sensitivity curve.
Applsci 11 10896 g006
Figure 7. Luminance distribution between the old (top panels) and the new lighting systems for high (middle panels) and low (bottom panels) melanopic settings. The right panels show false-color luminance pictures according to the scale with a 180° fisheye camera. The left panels show the corresponding photographs.
Applsci 11 10896 g007
Table 1. Lighting requirements and stock measurements inside the relevant workspace.
Description/Workplace 1Required Task Illuminance 2 (lx)Stock Task Illuminance 3 (lx)Stock Vertical Illuminance 3,4 (MEDI, lx)
Quality Control/1, 2750628–979288–323
Packaging/3 (4, seldom)300311–36675
Movement area/-150284–496not measured
1 Workplace numbers refer to the floor plan in Figure 1. 2 Illuminance requirements are regulatory requirements taken from DIN EN 12464 1:2011-08 and ASR 3 4. 3 Illuminance measurements were taken with the stock artificial lighting at the beginning of the project. 4 Vertical illuminance values are melanopic equivalent daylight (D65) illuminance (MEDI) values according to the standard CIE S 026 taken at a height of 1.5 m.
Table 2. Lighting measurements and automation setting with the new lighting design.
Melanopic SettingQuality ControlPackaging
Vertical MEDI (lx) 1 without/with FOV 4
high412/398324/151
neutral278/268158/110
low73/7097/79
low+100/96122/81
background9/NA75/NA
Horizontal illuminance (lx) 2
high12501350
neutral900650
low900300
low+1000600
CCT at eye level (K)
high65474444
neutral52184491
low30974042
low+30854077
CCT of area component (K)Typical dimming level ofdirect/area component 3
high700080%/80%
neutral550075%/60%
low300070%/25%
low+300080%/35%
1 Vertical illuminance values are melanopic equivalent daylight (D65) illuminance (MEDI) values according to the standard CIE S 026 taken at a height of 1.5 m. 2 Taken at 1.0 m height. 3 Typical level refers to the most common setting across all luminaires. 4 Field-of-view (FOV) restriction of the sensor according to the standard CIE S 026.
Publisher’s Note: MDPI stays neutral with regard to jurisdictional claims in published maps and institutional affiliations.

