Featured Application
Major improvements in yield and disease resistance have come from plant selection and breeding. The proposed method provides a better management due to its capability to detect the asymptomatic G. boninense infection. It can improve the sustainability of palm oil production which thus protects the environment and communities in palm oil-producing regions.
Abstract
Breeding programs to develop planting materials resistant to G. boninense involve a manual census to monitor the progress of the disease development associated with various treatments. It is prone to error due to a lack of experience and subjective judgements. This study focuses on the early detection of G. boninense infection in the oil palm seedlings using near infra-red (NIR)-hyperspectral data and a support vector machine (SVM). The study aims to use a small number of wavelengths by using 5, 4, 3, 2, and 1 band reflectance as datasets. These results were then compared with the results of detection obtained from the vegetation indices developed using spectral reflectance taken from the same hyperspectral sensor. Results indicated a kernel with a simple linear separation between two classes would be more suitable for G. boninense detection compared to the others, both for single-band reflectance and vegetation index datasets. A linear SVM which was developed using a single-band reflectance at 934 nm was identified as the best model of detection since it was not only economical, but also demonstrated a high score of accuracy (94.8%), sensitivity (97.6%), specificity (92.5%), and area under the receiver operating characteristic curve (AUC) (0.95).
1. Introduction
Ganoderma boninense (G. boninense) which causes basal stem rot disease (BSR) has been identified by as the primary pathogen impacting the oil palm tree (Elaeis guineensis) and ultimately killing it [1]. The BSR disease destroys oil palm trees that could cost certain countries dearly in Southeast Asia, especially Malaysia and Indonesia. The symptoms of BSR are difficult to recognize at the early stages since there are no significant characteristics that can be visually detected by the naked eye [2,3,4]. The earliest visual symptom of G. boninense infection in oil palm seedlings can be seen by the presence of fruiting bodies at the bole, followed by partial yellowing of the leaves or mottling of the basal fronds and necrosis when more than 50% of the stem base has been internally destroyed [5]. The impact of diseases in plants can be reduced through proper management of cultural practices, agronomy, and phytosanitary standards. However, it should be implemented with the use of planting materials (seedlings) which are resistant to G. boninense [6]. Yield improvements due to better management and more disease resistant varieties not only can prevent the spread of BSR disease in the plantation and subsequent economic losses [6,7], but also can reduce the pressure for plantation area expansion, which is thus can make a sustainable palm oil production. A comprehensive study to determine the level of resistance or susceptibility of the seedlings to disease is an important aspect to be looked at before any development of a successful breeding program and for the sustainability of this crop, particularly in Southeast Asia [8]. Distinguishing the different levels of plant susceptibility and resistance to the disease is of utmost importance hence, it is crucial to conduct an artificial inoculation of the pathogen at the nursery level to create an early screening test [8]. In common nursery practice, a manual census is used to monitor the progress of the disease development associated with various treatments [9,10] and is done by humans. Human inspection relies heavily on the visible symptoms of the disease. This method is prone to error due to a lack of experience, subjective judgements, and asymptomatic cases.
For early detection of G. boninense, laboratory-based methods [11,12,13,14] are considered reliable. However, the procedures entail stem collection, which may result in plant damage and eventual destruction. Other proposed methods used include an electronic nose (e-nose) [15,16], electrical impedance [17,18], tomography [19,20], thermal imaging [21,22], multispectral imaging [23,24], spectroscopy or hyperspectral data [25,26,27,28,29,30], and a terrestrial laser scanner (TLS) [31,32,33,34,35]. A comprehensive review of sensors used to detect BSR by [36] has found that each technique has different scores in terms of accuracies and limitations. Based on an in-depth review of the NIR spectroscopy sensor [37], it can be concluded that G. boninense can be detected precisely and sensitively using the near infrared (NIR) spectrum. Furthermore, spectroscopy techniques are found to be more reliable in reactions with organic tissues than chemical and imaging techniques. However, the spectroscopy approach is based on point measurements. It does not incorporate the information of spatial distribution of the measured sample. Contrastingly, hyperspectral sensors collect information as a set of images. It has three-dimensional blocks of data comprising two spatial and one wavelength dimension. Therefore, it can provide both spatial and spectral information simultaneously from a measured sample. According to [38], the NIR-hyperspectral data can clearly differentiate healthy seedlings from the seedlings infected by G. boninense, even when there is no appearance of physical symptoms. The infected seedlings demonstrate lower reflectance in the NIR range (750–950 nm) compared to healthy seedlings as a result of xylem destruction, which thus causes a reduction of chlorophyll pigments and a water deficiency. Based on the research work done by [26], the use of SVM with 18 and 35 NIR-hyperspectral wavelengths could provide 100% accuracy of G. boninense detection when the spectral reflectance was extracted from frond number 1 of the seedlings. The percentage accuracy was slightly reduced to 94% when fronds number 1 and 2 were used. However, this method has the advantage of less operational time at the pre-processing stage and a reduction in the number of wavelengths to 9.
A vegetation index (VI) is generated by combining reflectance from multiple spectral wavelengths into a single value using mathematical equations and transformations. Based on the work done by [39], the highest average value of accuracy for detecting G. boninense infection of oil palm trees was found by using a simple ratio (SR) at 86.5%. The method could detect mild infection at 85.2% accuracy. Meanwhile, the normalized difference vegetation index (NDVI) performed very well in detecting palms with severe infection at 95.1% accuracy. For oil palm seedlings, SR developed using 610.5 nm and 738 nm was identified as the best band combination to discriminate mildly, moderately, and severely infected seedlings with a separability of 0.6441 calculated using the average silhouette width (ASW) [40]. Meanwhile, according to [41], the best index for BSR detection was developed using the band ratio of 477.5 nm and 495.5 nm. It obtained a high ASW value (0.9554) and the highest correlation with the chlorophyll in leaves (R2 = 0.835). Researchers in [42] used the same bands in [40] to construct three newly formulated optimized indices for an airborne imaging spectrometer for applications (AISA) namely SR, NDVIa, and transformed vegetation index a (TVIa). The analysis showed that SR and NDVIa obtained 86% overall accuracy, and TVIa got 84% overall accuracy, which was slightly higher than the overall accuracy obtained by [40].
Machine learning (ML) has been applied in various fields in agriculture including yield prediction, disease detection, weed detection, crop recognition, crop quality, water management, soil management, animal welfare, and livestock production [43]. It can be used to facilitate strategic plantation management by providing early information concerning plant health and it is proven to improve the accuracy of the classification for the severity level of disease infection from 80% [33] to 85% [34]. Various types of machine learning (ML) techniques have been used to detect G. boninense infection both in the nursery and in plantation fields including support vector machine (SVM) [17,22,38,44,45,46,47], artificial neural network (ANN) [17,25,48,49], k-nearest neighbour (kNN) [18,29,50], naïve Bayes (NB) [18,29,34,50,51], maximum likelihood [30], random forest [49,52], and quadratic discriminant analysis (QDA) [17]. Different types of datasets have been used—such as pixel value, odor, electrical impedance, laser scanning data, spectral reflectance, and synthetic aperture radar (SAR) data—with various levels of score found up to 100% accuracy. The difference in accuracy score was not only due to different types of datasets and situations, but also due to the different classifiers having different characteristics, where different types of classifiers are sensitive to various parameter optimization [34].
Based on the literature, it can be concluded that the oil palm seedlings infected with G. boninense can be detected precisely and sensitively using the NIR spectrum of spectroscopy. With the use of the ML technique, hyperspectral data could provide 100% accuracy of detection [26]. However, this approach has limitations in that it uses many wavelengths which are not economical for hardware implementation in the future. Vegetation indices require a lesser number of wavelengths and have also shown promising results of detection. Various types of ML models have been used widely to detect G. boninense infection using different types of datasets and they have obtained various levels of accuracy. Furthermore, ML has been proven to improve the percentage accuracy of detection. Therefore, this study was carried out to detect the oil palm seedlings infected by G. boninense using a minimum number of wavelengths taken from NIR-hyperspectral data. The results were then compared with the results of detection obtained from the vegetation indices developed using spectral reflectance data taken from the same hyperspectral sensor.
2. Materials and Methods
2.1. Spectral Reflectance Data
This study used secondary data obtained from [26]. Spectral signatures from the leaflets of frond number 1 and 2 (F12) were extracted of from the commercial hybrid tenera (dura × pisifera) seedlings at 5 months after transplanting. The fronds were seen clearly in the aerial view images since both were located at the top position among other fronds. Both fronds could be identified by the inclination of the fronds as F1 is the youngest expanded frond; hence, it is less inclined than F2. In total, 913 points were extracted to represent spectral signature of the leaflets with 399 points from healthy seedlings and 514 points from the infected seedlings. A step-by-step process of image acquisition using a FireflEYE S185 (Cubert GmbH, Ulm, Germany) hyperspectral camera and data pre-processing were explained in [26].
2.2. Polymerase Chain Reaction (PCR) Test
The infected seedlings were confirmed using a polymerase chain reaction (PCR) test. Polymerase chain reaction (PCR) is a well-established molecular technique to detect and identify pathogen by amplifying the specific or targeted parts of a DNA sequence. The part needed for the test was the roots because the G. boninense infection starts at the roots of oil palm. DNA was extracted from the root of inoculated oil palm seedlings where 2 g of the infected root was grounded to a fine powder with liquid nitrogen and then transferred into a 1.5 mL centrifuge tube. In the tube, 800 µL of extraction buffer, 80 µL 2% sodium dodecyl sulfate (SDS), and 20 µL β-mercaptoethanol were added and subsequently vortexed. The tube was incubated for 30 min at 65 °C. After that, 300 µL of phenol and chloroform were added. The tube was vortexed again for 1 min, then centrifuged at 11,000 rpm for 10 min. The supernatant was then transferred into a new centrifuge tube, and phenol and chloroform were added again. An equal volume of ice-cold propanol was added into the supernatant and incubated at −20 °C for overnight. Later, the tube was centrifuged at 11,000 rpm for 10 min. The supernatant was removed, and 70% ethanol was used to wash DNA pellet. The pellet was dried in laminar flow for 10 min and dissolved in sterile distilled water then incubated at 65 °C to ensure complete dissolution of the pellet. The DNA was kept at −20 °C for long term storage. Pure culture of G. boninense was extracted and used as a positive control, whereas the distilled water was used as a negative control. Specific primer of G. boninense designed by Utomo and Niepold (2000) Gan1: 5′-TTG ACT GGG TTG TAG CTG-3′ and Gan2: 5′-GCG TTA CAT CGC AAT ACA-3′was used. The PCR thermal cycler protocol was performed with four steps. The first step was denaturation for 5 min at 95 °C. The second step was 35 cycles of denaturation for 1 min at 95 °C, annealing for 1 min at 56 °C and elongation for 2 min at 72 °C. The third step was an extension for 10 min at 72 °C. The last step was storage at 4 °C. Gel electrophoresis was conducted using standard protocol to detect the specific band produced. Finally, PCR products were sent to the private lab for gene sequencing analysis for verification of the specific band produced. The sequences were aligned and edited using bio-edit software. The consensus sequences were then blasted in the GenBank to confirm the sequences identity to G. boninense.
Figure 1 shows an example of an infected seedling and the associated PCR result. As shown in Figure 1a, the infected seedling did not show any visible symptoms related to G. boninense infection such as fungal mass or foliar symptoms such as yellowing of leaves despite testing positive with the G. boninense pathogen. The positive result indicated that G. boninense pathogen had penetrated and infected the tested roots. The specific band size was approximately 160 to 170 bp (Figure 1b) that were obtained from the roots, which authenticated the presence of G. boninense infection. Further confirmation was conducted using gene sequencing analysis between the specific bands and G. boninense (taken from the GenBank dataset). The result showed 99.5–100% similarity index.
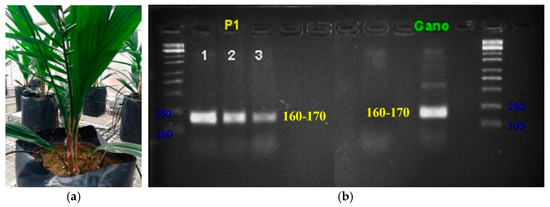
Figure 1.
Sample of an infected seedling. (a) Condition of an infected seedling without symptoms i.e., no fruiting bodies and yellowing of older leaves. However, the disease is confirmed by the (b) PCR amplification using specific primer of G. boninense.
2.3. Classification Model
In this study, the SVM classifier of the machine learning toolbox in MATLAB (2019b, The MathWorks Inc., Natick, MA, USA) with six different types of kernels as summarized in Table 1 were used. Each of the kernels had its model flexibility. The optimal kernel size was search automatically by the software. The classification models were developed separately using two different types of datasets as listed below.

Table 1.
List of classifiers with its corresponding type and model flexibility [53].
2.3.1. Single-Based NIR Reflectance
The nine significant wavelengths identified in [26]—i.e., 914 nm, 922 nm, 926 nm, 930 nm, 934 nm, 938 nm, 942 nm, 946 nm, and 950 nm—were reduced to 5, 4, 3, 2, and 1 by determining the highest 5, 4, 3, 2, and 1 maximum mean difference of the spectral reflectance between healthy and infected seedlings. It is calculated as in Equation (1).
where is the average reflectance at wavelength n for a healthy seedling, is the average reflectance at wavelength n for an infected seedling, and N is the total number of samples at wavelength n.
2.3.2. Vegetation Indices
Two vegetation indices were used namely, SR and NDVI, calculated as in Equations (2) and (3).
These indices were constructed using wavelengths with the highest mean reflectance difference between healthy and infected seedlings taken from the red and NIR regions.
Each of the datasets was divided into two groups which were 70% for training and 30% for testing. SVM algorithms with different kernel types available in MATLAB machine learning toolbox (2019b, The MathWorks Inc., Natick, MA, USA) as tabulated in Table 1 were used to develop the models. A five-fold cross-validation technique was applied to test the output of the established model, where the cross-validation method selected five disjoined sets to partition the data. While only one set was used for the validation of the model, the other four sets were used for training. This process was repeated five times, and the resulting confusion matrix was obtained by using the arithmetic means of the results arising from each of the iterations.
2.4. Assessment of Model Performance
2.4.1. Confusion Matrix
A confusion matrix is a table that shows how well a classification model performs on a set of test data for which the true values are known. In this research, the following definitions have been set:
- True Positive (TP): Infected seedling correctly identified as infected.
- False Positive (FP): Healthy seedling incorrectly identified as infected.
- True Negative (TN): Healthy seedling correctly identified as healthy.
- False Negative (FN): Infected seedling incorrectly identified as healthy.
The performance of each classification model in this research was described by analyzing its value of accuracy, sensitivity, and specificity extracted from the confusion matrix. Accuracy measures how correct a model identifies and excludes a given condition. The accuracy is the proportion of correct predictions (both TP and TN) among the total number of cases examined and calculated as in Equation (4)
Sensitivity (also called the true positive rate (TPR)) evaluates how good the test is at detecting infected seedlings. It is the probability that an actual positive will test positive and calculated as in Equation (5)
Specificity (also called the true negative rate (TNR)) estimates how likely healthy seedlings can be correctly ruled out. It is calculated as the number of correct negative predictions divided by the total number of negatives as in Equation (6)
2.4.2. Receiver Operating Characteristic (ROC) and Area under the ROC Curve (AUC)
A ROC curve is a graph showing the performance of a classification model at all classification thresholds. This curve plots two parameters which are true positive rate (TPR) and false positive rate (FPR), where FPR = 1—specificity. The AUC measures the entire two-dimensional area underneath the entire ROC curve from (0, 0) to (1, 1). A model whose predictions are 100% correct has an AUC of 1.0, but one whose predictions are 100% wrong has an AUC value of 0.0. When the AUC is less than or equal to 0.5, then the classifier will not be able to distinguish between positive or negative class values. Table 2 shows a detail scale of AUC performance provided by [54].
Table 2.
Scale of classification by AUC [54].
3. Results
3.1. Classification Model
3.1.1. Dataset 1: Single-Based NIR Reflectance
As shown in Figure 2, bands at wavelength numbers 926 nm, 930 nm, 934 nm, 938 nm, and 942 nm were identified as the five significant bands due to a high separation gap between healthy and infected seedlings.
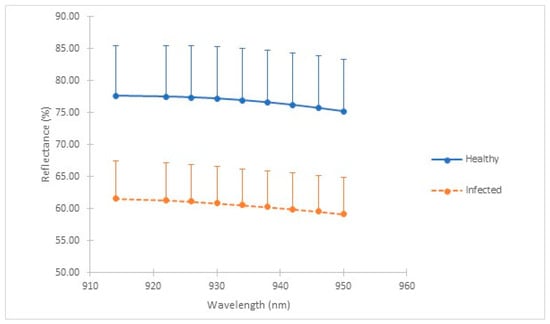
Figure 2.
Graph of reflectance (%) for each wavelength (nm) for healthy and infected seedlings.
Table 3, Table 4, Table 5 and Table 6 tabulate the score performance for each of the SVM models developed using different combinations of identified significant single-based NIR reflectance. In terms of accuracy, as shown in Table 3, the performance of coarse Gaussian SVM had the highest average accuracy score which was 94.64%. All SVM models still gave good accuracy scores (above 80%) even when the number of wavelengths were reduced except for cubic SVM. The second highest average accuracy was obtained from linear SVM with 94.62%, this was then followed by fine Gaussian SVM with 94.60%, medium Gaussian SVM with 94.56%, quadratic SVM with 85.62%, and lastly cubic SVM with 48.74%.
Table 3.
Performance of each SVM model in terms of accuracy in each reduction of the number of wavelengths.
Table 4.
Performance of each SVM model for sensitivity in each reduction of the number of wavelengths.
Table 5.
Performance of each SVM model for specificity in each reduction of the number of wavelengths.
Table 6.
Performance of each SVM model for AUC in each reduction of the number of wavelengths.
For sensitivity, as tabulated in Table 4, the highest average score was achieved by linear SVM (93.10%), followed by fine Gaussian SVM (92.80%), coarse Gaussian SVM (92.10%), medium Gaussian SVM (92.08%), quadratic SVM (88.92%), and cubic SVM (45.26%). In general, all SVM models had excellent sensitivity scores, indicating that there were few false negative results, and thus fewer cases of disease were missed except for the cubic SVM which had the lowest sensitivity score. It failed to identify disease in the infected seedlings.
As tabulated in Table 5, coarse Gaussian SVM had the highest average specificity score with 96.48%, followed by medium Gaussian SVM (96.36%), linear SVM (96.10%), fine Gaussian SVM (96.02%), quadratic SVM (82.36%), and cubic SVM (52.22%). Since Coarse Gaussian SVM had the highest average of specificity score, it was identified as the best model which could correctly identify oil palm seedlings without G. boninense infection. In general, all SVM models were able to correctly identify oil palm seedlings without BSR disease, except for cubic SVM.
The value of AUC indicates the performance of model separability for correctly identified infected and healthy seedlings. Based on the results tabulated in Table 6, all SVM models showed excellent performance with an average value of AUC from 0.91 to 0.96 except for cubic SVM (0.42). This meant that there was a high chance that most of the models were able to distinguish between classes which were the positive and negative classes.
Table 7 shows the mean, standard deviation, and coefficient of variance (CV) for accuracy, sensitivity, and specificity of each SVM model calculated to identify dispersion of the data. The mean of accuracy, sensitivity, and specificity of each model were calculated by averaging these respective values from all the different datasets used. In general, all the models showed good performance with most of them achieving more than 90% mean accuracy, sensitivity, and specificity. In terms of consistency of the model performance, according to [55], the CV was considered low if it was less than 10%, indicating that the value was consistent. The performance is considered medium when it ranges between 10% and 20%, indicating reasonable consistency. Meanwhile, a CV with a percentage of 20% to 30% is considered high, implying a lack of consistency. Finally, if the percentage of the CV is greater than 30%, it is considered extremely high, indicating a great lack of consistency. As tabulated in Table 7, it is shown that, in terms of accuracy, linear SVM had the lowest CV score with 0.17%, followed by fine Gaussian SVM (0.24%), medium Gaussian SVM (0.35%), coarse Gaussian SVM (0.37%), quadratic SVM (6.36%), and the highest CV was cubic SVM (26.34%). In respect of sensitivity, fine Gaussian SVM had the lowest CV score which was 2.40%, followed by linear SVM (2.72%), medium and coarse Gaussian SVM (3.49%), quadratic SVM (7.29%), and cubic SVM (41.97%). Regarding the CV of specificity, the lowest percentage of CV was achieved by linear SVM (2.09%), followed by fine Gaussian SVM (2.28), medium Gaussian SVM (2.70%), coarse Gaussian SVM (2.98%), quadratic SVM (13.94%), and cubic SVM (20.91%). Since linear, fine Gaussian, medium Gaussian, and coarse Gaussian have a low percentages of CV, these SVM models show very consistent results in detecting G. boninense infection in oil palm seedlings. For quadratic SVM, the CV score for accuracy and sensitivity was below 10%. In terms of specificity, the CV score between 10% and 20% was considered as reasonable consistency. Unfortunately, cubic SVM had a CV score above 25% which was considered extremely high, indicating a lack of consistency.
Table 7.
Mean (x) and standard deviation (s) and coefficients of variations (CV) for accuracy, sensitivity, and specificity of each SVM model.
Overall, the linear SVM model has the lowest score of CV for accuracy and specificity, and second lowest score of CV for sensitivity. The linear SVM also obtained a high score for accuracy, sensitivity, and specificity with scores above 90%. Since the linear SVM had the lowest CV score, it shows that the reduced number of wavelengths for the linear SVM did not affect the consistency of the model to detect G. boninense infection. Even when the number of wavelengths was reduced to 1, the linear SVM with an optimal kernel size of 0.0174 still had an excellent accuracy (94.80%), sensitivity (97.60%), specificity (92.50%), and AUC (0.95). Therefore, the linear SVM with a dataset taken from 934 nm was identified as the best model for detection. It can accurately identify both infected and healthy seedlings. The model also improved the classification accuracy obtained by [26] that used nine wavelengths for detection by 1.80%.
While the linear SVM demonstrated the leading execution capability, the cubic SVM demonstrated in the other direction. Scatterplots of the datasets before and after the classification process are shown in Figure 3. Figure 3b shows the Linear SVM managed to separate the overlapping original dataset (Figure 3a) into healthy and infected classes properly. For the cubic SVM, the model flexibility was medium. As shown in Figure 3c, the cubic SVM model classification process did not properly separate the two classes since there was still much of the data overlapping after the classification process which thus indicated low model performance. Therefore, in this research, it shows that the model with a simple linear separation is more suitable to separate healthy and infected seedlings compared to fitting into the shape of a cubic function.
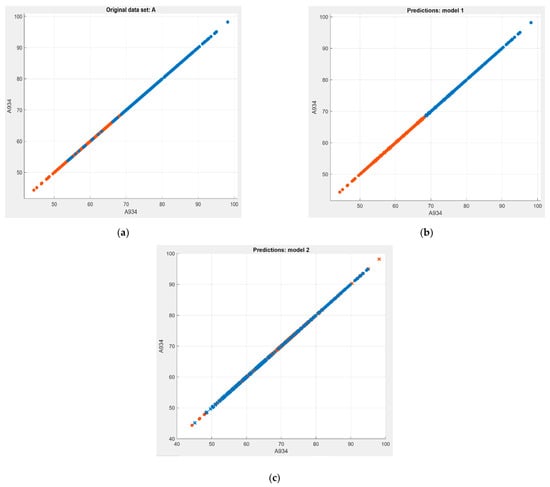
Figure 3.
Scatter plot of SVM classification models. (a) Original dataset before classified using (b) linear SVM and (c) cubic SVM.
3.1.2. Dataset 2: Vegetation Index (VI)
As shown in Figure 4, the highest separation gap of the average reflectance between healthy and infected plants for the red region was obtained at wavelength number 630 nm with 0.61%. For NIR region, wavelength number 934 nm was selected to be used to develop the NDVI since it was identified as the band with the highest separation gap of average reflectance value between healthy and infected seedlings.
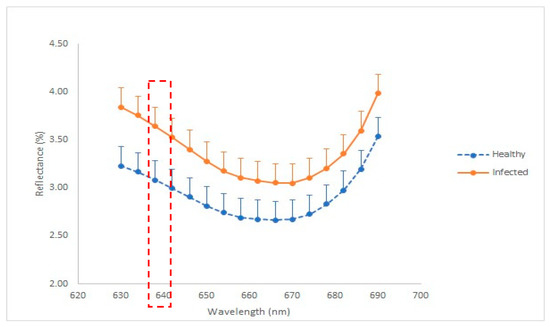
Figure 4.
Graph of reflectance (%) against wavelength (nm) for healthy and infected seedlings.
As shown in Table 8, the accuracy scores obtained from both the vegetation index (SR and NDVI) were compared to identify which vegetation indices were better at detecting G. boninense infection in oil palm seedlings. For SR, the highest accuracy was obtained from the Linear SVM with 57.3%. Meanwhile, cubic SVM obtained the lowest accuracy at 47.6%. In terms of sensitivity, the coarse Gaussian SVM had the highest score (97.8%) in correctly identifying infected seedlings as infected. However, it has the lowest specificity (4.3%). Therefore, most of the healthy seedlings were identified as infected. Meanwhile, cubic SVM had a better performance in identifying the healthy seedlings correctly with 65.6% specificity. Overall, the linear SVM could balance its performance in detecting infected and healthy seedlings. It obtained the highest score of AUC with 0.59. The NDVI has demonstrated similar trends of model performance for accuracy, sensitivity, specificity, and AUC. It obtained the same highest accuracy score as SR, which was from the linear SVM. Therefore, the classification results show that a simple linear separation between two classes would be more suitable to classify between infected and healthy seedlings.
Table 8.
Performance of SVM models using SR and NDVI datasets.
4. Discussion
Previous studies have indicated that some specific regions/wavelengths can provide significantly superior discrimination power than others [56,57,58]. Changes in reflectance in the visible (VIS) regions (400–700 nm) are mainly determined by pigment concentration and photosynthesis efficiency, while near-infrared (NIR, 700–1100 nm) regions are strongly influenced by the leaf internal structure. The VIS region provides information based on color and texture, while the NIR region principally involves N-H, C-H, and O-H bonds. These bonds contain information concerning the chemical elements, structures, and states of the molecules. For early asymptomatic disease detection, the NIR region is the primary interest as NIR can obtain information on the interior tissues, while VIS can only obtain exterior information which is invisible at the early stage of infection [59]. This finding was not only in agreement with a previous study conducted for BSR disease at mature oil palm tree [50] but also to other diseases such as in identifying cotton canopy infected with Verticillium wilt [60], apple scab disease caused by Venturia inaequalis [61], and corn kernels infected by fungi [62]. According to [63,64], NIR region could detect the presence of functional groups of CH3, CN, N-H, C=N, and C-O-C in the G. boninense tissue sample. Several functional groups can also be identified such as CH3, N-H, and C=H [65]. Therefore, NIR is more precise and sensitive to detect the G. boninense infection compared to VIS. Spectral data in the NIR region represents significant differences between classes of samples compared to the VIS region [26,50].
Both vegetation indices produced a single value calculated by transforming the observations from the red and NIR spectral bands. This single value was used to enhance the presence of vegetation features and thus helped to distinguish them from the other objects present in the image. The simple ratio (SR) is the simplest VI which is a faster way to distinguish green leaves from other objects. The spectral signature of healthy leaves reflects very low reflectance in the red region but a relatively higher reflectance in the NIR region. SR is sensitive to the chlorophyll content and was developed for estimating photosynthetic pigment concentrations in leaves [66]. Meanwhile, NDVI applications discovered that if chlorophyll production was reduced by biotics (e.g., insect damage, disease), there would be increased red reflection and a reduced NDVI value [67,68]. NDVI measurement is significantly and usefully correlated with SPAD (Soil and Plant Analysis Development) values. The SPAD values express the relative sums of chlorophyll in crop leaves and have been established in several studies [69,70,71]. The studies mainly focused on chlorophyll measurement, which estimated the crop relative chlorophyll content by averaging all the values of one point SPAD measured more than once. In this research, it was found that the accuracy of detection using NDVI was low. This condition tallies with the SPAD values calculated for the samples. The chlorophyll content of healthy and infected seedlings indicated by the SPAD values were almost similar as well as statistically insignificantly different when tested using a Mann–Whitney U test with p = 0.573.
Therefore, in this research, the reduced accuracy of SR and NDVI were most likely obtained due to the lack of physical symptoms in the infected seedlings as shown in Figure 2. This finding was supported by the work done by [39] for mature oil palm trees, where there was low accuracy in detecting infected palms with no symptoms at the palm canopy although there was a rotting process taking place in the basal stem. Furthermore, according to [72], the VIS region is only useful for visual analysis. Therefore, it is not useful to detect the early stage of infection where there are no visible symptoms of infection. This could be the reason why the additional red wavelength in the SR and NDVI did not help to improve the accuracy of detection.
Early detection of G. boninense is vital to prevent the spread of the disease. For future work, the method developed in this research could be implemented in an open environment or a real nursery to confirm its reliability for field application. Furthermore, the application of an Internet of Things for G. boninense can be applied so that the status of the seedlings can be automatically remotely monitored. As a result, the infection could be controlled in a fast manner without totally depending on the workers in the field. Next, research could also be implemented for different types of oil palm varieties to test its tolerance towards G. boninense infection and its effects on spectral reflectance.
5. Conclusions
G. boninense infection can be detected at an early stage even when no physical signs are present by using SVM with the optimal number of wavelengths. For single-band reflectance, models developed using a linear kernel demonstrated the best performance among other kernels since it obtained a low CV score which has thus shown a high consistency in the results and excellent scores in accuracy, sensitivity, and specificity with the percentage value above 90%, respectively. Linear SVM, which was developed using single-band reflectance frequencies taken from 934 nm, was identified as the best model for detection since it demonstrated a high score in accuracy (94.80%), sensitivity (97.60%), specificity (92.50%), and AUC (0.95). The linear SVM also performing well when using SR and NDVI as datasets among the other ML models. However, both models only obtained 57.30% accuracy. This research has also demonstrated that in the early stage of G. boninense infection, where the exterior information is invisible, selection of a single-band reflection from the NIR regions should be used as a dataset due to its capability to obtain information from the interior tissue. It is also shown that a simple linear separation between two classes is more suitable to classify between infected and healthy seedlings. The findings of this research could provide a huge contribution to the oil palm industry since it could help prevent the spread of the disease by successfully detecting the asymptomatic infection which cannot be done by manual inspection through human vision. Better management could produce higher yield and improve the sustainability of palm oil production which would thus protect the environment and communities in palm oil-producing regions.
Author Contributions
Conceptualization, S.K.-B. and M.S.S.; Methodology, S.K.-B., M.S.S. and A.N.N.A.; Software, M.S.S. and S.K.-B.; Validation, M.S.S. and S.K.-B.; Formal analysis, M.S.S. and S.K.-B.; Investigation, M.S.S. and S.K.-B.; Resources, S.K.-B. and M.J.; Data curation, M.S.S. and A.N.N.A.; Writing—original draft preparation, M.S.S.; Writing—review and editing, S.K.-B.; Visualization, M.S.S., A.N.N.A. and M.J.; Supervision, S.K.-B.; Project administration, S.K.-B.; Funding acquisition, S.K.-B. All authors have read and agreed to the published version of the manuscript.
Funding
This research was funded by the Malaysian Ministry of Higher Education (MOHE), Universiti Putra Malaysia (UPM) under grant number FRGS/1/2018/TK04/UPM/02/4 and LRGS-NANOMITE/5526305.
Institutional Review Board Statement
Not applicable.
Informed Consent Statement
Not applicable.
Data Availability Statement
The data presented in this study are available on request from the corresponding author. The data are not publicly available due to restrictions.
Conflicts of Interest
The authors declare no conflict of interest.
References
- Hushiarian, R.; Yusof, N.A.; Dutse, S.W. Detection and control of Ganoderma boninense: Strategies and perspectives. SpringerPlus 2013, 2, 555. [Google Scholar] [CrossRef] [PubMed]
- Govender, N.T.; Mahmood, M.; Seman, I.A.; Wong, M.Y. The phenylpropanoid pathway and lignin in defense against Ganoderma boninense colonized root tissues in oil palm (Elaeis guineensis Jacq.). Front. Plant Sci. 2017, 8, 1395. [Google Scholar] [CrossRef] [PubMed]
- Rakib, M.R.M.; Borhan, A.H.; Jawahir, A.N. The relationship between SPAD chlorophyll and disease severity index in Ganoderma-infected oil palm seedlings. J. Bangladesh Agric. Univ. 2019, 17, 355–358. [Google Scholar] [CrossRef]
- Wulandari, Y.R.E.; Felicia, F.; Arifin, A.R.; Suwanto, A. EgMLP1 gene expression in oil palm Ramet infected with Ganoderma boninense. Int. J. Oil Palm 2018, 1, 71–78. [Google Scholar]
- Naher, L.; Intan, S.; Mokhtar, B.; Sidek, N. Trichoderma harzianum T32 growth and antagonistic performance against Ganoderma boninense on different culture media. In Proceedings of the 3rd International Conference on Biological, Chemical & Environmental Science (BCES-2015), Kuala Lumpur, Malaysia, 21–22 September 2015. [Google Scholar]
- Turnbull, N.; de Franqueville, H.; Breton, F.; Jeyen, S.; Syahoutra, I.; Cochard, B.; Durand-Gassellin, T. Breeding methodology to select oil palm planting material partially resistant to Ganoderma boninense. In Proceedings of the 5th Quadrennial International Oil Palm Conference, Kuta Selatan, Indonesia, 17–19 June 2014. [Google Scholar]
- Idris, A.S. Basal Stem Rot in Malaysia-Biology, economic importance, epidemiology, detection and control. In Proceedings of the International Workshop on Awareness, Detection and Control of Oil Palm Devastating Diseases, Kuala Lumpur, Malaysia, 1 January 2009. [Google Scholar]
- Breton, F.; Miranti, R.; Lubis, Z.; Hayun, Z.; Setiawati, U.; Flori, A.; De Franqueville, H. Implementation of an early artificial inoculation test to screen oil palm progenies for their level of resistance and hypothesis on natural infection: Ganoderma disease of the oil palm. In Proceedings of the 16th International Oil Palm Conference and Expopalma Challenges in Sustainable Oil Palm Development, Cartagena de Indias, Columbia, 22–25 September 2009. [Google Scholar]
- Parker, I.M.; Gilbert, G.S. When there is no escape: The effects of natural enemies on native, invasive, and non-invasive plants. Ecology 2007, 88, 1210–1224. [Google Scholar] [CrossRef] [PubMed]
- Chung, G.F. Effect of pests and diseases on oil palm yield. In Palm Oil; Lai, O.M., Tan, C.P., Akoh, C.C., Eds.; AOCS Press: Champaign, IL, USA, 2012; pp. 163–210. [Google Scholar]
- Ariffin, D.; Seman, I.A. A selective medium for the isolation of Ganoderma from diseased tissues. In Proceedings of the PORIM International Palm Oil Conference. Progress, Prospects Challenges Towards the 21st Century, Kuala Lumpur, Malaysia, 9–14 September 1993. [Google Scholar]
- Idris, A.S.; Rafidah, R. Enzyme linked immunosorbent assay-polyclonal antibody (ELISA-PAb). MPOB Inf. Ser. 2008, 430, 1–4. [Google Scholar]
- Kandan, A.; Bhaskaran, R.; Samiyappan, R. Ganoderma: A basal stem rot disease of coconut palm in south Asia and Asia pacific regions. Phytopathol. Plant Prot. 2010, 43, 1445–1449. [Google Scholar] [CrossRef]
- Madihah, A.Z.; Idris, A.S.; Rafidah, A.R. Polyclonal antibodies of Ganoderma boninense isolated from Malaysian oil palm for detection of basal stem rot disease. Afr. J. Biotechnol. 2014, 13, 3455–3463. [Google Scholar] [CrossRef]
- Markom, M.A.; Shakaff, A.M.; Adom, A.H.; Ahmad, M.N.; Hidayat, W.; Abdullah, A.H.; Fikri, N.A. Intelligent electronic nose system for basal stem rot disease detection. Comput. Electron. Agric. 2009, 66, 140–146. [Google Scholar] [CrossRef]
- Kresnawaty, I.; Mulyatni, A.S.; Eris, D.D.; Prakoso, H.T.; Triyana, K.; Widiastuti, H. Electronic nose for early detection of basal stem rot caused by Ganoderma in oil palm. In IOP Conference Series: Earth and Environmental Science; IOP Publishing: Bristol, UK, 2020; p. 012029. [Google Scholar]
- Khaled, A.Y.; Aziz, S.A.; Bejo, S.K.; Nawi, N.M.; Abu Seman, I. Spectral features selection and classification of oil palm leaves infected by Basal stem rot (BSR) disease using dielectric spectroscopy. Comput. Electron. Agric. 2018, 144, 297–309. [Google Scholar] [CrossRef]
- Khaled, A.Y.; Aziz, S.A.; Bejo, S.K.; Nawi, N.M.; Abu Seman, I.; Izzuddin, M.A. Development of classification models for basal stem rot (BSR) disease in oil palm using dielectric spectroscopy. Ind. Crop. Prod. 2018, 124, 99–107. [Google Scholar] [CrossRef]
- Mazliham, M.S.; Pierre, L.; Idris, A.S. Towards automatic recognition and grading of Ganoderma infection pattern using fuzzy systems. Eng. Comput. Technol. 2008, 19, 1–6. [Google Scholar]
- Arango, M.; Martínez, G.; Torres, G. Advances in the interpretation of tomographic images as an early detection method of oil palm affected by basal stem rot in Colombia. Plant Dis. 2016, 100, 1559–1563. [Google Scholar] [CrossRef][Green Version]
- Bejo, S.; Abdol-Lajis, G.; Abd-Aziz, S.; Abu-Seman, I.; Ahamed, T. Detecting Basal Stem Rot (BSR) disease at oil palm tree using thermal imaging technique. In Proceedings of the 14th International Conference on Precision Agriculture, Montreal, QC, Canada, 24–27 June 2018. [Google Scholar]
- Mohd Johari, S.N.A.; Khairunniza-Bejo, S.; Abdol Lajis, G.; Jeffery Daim, L.D.; Neoh, B.K.; Yap, Y.C.; Ithnin, N. Detecting BSR-Infected Oil Palm Seedling using Thermal Imaging Technique. Basrah J. Agric. Sci. 2021, 34, 73–80. [Google Scholar] [CrossRef]
- Khairunniza-Bejo, S.; Yusoff, Y.; Yusoff, N.S.N.; Seman, I.A.; Anuar, M.I. Identification of healthy and BSR-infected oil palm trees using color indices. Int. J. Agric. Biosyst. Eng. 2015, 9, 785–788. [Google Scholar]
- Santoso, H.; Gunawan, T.; Jatmiko, R.H.; Darmosarkoro, W.; Minasny, B. Mapping and identifying basal stem rot disease in oil palms in North Sumatra with QuickBird imagery. Precis. Agric. 2011, 12, 233–248. [Google Scholar] [CrossRef]
- Ahmadi, P.; Muharam, F.M.; Ahmad, K.; Mansor, S.; Abu Seman, I. Early detection of Ganoderma basal stem rot of oil palms using artificial neural network spectral analysis. Plant Dis. 2017, 101, 1009–1016. [Google Scholar] [CrossRef]
- Azmi, A.N.N.; Bejo, S.K.; Jahari, M.; Muharam, F.M.; Yule, I.; Husin, N.A. Early detection of Ganoderma boninense in oil palm seedlings using support vector machines. Remote Sens. 2020, 12, 3920. [Google Scholar] [CrossRef]
- Izzuddin, M.A.; Idris, A.S.; Wahid, O.; Nishfariza, M.N.; Shafri, H.Z.M. Field Spectroscopy for Detection of Ganoderma Disease in Oil Palm; MPOB Information Series No.532; MPOB: Bandar Baru Bangi, Malaysia, 2013. [Google Scholar]
- Lelong, C.C.; Roger, J.M.; Brégand, S.; Dubertret, F.; Lanore, M.; Sitorus, N.A.; Caliman, J.P. Evaluation of oil-palm fungal disease infestation with canopy hyperspectral reflectance data. Sensors 2010, 10, 734–747. [Google Scholar] [CrossRef]
- Liaghat, S.; Mansor, S.; Ehsani, R.; Shafri, H.Z.M.; Meon, S.; Sankaran, S. Mid-infrared spectroscopy for early detection of basal stem rot disease in oil palm. Comput. Electron. Agric. 2014, 101, 48–54. [Google Scholar] [CrossRef]
- Shafri, H.Z.M.; Anuar, M.I.; Seman, I.A.; Noor, N.M. Spectral discrimination of healthy and Ganoderma-infected oil palms from hyperspectral data. Int. J. Remote Sens. 2011, 32, 7111–7129. [Google Scholar] [CrossRef]
- Khairunniza-Bejo, S.; Vong, C.N. Detection of basal stem rot (BSR) infected oil palm tree using laser scanning data. Agric. Agric. Sci. Procedia 2014, 2, 156–164. [Google Scholar] [CrossRef]
- Husin, N.A.; Khairunniza–Bejo, S.; Abdullah, A.F.; Kassim, M.S.M.; Ahmad, D. Study of the oil palm crown characteristics associated with Basal Stem Rot (BSR) disease using stratification method of point cloud data. Comput. Electron. Agric. 2020, 178, 105810. [Google Scholar] [CrossRef]
- Husin, N.A.; Khairunniza-Bejo, S.; Abdullah, A.F.; Kassim, M.S.; Ahmad, D.; Azmi, A.N. Application of ground-based LiDAR for analysing oil palm canopy properties on the occurrence of Basal Stem Rot (BSR) disease. Sci. Rep. 2020, 10, 1–16. [Google Scholar]
- Husin, N.A.; Khairunniza-Bejo, S.; Abdullah, A.F.; Kassim, M.S.; Ahmad, D.; Aziz, M.H. Classification of Basal Stem Rot disease in oil palm plantations using terrestrial laser scanning data and machine learning. Agronomy 2020, 10, 1624. [Google Scholar] [CrossRef]
- Nur, A.H.; Khairunniza-Bejo, S.; Abdullah, A.F.; Kassim, M.S.; Ahmad, D. Multi-temporal analysis of terrestrial laser scanning data to detect basal stem rot in oil palm trees. Precis. Agric. 2021, 1–26. [Google Scholar] [CrossRef]
- Maryam, K.; Khairunniza-Bejo, S.; Biswajeet, P. Geospatial technologies for detection and monitoring of Ganoderma basal stem rot infection in oil palm plantations: A review on sensors and techniques. Geocarto Int. 2018, 33, 260–276. [Google Scholar]
- Mohd Hilmi Tan, M.I.S.; Jamlos, M.F.; Omar, A.F.; Dzaharudin, F.; Chalermwisutkul, S.; Akkaraekthalin, P. Ganoderma boninense disease detection by near-infrared spectroscopy classification: A review. Sensors 2021, 21, 3052. [Google Scholar] [CrossRef]
- Azmi, A.N.N.; Bejo, S.K.; Jahari, M.; Muharam, F.M.; Yule, I. Differences between healthy and Ganoderma boninense infected oil palm seedlings using spectral reflectance of young leaf data. Basrah J. Agric. Sci. 2021, 34, 171–179. [Google Scholar] [CrossRef]
- Wiratmoko, D.; Prasetyo, A.E.; Jatmiko, R.H.; Yusuf, M.A.; Rahutomo, S. Identification of Ganoderma boninense infection levels on oil palm using vegetation index. Int. J. Oil Palm 2018, 1, 110–120. [Google Scholar]
- Shafri, H.Z.M.; Anuar, M.I. Hyperspectral signal analysis for detecting disease infection in oil palms. In Proceedings of the International Conference on Computer and Electrical Engineering 2008, Phuket, Thailand, 20–22 December 2008; IEEE: New York, NY, USA, 2008. [Google Scholar]
- Izzuddin, M.A.; Seman Idris, A.; Nisfariza, M.N.; Nordiana, A.A.; Shafri, H.Z.M.; Ezzati, B. The development of spectral indices for early detection of Ganoderma disease in oil palm seedlings. Int. J. Remote Sens. 2017, 38, 6505–6527. [Google Scholar] [CrossRef]
- Shafri, H.Z.M.; Hamdan, N.; Izzuddin, M.A. Detection of stressed oil palms from an airborne sensor using optimized spectral indices. Int. J. Remote Sens. 2012, 33, 4293–4311. [Google Scholar] [CrossRef]
- Benos, L.; Tagarakis, A.C.; Dolias, G.; Berruto, R.; Kateris, D.; Bochtis, D. Machine learning in agriculture: A comprehensive updated review. Sensors 2021, 21, 3758. [Google Scholar] [CrossRef] [PubMed]
- Kaur, P.; Pannu, H.S.; Malhi, A.K. Plant disease recognition using fractional-order Zernike moments and SVM classifier. Neural Comput. Appl. 2019, 31, 8749–8768. [Google Scholar] [CrossRef]
- Shafri, H.Z.M.; Anuar, M.I.; Saripan, M.I. Modified vegetation indices for Ganoderma disease detection in oil palm from field spectroradiometer data. J. Appl. Remote Sens. 2009, 3, 033556. [Google Scholar]
- Tawfik, O.; Shafri, H.M.; Mohammed, A.A. Disease detection from field spectrometer data. IIUM Eng. J. 2013, 14, 133–143. [Google Scholar] [CrossRef]
- Santoso, H.; Tani, H.; Wang, X.; Prasetyo, A.E.; Sonobe, R. Classifying the severity of basal stem rot disease in oil palm plantations using WorldView-3 imagery and machine learning algorithms. Int. J. Remote Sens. 2019, 40, 7624–7646. [Google Scholar] [CrossRef]
- Abdullah, A.H.; Adom, A.H.; Shakaff, A.Y.M.; Ahmad, M.N.; Zakaria, A.; Saad, F.S.A.; Isa, C.M.N.C.; Masnan, M.J.; Kamarudin, L.M. Hand-held electronic nose sensor selection system for basal stamp rot (BSR) disease detection. In Proceedings of the 2012 Third International Conference on Intelligent Systems Modelling and Simulation, Kota Kinabalu, Malaysia, 8–10 February 2012; IEEE: New York, NY, USA, 2012; pp. 737–742. [Google Scholar]
- Hashim, I.C.; Shariff, A.R.M.; Bejo, S.K.; Muharam, F.M.; Ahmad, K. Machine learning approach using sar data for the classification of oil palm trees that are non-infected and infected with the Basal Stem Rot disease. Agronomy 2021, 11, 532. [Google Scholar] [CrossRef]
- Liaghat, S.; Ehsani, R.; Mansor, S.; Shafri, H.Z.; Meon, S.; Sankaran, S.; Azam, S.H. Early detection of basal stem rot disease (Ganoderma) in oil palms based on hyperspectral reflectance data using pattern recognition algorithms. Int. J. Remote Sens. 2014, 35, 3427–3439. [Google Scholar] [CrossRef]
- Nababan, M.; Laia, Y.; Sitanggang, D.; Sihombing, O.; Indra, E.; Siregar, S.; Purba, W.; Mancur, R. The diagnose of oil palm disease using naive bayes method based on expert system technology. J. Phys. Conf. Ser. 2018, 1007, 012015. [Google Scholar] [CrossRef]
- Santoso, H.; Tani, H.; Wang, X. Random Forest classification model of basal stem rot disease caused by Ganoderma boninense in oil palm plantations. Int. J. Remote Sens. 2017, 38, 4683–4699. [Google Scholar] [CrossRef]
- MathWorks. Available online: https://www.mathworks.com/help/stats/choose-a-classifier.html (accessed on 30 September 2020).
- Yang, S.; Berdine, G. The receiver operating characteristic (ROC) curve. Southwest Respir. Crit. Care Chron. 2017, 5, 34. [Google Scholar] [CrossRef]
- Pimentel-Gomes, F. Curso de Estatística Experimental, 15th ed.; FEALQ: Piracicaba, Brazil, 2009. [Google Scholar]
- Mahlein, A.K.; Kuska, M.T.; Behmann, J.; Polder, G.; Walter, A. Hyperspectral sensors and imaging technologies in phytopathology: State of the art. Annu. Rev. Phytopathol. 2018, 56, 535–558. [Google Scholar] [CrossRef]
- Zhang, J.; Huang, Y.; Pu, R.; Gonzalez-Moreno, P.; Yuan, L.; Wu, K.; Huang, W. Monitoring plant diseases and pests through remote sensing technology: A review. Comput. Electron. Agric. 2019, 165, 104943. [Google Scholar] [CrossRef]
- Mahlein, A.K.; Rumpf, T.; Welke, P.; Dehne, H.W.; Plumer, L.; Steiner, U.; Oerke, E.C. Development of spectral indices for detecting and identifying plant diseases. Remote Sens. Environ. 2013, 128, 21–30. [Google Scholar] [CrossRef]
- Wu, D.; Feng, L.; Zhang, C.; He, Y. Early detection of botrytis cinerea on eggplant leaves based on visible and near-infrared spectroscopy. Trans. ASABE 2008, 51, 1133–1139. [Google Scholar] [CrossRef]
- Chen, B.; Wang, K.; Li, S.; Wang, J.; Bai, J.; Xiao, C.; Lai, J. Spectrum characteristics of cotton canopy infected with verticillium wilt and inversion of severity level. In Computer and Computing Technologies in Agriculture; Li, D., Ed.; Spinger: Boston, MA, USA, 2008; Volume II, pp. 1169–1180. [Google Scholar]
- Delalieux, S.; van Aardt, J.; Keulemans, W.; Schrevens, E.; Coppin, P. Detection of biotic stress (Venturia inaequalis) in apple trees using hyperspectral data: Non-parametric statistical approaches and physiological implications. Eur. J. Agron. 2007, 27, 130–143. [Google Scholar] [CrossRef]
- Pearson, T.C.; Wicklow, D.T. Detection of corn kernels infected by fungi. Trans. ASABE 2006, 49, 1235–1245. [Google Scholar] [CrossRef]
- Arnnyitte, A.; Jedol, D.; Coswald, S.S.; Phin, C.; Chin, L. Some interpretations on FTIR results for the detection of Ganoderma boninense in oil palm tissue. Adv. Environ. Biol. 2014, 8, 30–32. [Google Scholar]
- Abdullah, A.H.; Shakaff, A.Y.M.; Adom, A.H.; Ahmad, M.N.; Zakaria, A.; Ghani, S.A.; Samsudin, N.M.; Saad, F.S.A.; Kamarudin, L.M.; Hamid, N.H.; et al. P2.1.7 Exploring MIP sensor of Basal Stem Rot (BSR) disease in palm oil plantation. In Proceedings of the Proceedings IMCS 2012, Nuremberg, Germany, 20–23 May 2012. [Google Scholar]
- A Guide to Near-Infrared Spectroscopic Analysis of Industrial Manufacturing Processes; British Grassland Society: Herisau, Switzerland, 2002.
- Bloem, E.; Gerighausen, H.; Chen, X.; Schnug, E. The potential of spectral measurements for identifying glyphosate application to agricultural fields. Agronomy 2020, 10, 1409. [Google Scholar] [CrossRef]
- Usha, K.; Singh, B. Potential applications of remote sensing in horticulture—A review. Sci. Hortic. 2013, 153, 71–83. [Google Scholar] [CrossRef]
- Gago, J.; Douthe, C.; Coopman, R.E.; Gallego, P.P.; Ribas-Carbo, M.; Flexas, J.; Escalona, J.; Medrano, H. UAVs challenge to assess water stress for sustainable agriculture. Agric. Water Manag. 2015, 153, 9–19. [Google Scholar] [CrossRef]
- Shi, J.Y.; Zou, X.B.; Zhao, J.W.; Mao, H.P.; Wang, K.L.; Chen, Z.W. NIR spectral non-invasive measurement of cucumber leaf chlorophyll content NDT near-infrared spectroscopy. J. Agric. Mach. 2011, 42, 178–182. [Google Scholar]
- Huang, H.; Wang, W.; Peng, Y.K.; Wu, J.H.; Gao, X.D.; Wang, X.; Zhang, J. Measurement of chlorophyll content in wheat leaves using hyperspectral scanning. Spectrosc. Spectr. Anal. 2010, 30, 1811–1814. [Google Scholar]
- Yang, H.Q.; Yao, J.S.; He, Y. SPAD prediction of leaf based on reflection spectroscopy. Spectrosc. Spectr. Anal. 2009, 29, 1607–1610. [Google Scholar]
- Liang, P.-S.; Slaughter, D.C.; Ortega-Beltran, A.; Michailides, T.J. Detection of fungal infection in almond kernels using near-infrared reflectance spectroscopy. Biosyst. Eng. 2015, 137, 64–72. [Google Scholar] [CrossRef]


Publisher’s Note: MDPI stays neutral with regard to jurisdictional claims in published maps and institutional affiliations. |
© 2021 by the authors. Licensee MDPI, Basel, Switzerland. This article is an open access article distributed under the terms and conditions of the Creative Commons Attribution (CC BY) license (https://creativecommons.org/licenses/by/4.0/).