
Effects of the Configuration of Trailing Edge on the Flutter of an Elongated Bluff Body

Abstract
:1. Introduction
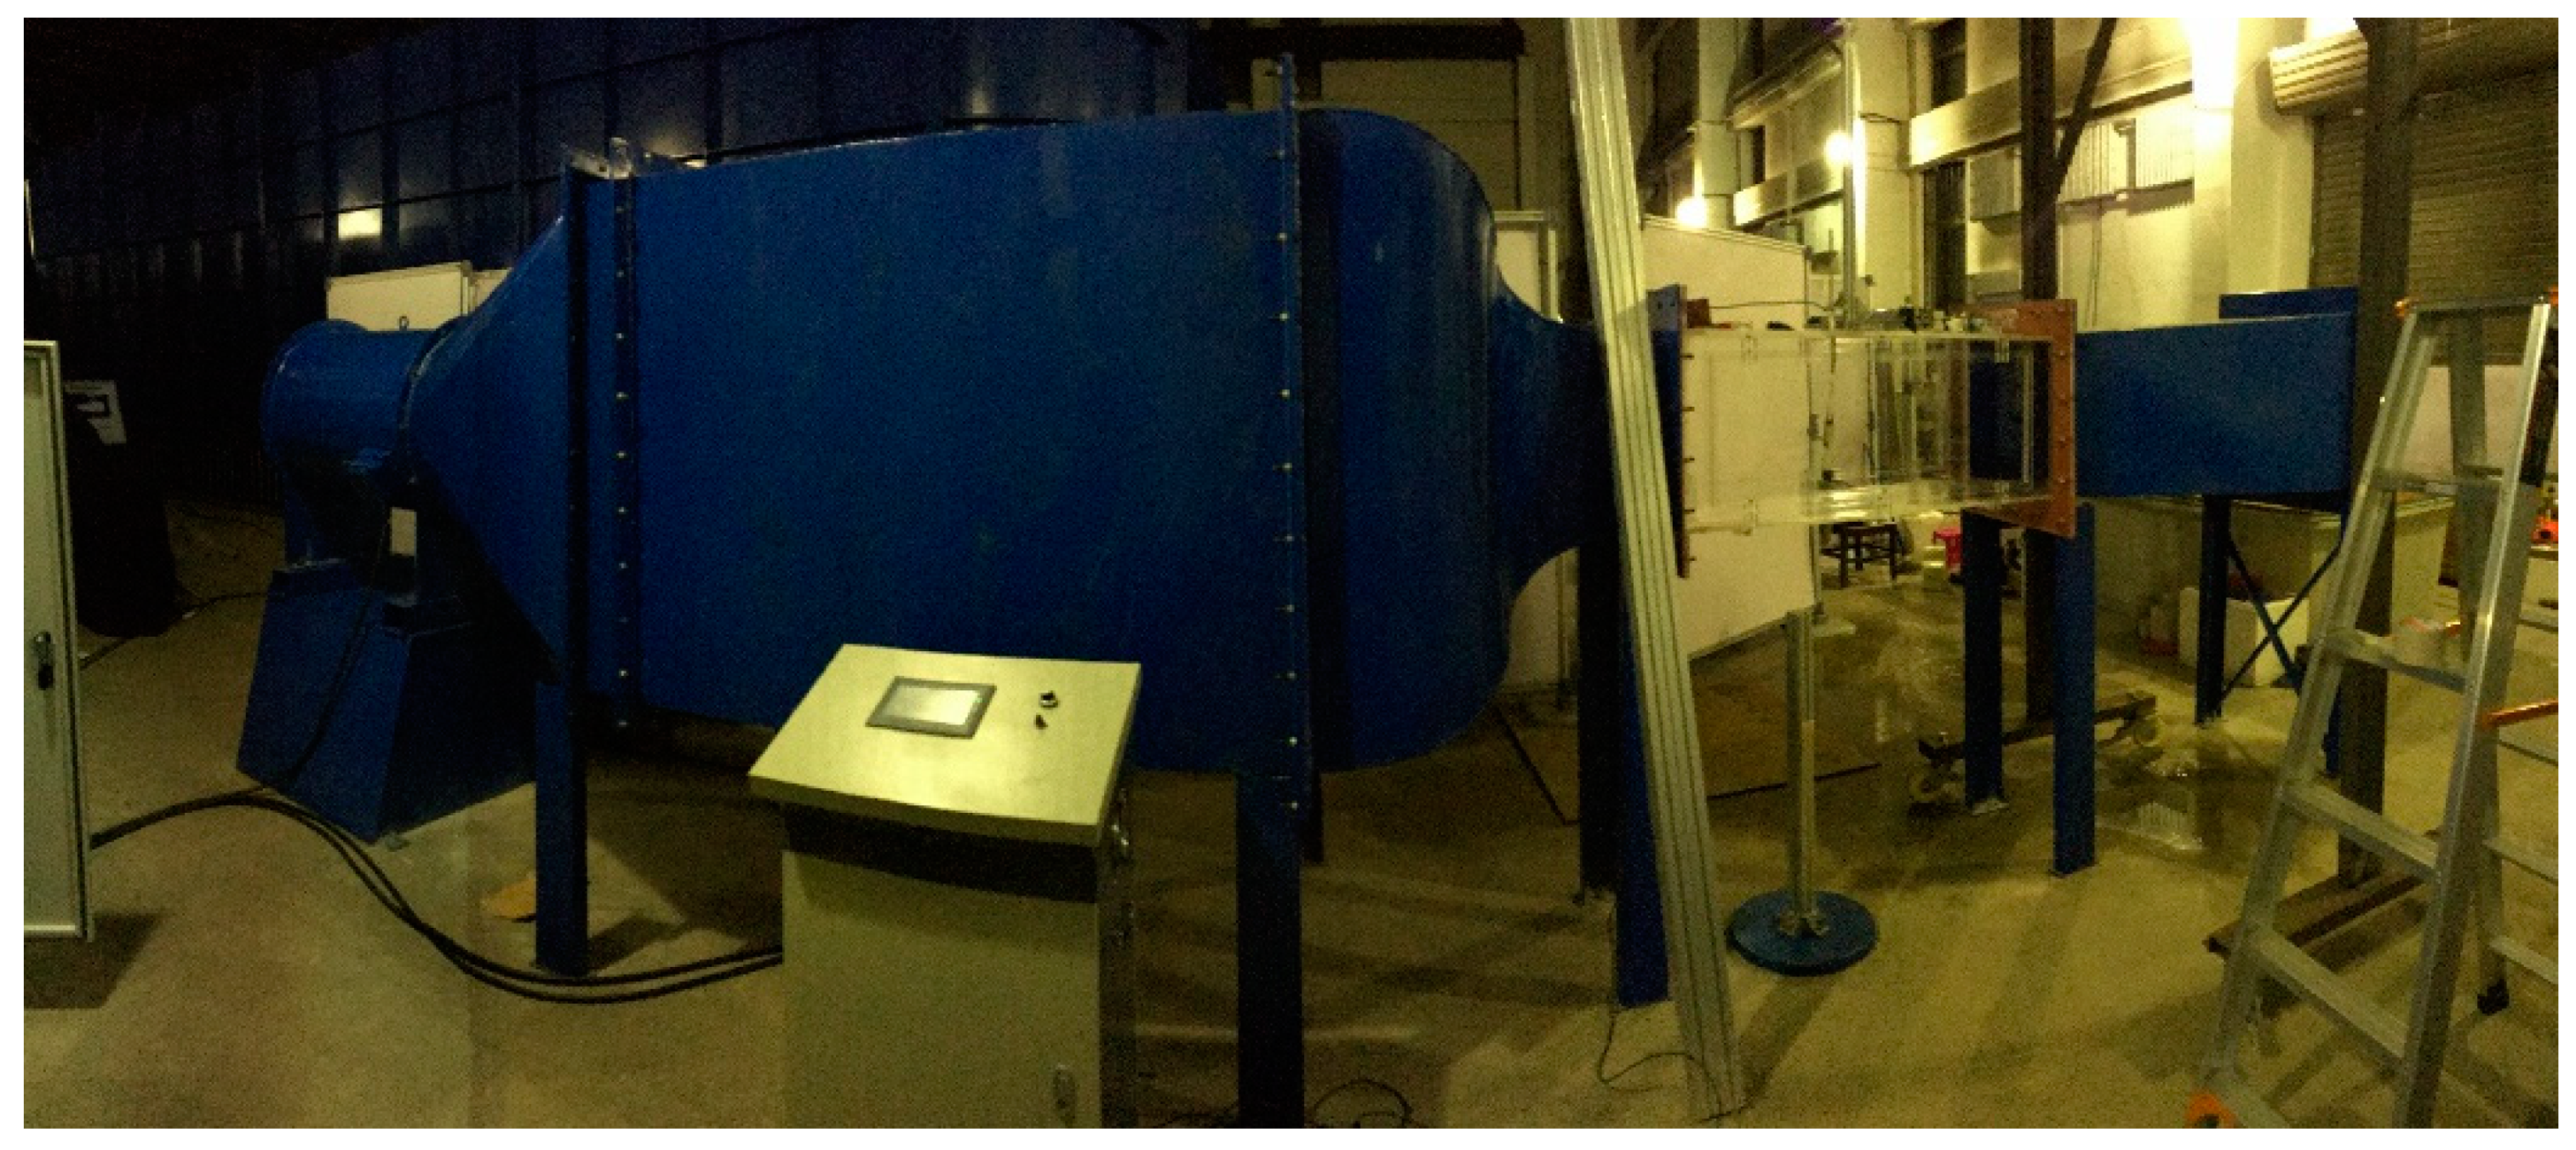
2. Experiment Setup
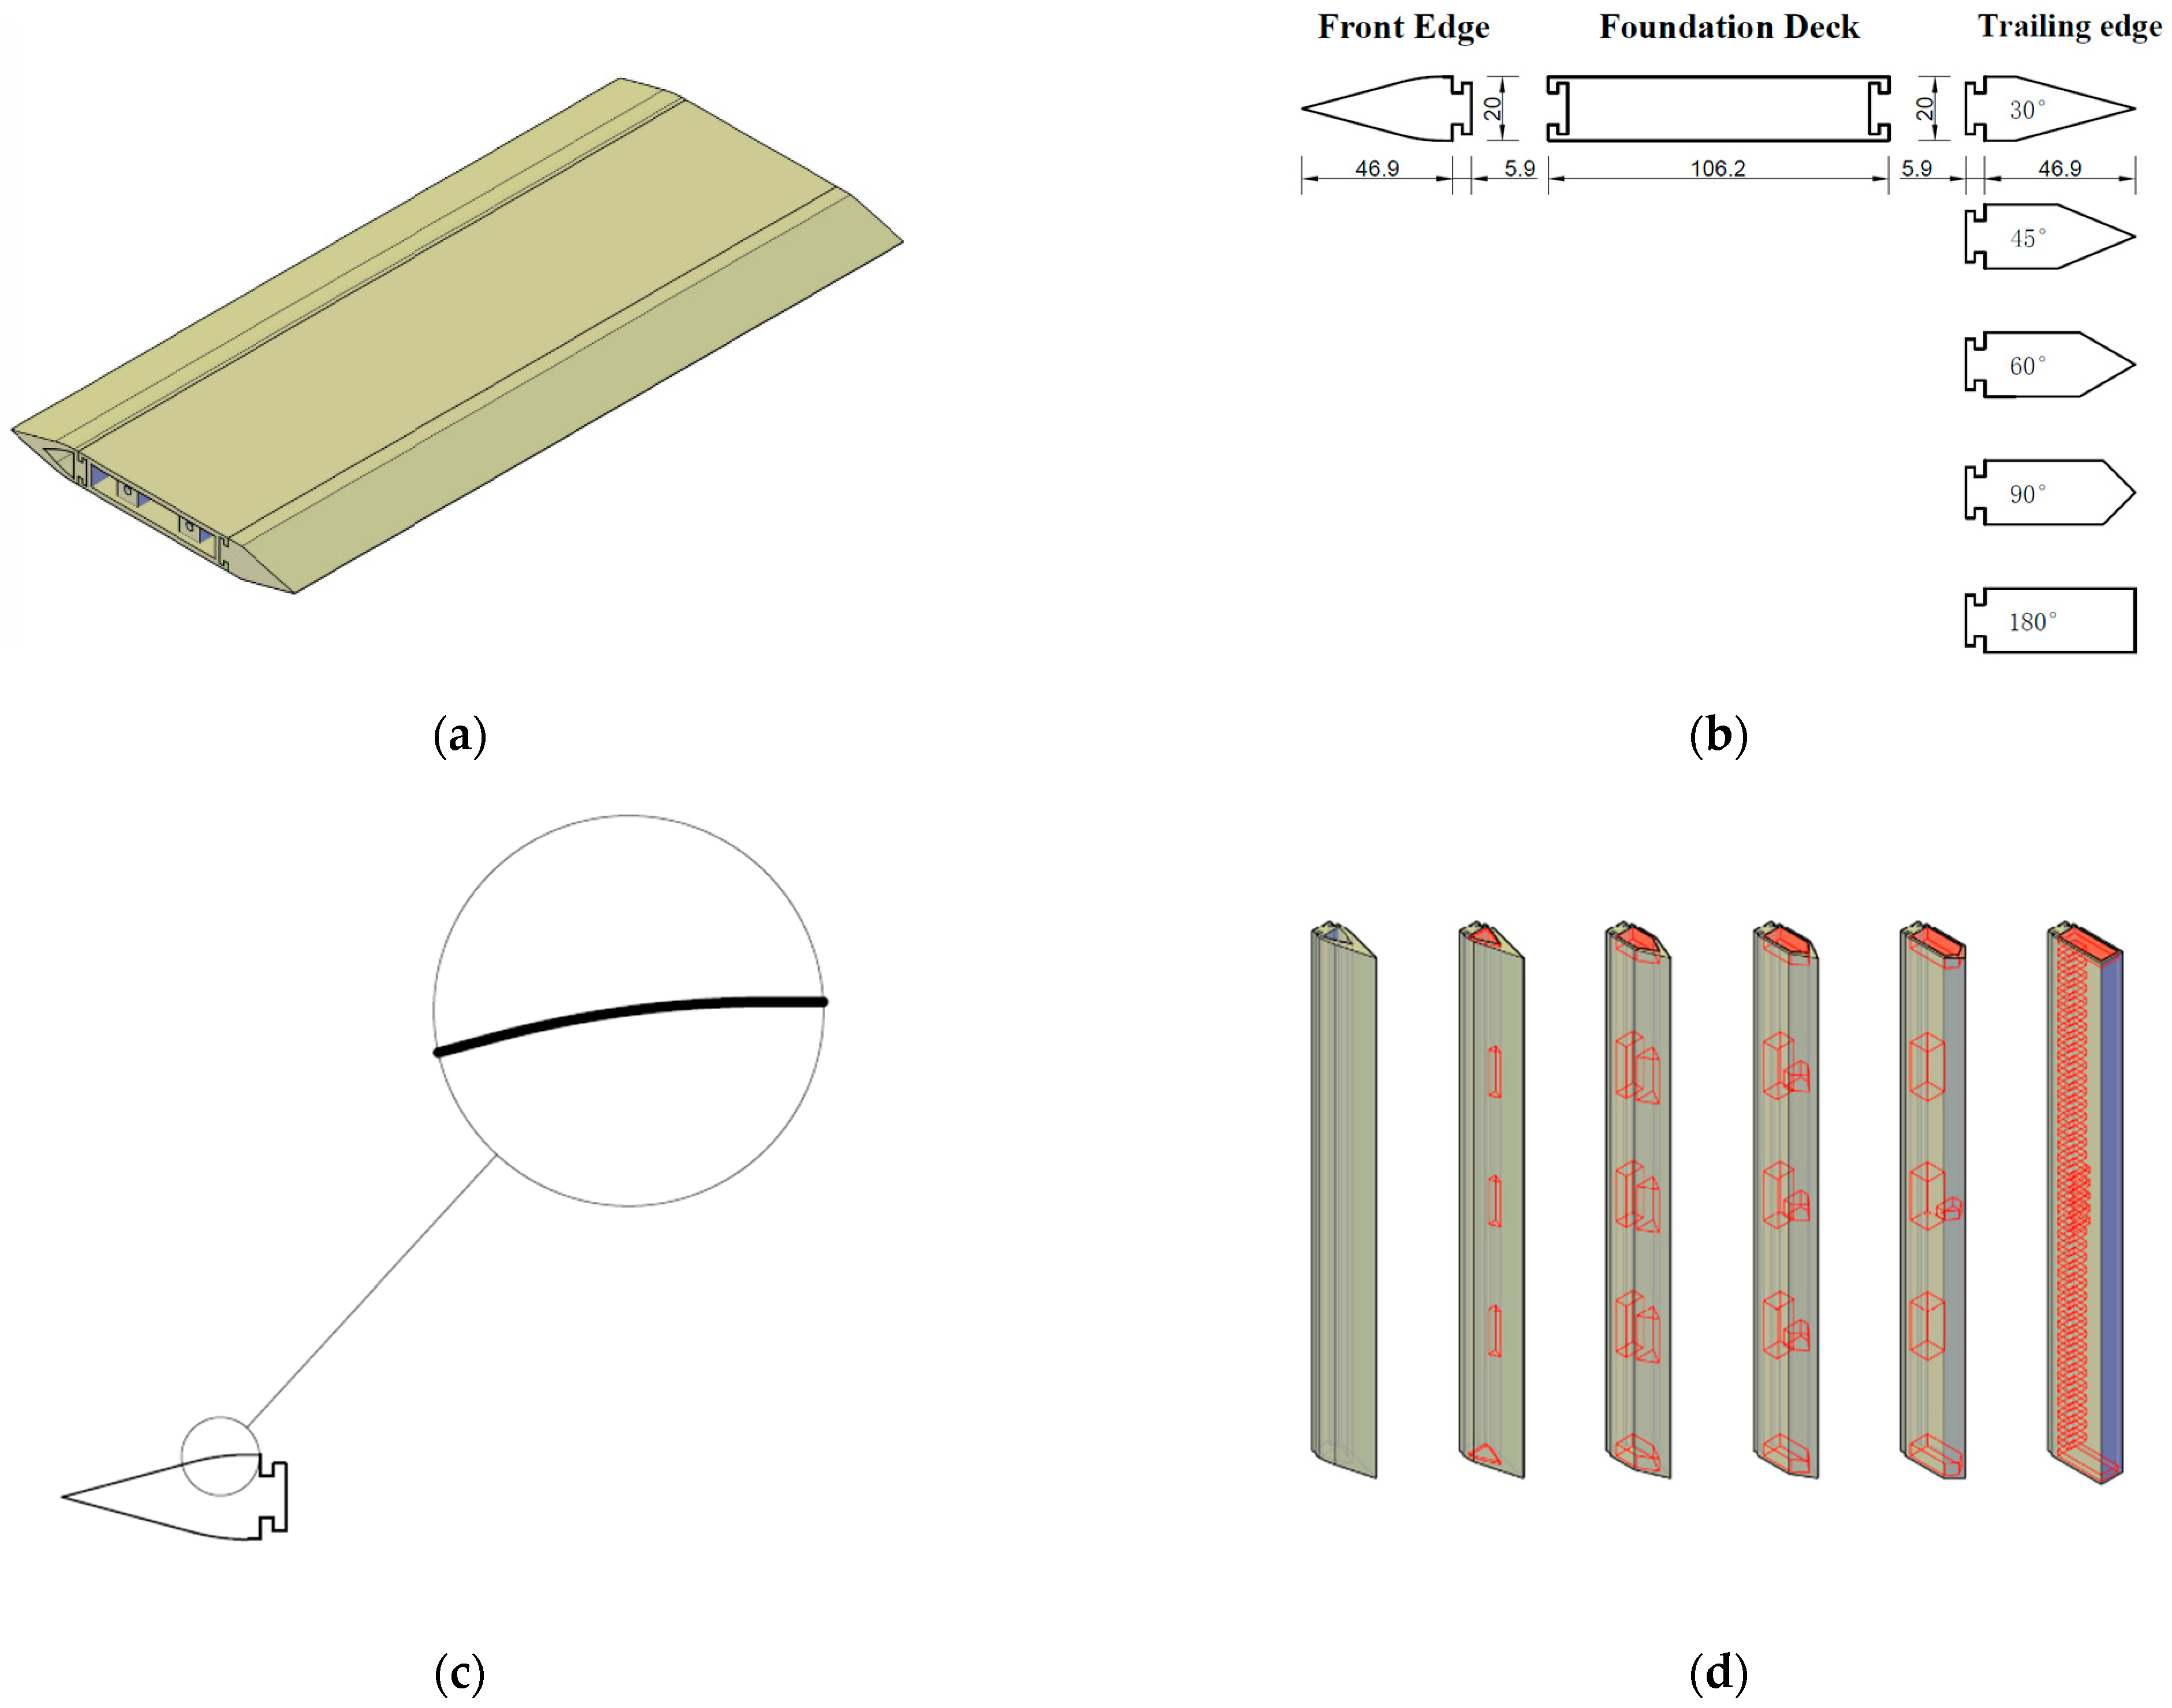
2.1. Model Details
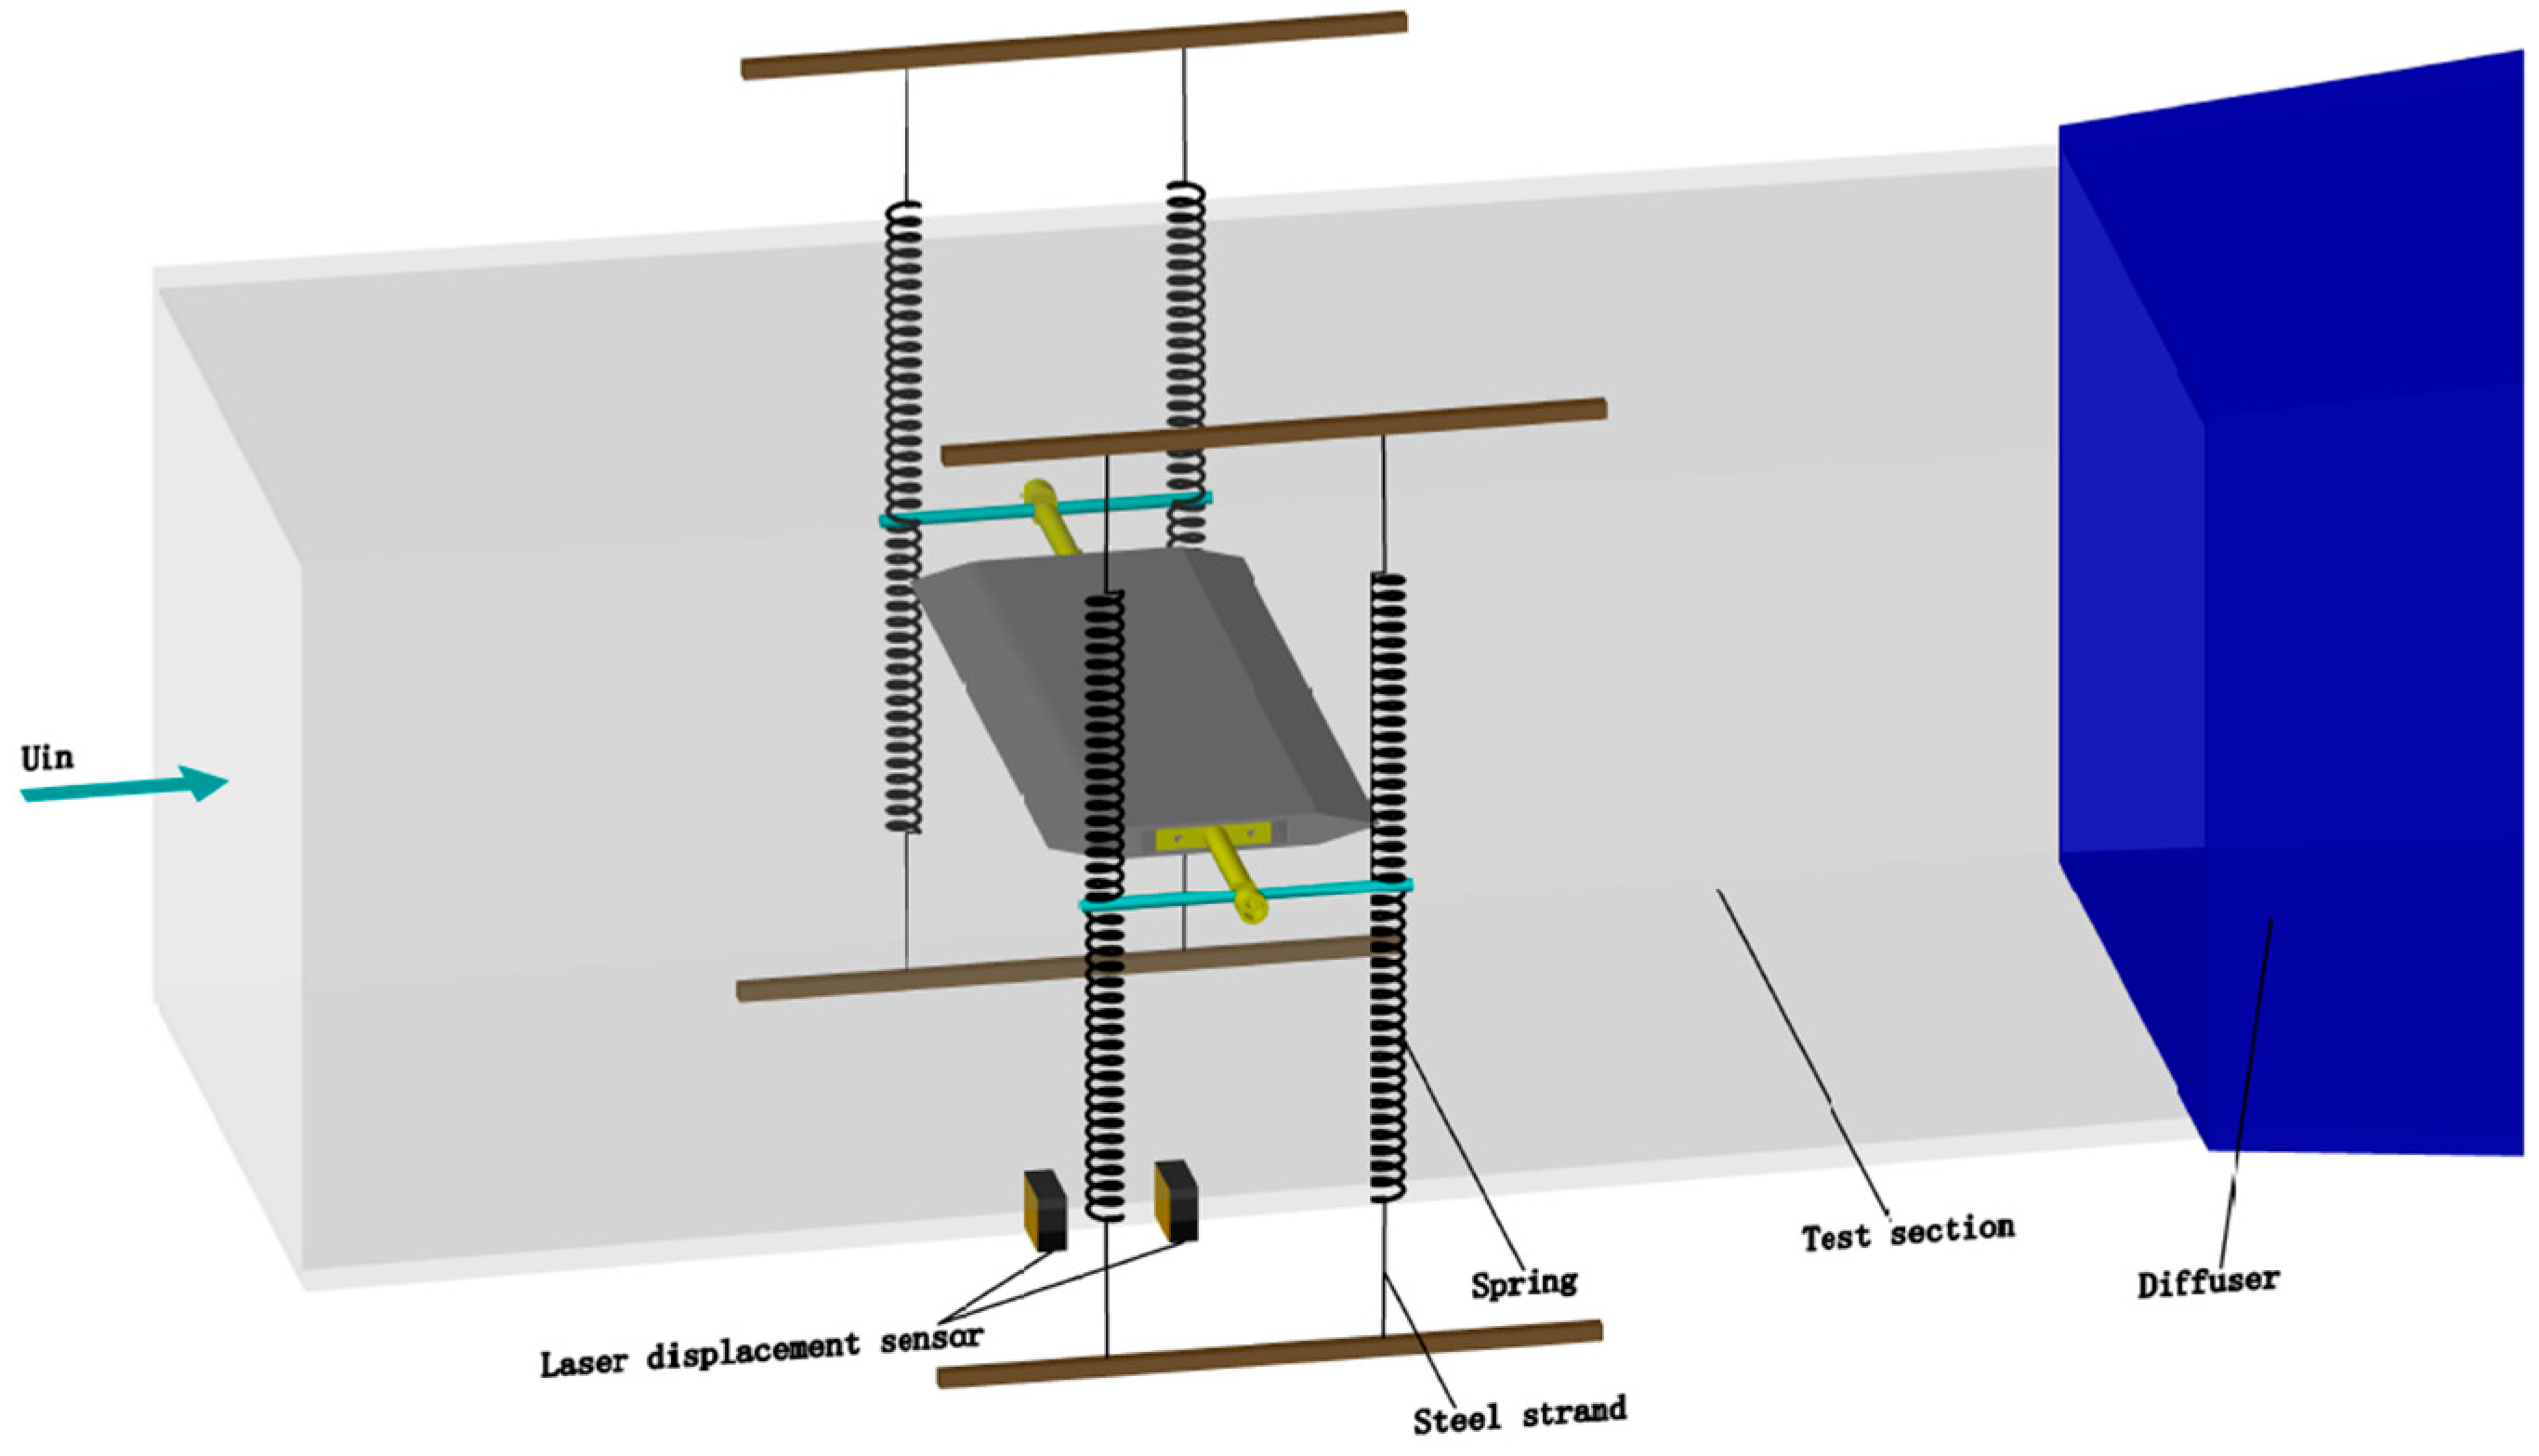
2.2. Measurement Details
3. Results and Discussions
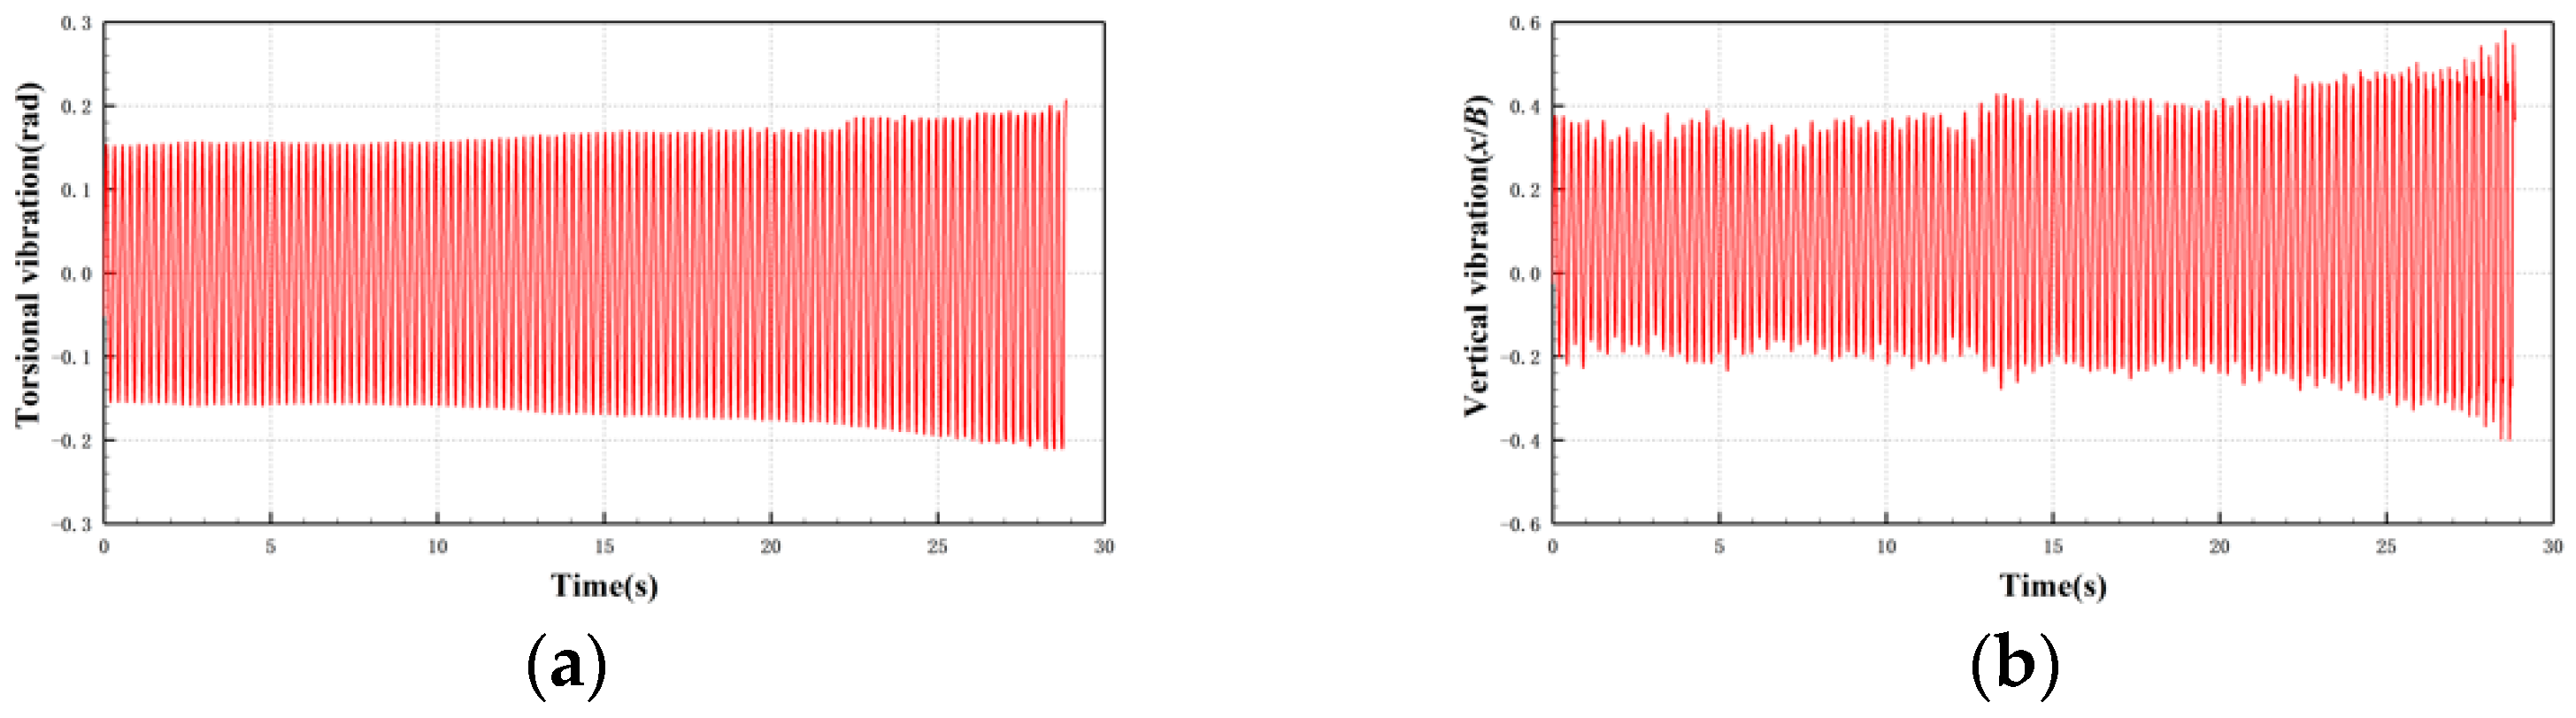
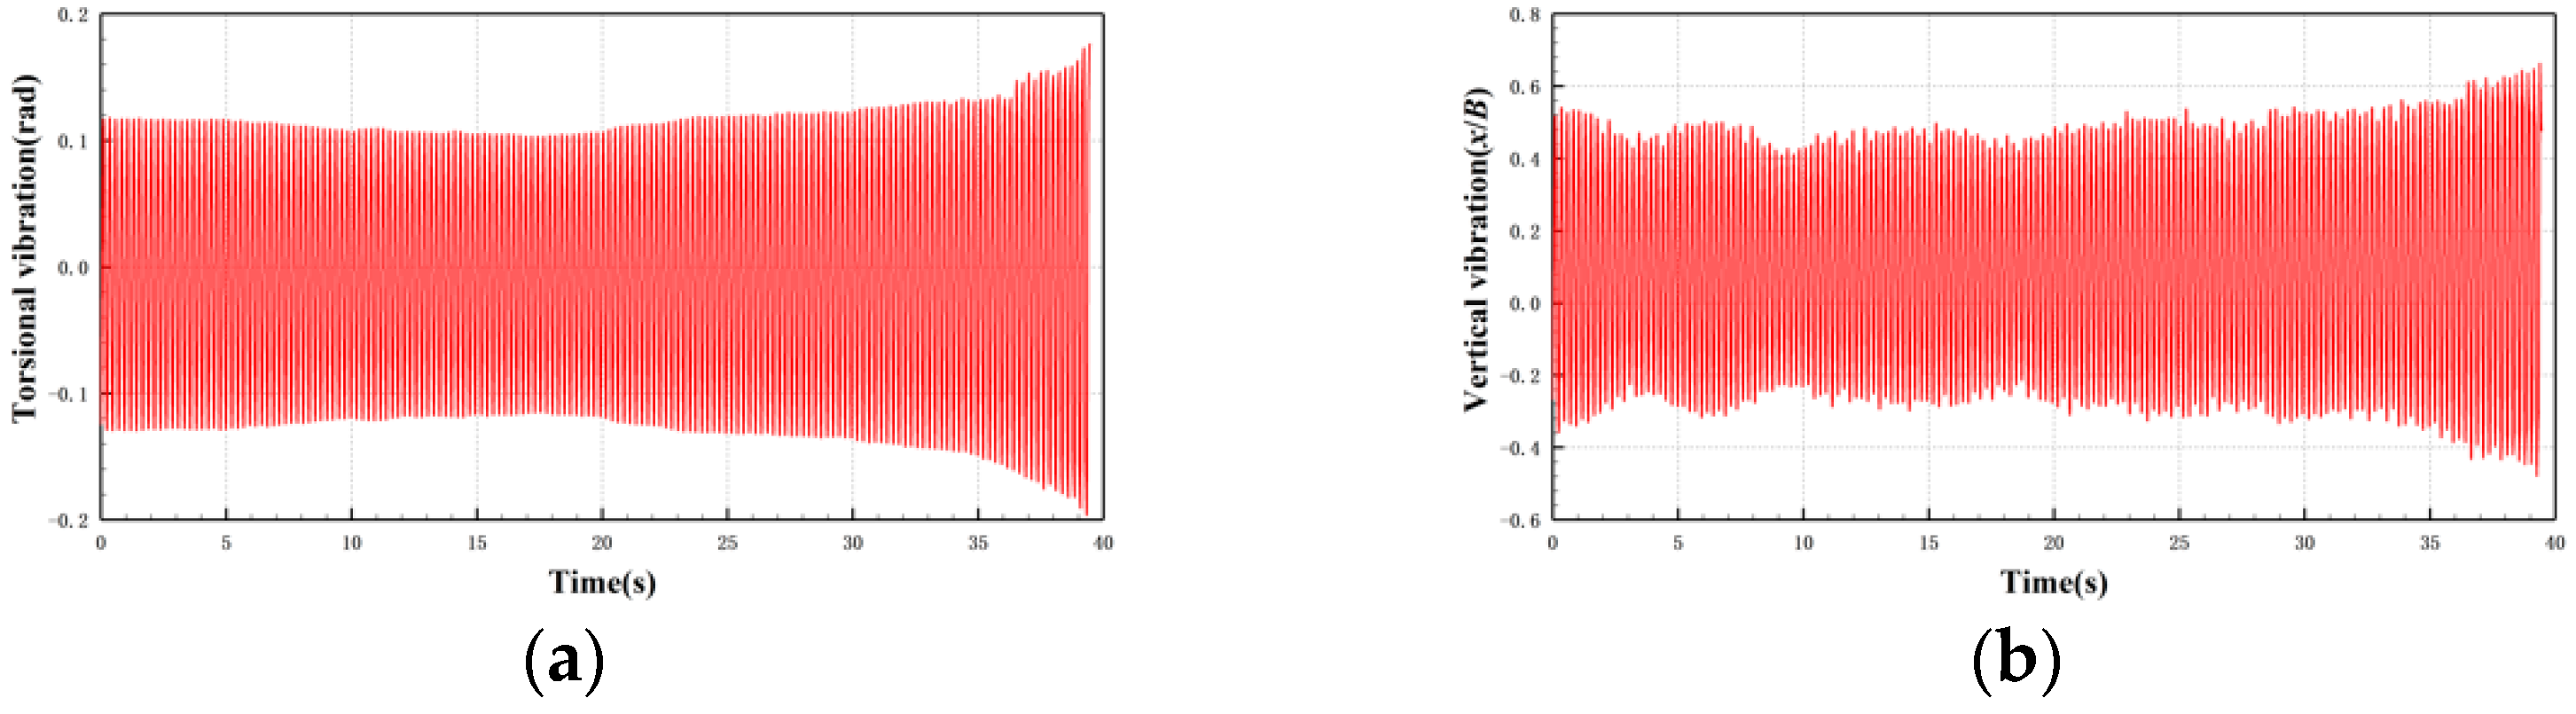
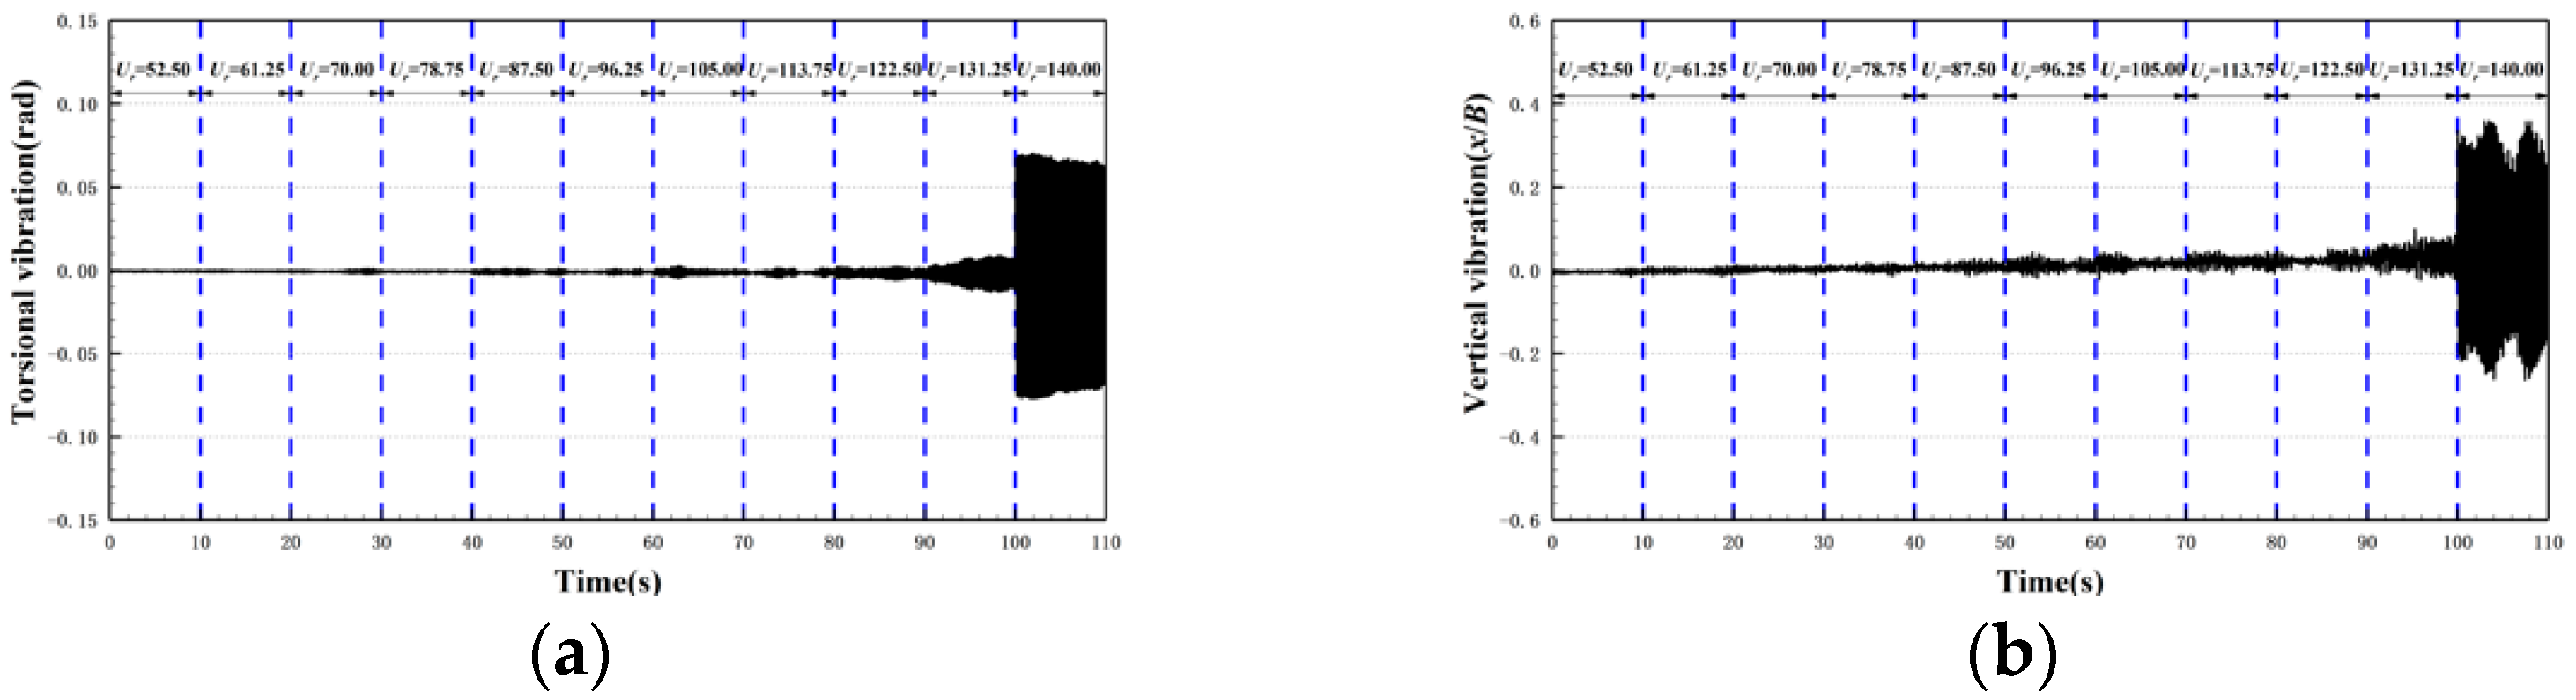
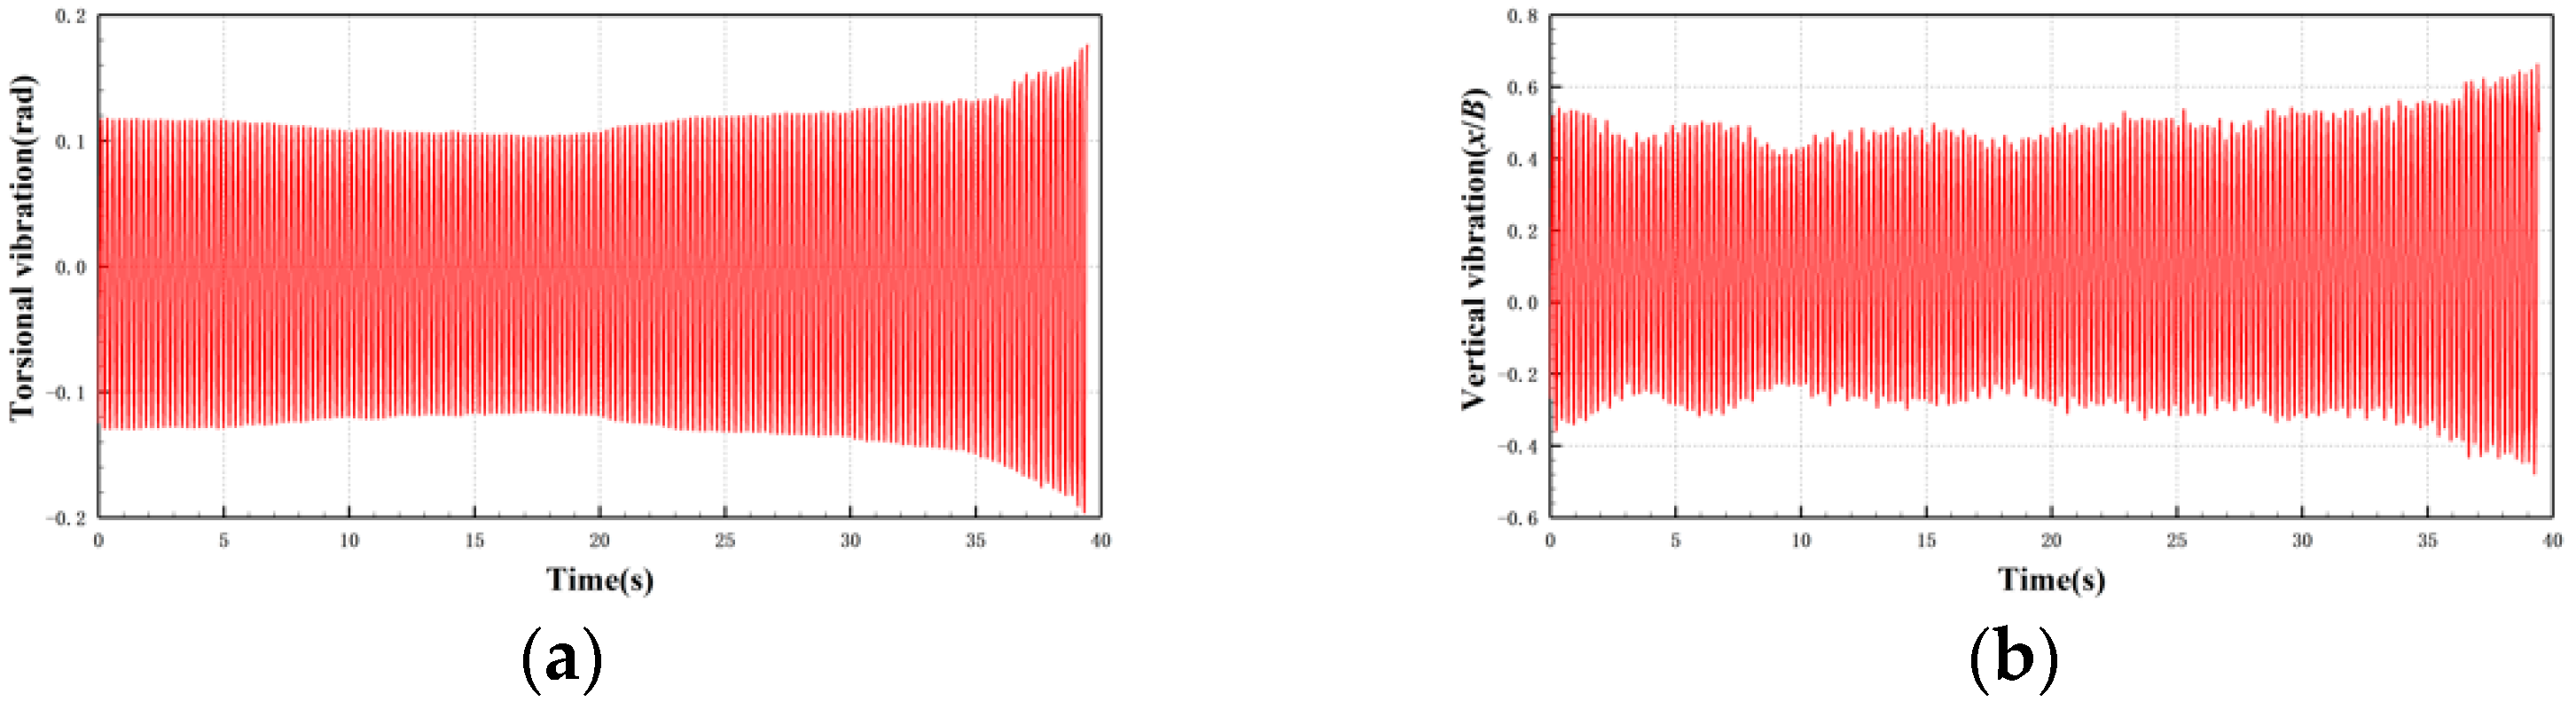
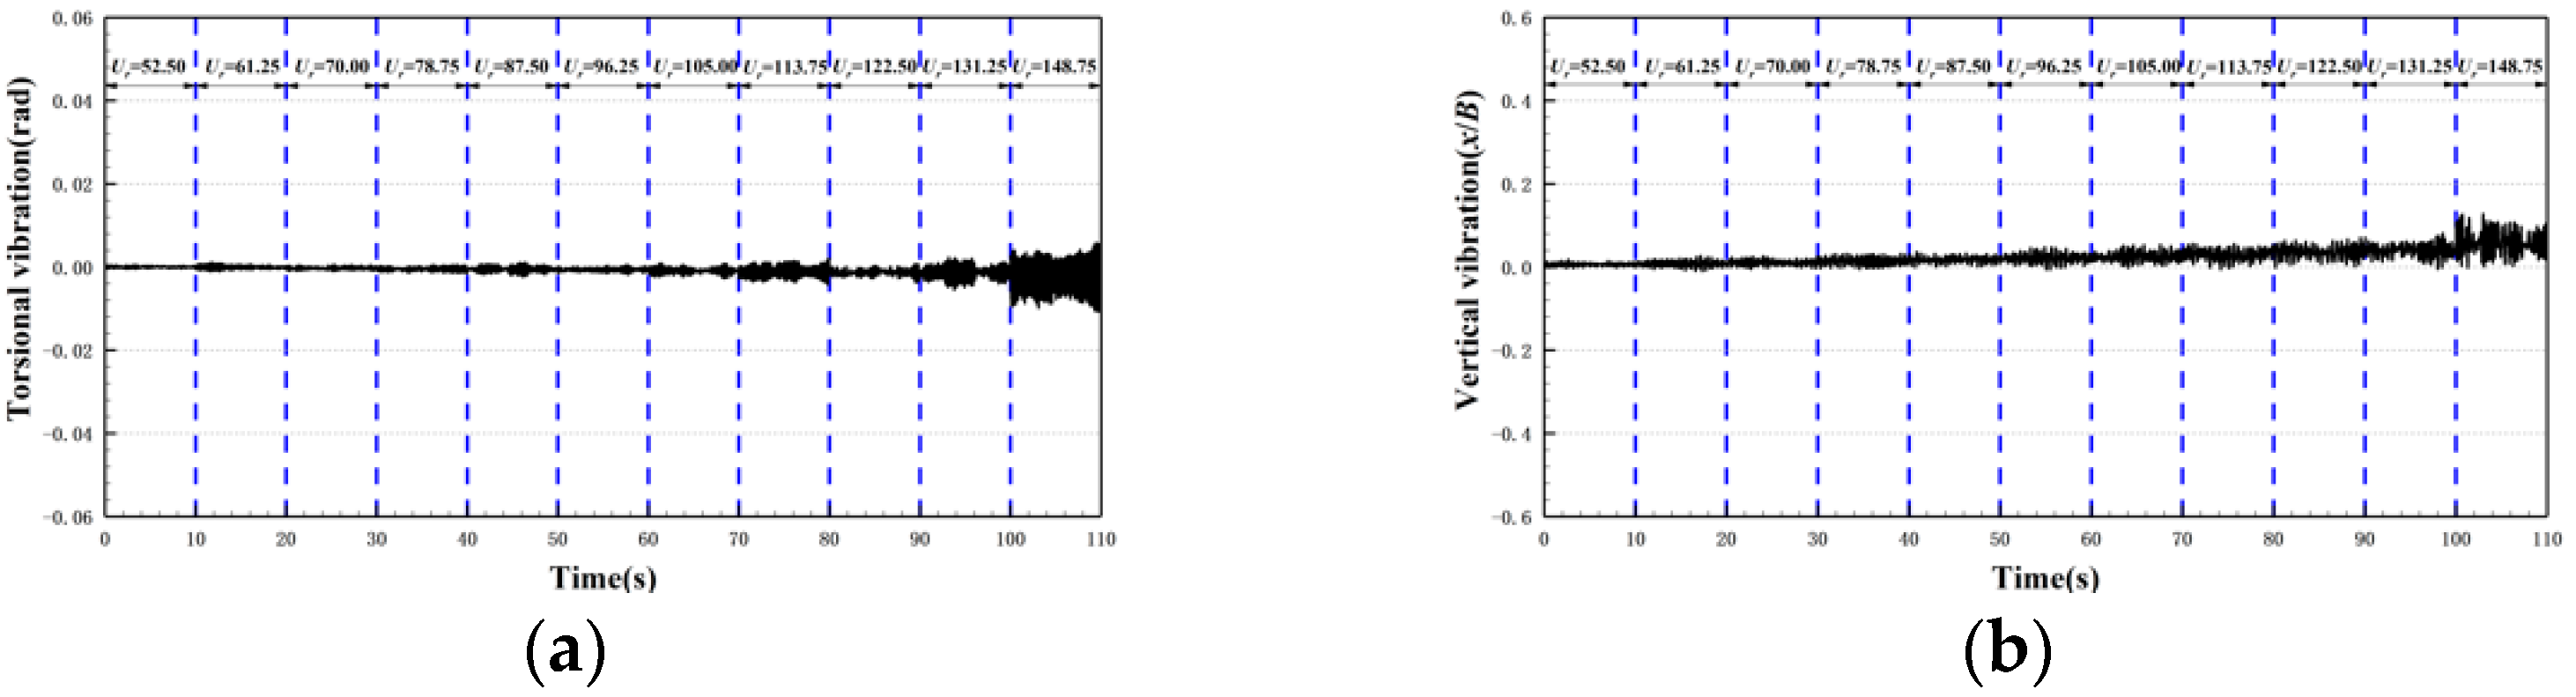
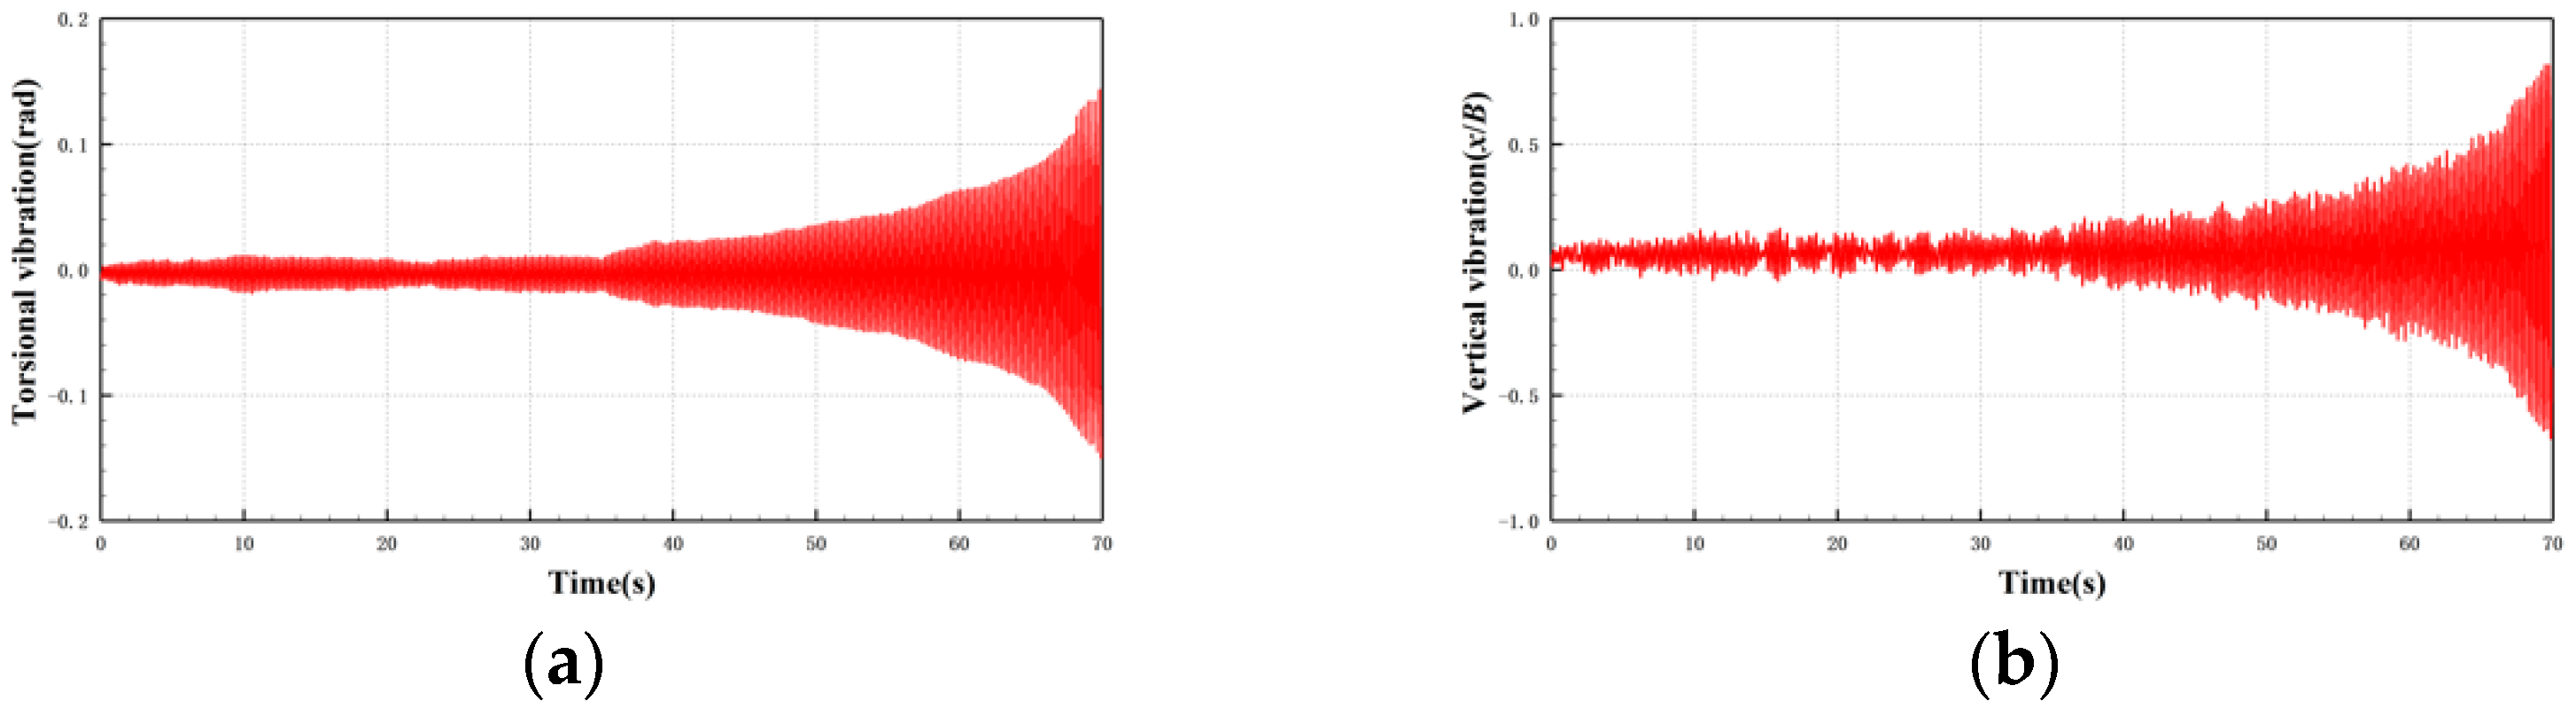
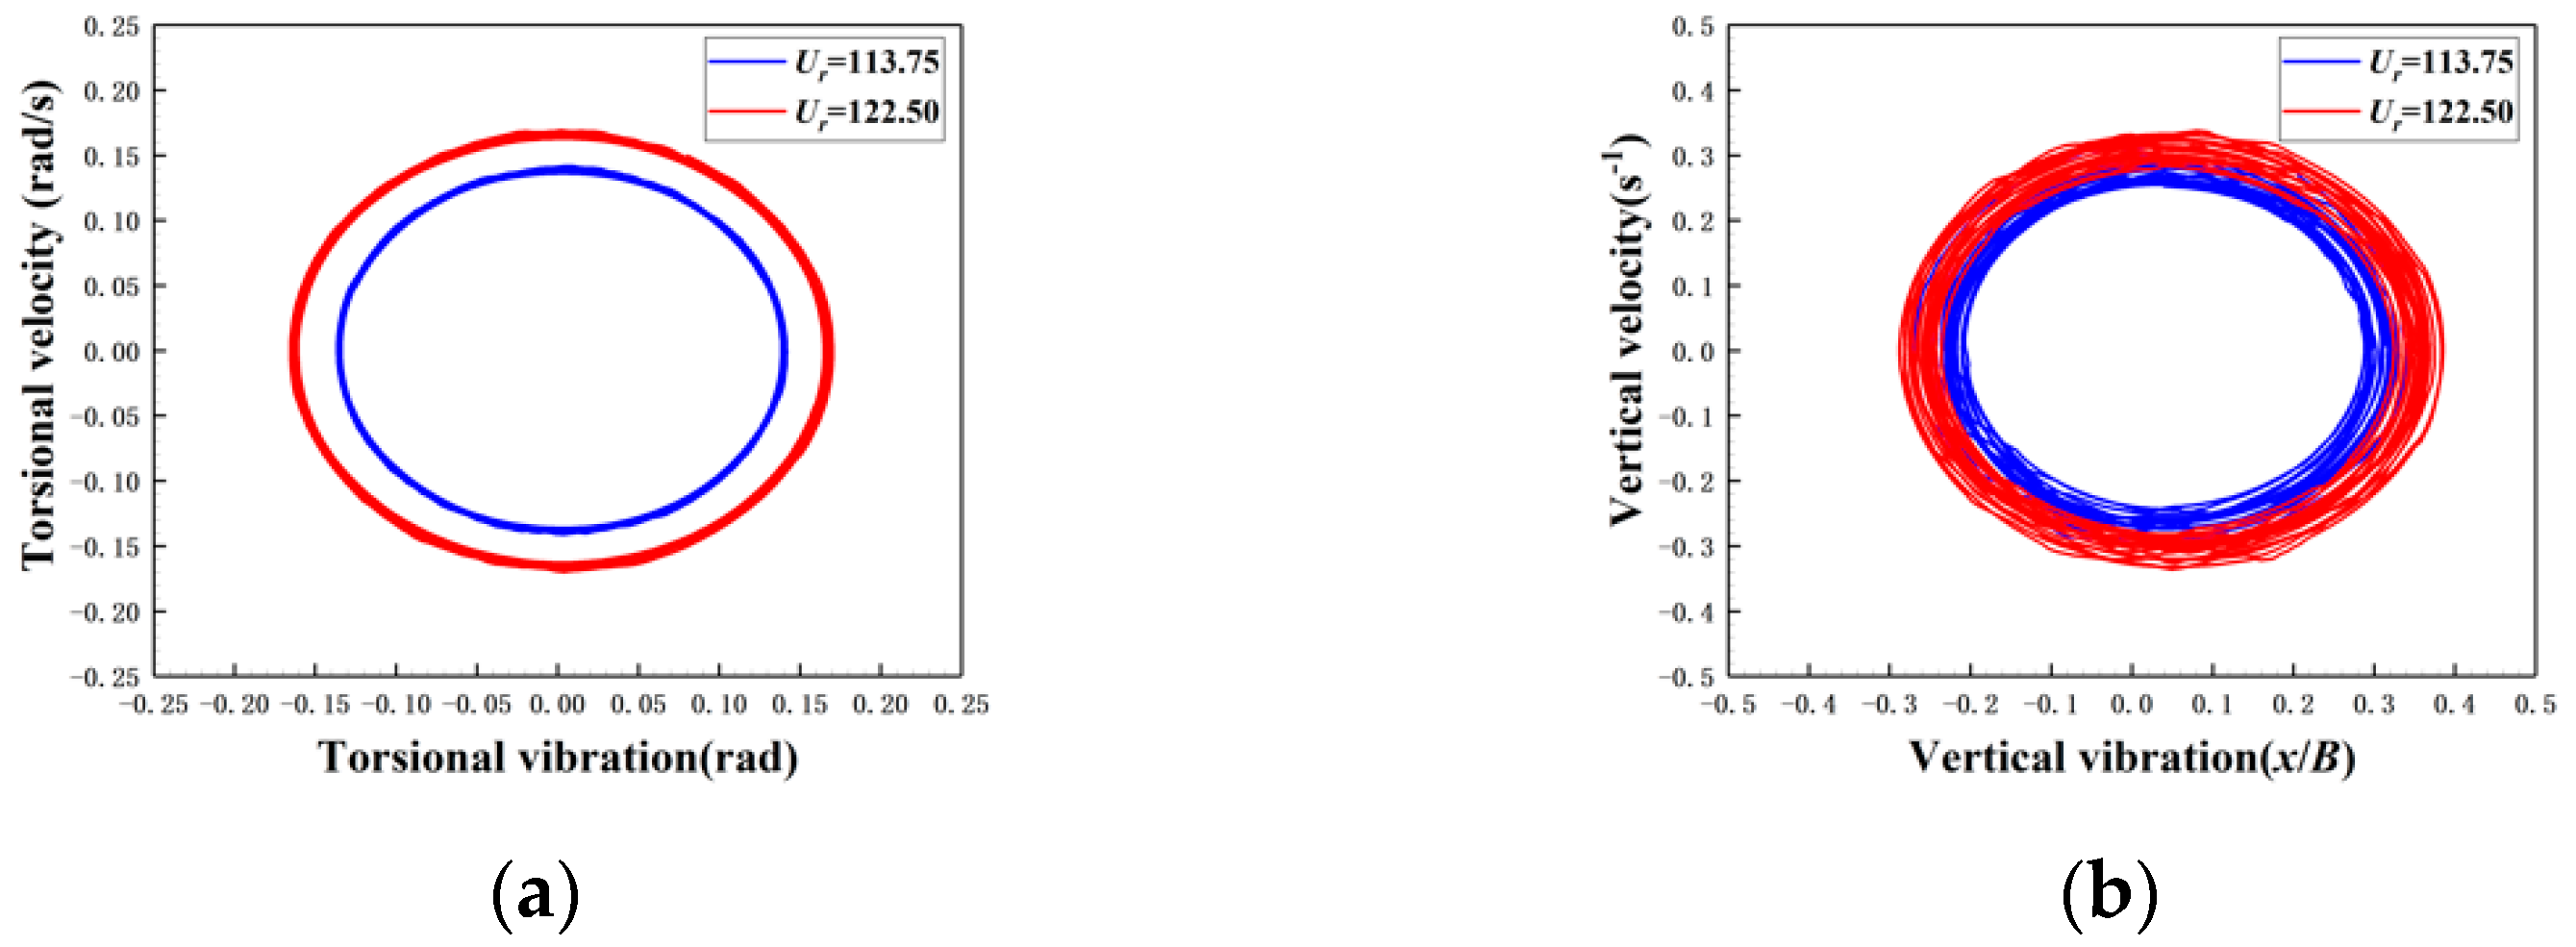
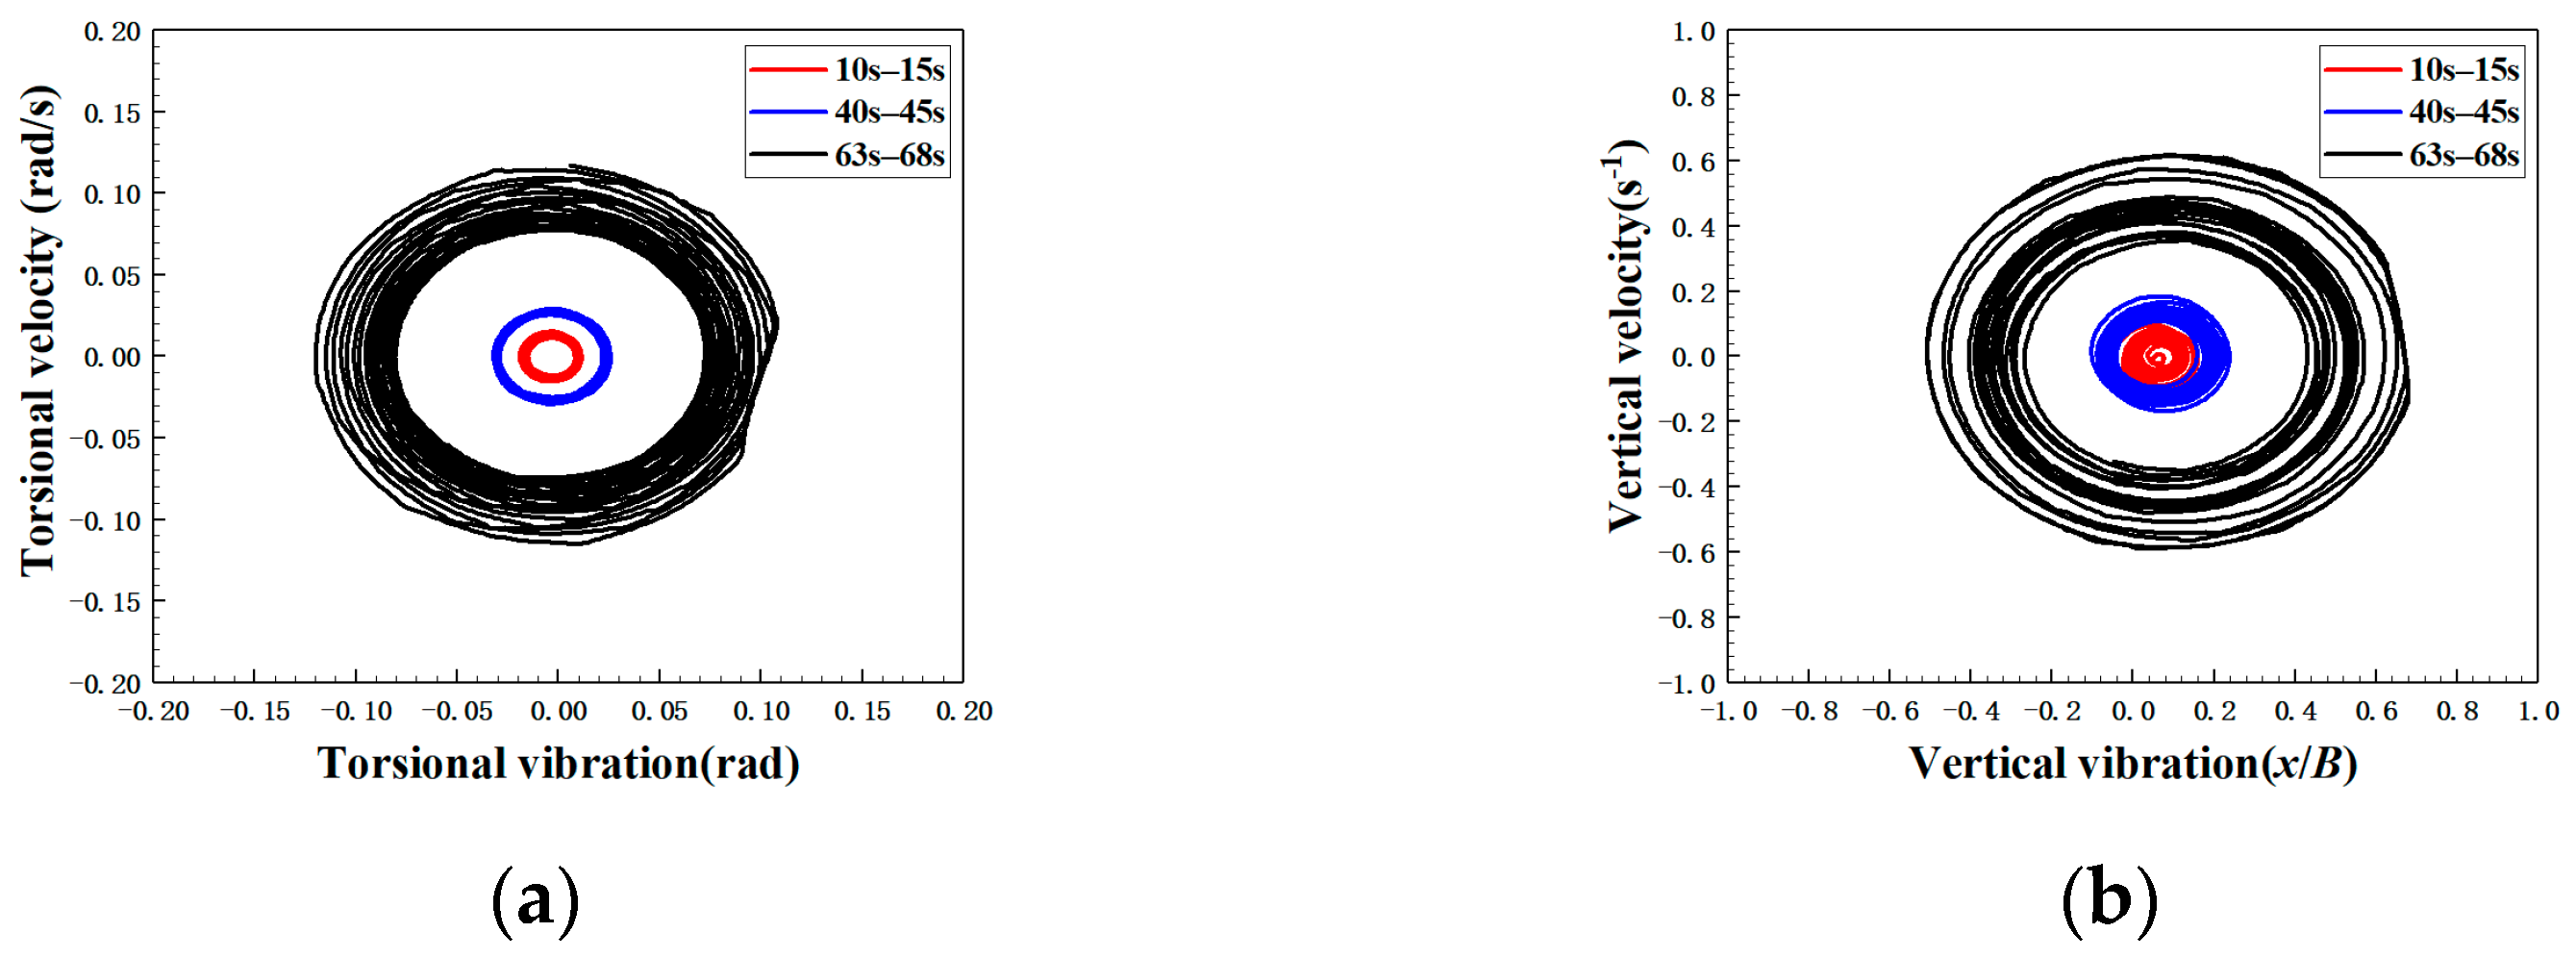
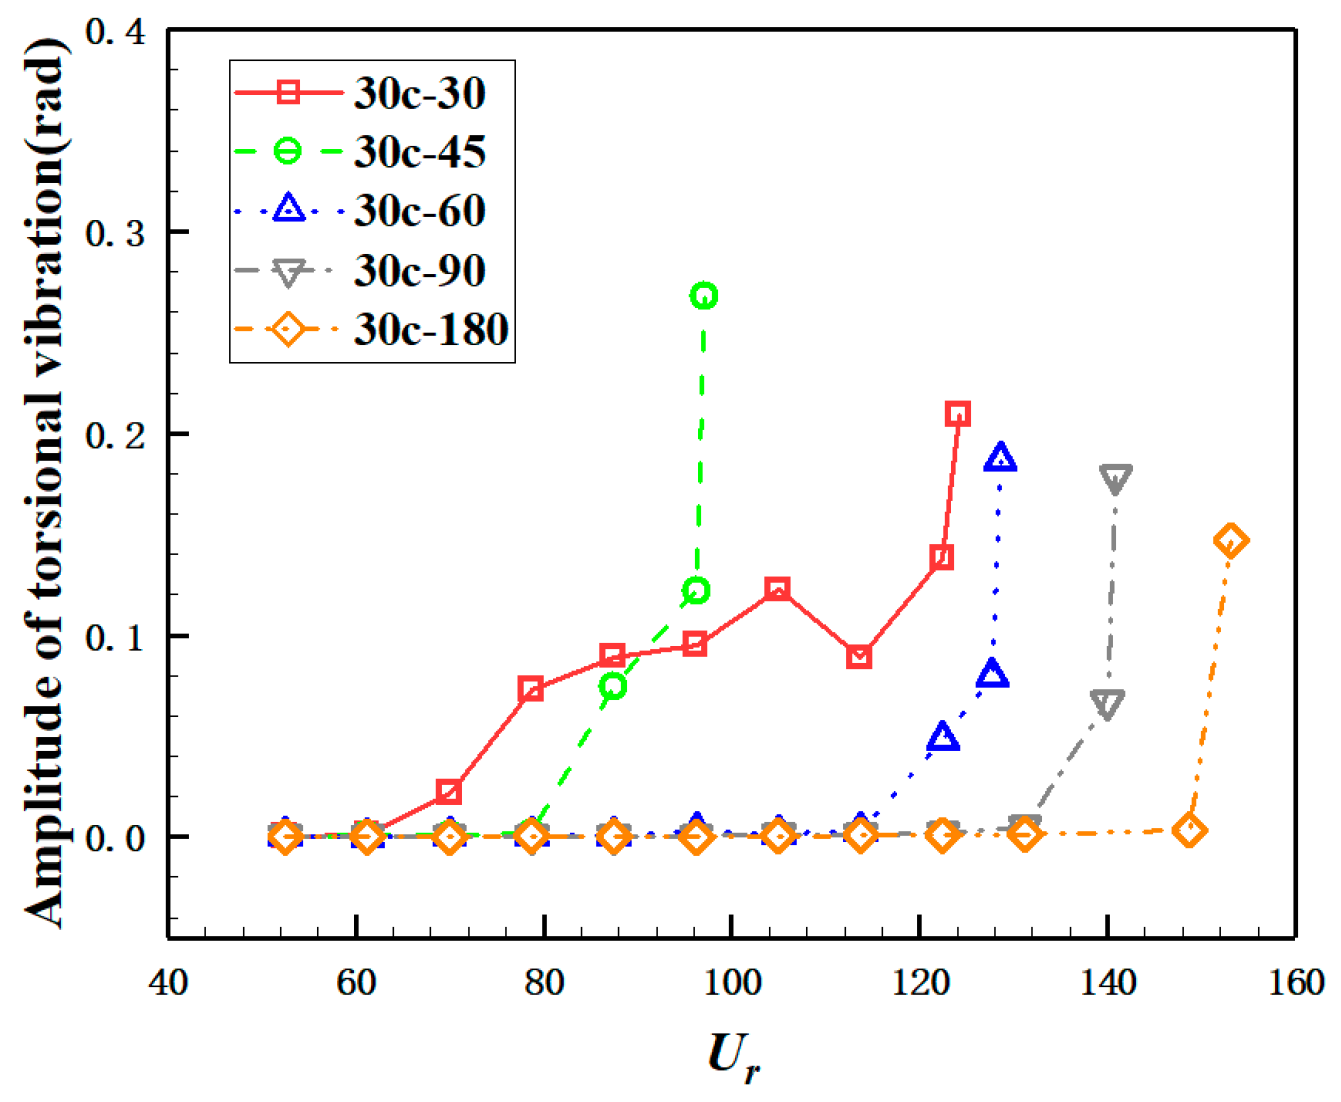
3.1. Dynamic Response of Flutter with Different Trailing Configurations
3.1.1. 30c-30 Case
3.1.2. 30c-45 Case
3.1.3. 30c-60 Case
3.1.4. 30c-90 Case
3.1.5. 30c-180 Case
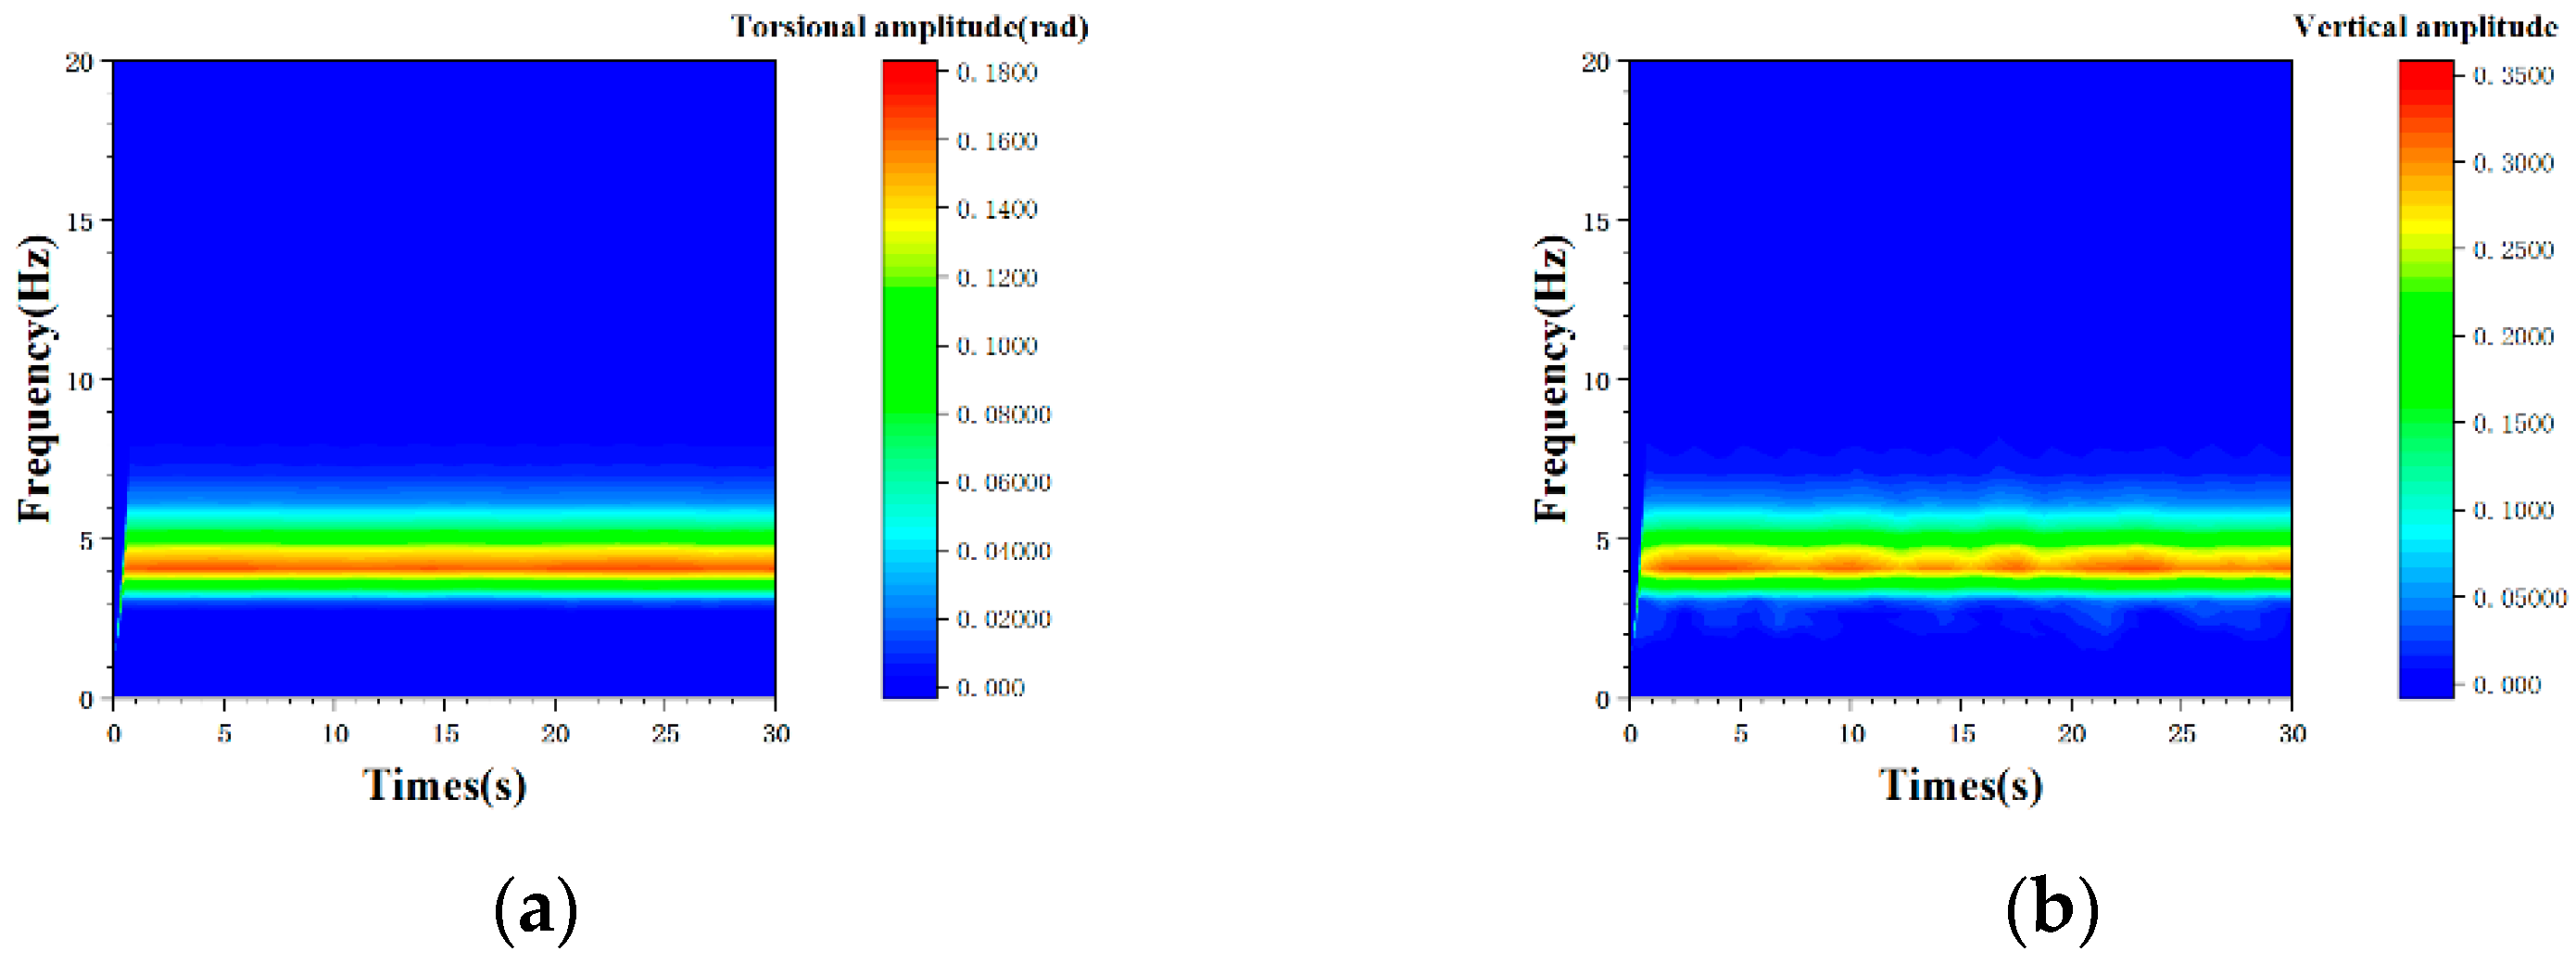
3.2. Frequency Domain Analysis
3.3. Wavelet and Hilbert Analysis
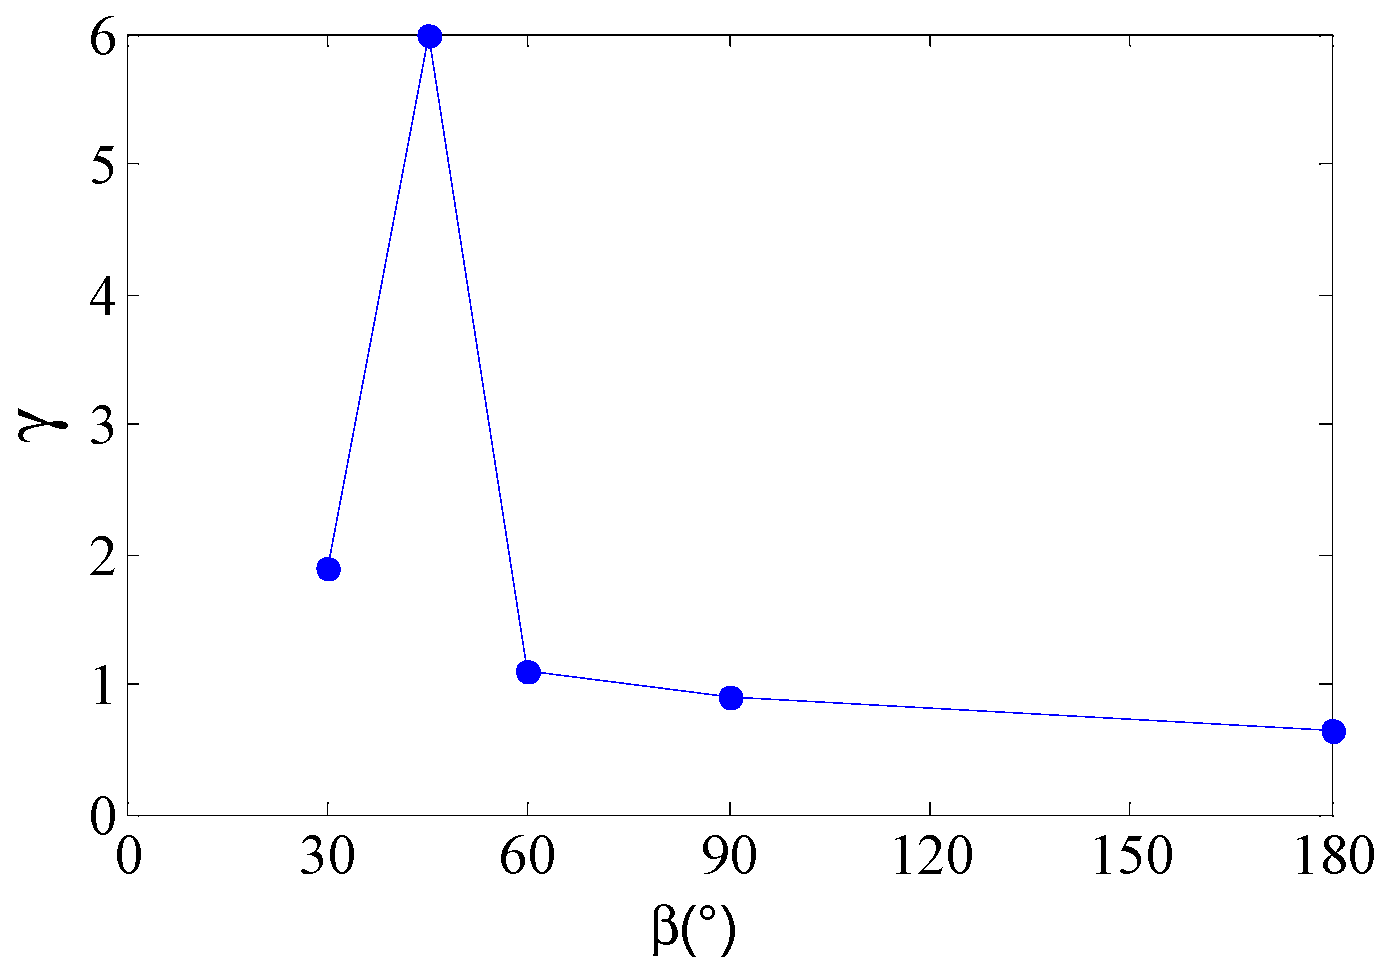
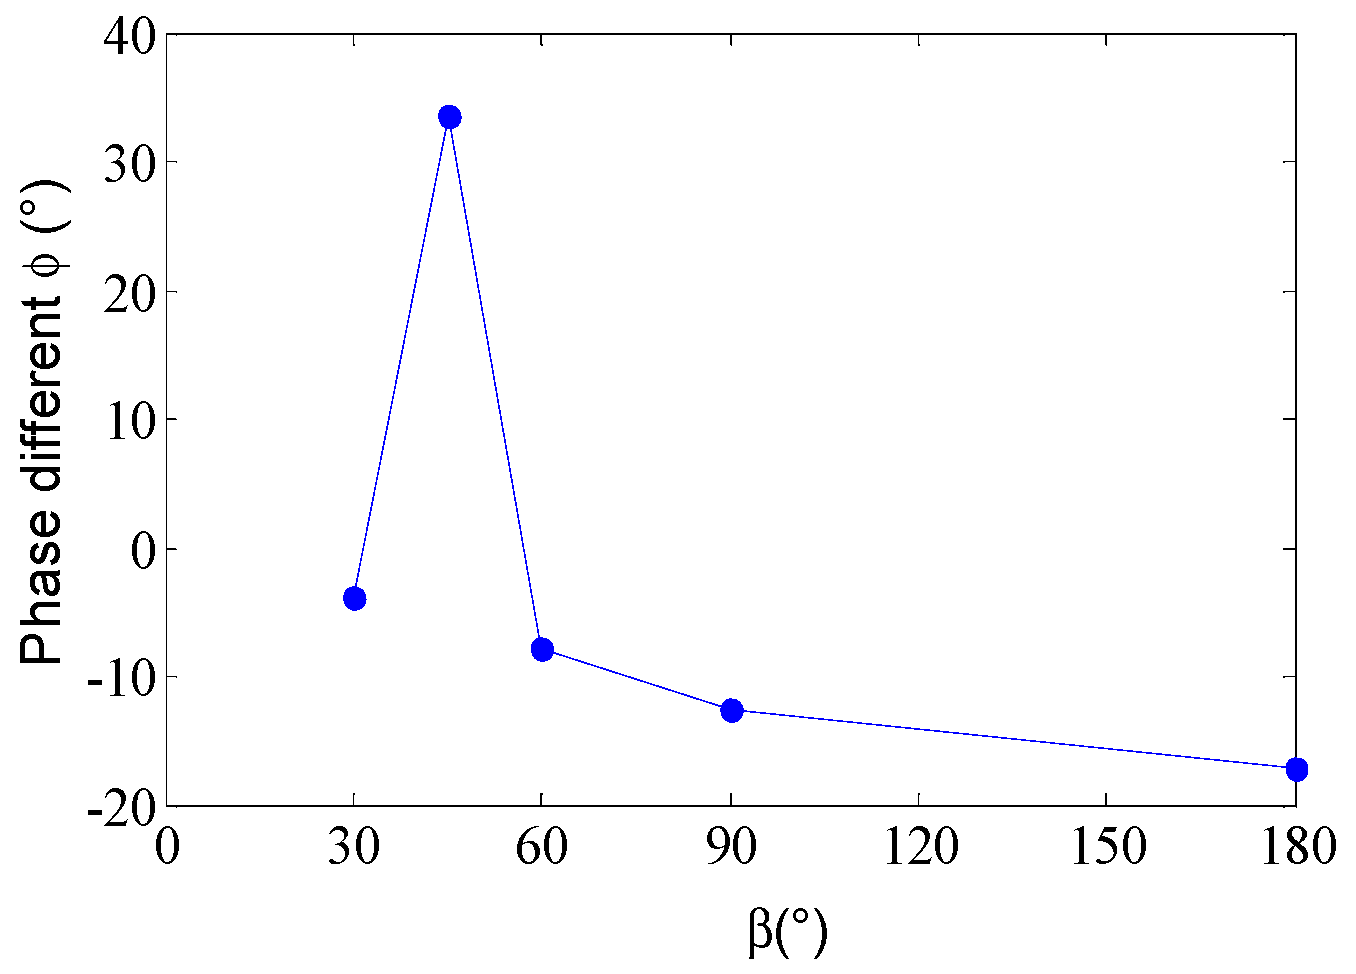
3.4. Phase Lag between Torsional and Vertcial Vibration
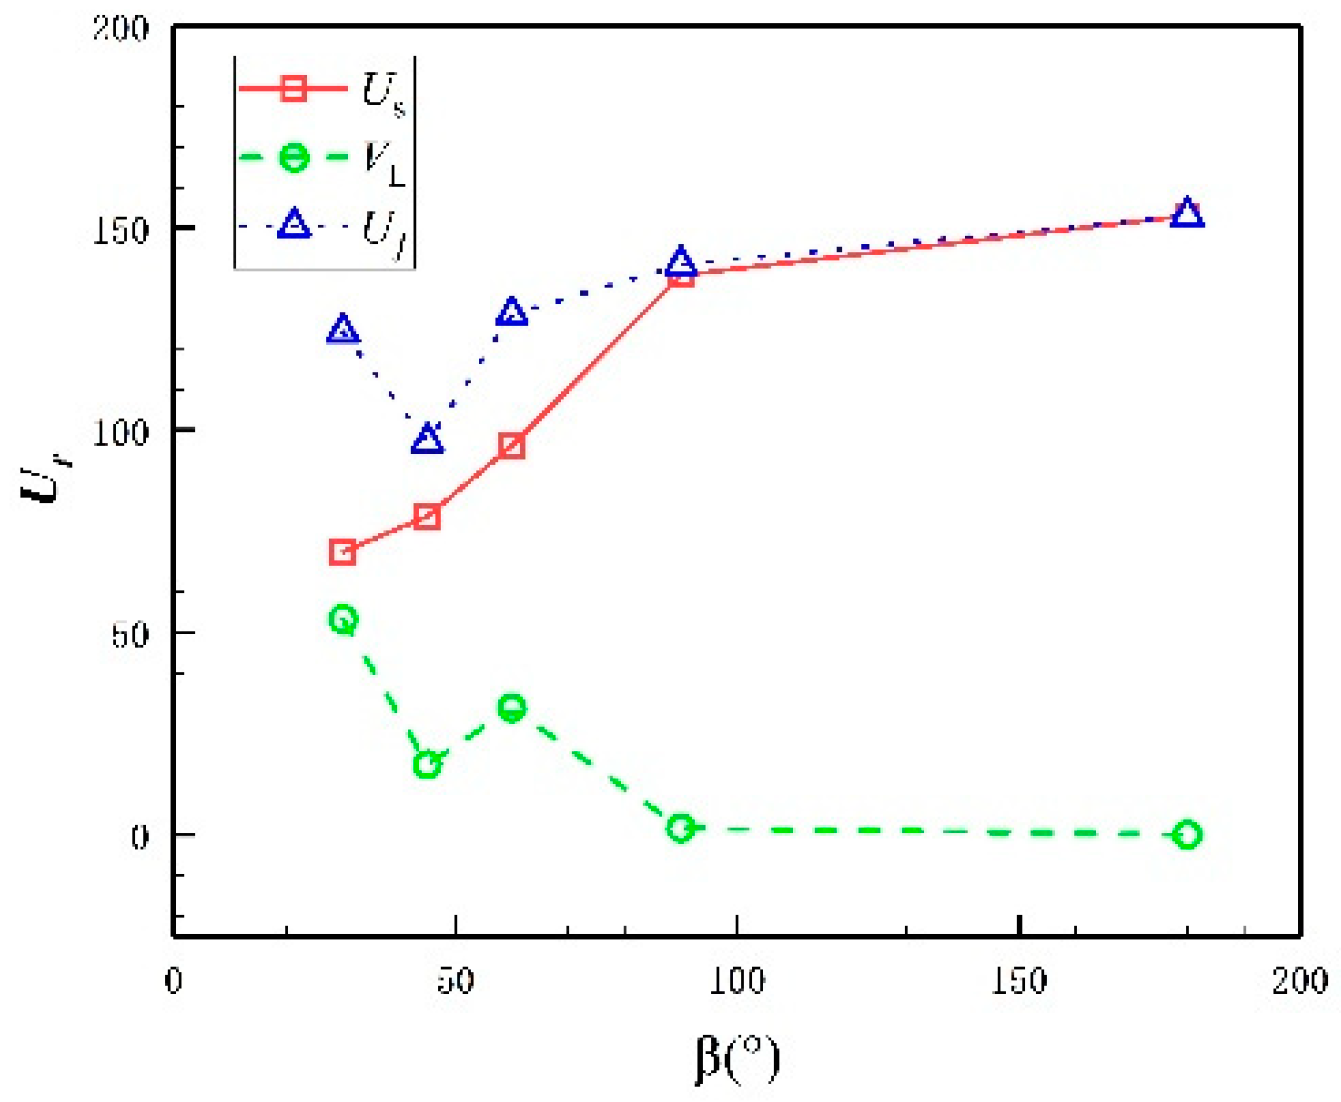
3.5. Discussion of Effect of TE
4. Conclusions
- (1)
- Limit cycle flutter may still occur in the bridge section with a streamlined front edge and, in some cases, it also has a wider limit cycle flutter wind speed range.
- (2)
- When the bending-torsional coupling flutter is fully developed, the torsional degree of freedom slightly lags behind the vertical degree of freedom.
- (3)
- As the trailing edge becomes more and more blunt, the critical wind speed Us gradually increases, and the flutter stability gradually increases. The wake vortex motion has a certain correlation with the flutter stability of the bridge deck.
Author Contributions
Funding
Institutional Review Board Statement
Informed Consent Statement
Data Availability Statement
Conflicts of Interest
References
- Bleich, F. Dynamic instability of truss-stiffened suspension bridges under wind action. Trans. Am. Soc. Civ. Eng. 1948, 114, 1177–1222. [Google Scholar] [CrossRef]
- Theodorsen, T. General Theory of Aerodynamic Instability and the Mechanism of Flutter; NACA Report No. 496; National Aeronautics and Space Administration: Washington, DC, USA, 1935; pp. 291–311.
- Kloppel, K.; Thiele, F. Modellversuche im Windkanal zur Bemessung von Brucken gegen die Gefahr winderregter Schwingungen. Stahlbau 1967, 32, 353–365. [Google Scholar]
- Scanlan, R.H.; Tomko, J.J. Airfoil and Bridge Deck Flutter Derivatives. J. Eng. Mech. Div. 1971, 97, 1717–1737. [Google Scholar] [CrossRef]
- Matsumoto, M.; Kobayashi, Y.; Shirato, H. The influence of aerodynamic derivatives on flutter. J. Wind Eng. Ind. Aerodyn. 1996, 60, 227–239. [Google Scholar] [CrossRef]
- Matsumoto, M.; Daito, Y.; Yoshizumi, F.; Ichikawa, Y. Torsional flutter of bluff bodies. J. Wind Eng. Ind. Aerodyn. 1997, 69, 871–882. [Google Scholar] [CrossRef]
- Matsumoto, M.; Matsumiya, H.; Fujiwara, S.; Ito, Y. New consideration on flutter properties based on step-by-step analysis. J. Wind Eng. Ind. Aerodyn. 2010, 98, 429–437. [Google Scholar] [CrossRef] [Green Version]
- Bartoli, G.; Mannini, C. A simplified approach to bridge deck flutter. J. Wind Eng. Ind. Aerodyn. 2008, 96, 229–256. [Google Scholar] [CrossRef]
- Lee, H.; Vu, T.; Yoo, S.; Lee, H.Y. A Simplified Evaluation in Critical Frequency and Wind Speed to Bridge Deck Flutter. Procedia Eng. 2011, 14, 1784–1790. [Google Scholar] [CrossRef] [Green Version]
- Schmid, P.J. Application of the dynamic mode decomposition to experimental data. Exp. Fluids 2011, 50, 1123–1130. [Google Scholar] [CrossRef]
- Wu, T.; Kareem, A.; Ge, Y. Linear and nonlinear aeroelastic analysis frameworks for cable-supported bridges. Nonlinear Dyn. 2013, 74, 487–516. [Google Scholar] [CrossRef]
- Amandolese, X.; Michelin, S.; Choquel, M. Low speed flutter and limit cycle oscillations of a two-degree-of-freedom flat plate in a wind tunnel. J. Fluids Struct. 2013, 43, 244–255. [Google Scholar] [CrossRef] [Green Version]
- Ying, X.; Xu, F.; Zhang, M.; Zhang, Z. Numerical explorations of the limit cycle flutter characteristics of a bridge deck. J. Wind Eng. Ind. Aerodyns. 2017, 169, 30–38. [Google Scholar] [CrossRef]
- Gao, G.; Zhu, L.; Han, W.; Li, J. Nonlinear post-flutter behavior and self-excited force model of a twin-side-girder bridge deck. J. Wind Eng. Ind. Aerodyn. 2018, 177, 227–241. [Google Scholar] [CrossRef]
- Zhang, M.; Xu, F.; Ying, X. Experimental Investigations on the Nonlinear Torsional Flutter of a Bridge Deck. J. Bridge Eng. 2017, 22, 04017048. [Google Scholar] [CrossRef]
- Zhang, M.; Xu, F.; Zhang, Z.; Ying, X. Energy budget analysis and engineering modeling of post-flutter limit cycle oscillation of a bridge deck. J. Wind Eng. Ind. Aerodyn. 2019, 188, 410–420. [Google Scholar] [CrossRef]
- Larsen, A. Aerodynamic aspects of the final design of the 1624 m suspension bridge across the great belt. J. Wind Eng. Ind. Aerodyn. 1993, 48, 261–285. [Google Scholar] [CrossRef]
- Bruno, L.; Mancini, G. Importance of Deck Details in Bridge Aerodynamics. Struct. Eng. Int. 2002, 12, 289–294. [Google Scholar] [CrossRef]
- Wilde, K.; Omenzetter, P.; Fujino, Y. Suppression of bridge flutter by active deck-flaps control system. J. Eng. Mechan. 2001, 127, 80–89. [Google Scholar] [CrossRef]
- Lin, Y.Y.; Cheng, C.M.; Wu, J.C.; Lan, T.L.; Wu, K.T. Effects of deck shape and oncoming turbulence on bridge aerodynamics. J. Appl. Sci. Eng. 2005, 8, 43–56. [Google Scholar]
- Zhang, X.; Sun, B. Parametric study on the aerodynamic stability of a long-span suspension bridge. J. Wind Eng. Ind. Aerodyn. 2004, 92, 431–439. [Google Scholar] [CrossRef]
- Mariotti, A. Axisymmetric bodies with fixed and free separation: Base-pressure and near-wake fluctuations. J. Wind Eng. Ind. Aerodyn. 2018, 176, 21–31. [Google Scholar] [CrossRef]
- Rocchio, B.; Mariotti, A.; Salvetti, M.V. Flow around a 5:1 rectangular cylinder: Effects of upstream-edge rounding. J. Wind Eng. Ind. Aerodyns. 2020, 204, 104237. [Google Scholar] [CrossRef]


| Serial Number | Fundamental Frequency (Hz) | Damping Ratio (%) | ||
|---|---|---|---|---|
| Vertical | Torsional | Vertical | Torsional | |
| 30c-30 | 2.640 | 5.066 | 0.193 | 0.141 |
| 30c-45 | 2.63 | 5.028 | 0.125 | 0.092 |
| 30c-60 | 2.625 | 5.020 | 0.104 | 0.145 |
| 30c-90 | 2.640 | 5.035 | 0.157 | 0.170 |
| 30c-180 | 2.623 | 5.005 | 0.176 | 0.126 |
Publisher’s Note: MDPI stays neutral with regard to jurisdictional claims in published maps and institutional affiliations. |
© 2021 by the authors. Licensee MDPI, Basel, Switzerland. This article is an open access article distributed under the terms and conditions of the Creative Commons Attribution (CC BY) license (https://creativecommons.org/licenses/by/4.0/).
Share and Cite
Feng, J.; Wu, B.; Laima, S. Effects of the Configuration of Trailing Edge on the Flutter of an Elongated Bluff Body. Appl. Sci. 2021, 11, 10818. https://doi.org/10.3390/app112210818
Feng J, Wu B, Laima S. Effects of the Configuration of Trailing Edge on the Flutter of an Elongated Bluff Body. Applied Sciences. 2021; 11(22):10818. https://doi.org/10.3390/app112210818
Chicago/Turabian StyleFeng, Jie, Buchen Wu, and Shujin Laima. 2021. "Effects of the Configuration of Trailing Edge on the Flutter of an Elongated Bluff Body" Applied Sciences 11, no. 22: 10818. https://doi.org/10.3390/app112210818
APA StyleFeng, J., Wu, B., & Laima, S. (2021). Effects of the Configuration of Trailing Edge on the Flutter of an Elongated Bluff Body. Applied Sciences, 11(22), 10818. https://doi.org/10.3390/app112210818