Article

Simulation and Experimental Study of Light and Thermal Environment of Photovoltaic Greenhouse in Tropical Area Based on Design Builder

1
School of Horticulture, Hainan University, Haikou 570228, China
2
Key Laboratory of Quality Regulation of Tropic Horticulture of Hainan Province, Haikou 570228, China
*
Author to whom correspondence should be addressed.
Appl. Sci. 2021, 11(22), 10785; https://doi.org/10.3390/app112210785
Submission received: 18 October 2021 / Revised: 8 November 2021 / Accepted: 11 November 2021 / Published: 15 November 2021
(This article belongs to the Section Agricultural Science and Technology)

Abstract

:
In order to study the adaptability of photovoltaic greenhouses to climate in tropical areas, a photovoltaic greenhouse model (photovoltaic panel coverage rate: 76.9%) was built in this study according to a 1:1 proportion. The distribution law of the indoor illuminance, temperature, and humidity were studied simultaneously in the photovoltaic greenhouse by actual measurements and simulation. The filed data are shown as follows: (1) Illuminance: in limited rain winter, the average illuminance and light transmittance were 7.02 kLux and 25.77%, respectively (10:00–16:00); but in different weather conditions during summer, the average illuminance and light transmittance were 15.47 kLux and 32.35%, respectively (9:00–16:00). (2) Temperature and humidity: the indoor temperatures of the greenhouse were between 22.1 and 29.3 °C in limited rain winter, with a relative small temperature difference between indoor and outdoor environments; the relative humidity values were between 69% and 97%; but in summer, the temperatures at all indoor test site were higher than outdoor sites, with an average temperature difference of 2.7 °C and relative humidity values between 46% and 94%. According to the simulation by Design Builder, the average light transmittances were 33.09% in winter and 37.54% in summer, the temperature difference between winter and summer was less than 1 °C, and the relative humidity decreased with the increase of temperature, which basically coincided with the filed data. The results of the analysis showed that the illuminance, temperature and humidity of the photovoltaic greenhouse can satisfy the production requirements of shade-enduring and neutral crops. At the same time, by comparing the illumination, temperature and humidity of the photovoltaic greenhouse with that of an ordinary greenhouse, the former had good adaptability to climate in tropical areas, which can achieve the goal of photovoltaic generation and agricultural production synchronously.

1. Introduction

Photovoltaic greenhouse uses photovoltaic modules as roof coverings instead of traditional greenhouse coverings (films, PC polycarbonate board panels, glass panels, etc.) to achieve an organic integration of greenhouse crop production and photovoltaic power generation. More and more practices have been carried out in China [1,2,3]. The most typical one is photovoltaic solar greenhouse. There are mainly three deployments of photovoltaic solar greenhouse: (1) photovoltaic modules deployed on front roof covers; (2) photovoltaic modules deployed on roof ridges; (3) photovoltaic modules deployed on rear roof covers or two gable sides. For the second deployment, the distance between the front and the rear greenhouses has to be increased to ensure the daylighting of the greenhouse on the north side, which would occupy some land and change the properties of the photovoltaic greenhouse. The third deployment has a relatively small scale of photovoltaic modules with which it is hard to produce a scale effect of power generation. The directest result of deploying photovoltaic modules on daylighting roofs is the reduction of sunlight intensity and the change of the illumination distribution law in the greenhouse. Especially under different weather conditions, the amount of scattered light also significantly affects the light intensity in photovoltaic greenhouses. Therefore, a proper coverage and coverage method of photovoltaic modules on greenhouse roofs is of great importance for the balance of power generation and normal agricultural production.
Except for illumination, temperature is also an important factor that has determinant effects on the production in photovoltaic greenhouses. Hence, both light and temperature parameters in photovoltaic greenhouses should be studied. Qi et al. used a Ningxia generation II solar greenhouse as the contrast and systematically compared the internal environments of different photovoltaic greenhouse types in Ningxia area during winter [4]. The results showed that the highest temperature and illuminance of a photovoltaic solar greenhouse with photovoltaic modules deployed on the roof were significantly higher than those of the contrast group. Ezzaeri et al. studied the impact of a greenhouse with a 40% coverage of photovoltaic modules on the microclimate and tomato production during winter and summer seasons, and their findings showed that the photovoltaic modules had little impact on the environmental parameters and production; they even reduced the temperature in the greenhouse during hot weather [5]. Dong et al. tested the indoor and outdoor temperatures, humidity, and illumination of their greenhouse (shoulder height; 6 m; double-slope symmetrical roof; roof span, 4 m; roof angle, 24°; photovoltaic film solar modules alternately deployed on the south daylighting cover; coverage, 39.4%), and the test results showed that the temperature reduction can reach 0.5–7.8 °C, the average transmittance can reach 66.27% in summer when using a fan-wet pad-cooling system, and the illuminance can satisfy the growth requirements of crops [6]. Reda et al. performed comparative tests between a photovoltaic greenhouse and a traditional greenhouse, and the results showed that the indoor air temperature in the photovoltaic greenhouse on fine days was reduced by 1–3 °C, the relative humidity was reduced by 2%, and the solar radiation was reduced by 35–40% [7].
The premise of building a sustainable energy-saving greenhouse is to accurately predict the environmental parameters in the photovoltaic greenhouse, and a proper use of simulation software can overcome time and space limitations and help researchers quickly obtain large amounts of analytical data and maps [8]. This study intends to use Design Builder software with a daylighting analysis module and a computational fluid dynamics (CFD) building fluid analysis module to conduct light and thermal environment simulation under typical climate conditions. The application of Design Builder in light and thermal environment is rather mature today. Fan et al. used Design Builder to simulate the indoor thermal environment of typical stone dwellings in the Southern Shandong region, which provided design ideas for the upgrading of dwellings in this area [9]. Song et al. applied Design Builder and Ecotect software to perform the energy consumption simulation on an office building in Wulumuqi, Xinjiang, and the results showed that Ecotect has many problems in building energy simulation [10]. Jesús et al. employed Design Builder to study the impact of building envelopes on the cooling, heating and daylighting loads (energy consumption) of the whole building [11].
Hainan Province is located in a tropical area, and the seasonal distributions of light and heat resources are quite even. The total annual radiation exposures of Haikou and Sanya are 5177 and 6140 MJ/m2·a, respectively. The annual sunshine hours of Haikou and Sanya are 1902 and 2491 h, respectively [12]. This indicates that the region is very suitable for the application and promotion of photovoltaic greenhouses. In this paper, a patent photovoltaic greenhouse was used as the prototype, and a 259.2 m2 experimental greenhouse was built by a 1:1 proportion of the prototype [13]. Then, based on simulation and measurement methods, the illuminance, temperature, and humidity distributions of this type of photovoltaic greenhouse were studied through simulation and actual measurements, thus providing basic data for the development of photovoltaic greenhouses and references for the promotion and practice of photovoltaic greenhouses in tropical areas.

2. Materials and Methods

2.1. Experimental Photovoltaic Greenhouse

The experimental photovoltaic greenhouse was built in the agricultural science practice base of Haidian campus of Hainan University (110°33′ east longitude, 20°05′ north latitude). The greenhouse span was 5.4 m with totally three spans and 16.2 m in total length; the standard width was 4 m with totally four widths and 16 m in total width; the floor area of the green house was 259.2 m2. The shoulder height was 2.5 m, and the ridge height was 3.7 m. The direction of the greenhouse was from north to south, with a lean-to roof towards the south. The main structure of the greenhouse was a hot-dip-galvanized steel pipe. The roof other than the photovoltaic modules was covered with a 0.15 mm thick film. The zigzag vent was covered with a 40 mesh insect-proof screen. All the facades of the greenhouse were covered with a 90% shading net (the experimental greenhouse was small in size, and hence, the shading net was used to protect it from ambient scattered light, but for mass production, an insect-proof screen will be used), and the sunshade net was a plastic net formed by bending the warp and weft wires with knitting needles and by intertwining them. It was inlaid and fixed on the greenhouse facade. The 90% shading rate can theoretically block 90% of the light flux from entering the room, so that the roof became the only light-transmitting channel. The photovoltaic modules adopted polycrystalline silicon battery pack with a size of 1650 mm × 990 mm and a capacity of 250 W. Four modules were contained in one group, and six groups were deployed in one span. Each greenhouse was deployed with three spans (72 modules), with an 18 kW capacity in total. The installed capacity per unit area of the photovoltaic greenhouse was about 69 W/m2, the annual average daily power generation hours in Haikou area is about 4.56 h, and the theoretical average daily power generation of the experimental greenhouse is about 82.08 kWh. A 0.6 m wide photic belt was arranged between each two modules for film covering, and the film covering rate was 76.9% (notes: covering rate = photovoltaic module coverage/(photovoltaic module coverage + photic belt coverage); the film coverage between front and rear spans is a photovoltaic array spacing designed to avoid the photovoltaic modules which are not sheltered from sunshine during 9:00–15:00 in winter [14]. This is not considered in the coverage rate calculation). All the spaces between roof covering modules and between film coverings were sealed by sealants for roof rain-proof. The rainwater on the roof coverings was discharged to the rain pipes at two sides of the greenhouse through the gutter on the shoulder. The simulation model and the real structure of the greenhouse are shown in Figure 1.

2.2. Test Instruments

A HOBO U14-001 automatic temperature and humidity recorder (measurement range: −20–50 °C; precision: ±0.2 °C; resolution: 0.03 °C (25 °C)) was used to collect temperature and humidity data; an i500-EGZ illuminance device (measurement range: 0–200,000 Lux; precision: ±4%; resolution: 0.1 kLux) was adopted to collect illuminance.

2.3. Test Methods

2.3.1. Collection Time

This test selected typical summer (July) and winter (January) times based on the specific climate characteristics of Hainan Province to record the experimental photovoltaic greenhouse internal environmental data during 8:30–17:30. The data were recorded once every 10 min.

2.3.2. Illuminance Collection

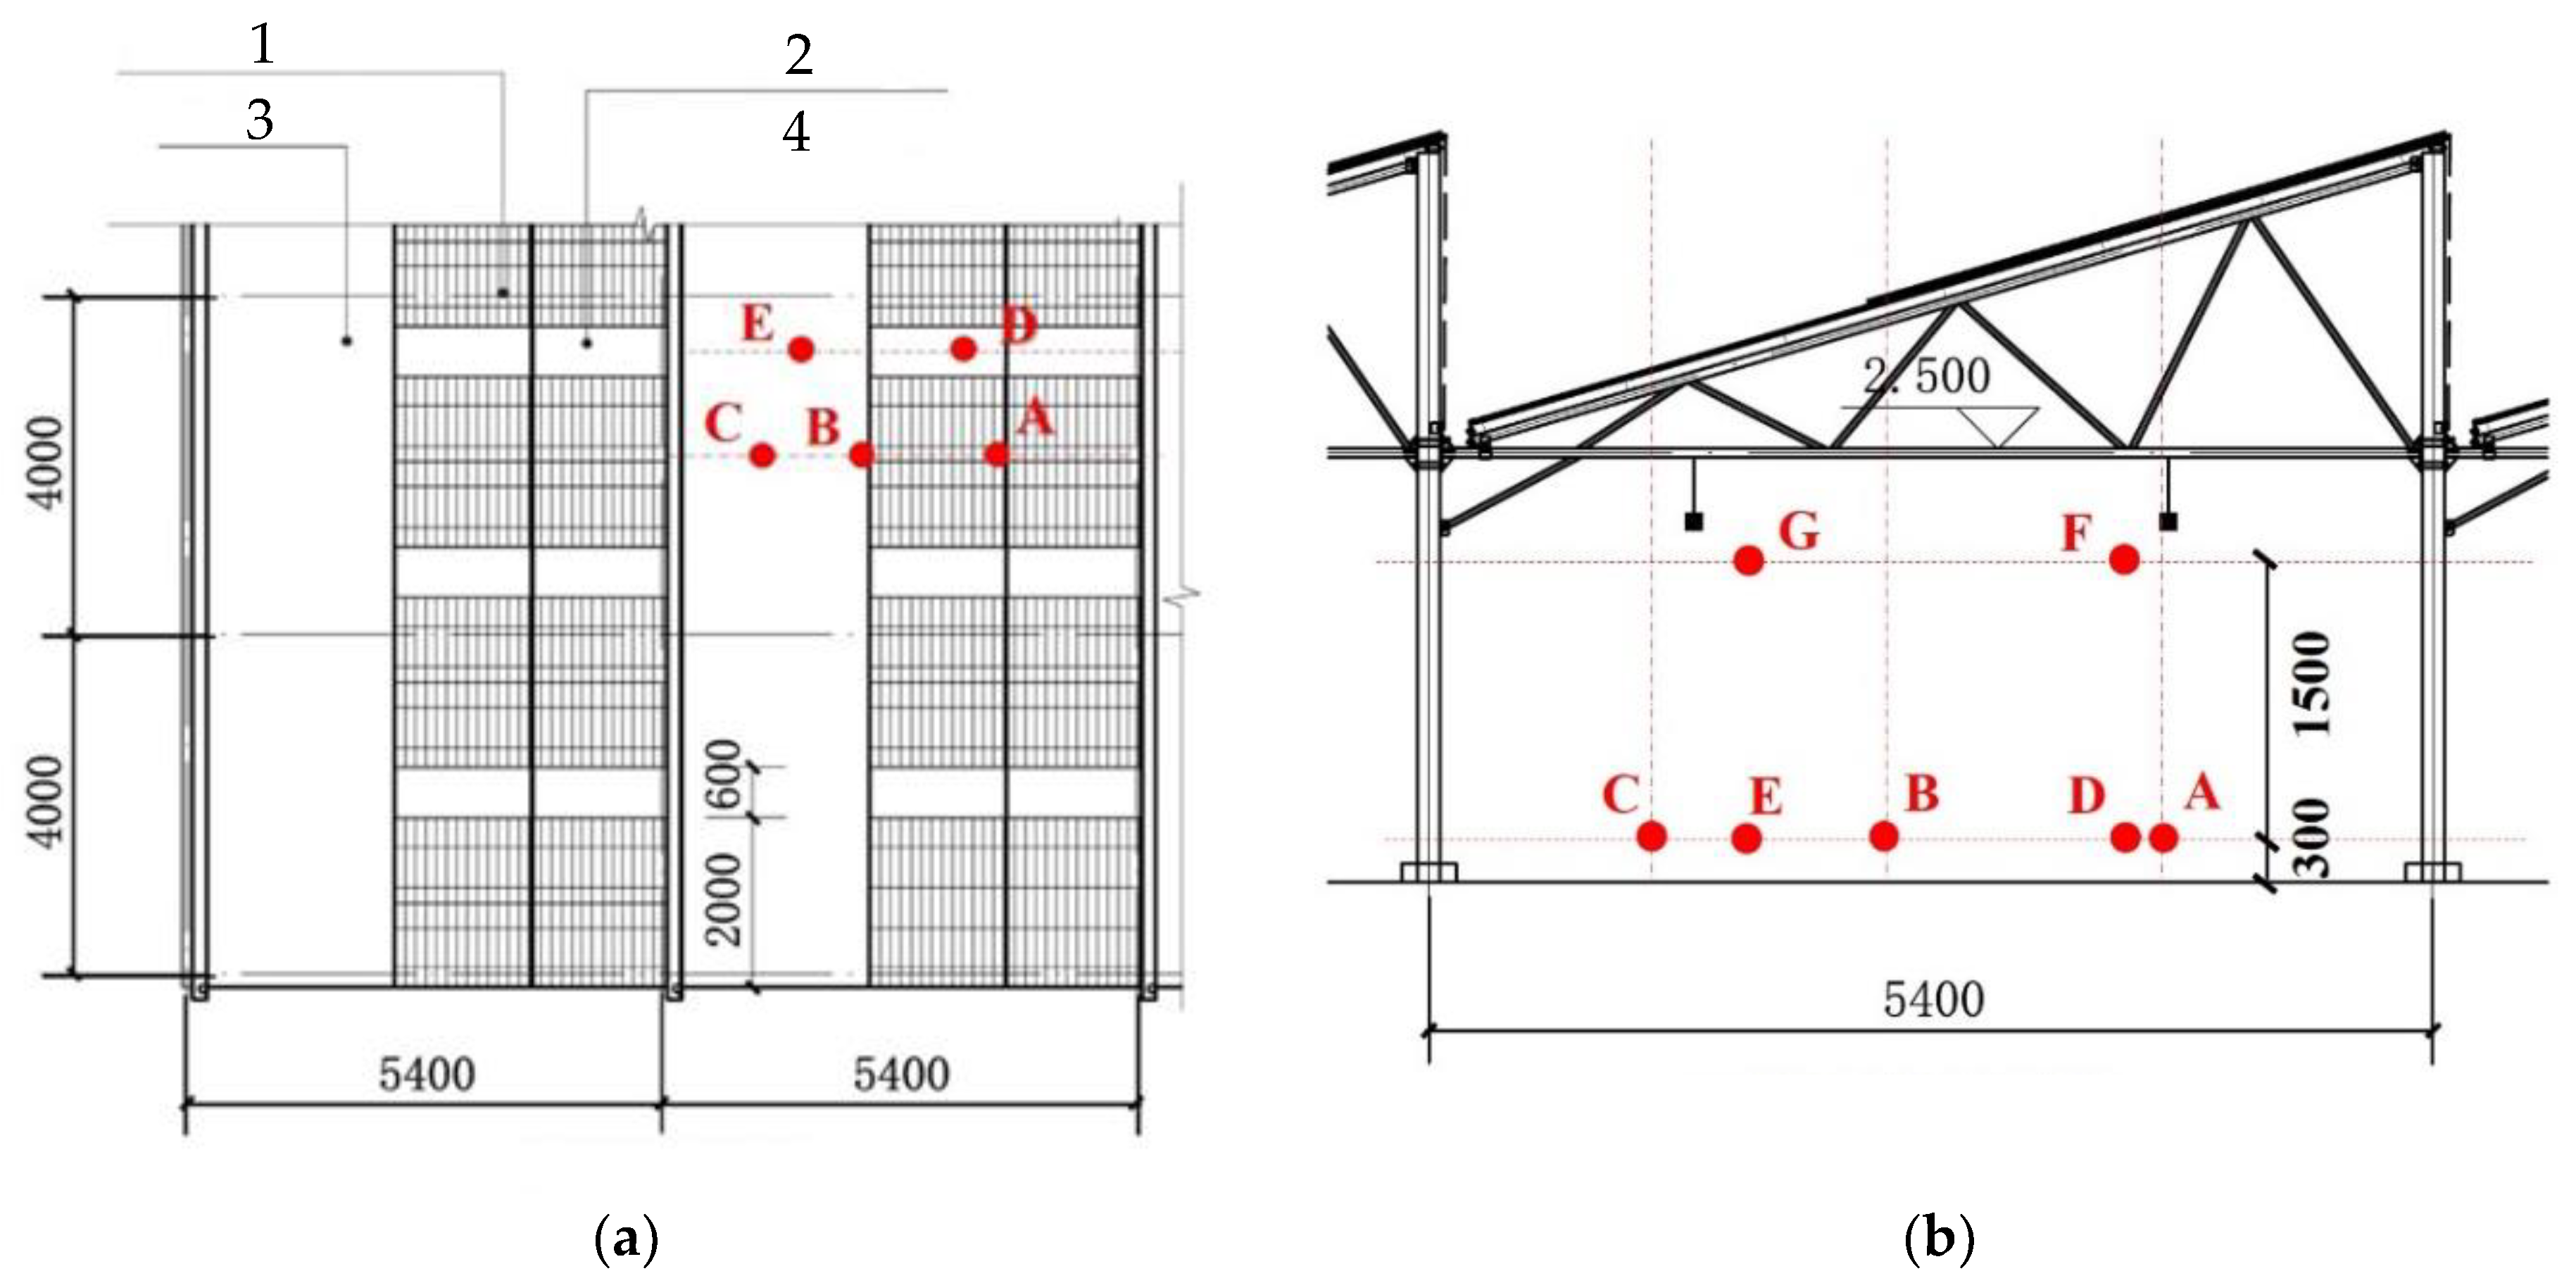
Totally, six illuminance collection sites were set. Five sites were in the middle area of the greenhouse (A, B, C, D, and E in Figure 2; unit: mm). Based on the distribution of the roof coverings, the collection sites were evenly deployed right under the middle of each module or the middle of the photic belt, with the height of vegetable leaves as the baseline and a ground altitude of 30 cm. The outdoor illuminance collection site was set at 80 cm above the ground without any obstruction out of the greenhouse.

2.3.3. Temperature and Humidity Data Collection

Totally, eight collection sites were set inside and outside the greenhouse. Except for the sites which were the same as that for illuminance collection, two more temperature and humidity collection sites (F and G) were set on the vertical direction of D and E sites in the greenhouse (180 cm above the ground), as shown in Figure 2b.

2.3.4. Contrast Greenhouse

A zigzag-film greenhouse and a sunshelter near the experimental greenhouse were selected as the contrast group. The illuminance collection site and the temperature and humidity data collection site were set at the middle of the contrast group 30 cm above the ground.
A transparent thin plastic rope was used to hang the collection device during the measurement. A foam board was placed above the temperature and humidity collection device to avoid direct solar radiation to heat the instrument and ensure the precision of the measurement.

2.3.5. Design Builder Simulation

A solar greenhouse model was established in Design Builder simulation software (Figure 1a). Numerical simulation calculation was conducted on the light and thermal environment by using the build-in Energy Plus. Real CSWD meteorological data provided by China Meteorological Administration were used. The geographical position was Haikou, Hainan Province.

3. Results and Analyses

3.1. Illumination Analysis

3.1.1. Winter Illumination Analysis

A photovoltaic module has obvious effects on the illumination in a greenhouse, especially in winter when the light is weakest. Tropical areas have relatively rich light resources. However, the deployment of photovoltaic modules may reduce the light intensity to a large extent. If the light in the greenhouse during winter rainy days in tropical areas can satisfy the growth requirement of crops, theoretically this kind of photovoltaic greenhouse can meet the growth requirement for light throughout the year.
The winter test time was 5 January 2016. The weather was limited rain. The light intensity of each collection site in the photovoltaic greenhouse is shown in Figure 3.
As shown, the change trends of light intensity at different points in the photovoltaic greenhouse were basically the same, and the light intensity reached a peak value at about 14:30. According to the comparison between site A (shading area), site B (photic area) and site C (transition area) with the shading area in descending order of C > B > A, the shading has impact on the daylighting of the area under photovoltaic panels. According to the comparison of the light intensities between site D (photic belt) and site E (photic area) with the shading area in descending order of E > D, the shading also has influence on the daylighting of the area under the photic belt.
For the quantitative analysis of the indoor light transmittance, we averaged the light intensity during 10:00–16:00 and compared them with the outdoor light intensity (Table 1).
As shown in Table 1, the average outdoor light intensity between 10:00 and 16:00 was 27.23 kLux, and the average indoor light intensities at different sites were between 6.48 and 7.99 kLux. According to the weighted calculation of the roof cover transmittance area and the photovoltaic area in proportion to their area, the compound average transmittance was 25.77%, and the compound average light intensity was 7.02 kLux.
According to the comparison of the average winter indoor light intensity of the best site (C) and the poorest site (A) of daylighting, the light intensity of site A was 81.1% of site C (1.51 kLux difference). This means that although the winter light intensity in the photovoltaic greenhouse was not even, the difference between the areas was limited and the distribution of light was relatively even.

3.1.2. Summer Illumination Analysis

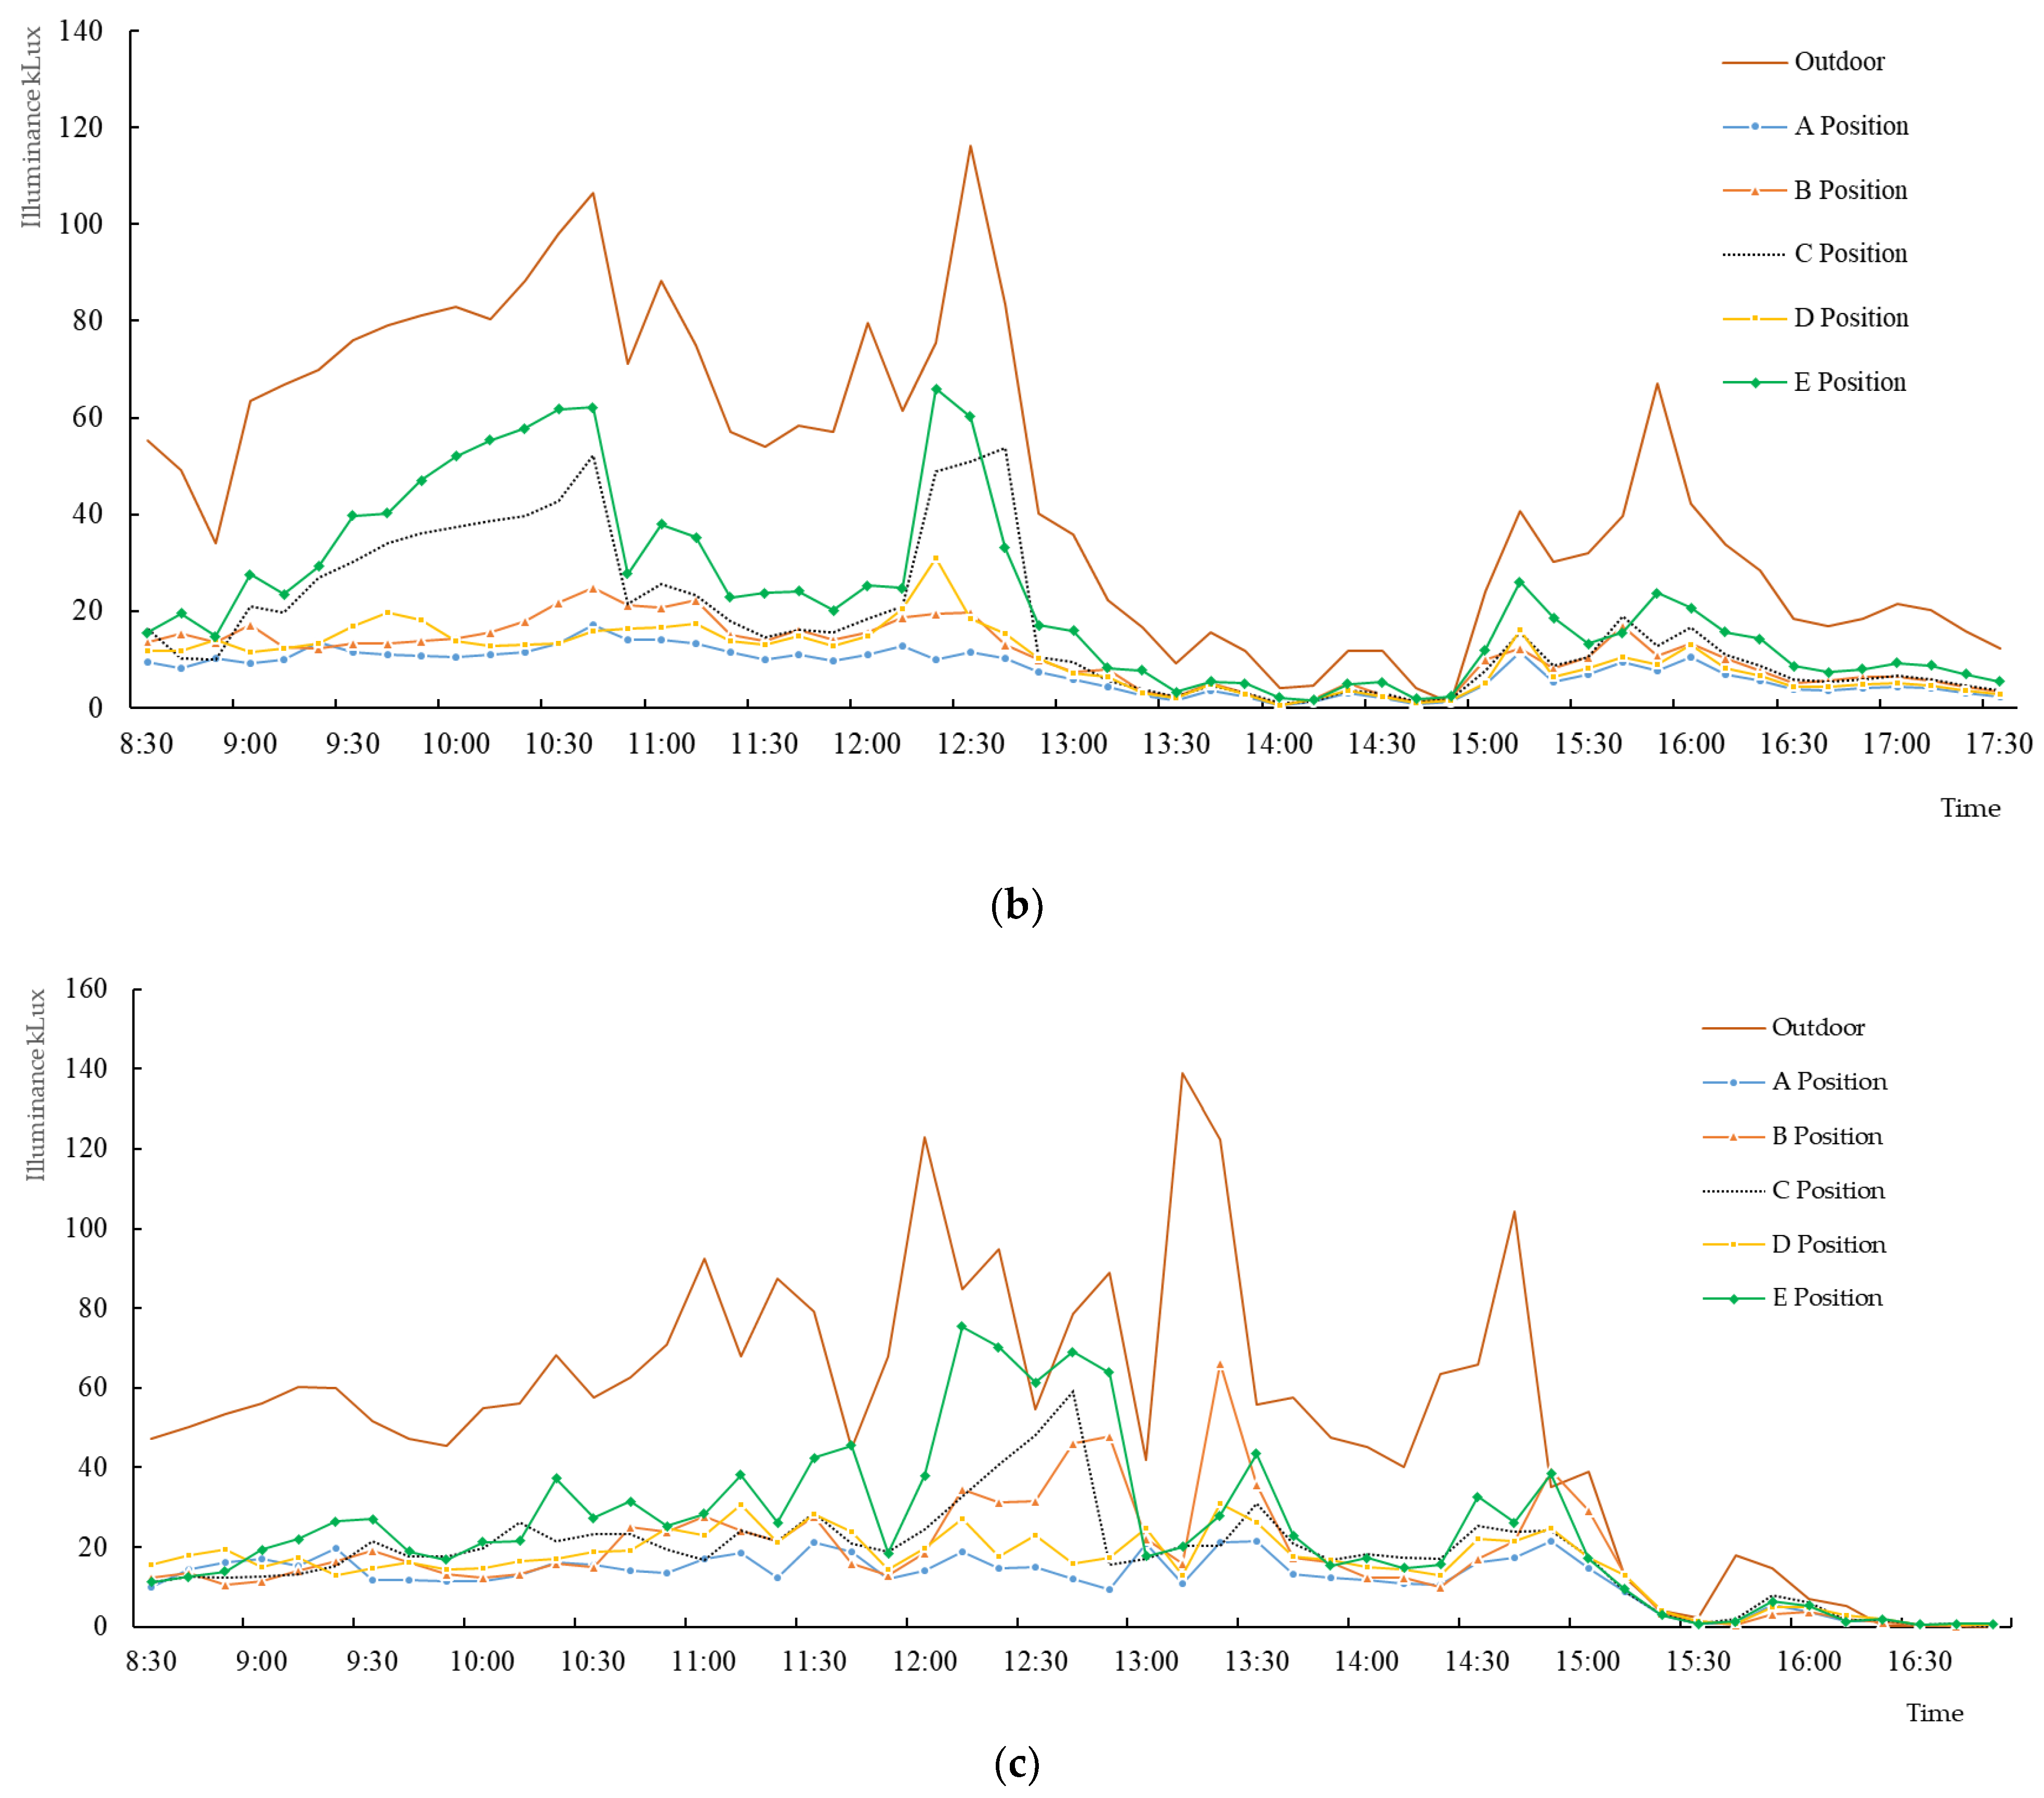
The summer test times were 28, 29, and 31 July 2015. The weather of the three dates was thundershower, thundershower to cloudy, and cloudy and sunny (short shower), respectively. The light intensity of each indoor and outdoor collection site is shown in Figure 4. The light intensities during 9:00 and 16:00 under different weather conditions in summer were averaged for the comparative analysis of the light intensity with that of the outdoor site (Table 2).
According to Figure 4 and Table 2, for the summer thundershower weather, the average light intensity of the outdoor site was 34.04 kLux, and the average light intensities of different indoor sites were between 8.30 and 19.39 kLux; for the thundershower to cloudy weather, the average light intensity of the outdoor site was 51.43 kLux, and the average light intensities of different indoor sites were between 8.47 and 26.16 kLux; during the cloudy and sunny weather, the average light intensity of the outdoor site was 60.31 kLux, and the average light intensities of different indoor sites were between 13.50 and 28.00 kLux. These results showed that weather conditions have an obvious impact on indoor light intensity. The average light intensities of different sizes were listed in descending order: outdoor > E > C > B > D > A.
According to the comparison of the average summer indoor light intensity of the best site (E) and the poorest site (A) for daylighting, the differences in the three days of the two sites were 11.09, 17.69, and 14.50 kLux, respectively, and the average daily light intensity of site A was 58.87% of site C (81.1% in winter). This means that the distribution of the summer light intensity in the photovoltaic greenhouse was not even, mainly due to the larger direct light than scattered light in summer.
The weighted calculations of the roof transmittance area and the photovoltaic area in proportion to their areas showed that the compound average transmittance rates were 36.82% (thundershower), 27.57% (thundershower to cloudy), and 27.57% (cloudy and sunny), and the mean value of the three weather conditions was 32.35%.

3.2. Temperature and Humidity Analysis

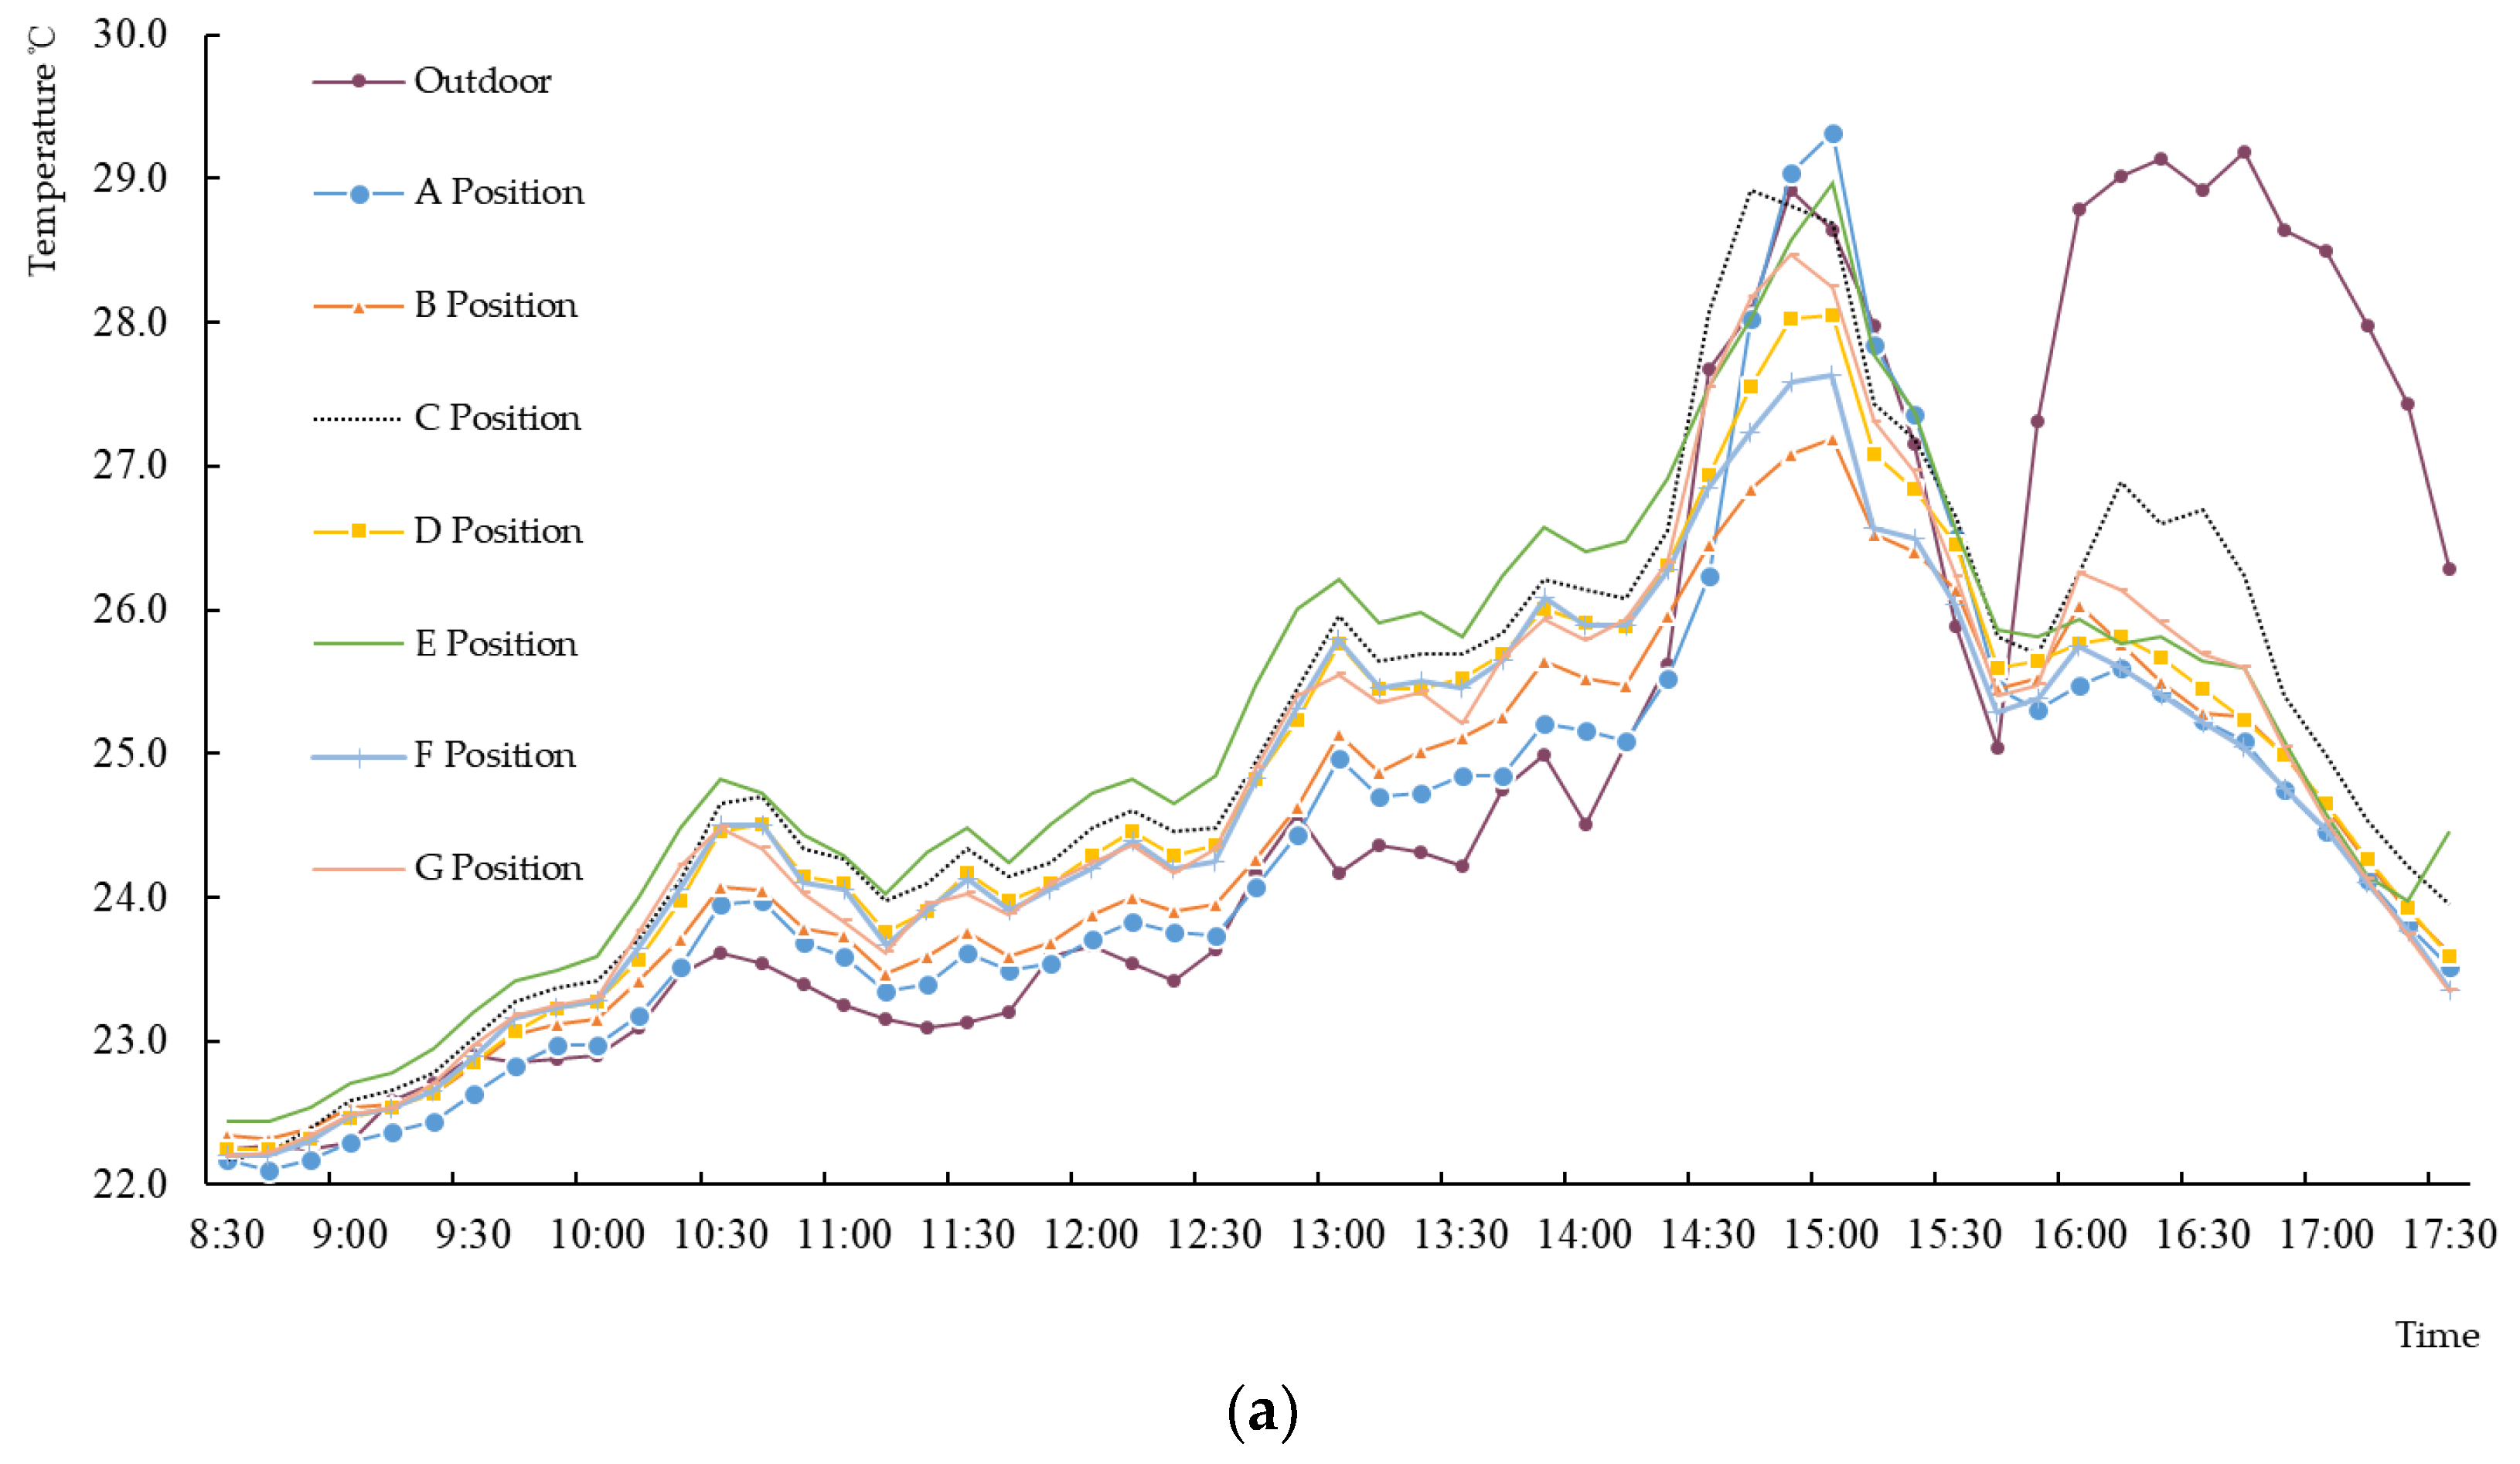
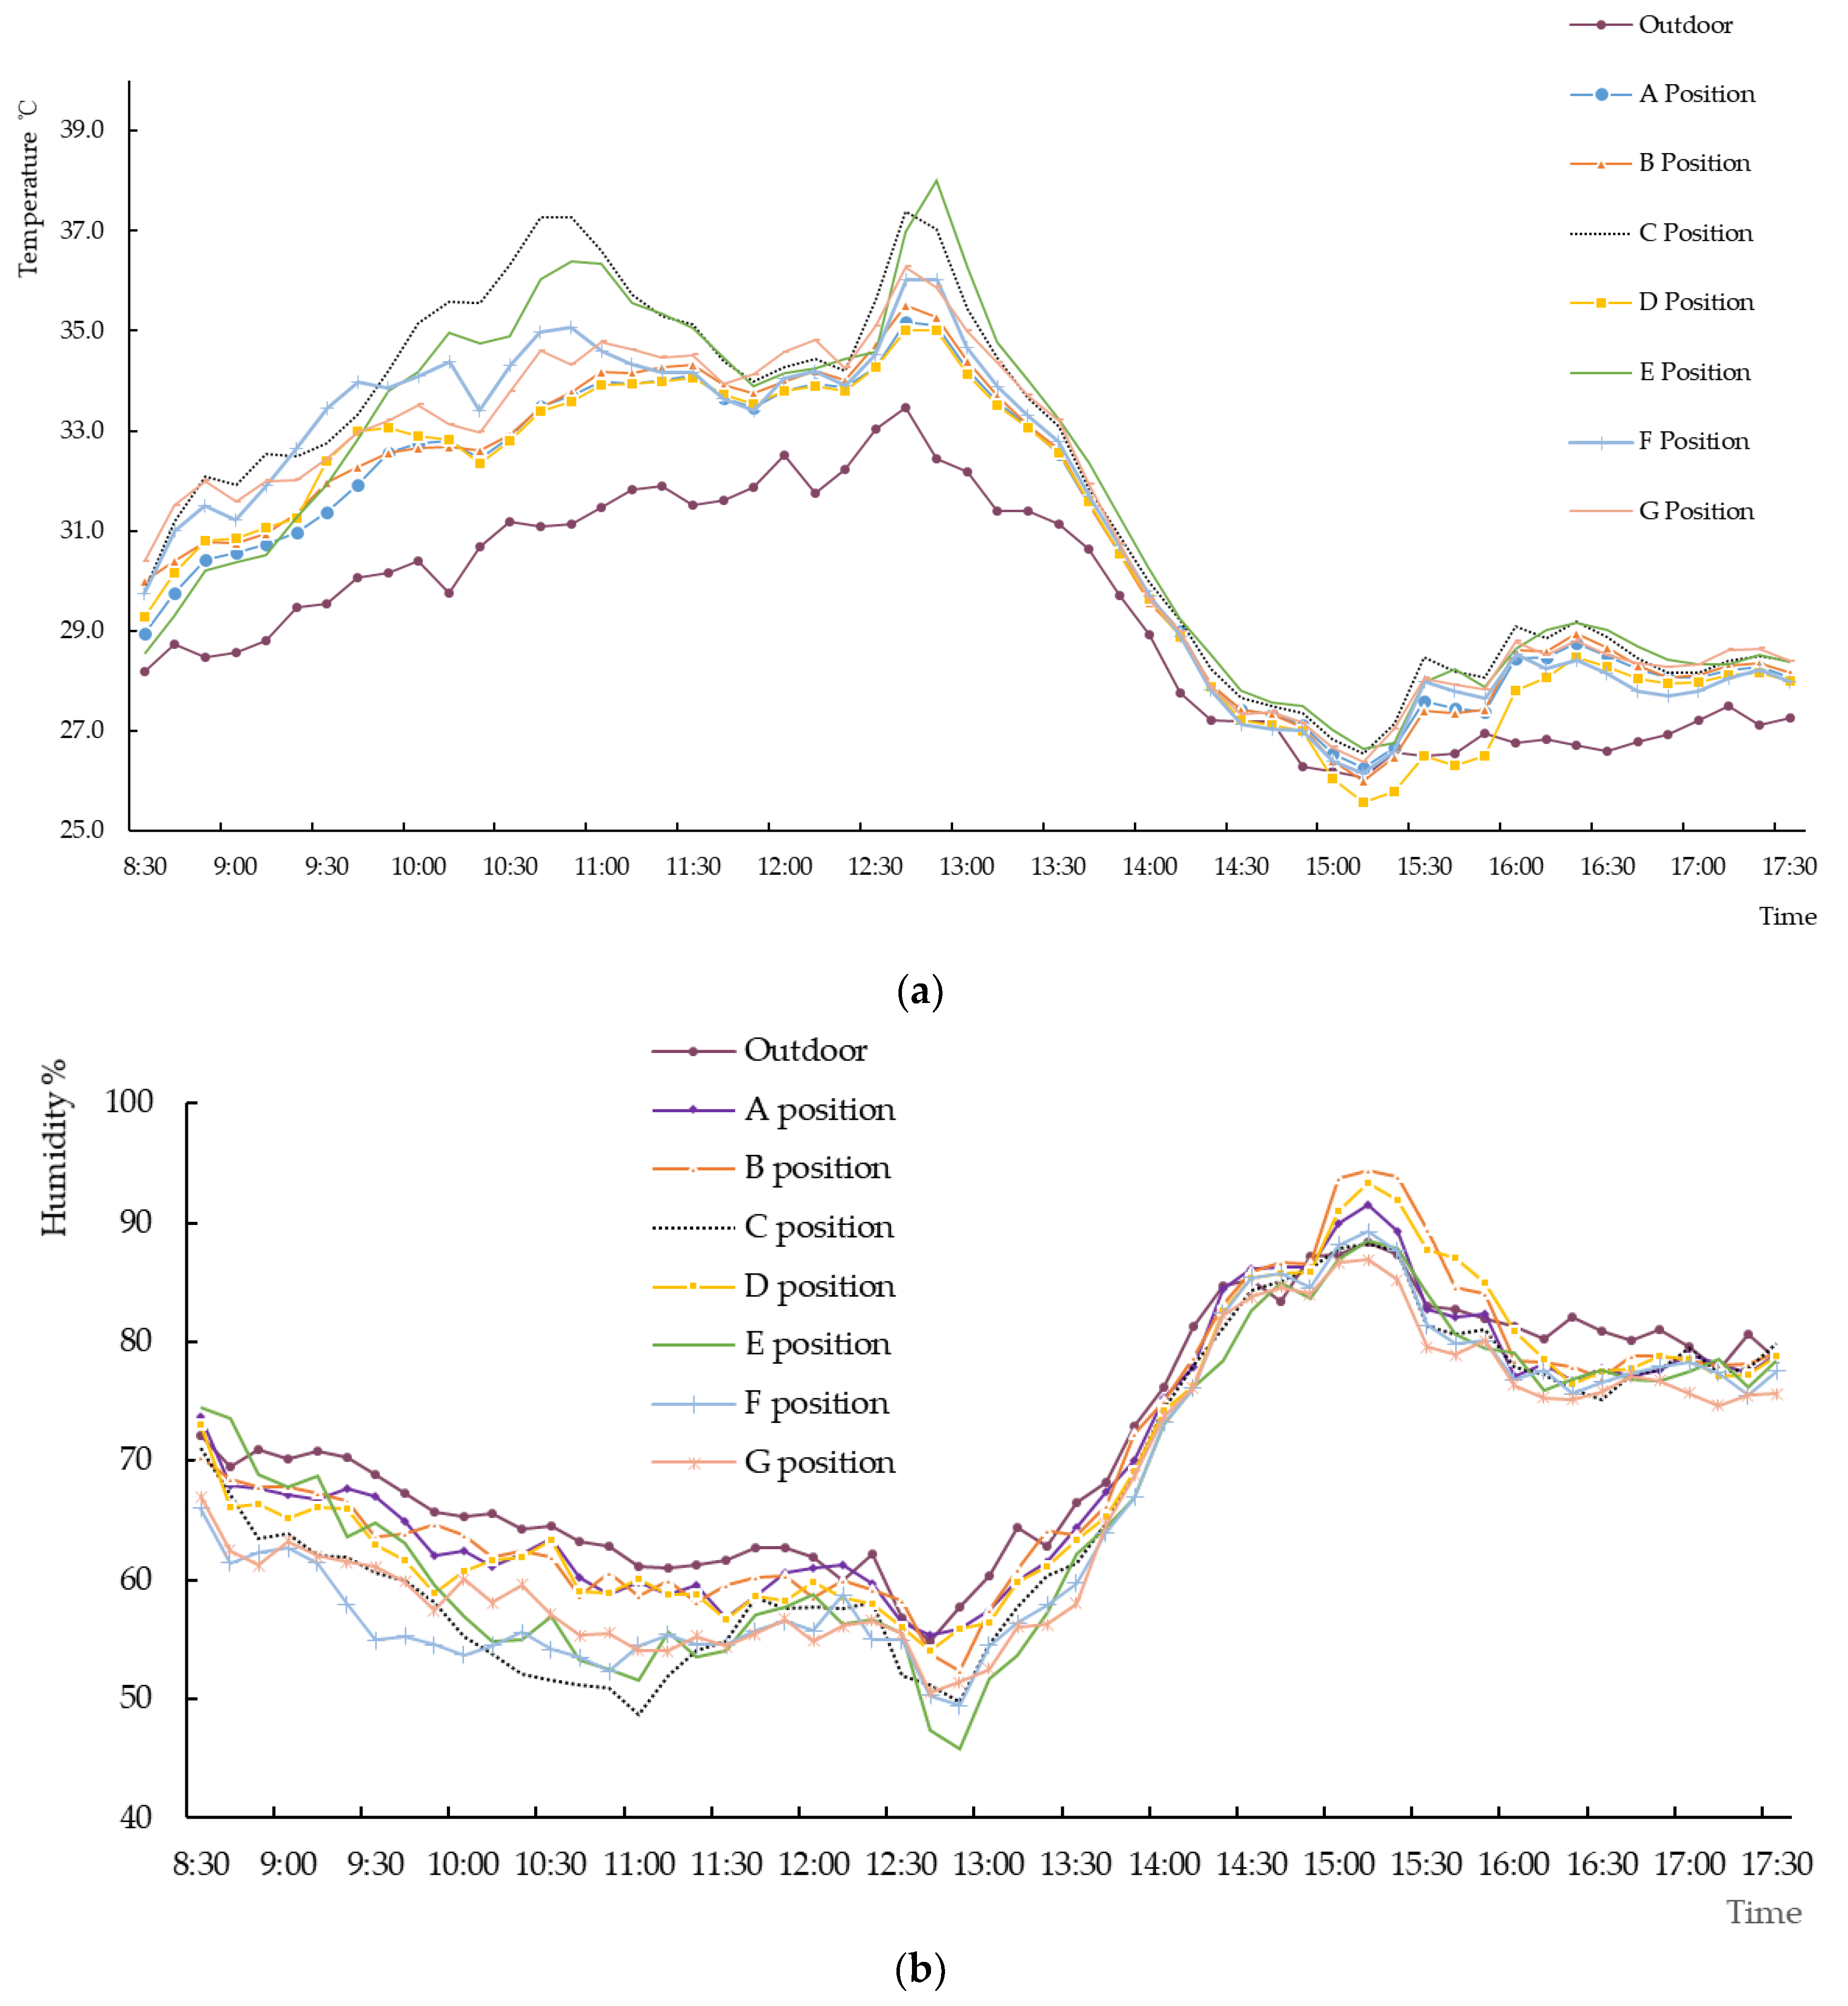
Indoor temperature and humidity not only affect the growth of plants but also influence the manual work in the greenhouse. Therefore, except for the A, B, C, D, and E collection sites, two new indoor sites of F and G were set 1.8 m above the ground to measure the temperature and humidity in the photovoltaic greenhouse in winter (limited rain) and summer (thundershower to cloudy). The results of the measurements in winter and summer are shown in Figure 5 and Figure 6, respectively.
Temperature and humidity extremum can reflect the temperature and humidity status directly. The maximum and minimum values of the temperature and humidity of the indoor and outdoor sites and the mean values of indoor sites in the photovoltaic greenhouse in winter and summer are shown in Table 3 and Table 4, respectively.
According to Figure 5 and Table 3, the outdoor environment had a larger impact on indoor temperature and humidity during morning and noon hours than in afternoon. In the afternoon, the indoor temperature and humidity tended to be stable. During 9:00–14:30, the indoor temperature was higher than the outdoor temperature, while the relative humidity was lower than the outdoor humidity; during 14:30–16:00, the indoor and outdoor temperatures had no significant difference; during 16:00–18:00, due to the illuminance and weather effects, the indoor temperature became lower than the outdoor temperature, while the relative humidity was higher than the outdoor humidity. The average values of the indoor test sites were close to those of the outdoor site. In the afternoon, due to the effect of photovoltaic modules and the weather turning from “rainy” to “sunny”, the phenomenon of “temperature inversion” (the indoor temperature became lower than the outdoor temperature) happened. The temperature and humidity differences between the indoor test sites in the same day were not significant. The average temperature difference was 0.9 °C (3.6%), and the maximum difference was 2.1 °C (6.5%).
According to Figure 6 and Table 4, during the summer thundershower to cloudy weather, the outdoor temperatures were between 26.1 and 33.5 °C, and the average indoor temperatures were between 26.2 and 36.2 °C. The indoor temperature was higher than the outdoor temperature during most of time in the day, and the maximum temperature difference was 2.7 °C; the outdoor relative humidity values were between 55% and 88%, and the average indoor relative humidity values were between 50.9% and 90.3%. The maximum temperature difference of the indoor collection sites was 3.9 °C (12.1%). The shading of photovoltaic modules showed obvious impact on the even distribution of the photovoltaic temperature and humidity in summer.

3.3. Analyses between the Photovoltaic Greenhouse and the Contrast Greenhouse

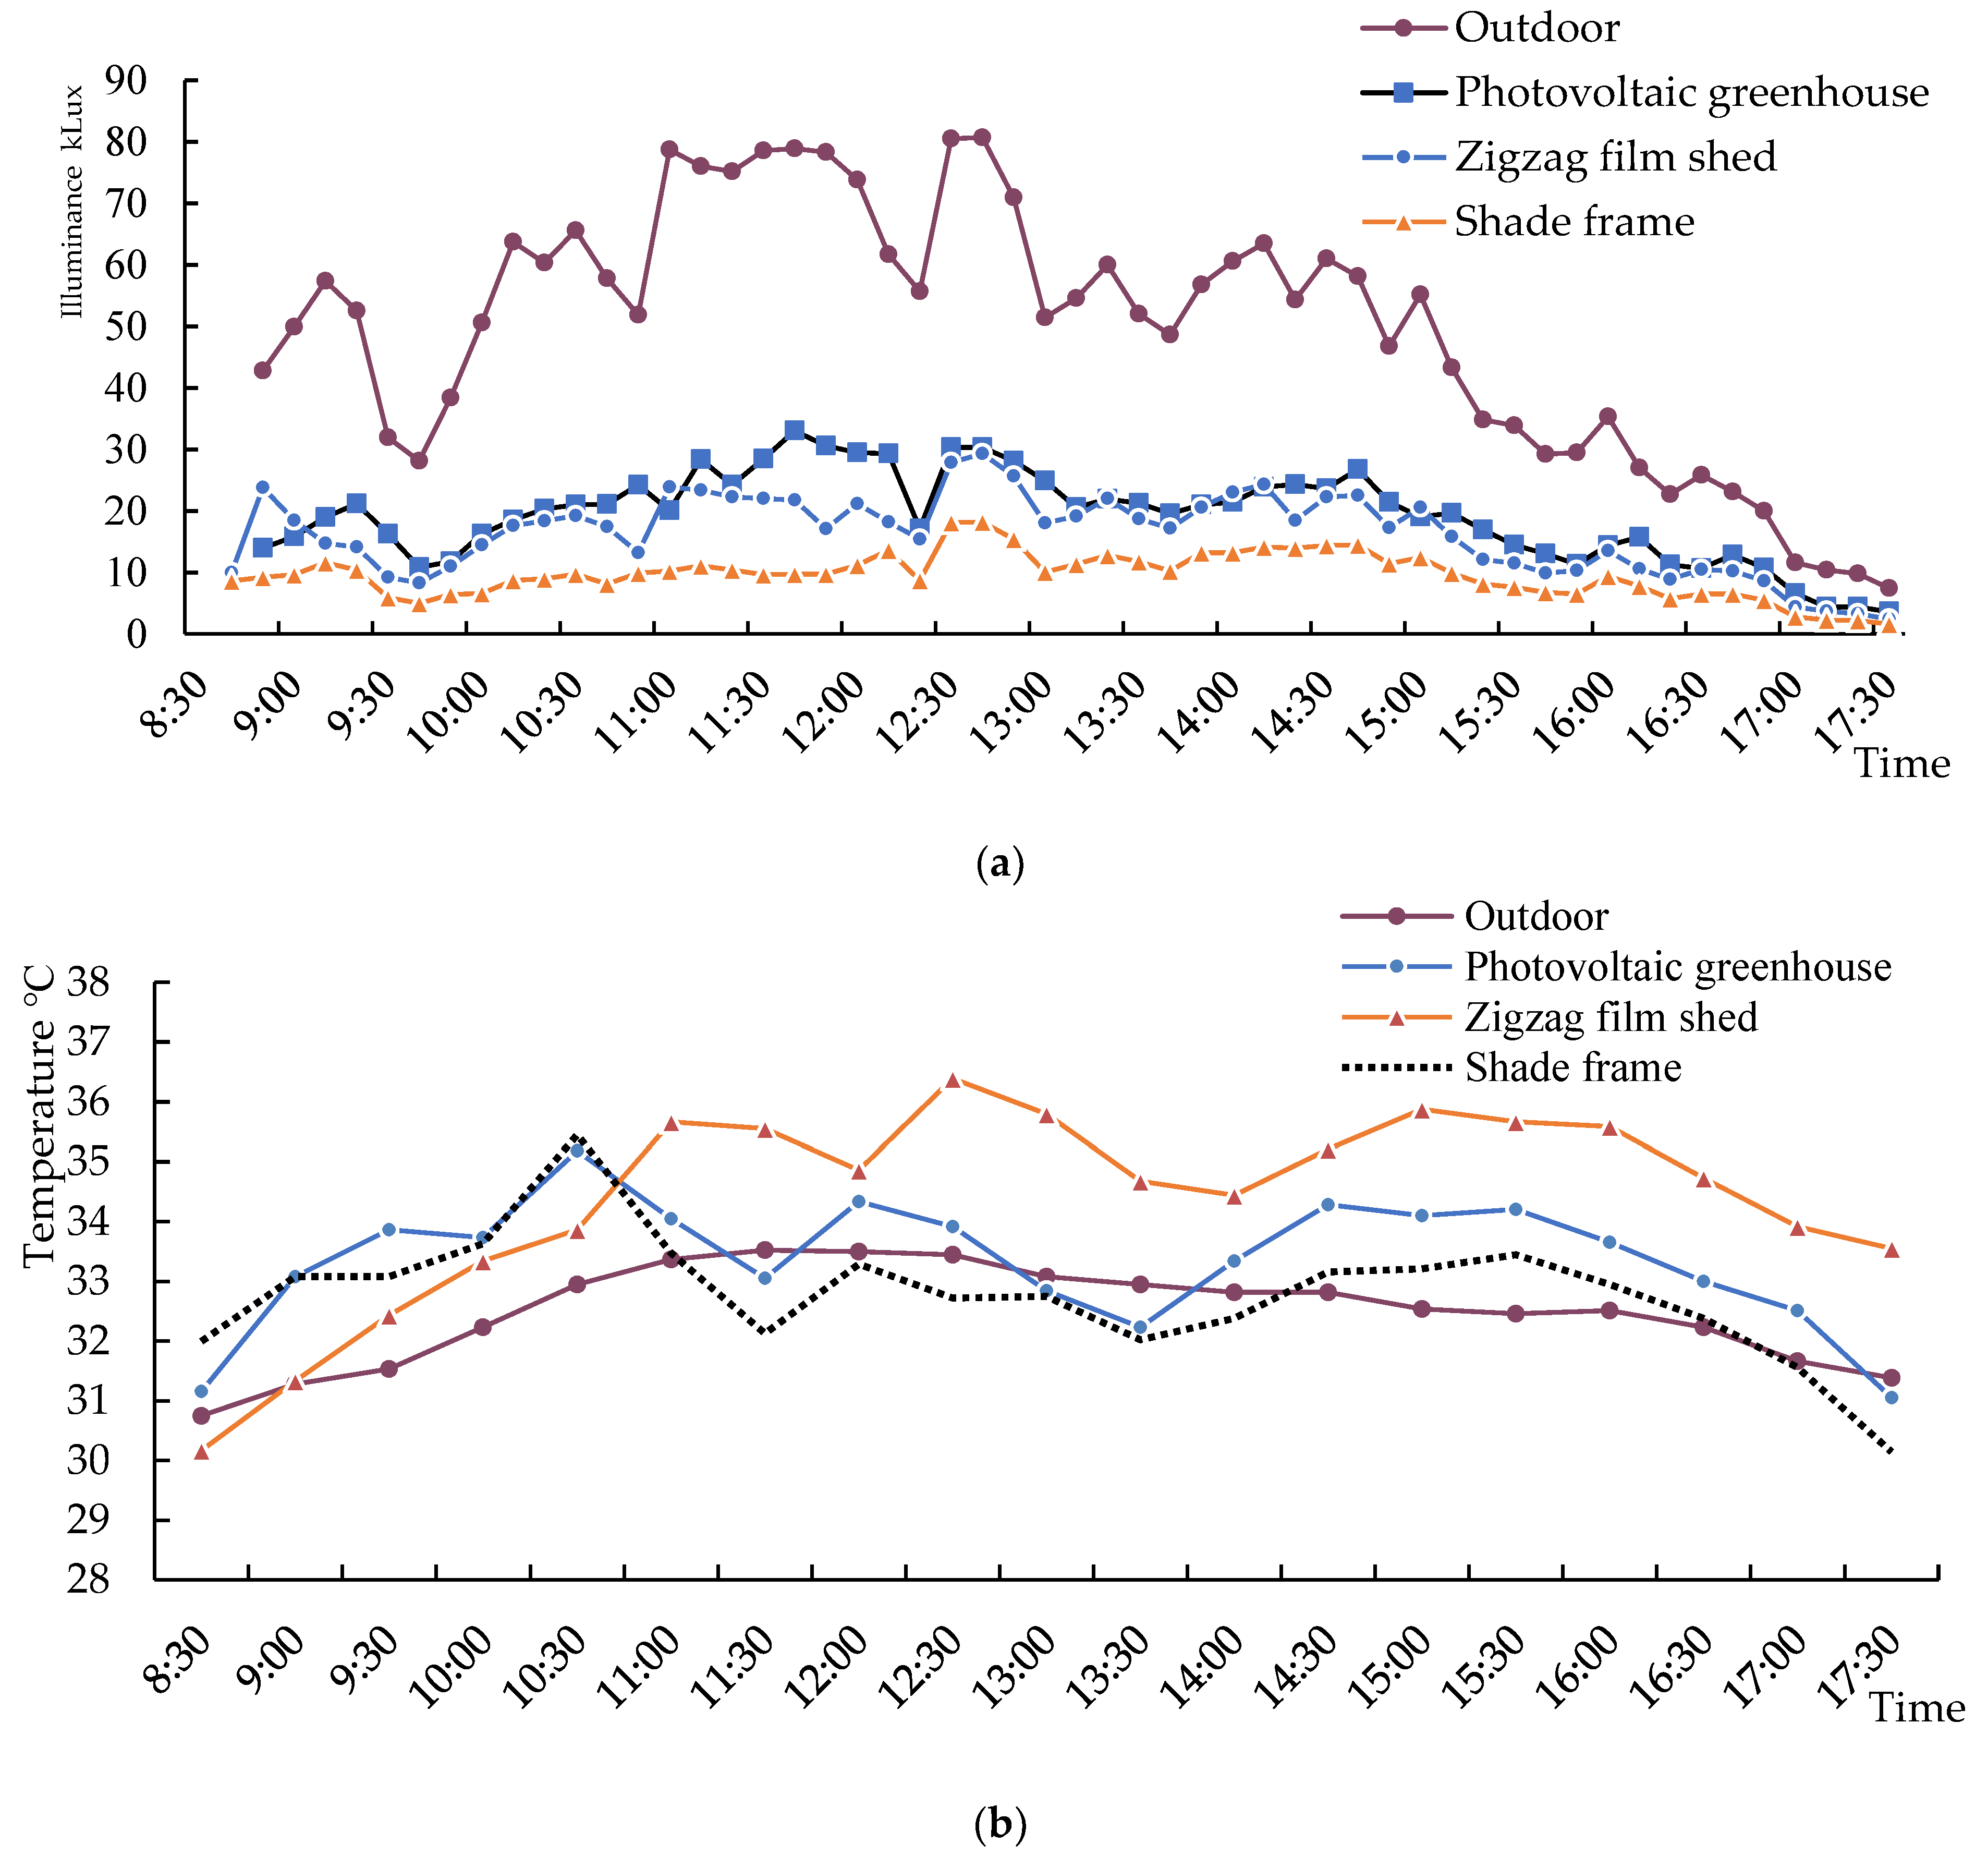
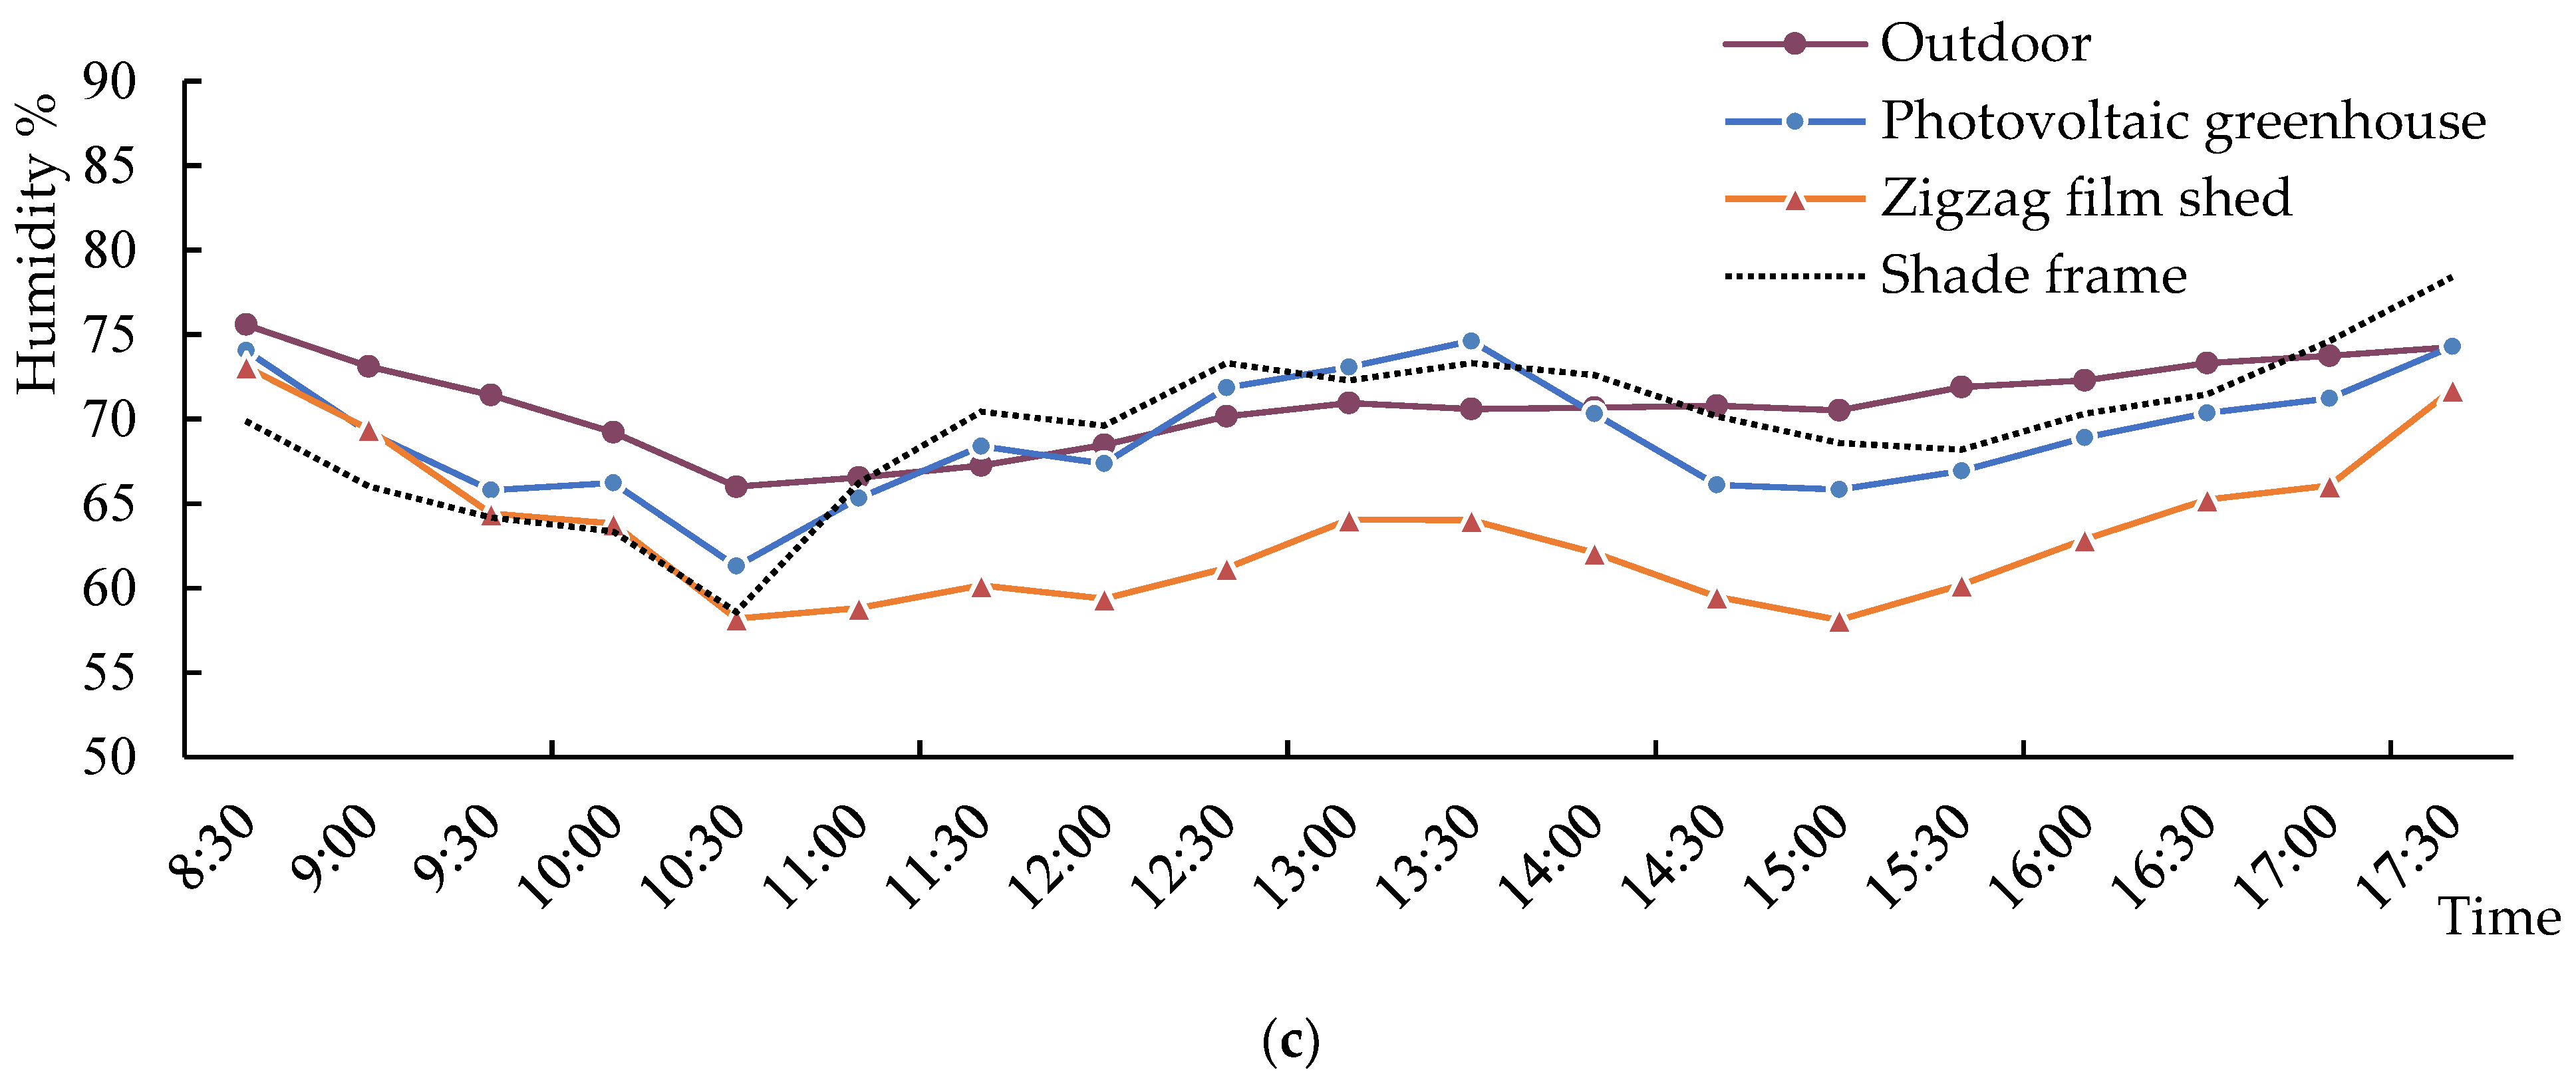
Zigzag-film greenhouses and sunshelters are widely applied in tropical areas. This study made a parallel comparison on the illuminance and temperature and humidity between a photovoltaic greenhouse, a zigzag-film greenhouse, and a sunshelter. Results are shown in Figure 7 and Table 5. During the comparison, the compound mean values of the collection sites were used for the photovoltaic greenhouse data, while the measured values of the collection sites were used for the zigzag-film greenhouse and sunshelter data. The test time was 9 May 2015. The weather was cloudy. The roof shelter of the zigzag-film greenhouse was kept open during the test, and the plastic film covered on its roof and wall had been used for four years, which had the problem of stains, aging and reduced light transmittance, etc. The photovoltaic greenhouse and the sunshelter were newly built and had been used for less than one year.
According to Figure 7 and Table 5, for the average illumination were shown in descending order: the photovoltaic greenhouse > the zigzag-film greenhouse > the sunshelter; the outdoor temperatures were between 30.7 and 33.5 °C, and the relative humidity values were between 66% and 76%. For the average temperatures were shown in descending order: the zigzag-film greenhouse (34.4 °C) > the photovoltaic greenhouse (33.3 °C) > the sunshelter (32.8 °C). The difference was not significant, and the temperature and humidity environment of the photovoltaic greenhouse was close to that of a normal greenhouse. The zigzag-film greenhouse had a relatively high temperature, because it was covered with films (some roll-film is open) and had poorer venting compared with the photovoltaic greenhouse and the shelter which were covered with a sunshade net.

3.4. DesignBuilder Simulation Analysis

The modeling of a photovoltaic greenhouse was conducted in Design Builder based on the size of the experimental photovoltaic greenhouse. The photovoltaic modules on the roof surface were composed of a 3 mm toughened glass and a light proof backplane, which were set as a light proof with a heat conductivity coefficient of 0.76 W/(m·K); the light transmittance of the roof film was set as 85% with a heat conductivity coefficient of 0.17 W/(m·K); the vent was covered with an insect-proof screen with a light transmittance of 76.5% [15] and a void ratio of 53.76% [16]; the light transmittance and the compound void ratio of the surrounding shading net were 10% and 30%, respectively.

3.4.1. Light Environment Simulation

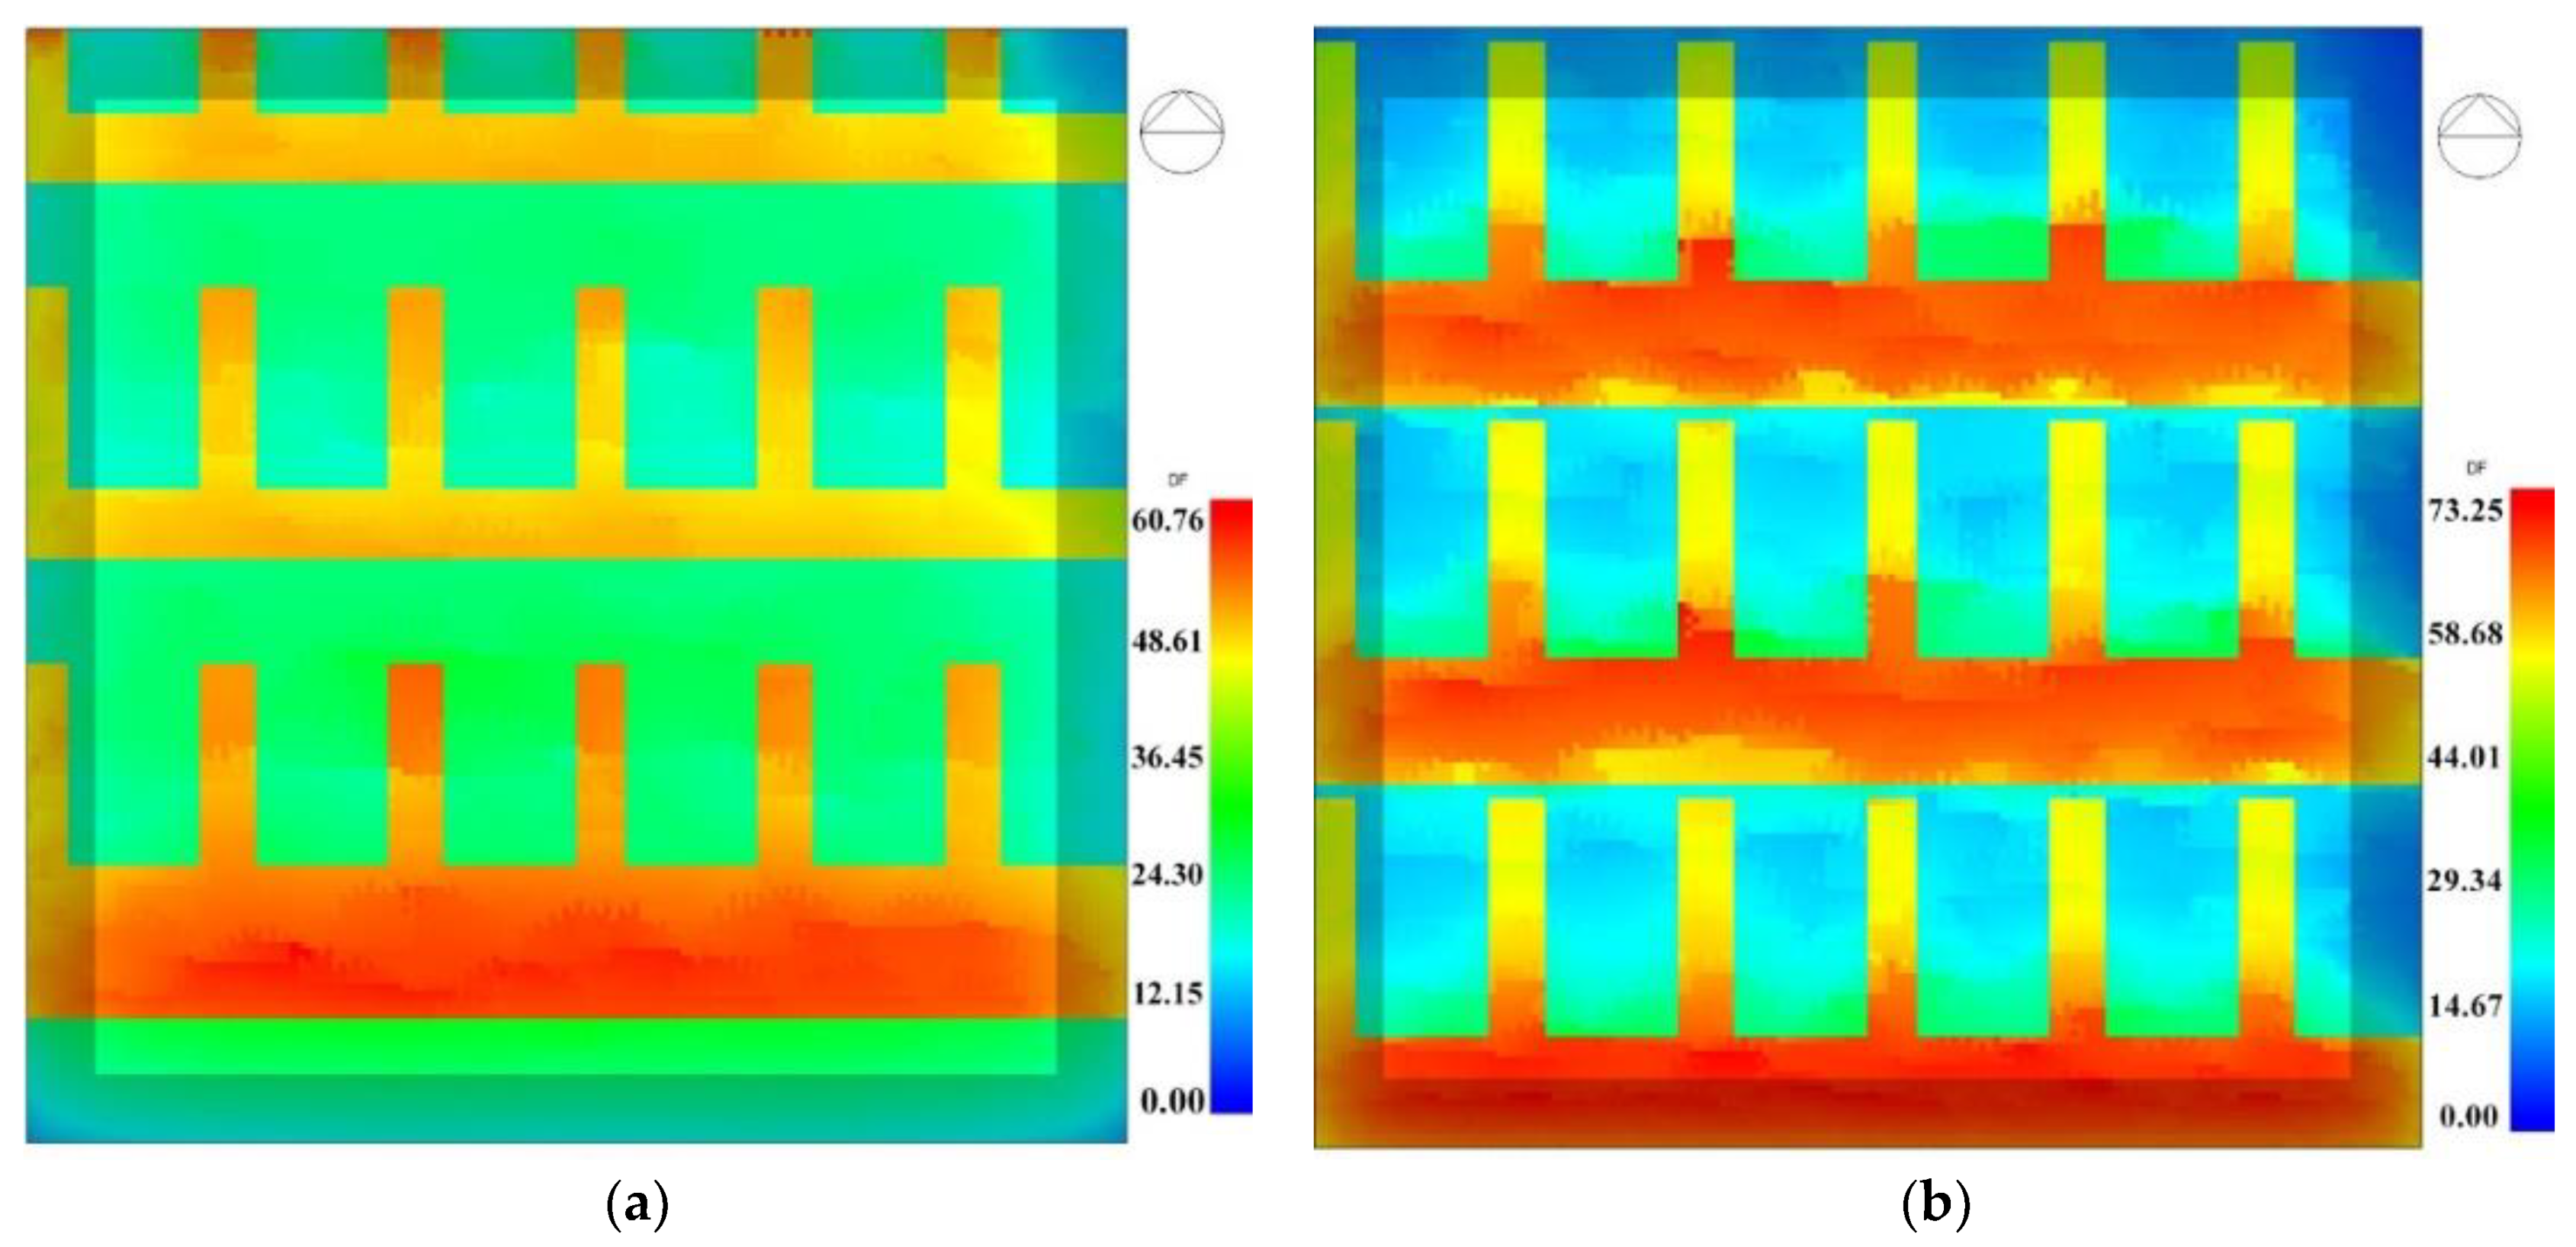
This experiment selected two periods (10:00–16:00 on 5 January 2002 in winter and 9:00–16:00 on 29 July 2002 in summer) to conduct indoor natural light simulation. As weather has significant impact on indoor light intensity and it is hard to predict the weather, this simulation used a daylighting coefficient (light transmittance) as the evaluation index. The simulation cloud at noon (12:00) is shown in Figure 8.
According to Figure 8, there were obvious partitions for indoor light transmittance due to the shielding of photovoltaic modules. The light transmittances of the area covered by a film and the area covered by photovoltaic modules were significantly different. The changing trends of the light transmittance between the simulated data and the measured data were basically the same. When using photovoltaic modules, the daylighting coefficient in summer was lower than that in winter; but the daylighting coefficient of the photic area in summer was higher than that in winter when using films. In winter, as the solar altitude decreased, the transmittance boundary between the daylighting area and the power generation area gradually moved to the north, and the projected area of the photovoltaic modules was larger.
To ascertain if weather has an effect on the light transmittance at a specific moment, we adopted software to simulate the light transmittance at each moment and calculated the average light transmittance of each simulation moment according to the simulation model. The light transmittance of each moment was averaged to obtain the average light transmittance of a day, which was then compared with the actually measured light transmittance. In winter, the simulated average light transmittance of the photovoltaic greenhouse was 33.09%, and the measured average light transmittance was 25.77%; in summer, the simulated average light transmittance was 37.54%, and the measured value was 32.35%. Regardless of winter or summer, the actually measured value was smaller than the simulated value. The main reason may be the influence of the sheltering of the greenhouse frame or roof grooves at certain moments.
The simulated light transmittance was relatively reliable according to the analyses of the distribution trends and the average light transmittance. The influence coefficient of the greenhouse frame and affiliated components should be considered during the daylighting simulation of the photovoltaic greenhouse. The influence rate in winter was about 20.9%, compared with that of 15% in summer.

3.4.2. Thermal Environment Simulation

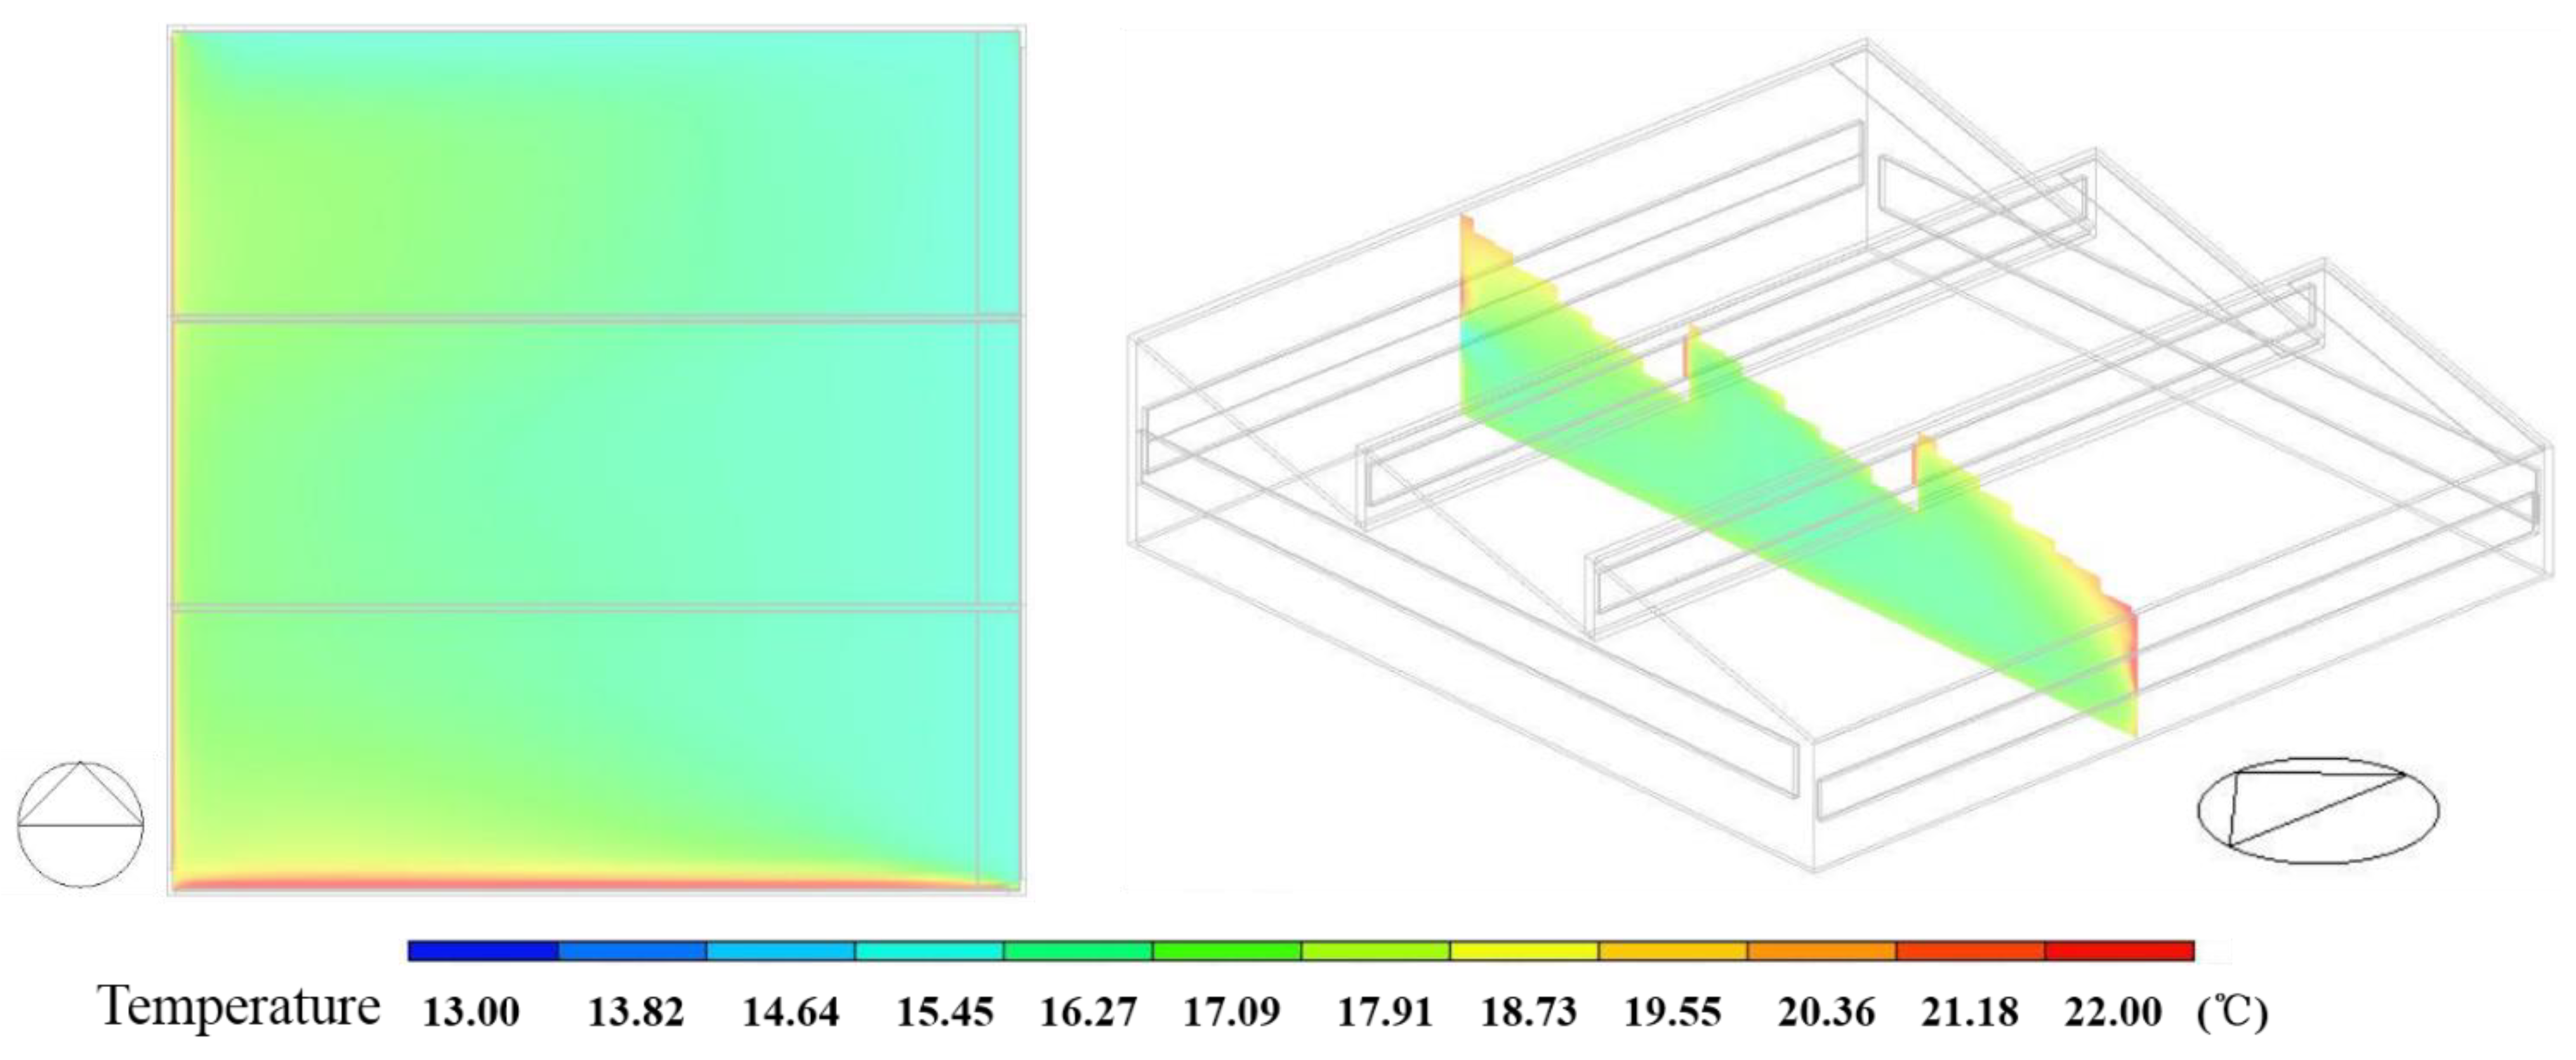
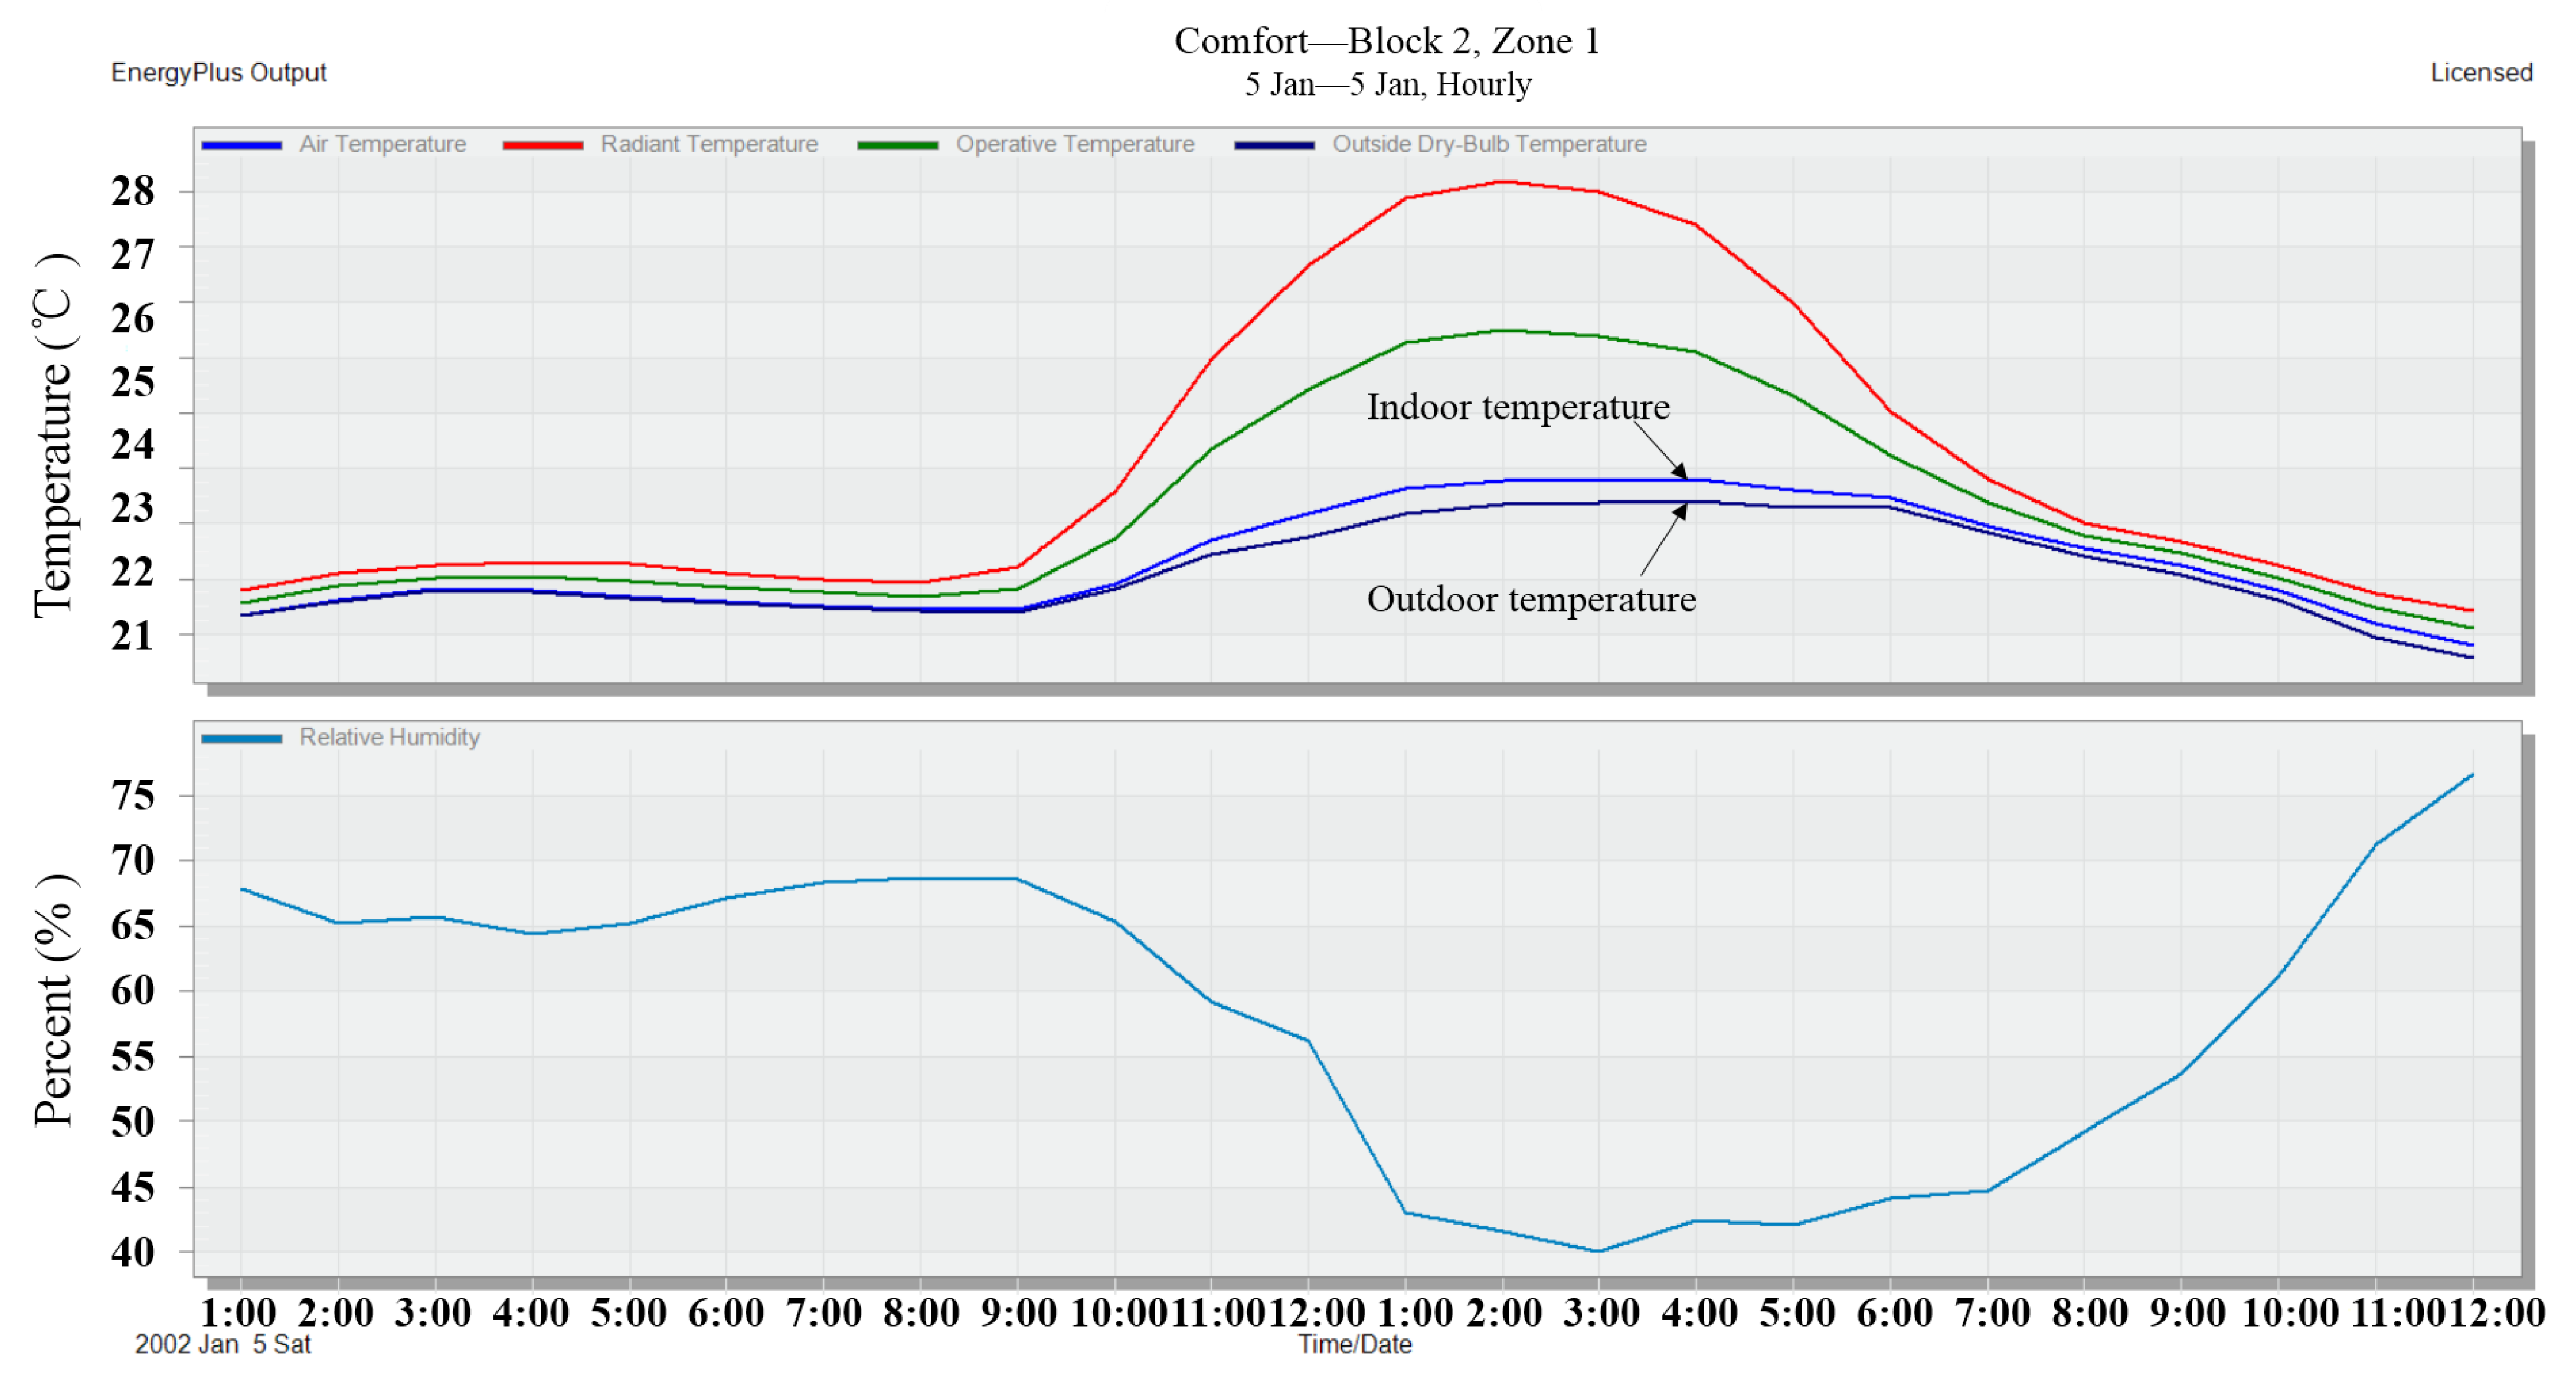
The thermal environment simulation also selected the same two days as the light environment simulation (5 January 2002 in winter and 29 July 2002 in summer) to conduct the indoor temperature field and thermal environment simulation. The temperature cloud map and the indoor and outdoor temperature change curves in winter and summer are shown in Figure 9, Figure 10, Figure 11 and Figure 12.
As outdoor temperature is easily affected by weather conditions (the outdoor temperatures of this simulated weather model were 11.1–16.8 °C, and the actually measured outdoor temperatures were 22.3–29.2 °C), the temperature simulation was only used for temperature change law analysis. According to the temperature cloud map of the photovoltaic greenhouse in winter (Figure 9), the distribution law of the temperature in the photovoltaic greenhouse in winter was as follows: the temperatures on the south and west sides were higher than those on the east and north sides; the distribution of the temperature of the vertical plane gradually reduced from high to low, but the ground temperature was slightly high.
The temperature change curves in photovoltaic greenhouse in winter (Figure 10) showed that the indoor and outdoor temperature difference reached the maximum at 13:00 (approximately 1 °C), the indoor relative humidity reduced with the increase of temperature and the highest temperature and the lowest relative humidity appeared at about 15:00. The measured indoor and outdoor temperature and humidity change trends were basically the same as the simulated data. However, the measured data were easily influenced by the weather, and the indoor temperature became lower than the outdoor temperature after 16:00.
According to Figure 11, the temperature was even in most of indoor areas, with the wall and the vent being a little higher and the ground being a little lower. This is mainly because the prevailing wind direction of the local area in summer was southeastern. The south elevation of the greenhouse was the windward side, and the serrated vent on the north side had a negative pressure. Hence, the internal heat normally accumulated at the serrated vent and the lower part of the wall. During the simulation, the northern serrated vent had a larger range of high temperature than the two serrated vents on the south side. This is because the area was also covered with a shading net, except for the insect-proof screen, which would reduce the venting ability of the area and affect the discharge of hot air.
According to Figure 12, the indoor relative humidity changed with the increase of temperature. The highest temperature and the lowest humidity appeared at about 13:00. The indoor temperature was slightly lower than the outdoor temperature before 9:00 and was higher than the outdoor temperature during 9:00–15:00. The two temperatures were close during 15:00–17:00. This trend was basically the same as the measured results. However, the temperature difference of the measured data was about 2 °C higher than that of the simulated data, and the temperature rise was 1 h earlier than the simulation. This had a certain relationship with the actual wind speed, the weather condition, and the environment during the test day.

4. Discussion

4.1. Both Light and Temperature Factors Should Be Considered When Studying the Adaptivity of the Photovoltaic Greenhouse

The deployment of photovoltaic modules on the daylighting surface of a greenhouse would definitely reduce the daylighting of the greenhouse. It is hard to achieve a scale effect of power generation when deployed a small-scale of photovoltaic modules. However, a large proportion of photovoltaic modules may occupy the light resources rather than leave it for the crops in the greenhouse. Therefore, the intensity of daylighting in a photovoltaic greenhouse has become a key issue in the research of photovoltaic greenhouses. Xue et al. investigated the light environment of a photovoltaic solar greenhouse in summer as well as its effect on the growth of tomato [17]. Their findings showed that the photovoltaic solar greenhouse is effective in cooling down the greenhouse in summer and the indoor light environment can satisfy the growth requirement of tomato. Sheng et al. studied the growth, photosynthesis, yields, and quality of Chinese cabbage which were grown in a single photovoltaic greenhouse with double-slope roofs under two different coverage modes of photovoltaic modules (33% and 50%) during October–November (Changzhou, Jiangsu) [18]. The results showed that a 33% coverage of the photovoltaic greenhouse can be used for normal Chinese cabbage cultivation and production. Yong et al. measured and simulated (Ecotect) the average light transmittance of a photovoltaic greenhouse with different coverage methods and coverage rates of the photovoltaic greenhouse and analyzed the light transmittance in the photovoltaic solar greenhouse with different coverages and deployment methods of photovoltaic modules [19]. The results showed that the light transmittance of a traditional greenhouse was 58.87%, the overall light transmittance of a photovoltaic greenhouse with a coverage of 58% longitudinally spaced photovoltaic modules was 38.45%, and the overall light transmittance of a photovoltaic greenhouse with coverages of 58% and 81% horizontally spaced photovoltaic modules were 29.00% and 24.21%, respectively. The above studies have made detailed investigation on the illuminance of photovoltaic greenhouses with different coverage of modules as well as their impacts on the production in the greenhouses from the perspective of light.
Environmental factors inside greenhouses are mutually restricted and related, so the shade created by photovoltaic modules certainly will affect the indoor temperature. The adaptability of a photovoltaic greenhouse should be studied synchronously from light and temperature environment. Especially for the winter production of solar greenhouses in North China, light not only is used for the photosynthesis of crops, but can also be used as a heat resource for the wall and ground of greenhouses to achieve the purpose of no or less heating in winter production. The winter in tropical areas is warm with an average temperature of above 10 °C, so there is no need to consider heat storage or use of heat-preservation equipment. The shading of photovoltaic modules will not only affect the heating demand of the greenhouse, but also can create shades in summer, so that it can help to alleviate the high temperature inside the greenhouse.

4.2. Ventilation and Shading of Photovoltaic Greenhouses in Tropical Areas

Comparative tests were conducted between the photovoltaic greenhouse, the zigzag-film greenhouse (including an external shade), and the sunshelter during summer time. Results: the sunshelter had the lowest indoor average temperature (32.8 °C) due to their good ventilation and shading performance; the photovoltaic greenhouse had a medium indoor average temperature (33.3 °C), as the photovoltaic modules created some part of shade and the surrounding parts and zigzag vents had good ventilation; the zigzag-film greenhouse had the highest indoor average greenhouse (34.4 °C), because the surroundings were covered by film with some roll-films open; the indoor average illuminance was shown in descending order: the photovoltaic greenhouse (21.51 kLux) > the zigzag-film greenhouse (18.17 kLux) > the sunshelter (10.66 kLux). The comparison showed that ventilation and shading can effectively reduce the internal temperature of greenhouses and the sheltering effect of photovoltaic modules is useful for the production of greenhouses in tropical areas. According to the temperature simulation cloud in summer (Figure 11), the north elevation vent had a higher temperature than other vents, because the north vent was covered with a solar-shading screen which reduced the ventilation area. It indicated that good ventilation is an important means of controlling high indoor temperature in summer. Therefore, photovoltaic greenhouses in tropical areas only need to consider using a good ventilation structure without other facilities to satisfy the temperature requirements of agricultural production. This can also make the structure more unified, reduce the construction cost and contribute to the promotion and development of photovoltaic greenhouses in tropical areas.

5. Conclusions

5.1. The Indoor Illuminance, Temperature, and Humidity of a Photovoltaic Greenhouse Can Satisfy the Growth of Crops

In this paper, the illuminance, temperature, and humidity of a specific photovoltaic greenhouse in a tropical area were studied simultaneously. The result were shown as follows: (a) Illuminance: in winter (5 January 2016, limited rain), the distribution of indoor illuminance was relatively even. The average illuminance between 10:00 and 16:00 was 7.02 kLux (the illuminance even reached 9.35 kLux during 13:30–15:30), and the average light transmittance was 25.77%; in summer (thundershower on 28 July 2015, thundershower to cloudy on 29 July 2015; cloudy and sunny on 31 July 2015), the distribution of indoor illuminance was not even. The maximum and minimum compound average illuminances of the collection sites were 24.52 and 10.09 kLux, respectively. The difference was about 59%, which indicated an uneven distribution of illuminance in the photovoltaic greenhouse. The average light intensity and the average light transmittance in summer were 15.47 kLux and 32.35%, respectively. (b) Temperature and humidity: the indoor average temperatures in winter were between 22.2 and 28.4 °C, and the average relative humidity values were between 68.8% and 95.8%, which were basically the same as the outdoor average temperature and humidity; the indoor average temperatures in summer were between 26.2 and 36.2 °C, and the average relative humidity values were between 50.9% and 90.3%. The temperatures of all the measurement sites were higher than the outdoor temperature. The average temperature difference was 2.7 °C, with the maximum difference of 3.9 °C and the minimum difference of 1.4 °C.
The simulations of illuminance, temperature, and humidity in the photovoltaic greenhouse were performed using Design Builder. The simulation trend was basically the same as the measured results. Based on the above research, it was concluded that the illuminance, temperature, and humidity of the photovoltaic greenhouse studied in this paper can basically satisfy the production requirements of shade-enduring and neutral crops.

5.2. Organic Combination of Greenhouse Production and Photovoltaic Power Generation

The coverage rate of roof photovoltaic modules used for the photovoltaic greenhouse in this experiment has reached 76.9%, which showed obvious scale effects of power generation. Meanwhile, the planting of various leaf vegetables also showed good crop production. For example, the yield of pakchoi after planted for 35 days (planted in October–November) can reach 2.27 kg/m2, which means that the yield per mu can reach 1211 kg/mu when we assumed the actual utilization rate to be 80%. Obviously, this yield is higher than the average level of 750–1000 kg/mu for open-field planting in the area [20]. The planting test showed that the photovoltaic greenhouse can basically meet the normal production of leaf vegetables, which laid a feasibility basis for the realization of photovoltaic generation and agricultural production in tropical areas at the same time.
The tests were not continuous due to experimental condition limitations. The light intensity at the time and weather when we made the tests was bad in the area. For example, the summer tests were conducted mostly in thundershower weather. No data in sunny days were obtained. While in winter, the tests were conduced in limited rain when the daylighting was very weak. However, the findings of this paper can provide useful data for the further improvement of design and promotion. Future studies can focus on the structural optimization by combining simulation software and actual measurement data, make more reasonable environmental parameter test collection schemes, engage more test varieties and systematically test and analyze the growth cycles, quality, and yield of vegetables.

6. Patents

A zigzag-shaped photovoltaic greenhouse for agricultural planting, ZL 201320738494.4, Jian Liu, Hainan University, 20150114.

Author Contributions

Conceptualization, J.L. and B.W.; methodology, Y.C.; software, B.W.; validation, X.W., Y.N., and Y.C.; formal analysis, X.W.; investigation, Y.C.; resources, J.L.; data curation, Y.C.; writing—original draft preparation, B.W.; writing—review and editing, J.L.; visualization, Y.C.; supervision, B.W.; project administration, J.L.; funding acquisition, B.W. All authors have read and agreed to the published version of the manuscript.

Funding

This research was funded by Hainan Provincial Natural Science Foundation of China (grant number: 520RC551) and Hainan University Scientific Research Fund (grant number: KYQD(ZR)20054).

Institutional Review Board Statement

Not applicable.

Informed Consent Statement

Not applicable.

Data Availability Statement

All data presented in this article are in the form of figures and tables.

Conflicts of Interest

The authors declare no conflict of interest.

References

  1. Zhou, C. Doctor Zhou’s Investigation (29) Continuous innovation of Shouguang solar greenhouse in Shandong (2)—Development and application of solar photovoltaic greenhouse technology. Agric. Eng. Technol. Greenh. Hortic. 2013, 11, 40–41. [Google Scholar] [CrossRef]
  2. Zhou, C. Doctor Zhou’s Investigation (86) Photovoltaic solar greenhouse covered with photovoltaic modules and its performance. Agric. Eng. Technol. 2018, 38, 39–47. [Google Scholar]
  3. Zhou, C. Doctor Zhou’s Investigation (93) Diversified arrangement of photovoltaic modules in greenhouse—A case study of Nongguang Complementary Facilities Agricultural Industrial Park, Xintai city, Shandong Province. Agric. Eng. Technol. 2019, 39, 36–41. [Google Scholar]
  4. Qi, J.; Ca, L.; Li, J. Comparative study on the environment of different photovoltaic greenhouses and greenhouse in winter in Ningxia. Acta Agric. Zhejiangensis 2017, 29, 414–420. [Google Scholar] [CrossRef]
  5. Ezzaeri, K.; Fatnassi, H.; Wifaya, A.; Bazgaou, A.; Aharoune, A.; Poncet, C.; Bekkaoui, A.; Bouirden, L. Performance of photovoltaic canarian greenhouse: A comparison study between summer and winter seasons. Sol. Energy 2020, 198, 275–282. [Google Scholar] [CrossRef]
  6. Dong, W.; Zhou, Z.; Liu, W.; Tian, F.; Liu, S.; Zhao, J. Environment Condition Contrast between Indoor and Outdoor of Photovoltaic Greenhouse. Agric. Eng. 2015, 5, 44–48. [Google Scholar]
  7. Hassanien, R.; Ming, L.; Fang, Y. The integration of semi-transparent photovoltaics on greenhouse roof for energy and plant production. Renew. Energy 2018, 121, 377–388. [Google Scholar] [CrossRef]
  8. Fatnassi, H.; Poncet, C.; Bazzano, M.M.; Brun, R.; Bertin, N. A numerical simulation of the photovoltaic greenhouse microclimate. Sol. Energy 2015, 120, 575–584. [Google Scholar] [CrossRef]
  9. Fan, Y. Optimization of indoor thermal environment of traditional stone dwellings in South Shandong Based on Design Builder. In Proceedings of the 2020 International Conference on Green Building and Building Energy Conservation, Zurich, Switzerland, 27–28 July 2020; pp. 321–326. [Google Scholar]
  10. Song, T. Comparative study of building thermal simulation between DesignBuilder and Ecotect. Archit. Eng. Technol. Des. 2018, 2, 531–532. [Google Scholar] [CrossRef]
  11. Blanco, J.M.; Buruaga, A.; Rojí, E.; Cuadrado, J.; Pelaz, B. Energy assessment and optimization of perforated metal sheet double skin facades through Design Builder; A case study in Spain. Energy and Buildings. Energy Build. 2015, 111, 326–336. [Google Scholar] [CrossRef]
  12. Wang, C.; Wang, G. Study of Distribution Rule of Solar Energy Resources in Hainan. J. Hainan Norm. Univ. Nat. Sci. 2011, 24, 168–173. [Google Scholar]
  13. Liu, J. A Zigzag Multi-Span Photovoltaic Greenhouse for Agricultural Planting. China Patent ZL 201320738494.4, 14 January 2015. [Google Scholar]
  14. GB50797-2012. Code for Design of Photovoltaic Power Station; Ministry of Housing and Urban Rural Development of the People’s China: Beijing, China, 2012; pp. 101–102.
  15. Zhang, Y.; Zou, Z.; Bao, E.; Yang, Y.; Tang, Q. Experimental study and PAR Simulation of global transmittance of energy saving photovoltaic solar greenhouse. Agric. Eng. Technol. 2017, 37, 31–34. [Google Scholar] [CrossRef]
  16. Yan, D.; Xu, K.; Zhang, Q.; Li, X. Experimental study on wind load of insect repellent net with different mesh. Agric. Eng. Technol. 2020, 40, 57–63. [Google Scholar] [CrossRef]
  17. Zhao, X.; Zou, Z.; Xu, H.; Zhao, J.; Li, J. Effects of summer light environment on tomato growth in photovoltaic solar greenhouse. J. Northwest A F Univ. Nat. Sci. Ed. 2013, 41, 93–99. [Google Scholar] [CrossRef]
  18. Shu, S.; Yu, J.; Tao, M.; Yu, S.; Sun, J.; Guo, S. Effects of Photovoltaic Greenhouse on Growth. Photosynth. Qual. Pakchoi China Veg. 2017, 4, 44–47. [Google Scholar] [CrossRef]
  19. Zhang, Y. Effects of different color insect control nets on greenhouse coverage and growth of fast growing leaf vegetables. Shanghai Veg. 2000, 1, 32–34. [Google Scholar]
  20. Li, D.; Cai, X.; Fu, J. Comparison of several main wild vegetables and common leaf vegetables in Hainan Province. Heilongjiang Agric. Sci. 2014, 10, 168–169. [Google Scholar] [CrossRef]
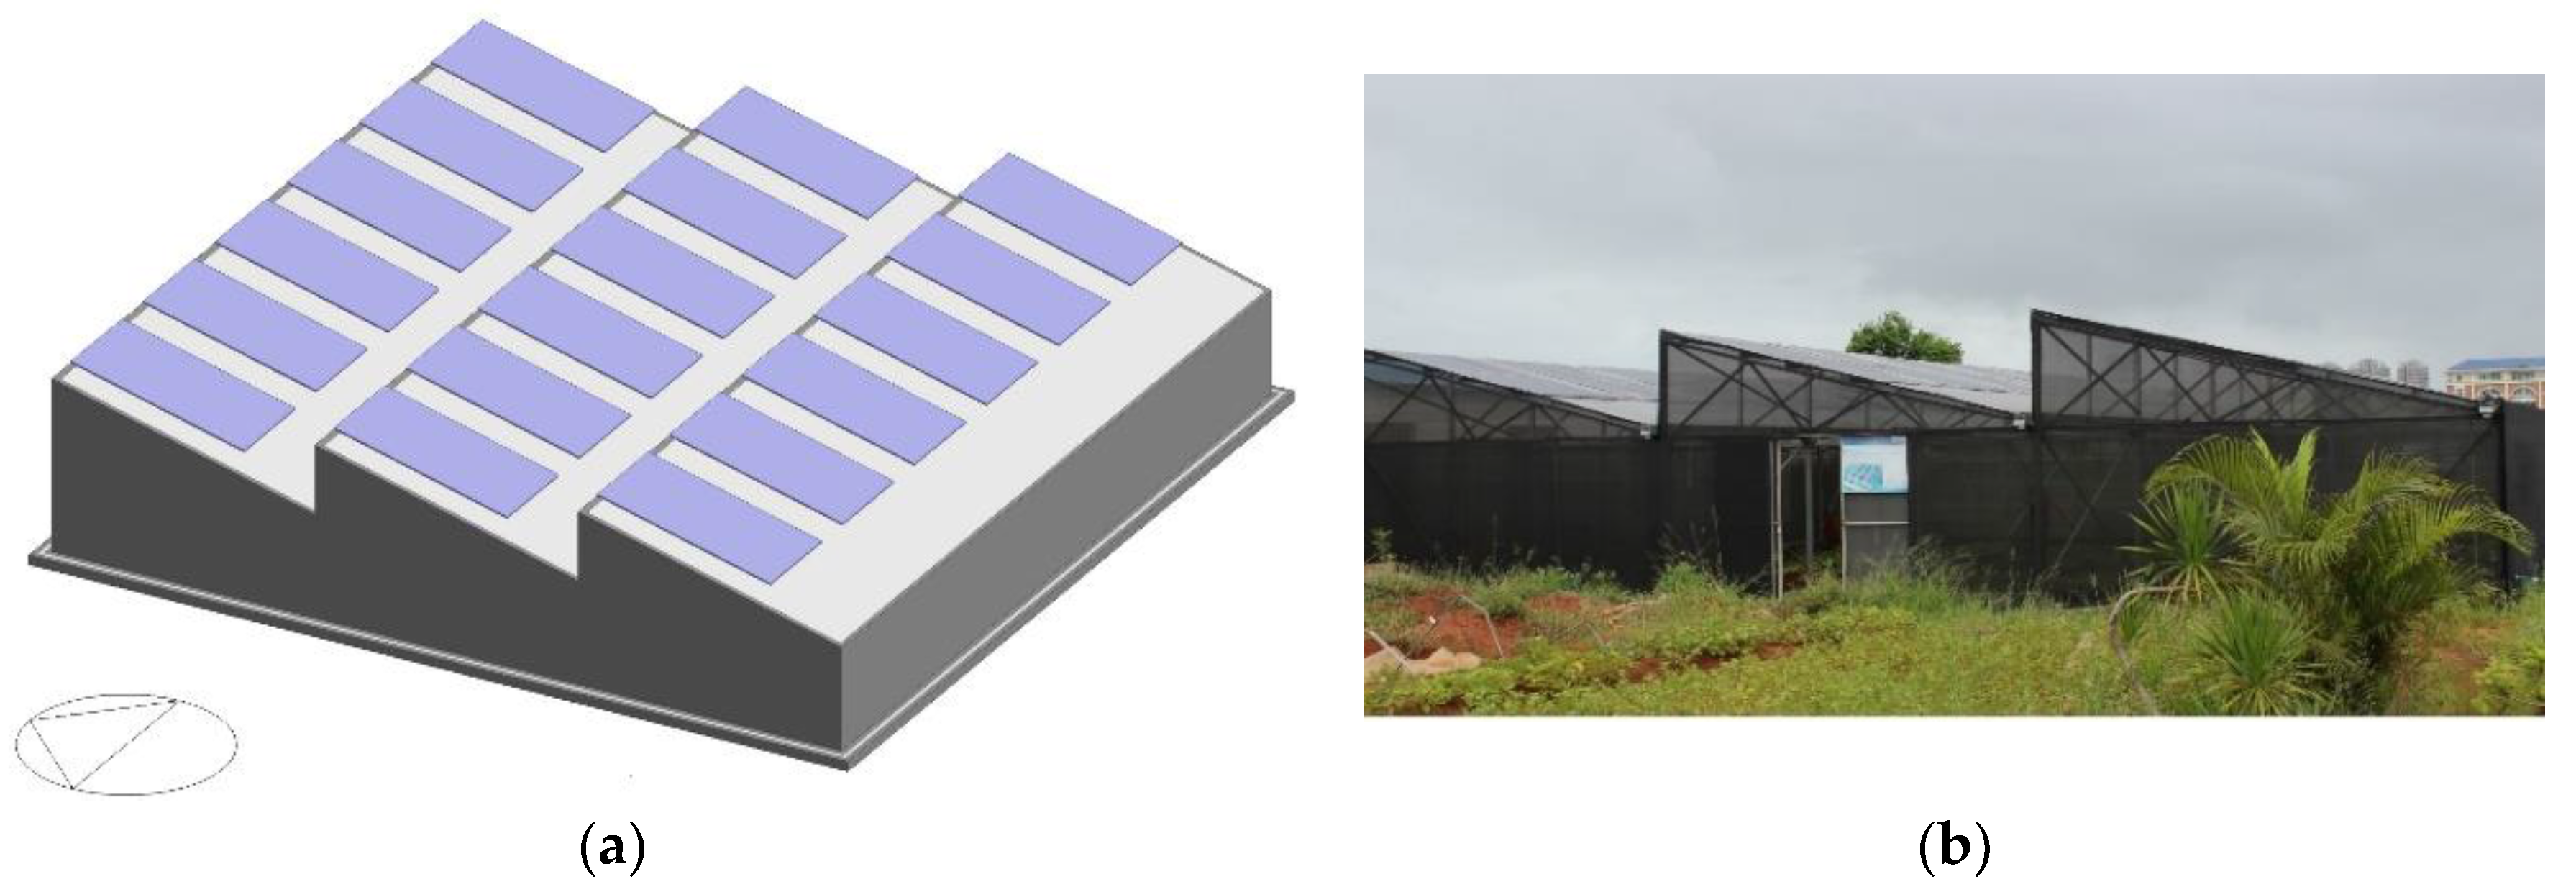
Figure 1. Simulation model and real structure of the experimental photovoltaic greenhouse: (a) simulation model; (b) real model.
Applsci 11 10785 g001
Figure 2. Greenhouse collection layout plan and section diagram: (a) layout plan of collection points; (b) longitudinal section of collection point 1 showing the coverage with opaque photovoltaic module 2, the coverage with plastic sheeting 3, the coverage with plastic sheeting 4, and the covering strip between photovoltaic modules.
Applsci 11 10785 g002
Figure 3. Changes of the light intensity in the photovoltaic greenhouse during limited rain winter.
Applsci 11 10785 g003
Figure 4. Changes of the light intensities in the photovoltaic greenhouse under different weather conditions in summer: (a) thunder shower; (b) thunderstorm to cloudy; (c) sunny interval.
Applsci 11 10785 g004aApplsci 11 10785 g004b
Figure 5. Temperature and humidity changes inside and outside the photovoltaic greenhouse in winter: (a) indoor and outdoor temperature; (b) indoor and outdoor humidity.
Applsci 11 10785 g005aApplsci 11 10785 g005b
Figure 6. Temperature and humidity changes inside and outside the photovoltaic greenhouse in summer: (a) indoor and outdoor temperatures; (b) indoor and outdoor humidity values.
Applsci 11 10785 g006
Figure 7. Comparison of illuminance and temperature and humidity between the photovoltaic greenhouse, the zigzag-film greenhouse, and the sunshelter: (a) illuminance comparison; (b) temperature comparison; (c) relative humidity comparison.
Applsci 11 10785 g007aApplsci 11 10785 g007b
Figure 8. Simulation cloud of the light transmittance of the photovoltaic greenhouse in winter (a) and summer (b).
Applsci 11 10785 g008
Figure 9. Temperature simulation cloud in the photovoltaic greenhouse in winter.
Applsci 11 10785 g009
Figure 10. Temperature and humidity change curves of the photovoltaic greenhouse in winter.
Applsci 11 10785 g010
Figure 11. Indoor temperature simulation cloud of the photovoltaic greenhouse in summer.
Applsci 11 10785 g011
Figure 12. Temperature and humidity change curves of the photovoltaic greenhouse in summer.
Applsci 11 10785 g012
Table 1. Average light intensity and light transmittance of the photovoltaic greenhouse in winter.
OutdoorSite ASite BSite CSite DSite ECompound Average
Average light intensity (kLux)27.236.486.957.996.697.297.02
Light transmittance 23.79%25.53%29.35%24.56%26.77%25.77%
Table 2. Average light intensities and transmittances in the photovoltaic greenhouse under different weather conditions in summer.
DateItemOutdoorSite ASite BSite CSite DSite ECompound Average
28 July
thundershower
Light intensity (kLux)34.048.3012.3315.1310.3219.3912.53
Light transmittance 24.38%36.21%44.44%30.31%56.95%36.82%
29 July
thundershower to cloudy
Light intensity (kLux)51.438.4712.2819.1011.4126.1614.18
Light transmittance 16.47%23.87%37.13%22.19%50.86%27.57%
31 July
cloudy and sunny
Light intensity (kLux)60.3113.5020.3321.7717.6028.0019.71
Light transmittance 22.38%33.71%36.09%29.19%46.43%32.67%
Average of the three daysLight intensity (kLux)48.6010.0914.9818.6613.1124.5215.47
Light transmittance 21.08%31.27%39.22%27.23%51.41%32.35%
Table 3. Temperature and humidity extremum values inside and outside the photovoltaic greenhouse in winter.
5 January 2016OutdoorSite ASite BSite CSite DSite ESite FSite GIndoor
Average
Highest temperature (°C)29.229.327.228.928.029.027.628.528.4
Lowest temperature (°C)22.322.122.322.222.322.422.222.222.2
Highest relative humidity (%)959696979794969595.8
Lowest relative humidity (%)666571697067726868.8
Table 4. Temperature and humidity extremum values inside and outside the photovoltaic greenhouse in summer.
29 JulyOutdoorSite ASite BSite CSite DSite ESite FSite GIndoor
Average
Highest temperature (°C)33.535.235.537.435.038.036.036.336.2
Lowest temperature (°C)26.126.326.026.525.626.626.226.426.2
Highest relative humidity (%)889194889388898790.3
Lowest relative humidity (%)555552495446495150.9
Table 5. Comparison of the averaged values between the photovoltaic greenhouse and other shelter types.
9 May 2015OutdoorPhotovoltaic GreenhouseZigzag-Film GreenhouseSunshelter
Average daylight illumination (kLux)49.5621.5118.1710.66
Light transmittance rate 43.41%36.67%21.52%
Highest temperature (°C)33.535.236.435.4
Average temperature (°C)32.533.334.432.8
Lowest temperature (°C)30.731.130.230.1
Highest relative humidity76%75%73%78%
Average relative humidity71%69%63%70%
Lowest relative humidity66%61%58%59%
Publisher’s Note: MDPI stays neutral with regard to jurisdictional claims in published maps and institutional affiliations.