Article

Formulation of Boron Encapsulated Smart Nanocapsules for Targeted Drug Delivery to the Brain

1
Pharmaceutical Sciences Department, College of Pharmacy, QU Health, Qatar University, Doha P.O. Box 2713, Qatar
2
School of Life Science, Pharmacy and Chemistry, Kingston University London, Kingston-Upon-Thames, London KT1 2EE, UK
*
Author to whom correspondence should be addressed.
Appl. Sci. 2021, 11(22), 10738; https://doi.org/10.3390/app112210738
Submission received: 13 October 2021 / Revised: 3 November 2021 / Accepted: 10 November 2021 / Published: 14 November 2021
(This article belongs to the Special Issue Polymeric Nanoparticles in Drug Delivery)

Abstract

:
Drug delivery through the Blood–Brain Barrier (BBB) represents a significant challenge. Despite the current strategies to circumvent the BBB, nanotechnology offers unprecedented opportunities for combining selective delivery, improved bioavailability, drug protection, and enhanced pharmacokinetics profiles. Chitosan nanocarriers allow for a more efficacious strategy at the cellular and sub-cellular levels. Boron Neutron Capture Therapy (BNCT) is a targeted chemo-radiotherapeutic technique that allows the selective depletion of cancer cells by means of selective tagging of cancer cells with 10B, followed by irradiation with low-energy neutrons. Consequently, the combination of a polymer-based nanodelivery system enclosing an effective BNCT pharmacophore can potentially lead to the selective delivery of the load to cancer cells beyond the BBB. In this work, synthesized novel boronated agents based on carborane-functionalized Delocalized Lipophilic Cations (DLCs) are assessed for safety and selective targeting of tumour cells. The compounds are then encapsulated in nanocarriers constituted by chitosan to promote permeability through the BBB. Additionally, chitosan was used in combination with polypyrrole to form a smart composite nanocapsule, which is expected to release its drug load with variations in pH. Results indicate the achievement of more selective boron delivery to cells via carboranyl DLCs. Finally, preliminary cell studies indicate no toxicity was detected in chitosan nanocapsules, further enhancing its viability as a potential delivery vehicle in the BNCT of brain tumours.

1. Introduction

The brain is the most complex and powerful organ in the human body. The organ is used to determine intelligence, as the interpreter of senses, as the initiator of body movements and the controller of behaviour. The brain is the source of all the qualities that define a person [1]. The human brain represents about 2% of the total body weight; however, it uses the same amount of energy as all the body’s skeletal muscles when at rest [2]. The average human brain weighs around 1500 g with an approximate volume of 1350 cm3, composed of almost 20 billion neurons [3]. Due to the importance of the brain, the body formed a system to protect this organ from damage that can be caused by potentially dangerous toxins. The blood–brain barrier (BBB) separates the blood from the extracellular fluid of the brain in the central nervous system (CNS) [4]. The BBB prohibits the entry of substances deemed to be harmful to the brain [5,6]. The BBB presents three types of junctions, as described by Stamatovic et al. [7]. These are adherent junctions, tight junctions (TJs), and gap junctions. These barriers allow for restricted access of drugs to the brain. The BBB allows only small molecules such as water and some gases to enter via passive diffusion [8]. Larger molecules require a specialised transport system in order to permeate the BBB.
Brain tumours, also known as tumours of the central nervous system (CNS), are the biggest killer of people under the age of 40 [9]; they represent a rare but serious health condition [10] with only 20% of sufferers surviving >5 years post-diagnosis [9]. It is estimated that the most common cases of cancer-related deaths occur due to the presence of malignant brain tumours in adolescents and young people between the age of 15 and 39, and it is the most common cancer present among 15–19-year-olds [11]. This year, nearly 17,000 people will lose their battle against primary malignant and CNS brain tumours [11].
Gliomas, a broad term used to describe tumour tissue growth within the gluey or supportive tissue of the brain, represent 27% of all brain tumours and 80% of all malignant tumours [11]. Nevertheless, the most common form of brain tumour is glioblastomas, as they represent 55.1% of all gliomas and 15.1% of all primary brain tumours [11]. Tumours of the CNS are characterized by the World Health Organization (WHO) based on the pathophysiological, epidemiological, and prognostic characteristics, and these are graded from I to IV. Those graded I are the least malignant tumours with higher long-term survival rates. Grade IV tumours are the most malignant and rapidly reproducing, forming new blood vessels to maintain rapid growth and thus having the poorest prognosis [12]. Research offers the only real hope of improvements in the management and treatment of brain tumours. Over £ 500 m is spent on cancer research in the UK every year, yet less than 2% is spent on brain tumours [9].
Currently, surgery plays a significant role in the treatment of gliomas and can prolong the life of the patient by up to 12–18 months [13]. Resection of glioblastoma multiforme (GBM) can be complicated by the lack of a defined tumour edge. Although magnetic resonance imaging (MRI) can allow better localization of the tumour, there is always uncertainty as to whether all malignant cells have been removed. Although the tumours of the brain have a slight tendency to metastasize to other organs of the body, they are highly infiltrative of the brain itself, and residual malignant cells can cause recurrence [14,15,16,17]. Recent experimental evidence [18] has identified cancer stem cells (CSCs) as a sub-population that exhibits distinct cellular and genomic characteristics that render these cells capable of escaping radiotherapy- or chemotherapy-induced cell death by staying arrested over time at the G1/G0 cell growth phase. In turn, this allows them to re-enter the cell cycle under appropriate microenvironment conditions. This implies that research efforts must focus on designing anticancer molecules with a therapeutic range that includes the selective targeting of CSCs [19]. Currently, the most common treatments available for brain tumours are surgery, via MRI, in combination with chemotherapy and radiotherapy.

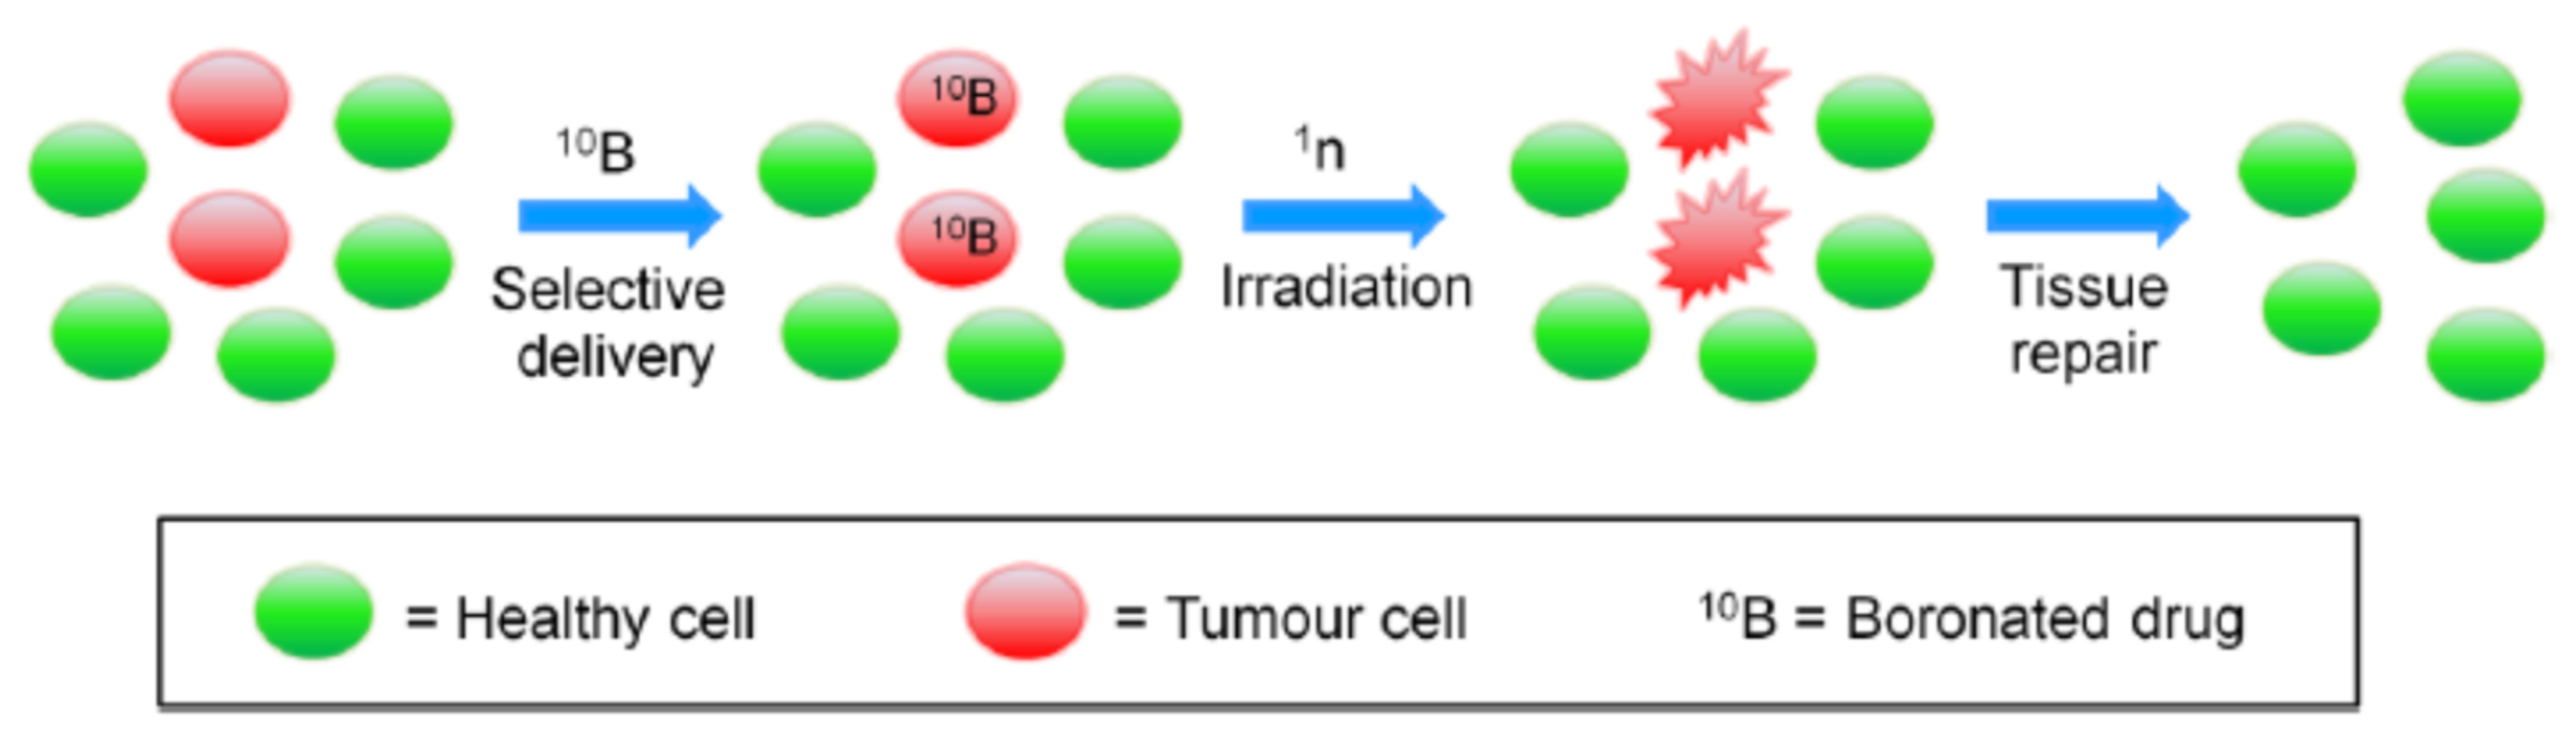
1.1. Boron Neutron Capture Therapy

Boron Neutron Capture Therapy (BNCT) is a targeted chemo-radiotherapeutic technique. It is a two-step approach (Figure 1) that involves the selective delivery of boronated agents to tumours and their subsequent irradiation with epithermal neutrons that have energy between 0.5 eV and 10 keV, which results in a nuclear fission reaction that selectively destroys cancer cells.
The first step is the selective uptake of a therapeutic dose of the drug by the cancer cells; this is critical for the success of the BNCT treatment. The second step involves irradiating the area of interest with a neutron beam to form 11B, which undergoes nuclear fission, releasing the radiating energy that leads to a high probability of local tumour cell death by direct DNA damage [20]. Accordingly, the nuclear reaction of 10B can be used for the selective destruction of malignant tumour cells without compromising nearby normal and healthy tissues [21]. The probability of capturing a neutron by a nuclide is defined as the “neutron-capture cross section” (σth); nuclides with large σth values are desirable for this purpose. 10Boron (σth = 3838 barns) offers a good compromise between toxicity and stability, and its chemistry is highly versatile and well established. Moreover, as the oxygen enhancement ratio (i.e., the measure of the proportion of radiation doses that are needed to affect the same rate of cell survival under hypoxic or oxic conditions) of neutrons (1.6) is lower than that of X-rays (2.5–3.0); the use of neutron beams is preferred in treatments involving hypoxic cells [22].
The predominant types of radiation released by the 10B reaction are recoiling 7Li nuclei and α particles. It only takes a few alpha (α) particles to kill a malignant cell. They are equally lethal to hypoxic and oxygenated cells as they are to nonproliferating cells [23]. Since the cytocidal effects of the capture reaction occur primarily in malignant cells that have accumulated a sufficient amount of 10B, surrounding normal cells and tissues having low levels of 10B are not subjected to the same amount of high Linear Energy Transfer (LET) radiation. Energetic alpha particles produced by the interaction of 10B with neutrons have high LET, low oxygen enhancement ratio, and high relative biological effectiveness. These LET particles are lethal but—because of their size, energy, and short path lengths (4.5 to 10 µm)—the effect is confined to the host cell [24].
In recent years, the possibility of developing more selective targeting therapies such as BNCT has been explored. Early molecular designs were guided by BBB being more permeable because of the leaky vasculature of a carcinoma cell due to the requirement of higher amounts of nutrients for faster and more rapid growth. Healthy cells, on the contrary, have a more rigid and stable structure, only requiring nutrients for controlled growth. However, drug delivery to the brain was unsuccessful as clusters of tumour cells were protected by the normal healthy cell within the BBB and, therefore, not completely eradicating the tumour, resulting in tumour re-occurrence. Due to the more negatively surface charged mitochondrion present within the tumour cell, positively surface charged, lipophilic molecules in the form of DLCs can potentially be used to selectively deliver boron moieties and take advantage of these characteristics present within the tumour tissues.

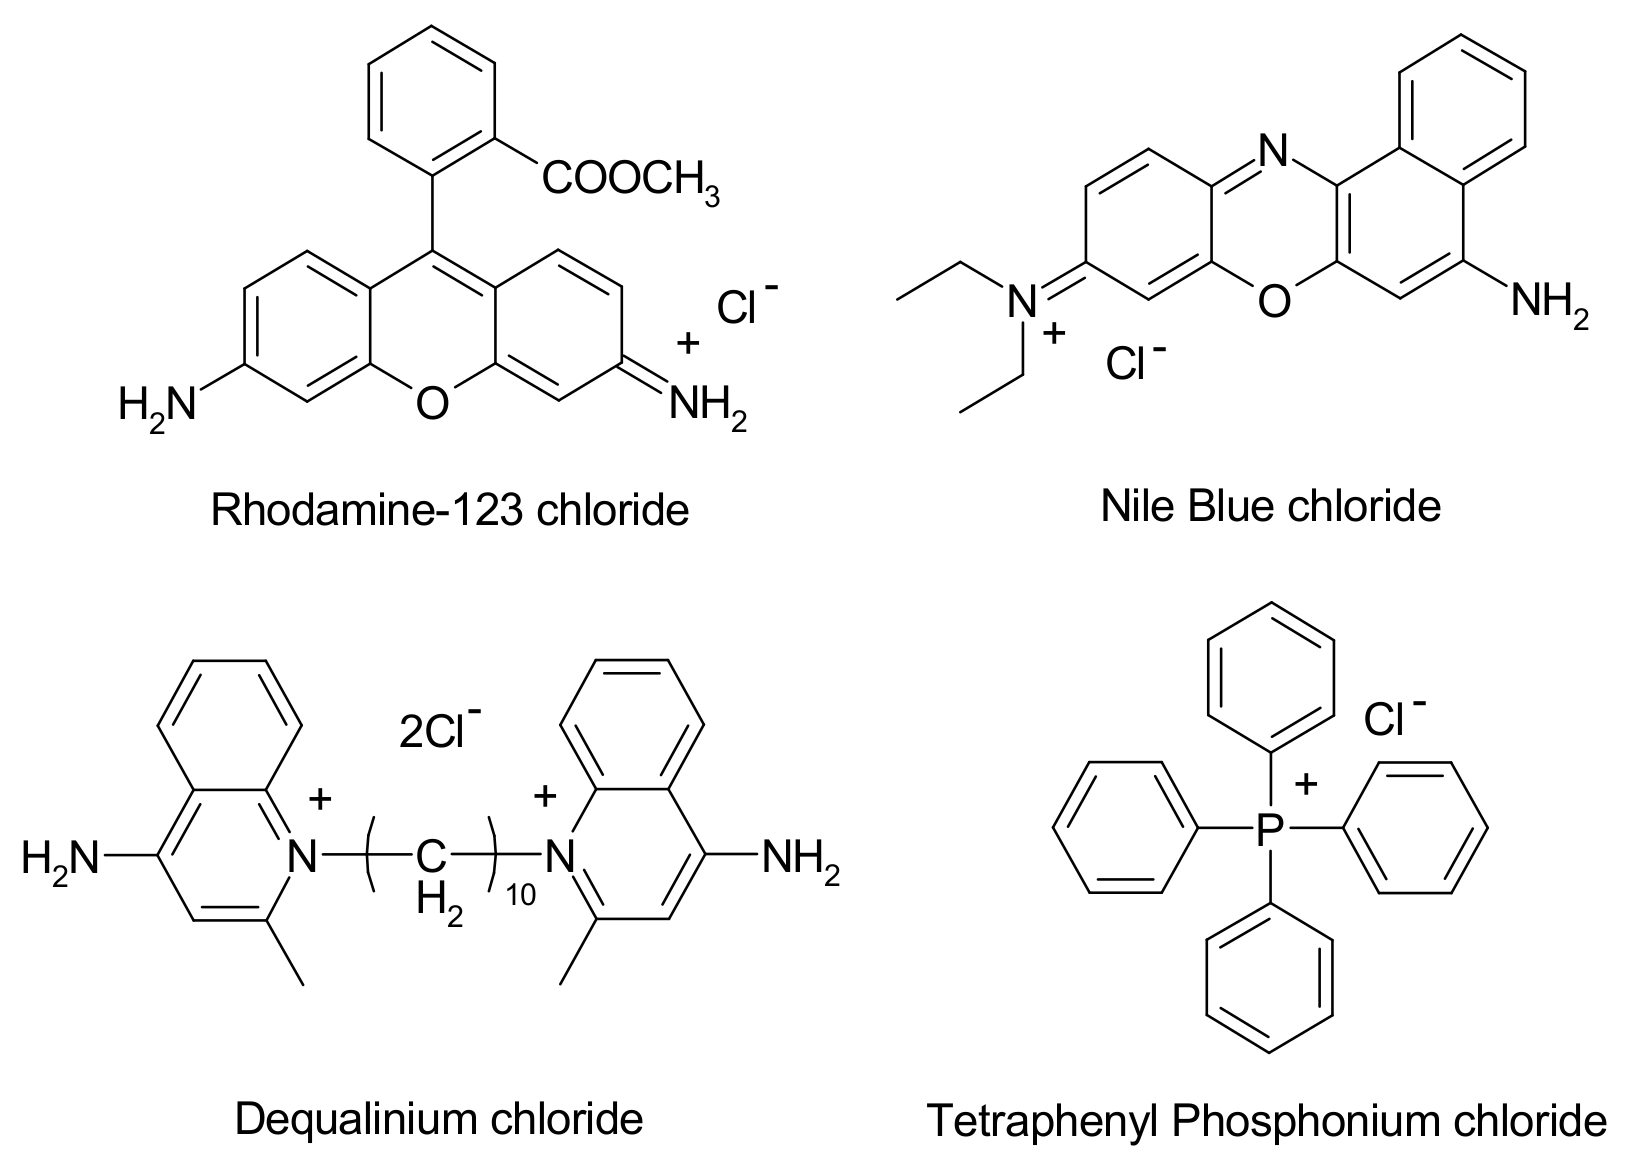
1.2. Mitochondrial Targeting

Neoplastic cells are characterized by high metabolic activity, which opens the possibility of targeting cellular organelles, such as mitochondria, and offers the distinct advantage that both nondividing and dividing cancer cells can become accessible to the therapeutic agent [25]. Following the demonstration of the mitochondrial accumulation of lipophilic cations, fluorescent DLCs (Figure 2), such as rhodamine-123, are employed to visualize mitochondria and to estimate mitochondrial activity [26,27].
DLCs have been shown to accumulate selectively in tumour cells. The positively surface charged lipophilic properties that DLCs possess allow them to be selectively drawn towards the tumour cells due to a more negatively surface charged mitochondrial transmembrane potential, that is, due to the higher metabolic activity of cancer cells when compared to healthy cells [8,13,14,15]. The resonance-stabilized delocalisation in their structure, combined with their inherent lipophilicity, leads to a decrease in cost associated with free energy change, which accompanies the diffusion of DLCs through the cell membranes. Henceforth, a larger accumulation (>100 fold) in the mitochondrial matrix of tumour cells is observed, [10,16] in addition to the high difference (>5 fold) in the cytoplasmic and extracellular concentrations [16,17]. These have, therefore, been used in the synthesis and development of selective target-specific anticancer agents that can be used in BNCT, [18] despite the structural modification of DLCs (e.g., by covalent bonding with boronated moieties) that might significantly affect their accumulation.
Due to the complexity of the BBB, much effort has been made to use the nanodelivery-based systems for drug delivery. The main strategies are: [28].
  • Delivery across the BBB through the manipulation of the drug via a prodrug or nanodelivery system.
  • Direct delivery to the brain: this can be performed through surgery or intra-cerebro-ventricular administration of a precalculated amount of drug to the brain. However, this is limited due to its invasive nature.
  • Delivery of drug intranasally: the most promising delivery route due to its practical, noninvasive, rapid, and simple nature.
  • Delivery of drug through the BBB via a two-component stimuli-responsive polymeric drug delivery system, which is enabled to release drug at a specified condition.
The intranasal route is possible due to the brain being at its most leaky nature in that region. A review by Illum et al. [29] showed that it was feasible to deliver, via this route, molecules such as small polar molecules, peptides, proteins, polysaccharides, vaccines, or DNA plasmid vaccines. More recently, a review published by Djupesland et al. [30] had a more in depth look at the possible advantages and disadvantages for nasal drug delivery and its potential for future treatments. The advantages of intranasal delivery to the brain are clear; this route is noninvasive, rapid, and will attain higher patient compliance. However, some parts of the brain are difficult to reach via this route, and some pharmacophores are susceptible to nasal enzymatic degradation. Nanotechnology can be very helpful in overcoming some of these limitations.

1.3. The Advantage of Using Nanotechnology

The advantages of using nanotechnology in drug delivery are several, including size and surface charge distribution characteristics that can be modified to improve drug bioavailability further and thus its pharmacokinetic profile. They can be used in active and passive drug targeting at the cellular or noncellular level. Nanodelivery systems can be used for sustained release of the drug, hence prolonging the effect of drugs leading to fewer side effects; this is achieved due to longer shelf stability and a higher carrier capacity, this intern will lead to an increase in drug effectiveness resulting in better patient compliance [31]. The altering of surface charge characteristics will allow for development and improvements in drug targeting, in addition to the availability of specific modification of nanovehicle dependent upon routes of administration, including enteral and parenteral routes [32]. Nanoparticles can be altered to respond to an externally applied field, which may be magnetic, focused heat, or light; this may make them ideal for the formulations and usage as a therapeutic delivery vehicle.

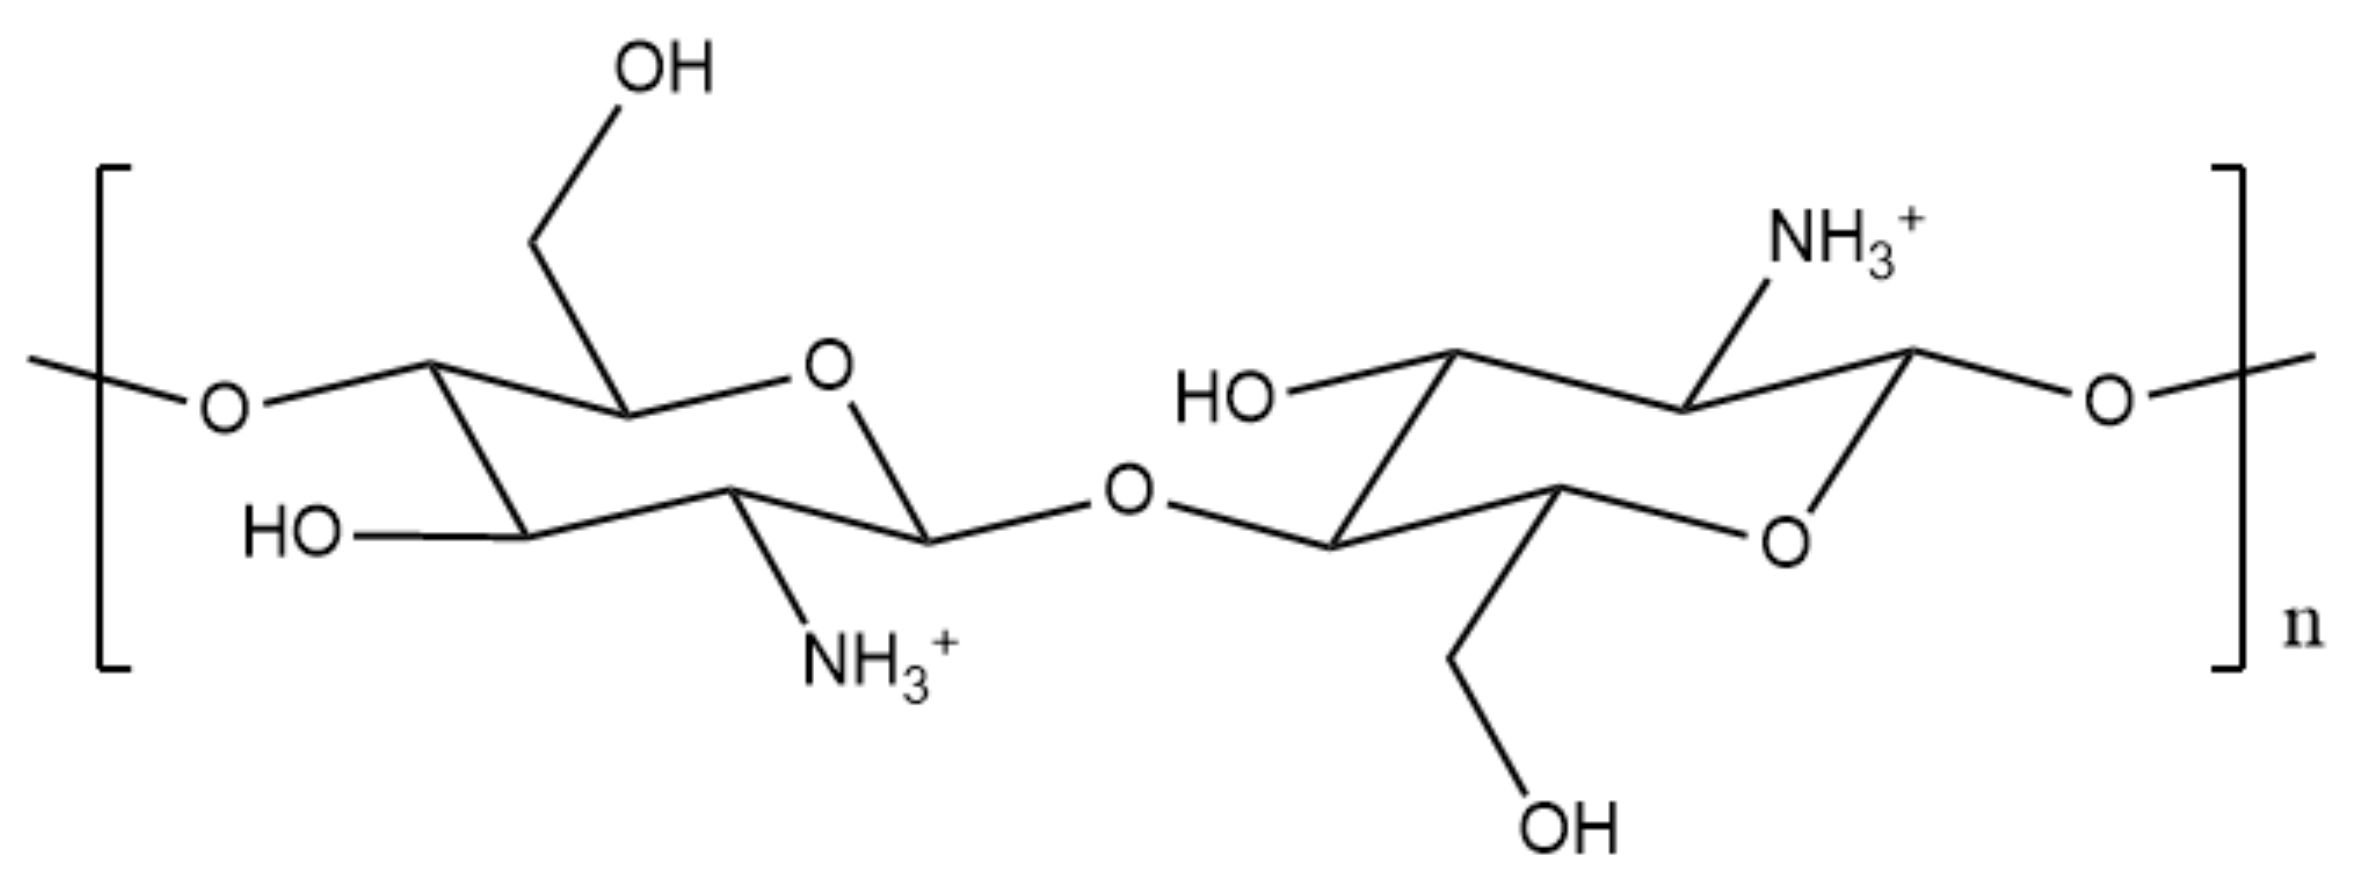
1.4. The Significance of Chitosan

Poly[α-(1-4)-2-amino-2-deoxy-D-glucopyranose], better known as chitosan, is an abundant polysaccharide and cationic polyelectrolyte [33]. Chitosan holds key components such as its biodegradability, hypoallergenicity, excellent biocompatibility, and low toxicity [34,35,36,37], as well as being known for its antibacterial characteristics [38]. Due to its favourable safety profile, it is chosen as an ideal drug delivery vehicle that can hold great potential in treating cancer. Chitosan (Figure 3) is obtained via basic deacetylation of chitin, which is poly(β-(1-4)-N-acetyl-D-glucosamine), a natural polysaccharide discovered in 1884.
Chitosan is used to prepare many different drug delivery systems, ranging from hydrogels, films, fibres or sponges, and nanotechnology. Most of the materials are used in the biomedical domain, for which biocompatibility is essential [39]. Chitosan is much easier to process than chitin, but the stability of chitosan materials is generally lower, owing to their more hydrophilic character. To control both their mechanical and chemical properties, various methods are adapted from those used on cellulose. Chitosan is often used in combination with other polymers to improve selective targeting; one polymer used in combination with chitosan is polypyrrole (PPY).

1.5. Significance of Polypyrrole as a Stimuli-Responsive Polymer

PPY has been shown to deliver the drug in response to electrochemical triggers, as described by Pillay et al. [40] and Boyd et al. [41]. PPY is appealing due to its high conductivity, low toxicity, and stability [42]. Polypyrrole has shown great promise, as it becomes conductive at lower pH values due to the protonation of the amine group triggering the release of the encapsulated drug, while chitosan acts as a carrier. This would potentially transform cancer treatments due to overall improvement in treatment efficacy [43].
Chitosan-based nanoparticles have shown potential to be used as part of a tumour targeting drug-delivery system for cancer therapies. These targeting strategies can be based on passive or active targeting. The body of available literature is vast, and examples reported here have been selected for illustrative purposes only.
The gold standard for modern cancer pharmacology is set by the need to develop an effective chemotherapeutic agent that leaves normal healthy cells unaffected while being highly selective and effective in targeting to eradicate malignant tissues. The heterogeneity within cancer cells contributes significantly to the therapy failure; achieving a high selectivity and specificity profile for tumour cell cytotoxicity remains one of the main aims of technological advancements in cancer therapy. Concomitantly, attaining a high enough amount of boron per cell is crucial for achieving the intended therapeutic outcome in BNCT. In such a context, this work reports on the synthesis of novel carboranyl-DLCs, in which the DLC (responsible for the selectivity) is covalently linked to the carboranyl moiety (which ensure accumulation of therapeutic amounts of boron). The synthesised compounds are tested in vitro to determine their toxicity and uptake into tumour cells.

2. Materials and Methods

For materials used in the synthesis of DLC-carboranyl compounds: Nile blue chloride (222550), phenosafranin chloride (199648), triphenyl phosphine (93092), 4-bromo-1-butyne (675725), anhydrous toluene (900522), anhydrous acetonitrile (900644), NMR grade dimethyl-sulfoxide (D2650) and NMR grade water (151882), Dichloromethane (DX0835) and hydrochloric acid (258148) were all purchased from Sigma Aldrich UK. Sodium hydroxide (28240.292) and decaborane (87892.06) were purchased from VWR. HEPES transport buffer (H0887) was purchased from Sigma Aldrich. CaCo2 cells (ATCC® HTB-37™) and U-87 MG cells (ATCC® HTB-14™) were purchased from ATCC.
For materials used in the formulation of the nanosystems: chitosan (LMW), pyrrole, aqueous acetic acid, sodium tri-polyphosphate, monobasic sodium phosphate, and dibasic sodium phosphate were all purchased from Sigma Aldrich, UK. Silver nitrate and iron (III) chloride (98%) were purchased from Alfa Aeser Ltd. (Haverhill, MA, USA). Phosphate buffered saline (PBS) tablets were purchased from Thermofisher (Waltham, MA, USA). Dialysis membrane tubing (3500 and 12–14,000 Daltons) was purchased from Medicell Membranes Ltd. (London, UK). Ammonium solution was purchased from VWR (Radnor, PA, USA).
For materials used in the preliminary in vitro testing: minimum essential medium eagle (MEME), fetal bovine serum, l-glutamine penicillin–streptomycin, nonessential amino acid (NEAA), trypsin, trypan blue, neutral red phosphate buffered saline solution, ethanol, LCMS grade water, sodium chloride (NaCl), potassium chloride (KCl), magnesium chloride (MgCl2), dibasic sodium phosphate (NaH2PO4), calcium chloride (CaCl2), HEPES transport buffer powder, and monobasic sodium carbonate (NaHCO3) were all purchased from Sigma Aldrich, UK. D-glucose was purchased from VWR. Cancer of the colon (CaCo2) and Uppsala 87 malignant glioma (U87-MG) cells were purchased from ATCC Ltd. (Manassas, VA, USA).

2.1. Synthetic Methods

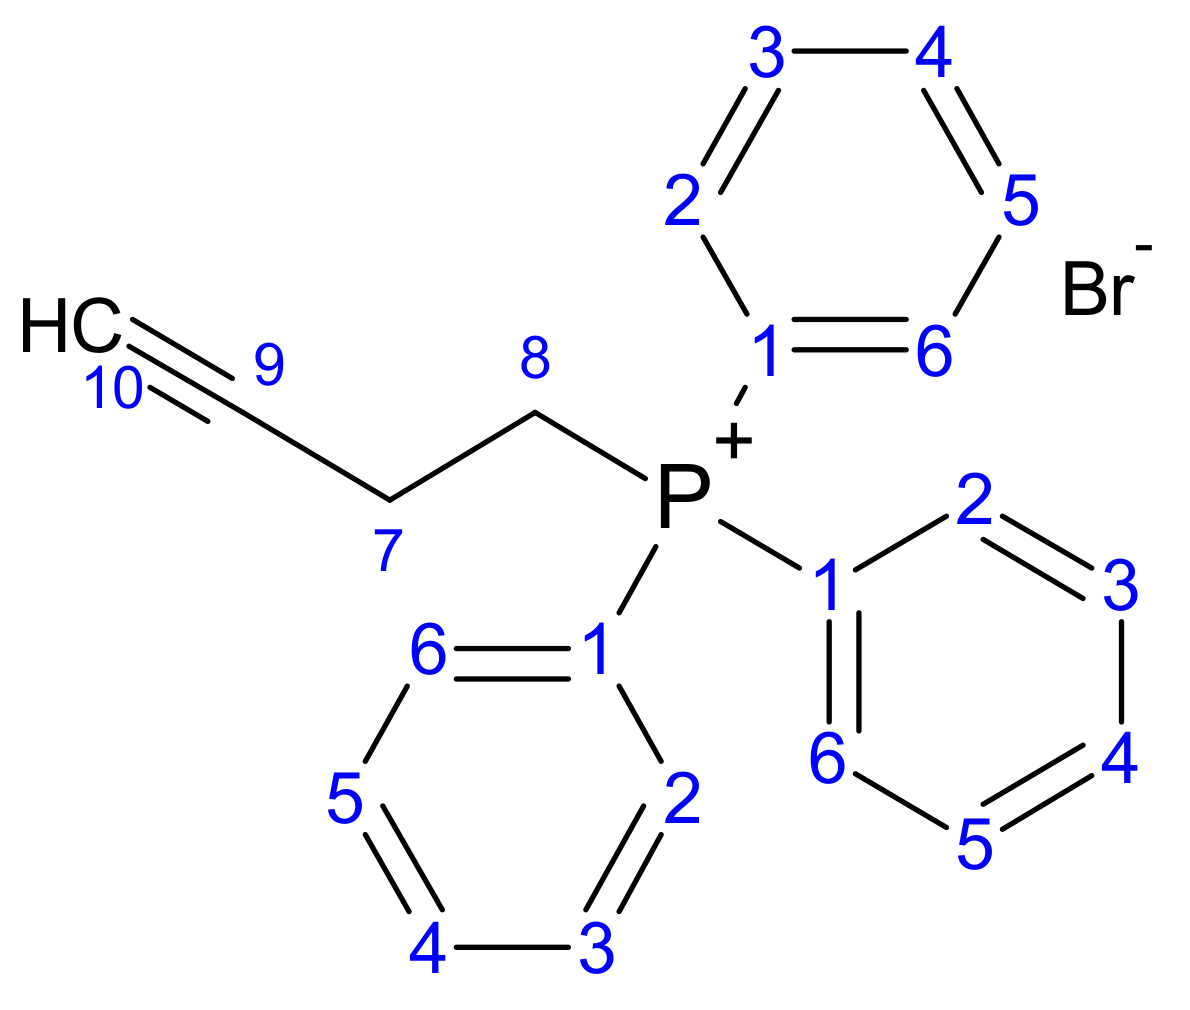
2.1.1. Synthesis of But-3-yn-1-yl (Triphenyl phosphonium) Bromide (1)

Triphenyl phosphine (1 g, 3.8 mmol) was mixed with 4-bromo-1-butyne (1 mL, 1.417 g/mL density) and anhydrous toluene (20 mL) in a round bottom flask. This was stirred to reflux under a nitrogen atmosphere for 20 h. The reflux was then stopped, and the suspension was left to cool down to room temperature. The solvent was removed by rotary evaporation, and the sample fully dried under a flux of N2. The resulting powder formed was a light-yellow coarse powder.

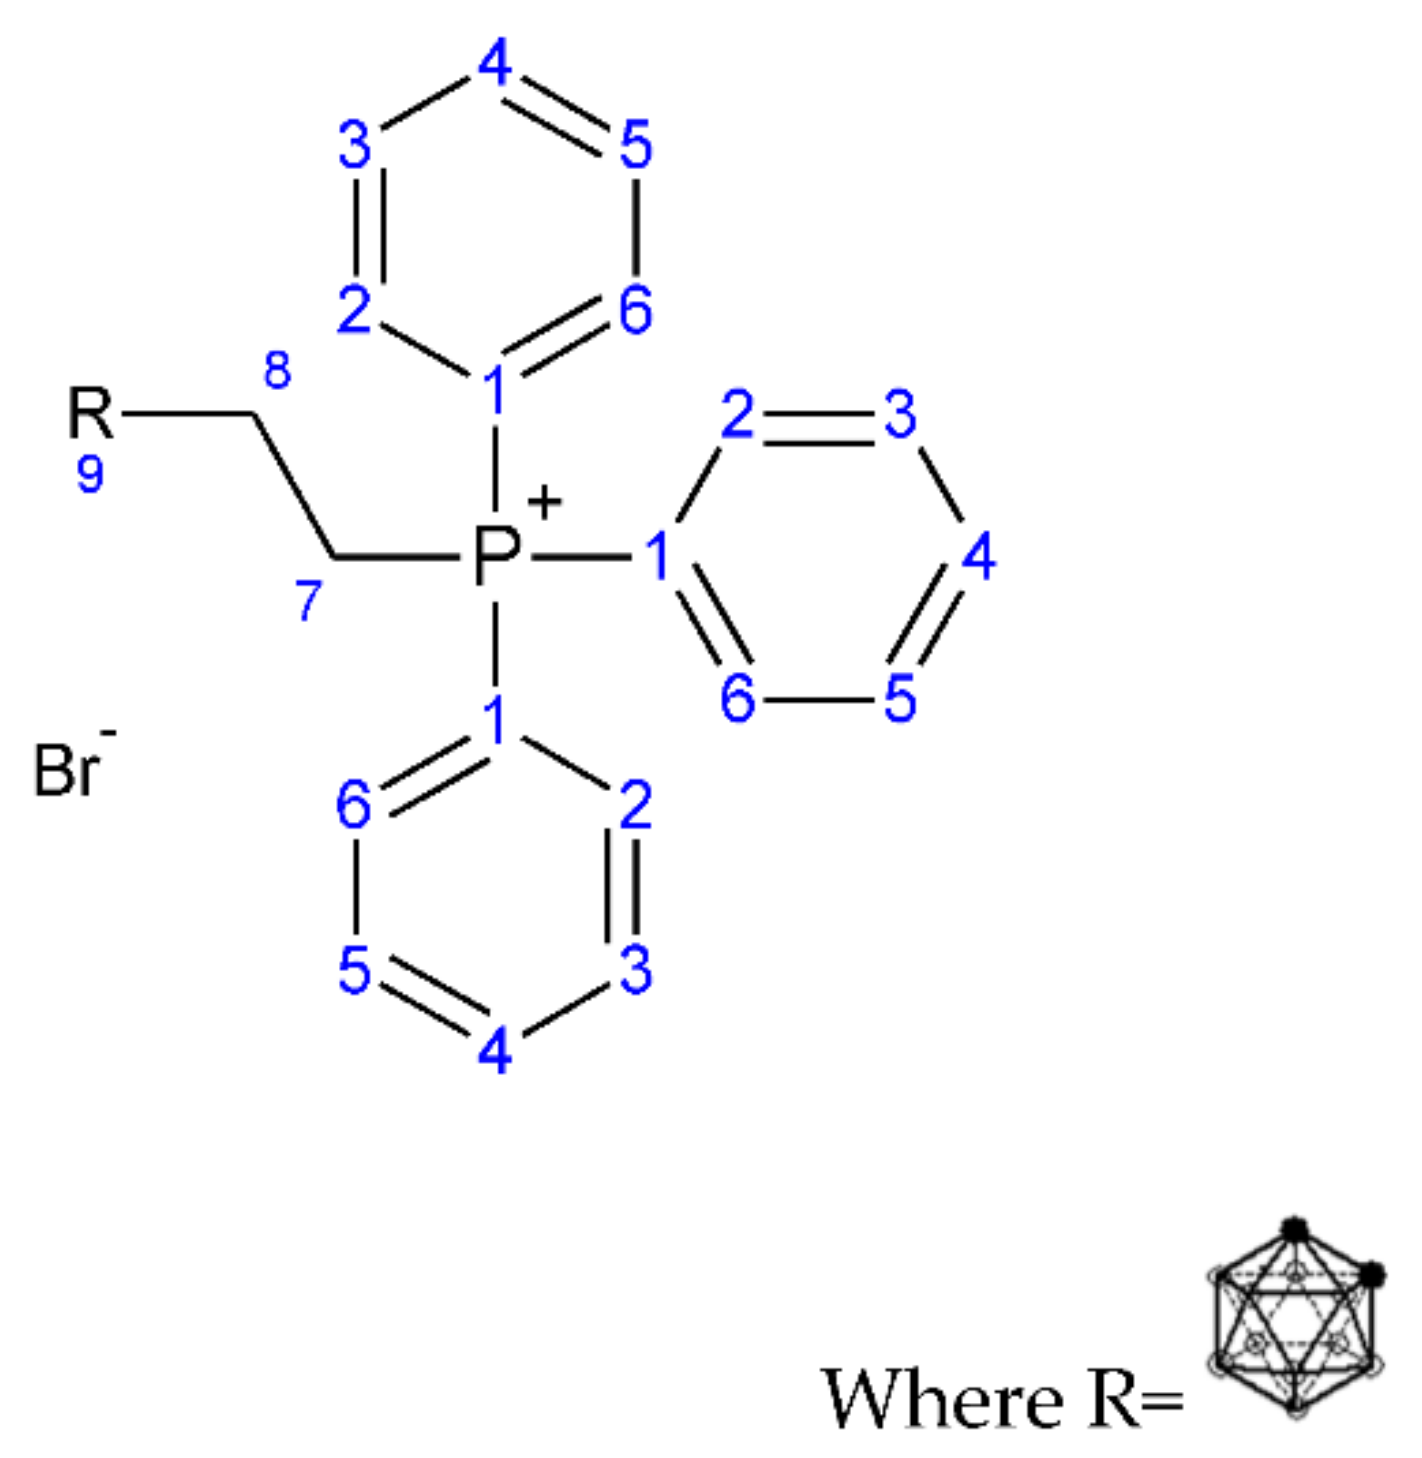
2.1.2. Synthesis of (3-Carboranyl-ethyl) (Triphenyl phosphonium) Bromide (2)

In a round bottom flask, decaborane, B10H14 (0.2823 g, 2.30 × 10⁻³ mol) was added to compound 1. The system was closed with a custom-made three-ways quick-fit, which was fitted with a balloon containing N2. Acetonitrile (1.22 mL) and anhydrous toluene (16 mL) were added. The reaction was left for 24 h, refluxing under a nitrogen atmosphere (100 °C). After 24 h, the reaction was left to cool down to room temperature. The solvent was removed by rotary evaporation, and the sample fully dried under a flux of N2. The reaction afforded 0.898 g of a fine yellow powder, equating to a 75% total yield. Purification of the compound was not required as NMR, and IR data indicated no impurities present within the material.

2.1.3. Synthesis of N9,N9-Diethyl-9H-benzo[a]phenoxazine-5,9-diamine

Briefly, Nile blue chloride (2.0 g, 5.6 mmol) was stirred in distilled water (100 mL) constantly at 65 °C for 30 min. A solution of sodium hydroxide (2% w/v, 0.5 M) was then added to the suspension. A red precipitate was formed, and the solution was left to cool down. Dichloromethane (100 mL × 3) was then used to extract the resulting red product. The organic phase was left under N2 conditions to evaporate the remaining dichloromethane. Due to its instability and light sensitivity, this compound was not analysed by spectroscopic means but was used directly for the following reaction.

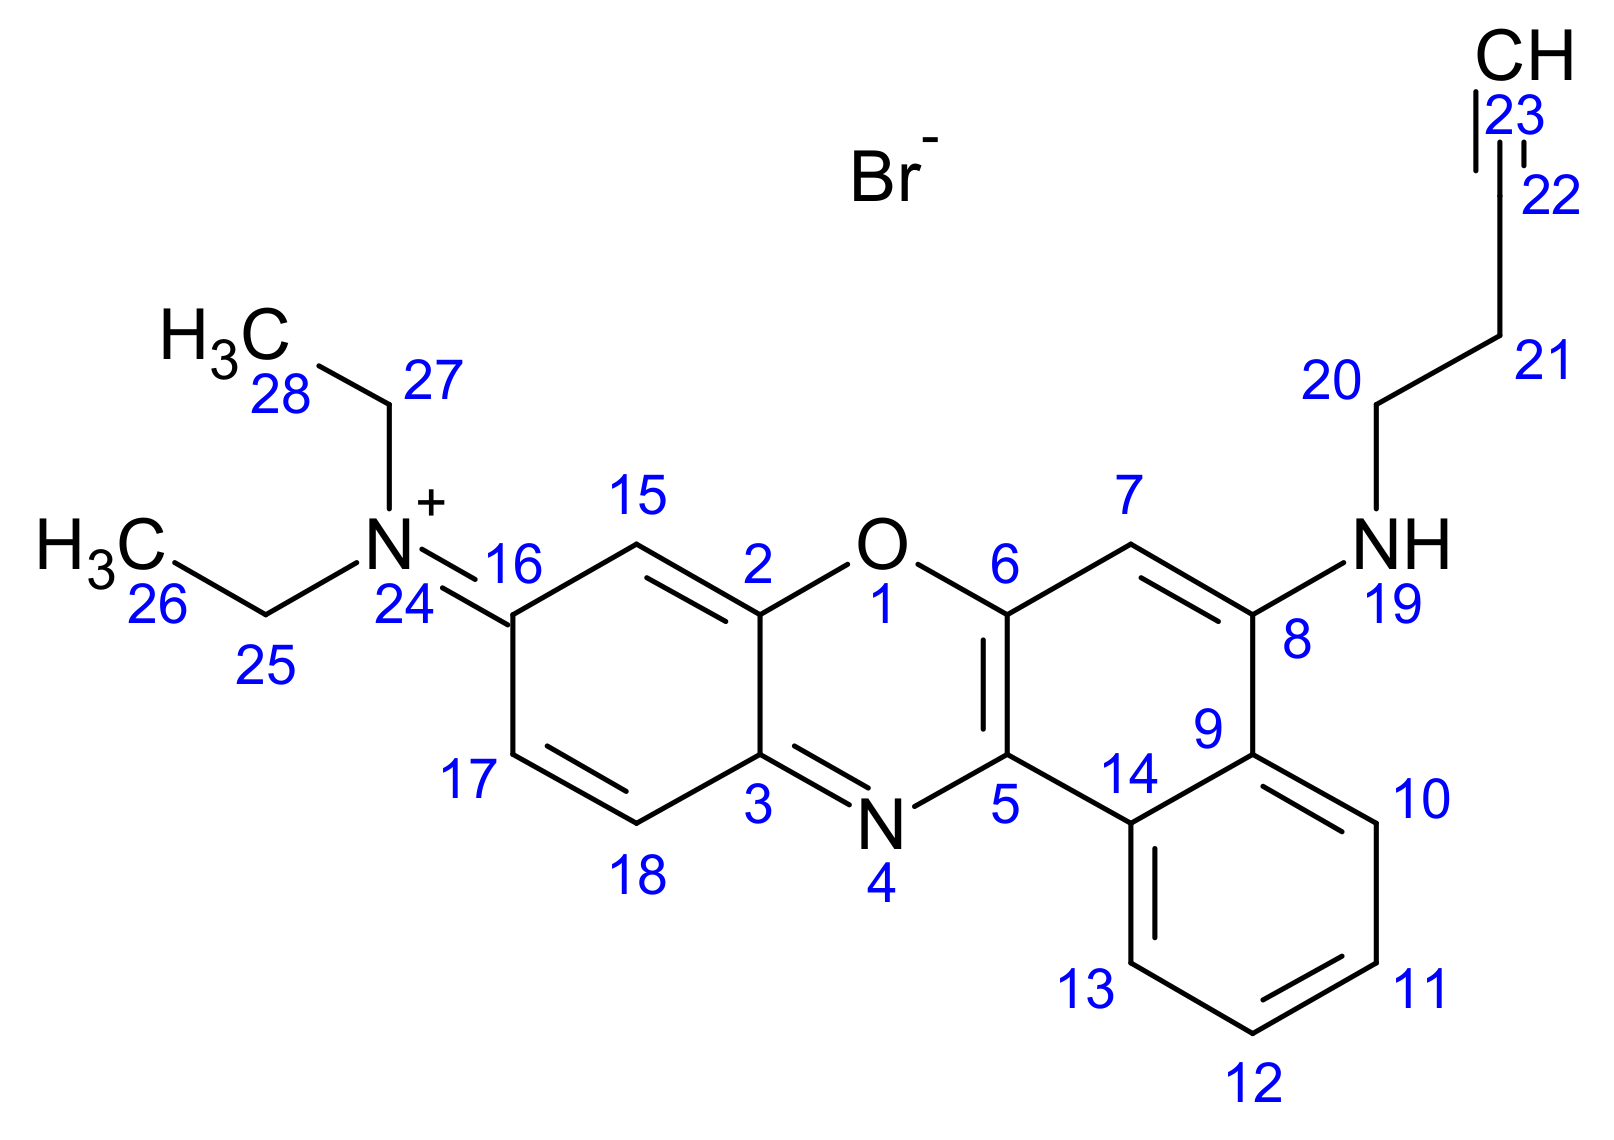
2.1.4. Synthesis of But-3-yn-1-yl (N9,N9-Diethyl-9H-benzo[a]phenoxazine-5,9-diamine) Bromide (3)

Synthesis of compound 3 was undertaken in a similar manner to that employed in the synthesis of compound 1, with the only difference being N9,N9-diethyl-9H-benzo[a]phenoxazine-5,9-diamine chloride (0.5 g) being used instead of triphenyl phosphine. The resulting powder was a fine dark red powder.

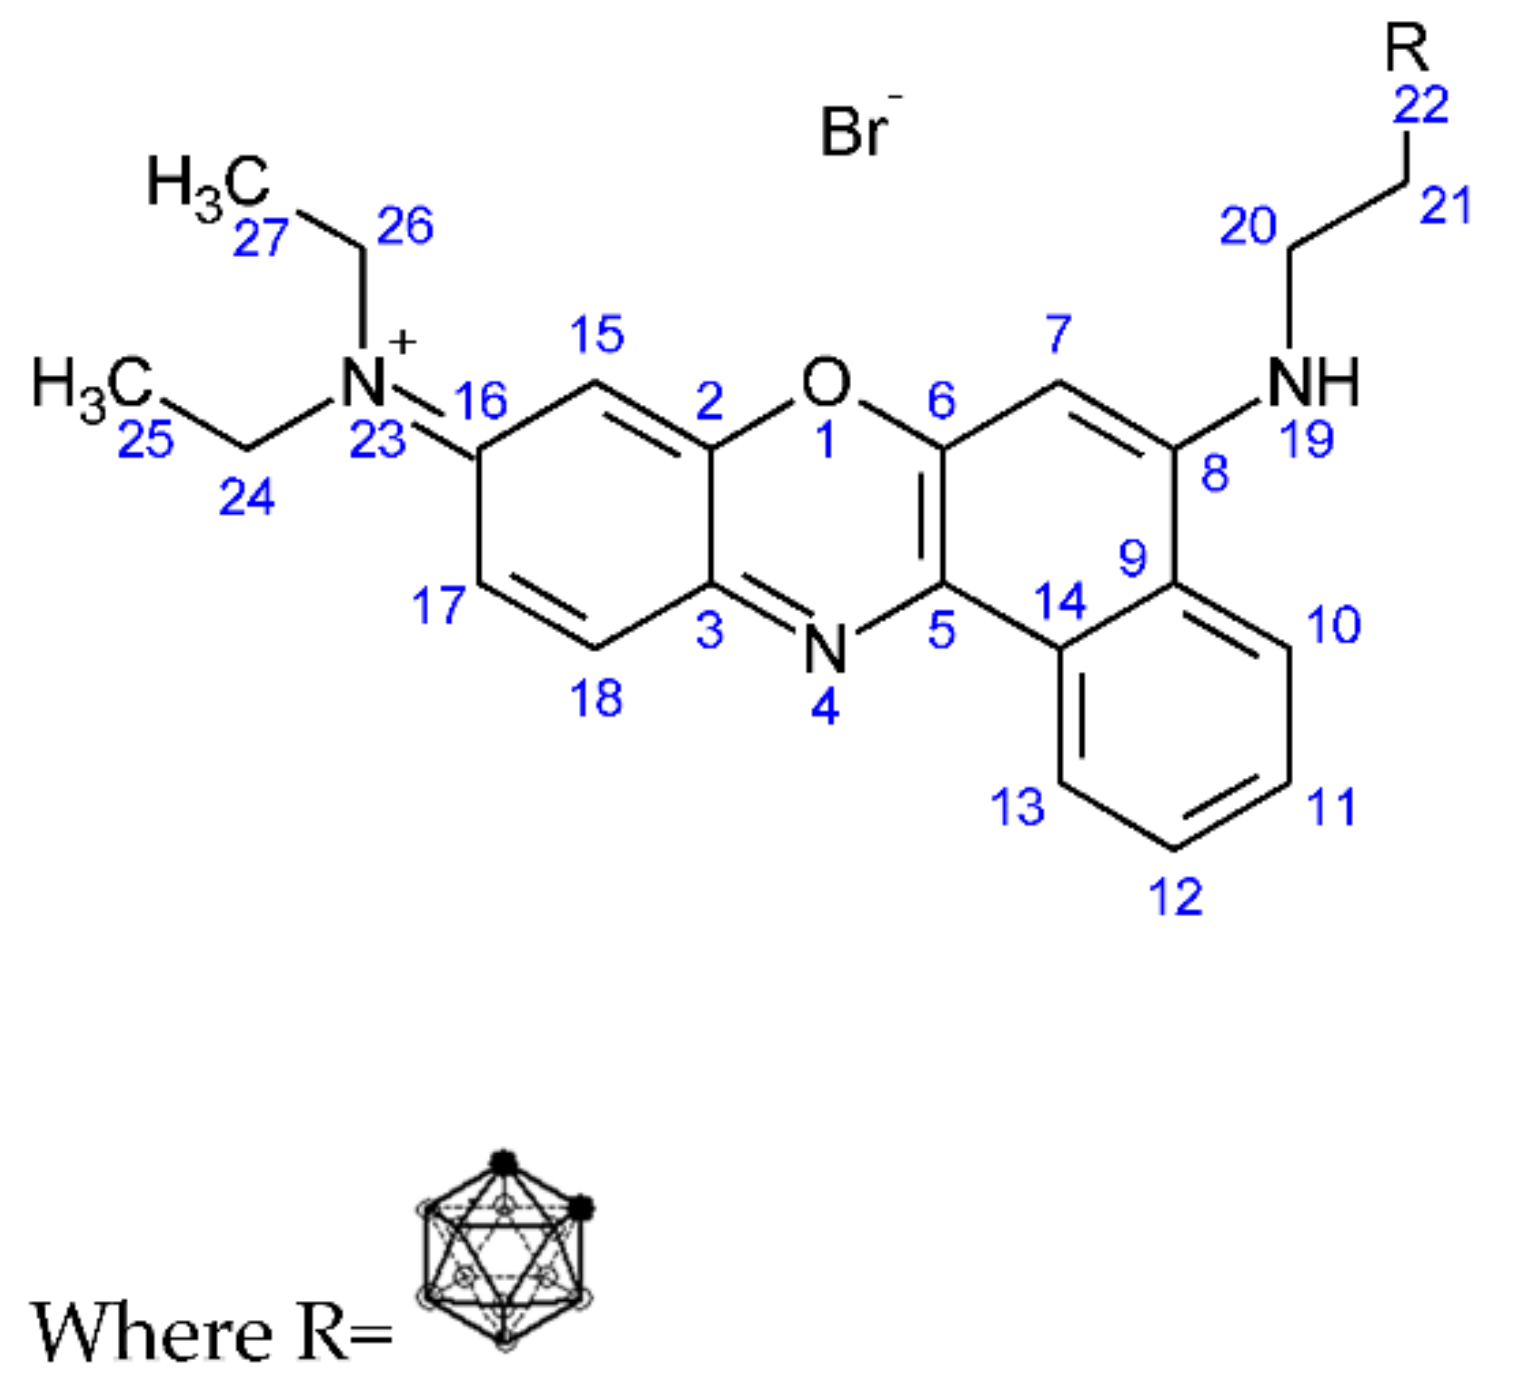
2.1.5. Synthesis of (3-Carboranylpropyl) (N9,N9-Diethyl-9H-benzo[a]phenoxazine-5,9-diamine) Bromide (4)

This reaction was undertaken in conditions similar to the method shown in the synthesis of compound 2, with the only difference being the use of the but-3-yn-1-yl (N9,N9-diethyl-9H-benzo[a]phenoxazine-5,9-diamine) bromide (3) instead of but-3-yn-1-yl (triphenyl phosphonium) (1). The reaction afforded 1.05 g of a dark blue fine powder, with a yield of 74%. Purification of the compound was not required as NMR, and IR data indicated no impurities present within the material.

2.1.6. Synthesis of the 3,7-Diamino-5-phenylphenazin-5-ium

Deprotonation of phenosafranin chloride was conducted in a similar manner to the method shown in the synthesis of N9,N9-diethyl-9H-benzo[a]phenoxazine-5,9-diamine, with the only difference being the use of phenosafranin chloride (2 g, 6.2 mmol) instead of Nile blue chloride. Due to its instability and light sensitivity, this compound was not analysed by spectroscopic means and was used for the following reaction.

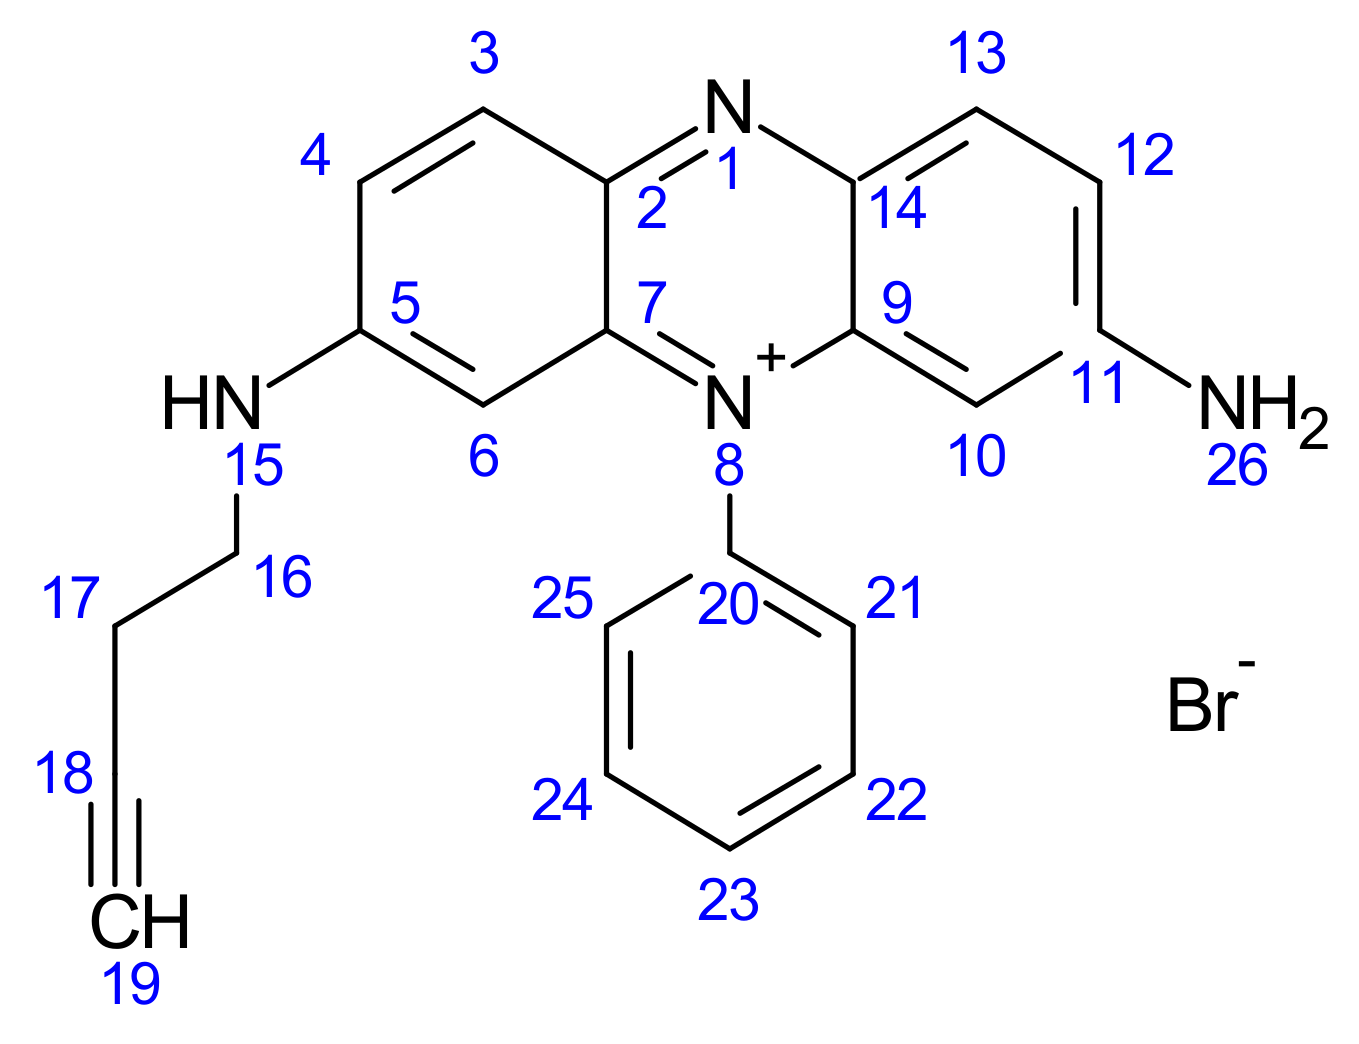
2.1.7. Synthesis of But-3-yn-1-yl 3,7-Diamino-5-phenylphenazin-5-ium Bromide (5)

Synthesis of compound 5 was undertaken in a similar manner to that reported in the synthesis of compound 4, with the only difference being 3,7-diamino-5-phenylphenazin-5-ium (0.5 g) instead of N9,N9-diethyl-9H-benzo[a]phenoxazine-5,9-diamine.

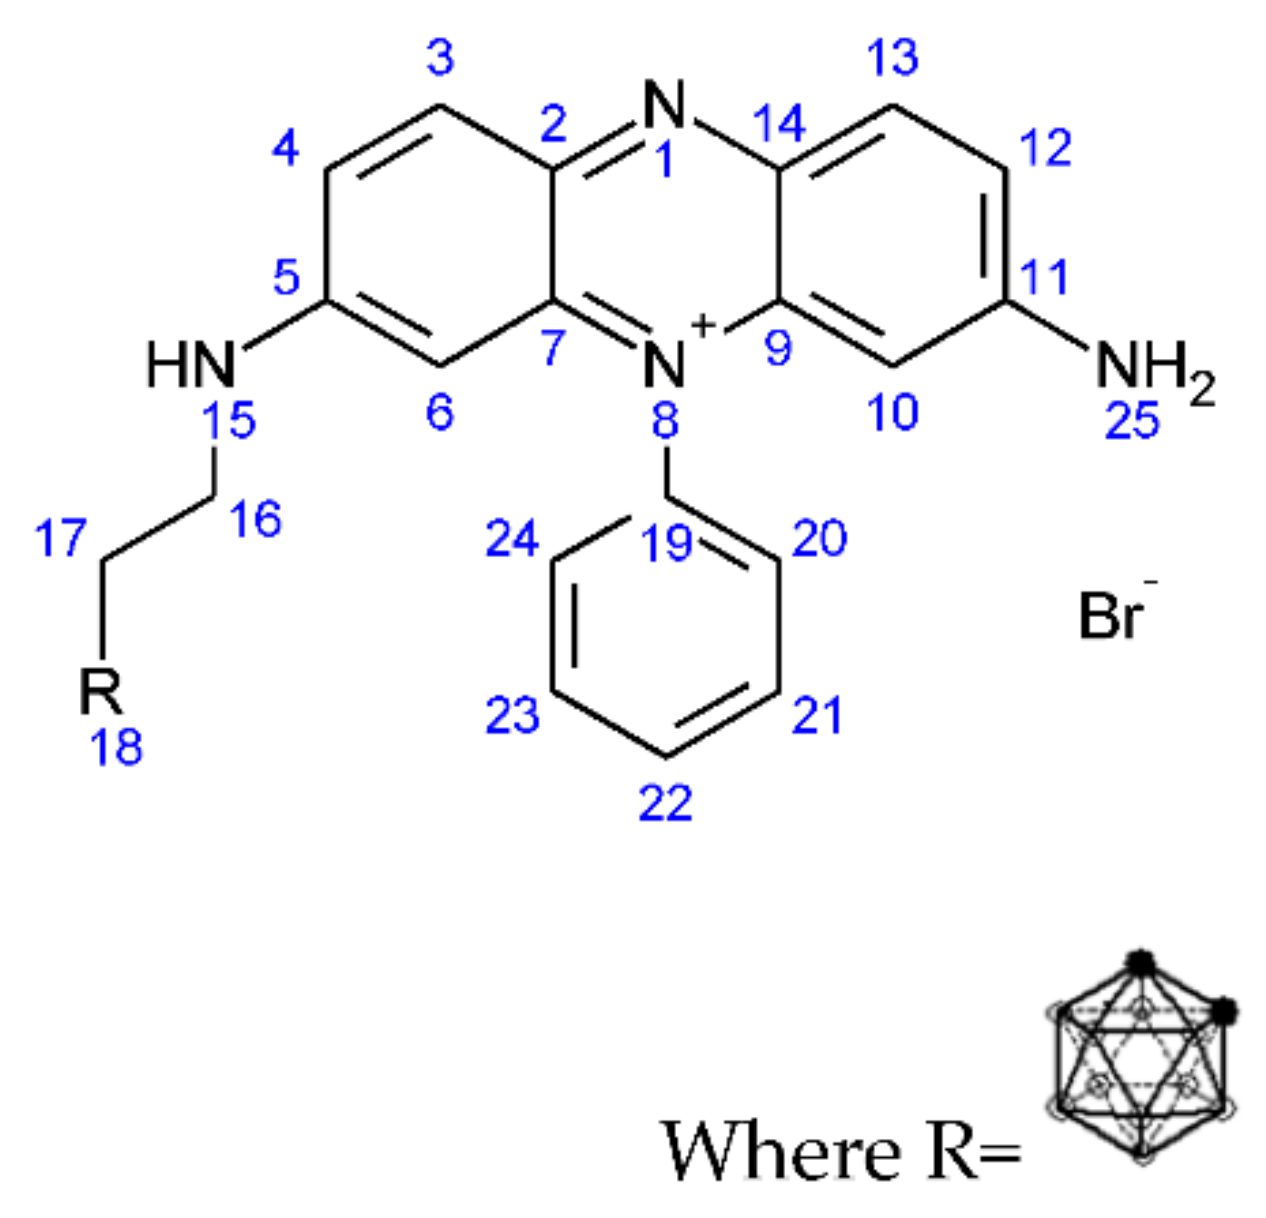
2.1.8. Synthesis of (3-Carboranylpropyl) (3,7-Diamino-5-phenylphenazin-5-ium) Bromide (6)

The method followed was similar to the one reported in the synthesis for compound 2, with the only difference that but-3-yn-1-yl 3,7-diamino-5-phenylphenazin-5-ium bromide (5) was used instead of (3-carboranylpropyl)-(triphenyl phosphonium) bromide (2). Purification of the compound was not required as NMR, and IR data indicated no impurities present within the material. All synthesised carboranyl-DLCs were characterised using NMR (A Brüker Avance III 400 MHz two-channel FT-NMR spectrometer was employed to record all spectra) and IR (Both background and each compound spectrum were collected and processed using the Thermo Scientific OMNIC software).

2.2. Formulation

2.2.1. Formulation of Nanoparticles via Ionotropic Gelation

Chitosan was added to aqueous acetic acid (0.1 M) to form a solution (1 mg of chitosan per 1.5 mL). Sodium triphosphate (NaTPP) at different concentrations (0.1, 0.2, 0.3, 0.4, 0.5 and 1 mg/mL) was then added to the modified chitosan solution (10 mL) while being continuously stirred. Finally, solutions were ultra-sonicated using a tip sonicator (Soniprob 150 plus (MSE, UK)) at 20 kHz for 2 min; this resulted in a cloudy solution.

2.2.2. Chitosan Nanoparticles Loaded with Carboranyl-DLCs

A chitosan solution (10 mL, 1.75 mg/mL) and each of the synthesised carboranyl-DLCs (0.6 mg/mL) were mixed and stirred for 1 h. NaTTP at different concentrations (0.1, 0.2, 0.3, 0.4, 0.5 and 1 mg/mL) was then added. The resulting dispersion was ultra-sonicated for 2 min at 20 kHz. Nanoparticles were centrifuged, using a Sigma 4–16 Centrifuge, for 1 h at 40,000× g and a temperature of 4 °C, followed by the removal of the supernatant from the obtained pellet. The supernatant was stored for further measurement of the UV-Vis absorption to determine the loading efficiency. Finally, the pellet was re-dispersed in acetic acid (0.1 M, 10 mL).

2.2.3. Synthesis of Drug Loaded AgCl@PPy-CS Nanoparticles

AgCl@PPy-CS nanoparticles were prepared according to an adaptation of the method reported in the literature by Cheng et al. [43]. Briefly, a beaker (50 mL) containing a solution of chitosan (20 mL, 1%) in acetic acid (1 M) was placed in an ice bath and maintained at a temperature of 2 °C. Then, pyrrole (0.025 mL) and silver nitrate (0.01 g) were added simultaneously. After 5 min, iron (III) chloride (0.14 g/5 mL distilled water) was added dropwise, and the mixture was left under stirring conditions for 3 h. After this, the mixture was moved to the fridge (4 °C) to allow polymerisation. After 64 h, the mixture was transferred into a dialysis membrane tubing (3500 Daltons cut off). The membrane bag was immersed in a solution of acetic acid (1 M). This was left stirring for 64 h. Polypyrrole/chitosan nanoparticles containing an AgCl core were then transferred to a beaker containing excess acetone and centrifuged at maximal rotations (20,000 rpm) for 10 min. The resulting pellets were subjected to rotary evaporation at 56 °C to remove any residual solvent. Polypyrrole/chitosan nanoparticles containing an AgCl core were obtained once dried.

2.2.4. The Etching of the AgCl Core and Loading of Drugs in the Nano-Capsules

Polypyrrole/chitosan nanoparticles containing an AgCl core (0.1 g) were transferred into dialysis membrane bags (3500 Daltons cut off). The membrane bag was immersed in a NH4OH solution (1 M). Dialysis was conducted for 92 h with stirring to allow the etching of the AgCl core. Ammonium hydroxide was used to adjust the pH to 11.3 in a dropwise manner. Once purified, the pH of this mixture was adjusted dropwise to pH 12. Different carboranyl-DLCs (0.6 mg/mL) were introduced; they underwent ultra-sonication for 2 min in distilled water (200 mL). Polypyrrole/chitosan nanocapsules were then introduced into a beaker containing excess acetone and centrifuged at maximal rotations (20,000 rpm) for 10 min. The resulting pellets were dried via rotary evaporation at 56 °C.

2.2.5. Characterisation of Formulated Nanoparticles

The characterization of nanoparticles was carried out by evaluating the particle size and zeta potential using a Malvern Zetasizer Nano S. In addition, the appearance and morphology of the nanoparticles were assessed by Scanning Electron Microscopy (Zeiss EVO50, Jena, Germany).

2.2.6. Boron Release Studies

A dialysis bag with a pore size of 3500 Daltons, previously filled with the solution of drug-loaded nanoparticles (5 mL), was soaked in a phosphate buffer solution (PBS, 50 mL) at three different pH values: 7.4, 6.5 and 5.5; under continuous stirring. Aliquots from the buffer solutions were taken at different time intervals in order to determine the amount of drug released by spectrofluorometry at the λmax. The λmax of the individual loaded drug was assessed via spectrofluorometer (Varian CARY eclipse fluorescence spectrophotometer). The volume removed from the release media was returned by adding an equivalent volume of PBS to maintain sink conditions. The following λmax values have been used for the synthesised compounds: (3-carboranylpropyl) (triphenyl phosphonium) bromide (2) = 290 nm, (3-carboranylpropyl) (N9,N9-diethyl-9H-benzo[a]phenoxazine-5,9-diamine) bromide (4) = 490 nm, (3-carboranylpropyl) (3,7-diamino-5-phenylphenazin-5-ium) bromide (6) = 540 nm. Control samples consisted of dialysis membrane tubes with non-drug-loaded nanovehicles.

2.3. Preliminary Cell Studies

2.3.1. In Vitro Cell Studies

Caco-2 cells were maintained in Dulbecco’s Modified Eagle Medium (DMEM) with 10% fetal bovine serum 1% non-essential amino acids (NEAA). The cells were kept at 37 °C in a humidified atmosphere containing 5% CO2. For propagation in culture flasks, Caco-2 and U-87 MG cells were seeded at a concentration of 105 cells/cm2. The medium was changed every 3–4 days, depending on confluence. At 80% confluence (typically after 4–5 days), the cells were split 1:10 before further cultivation. Trypsinization of Caco-2 and U-87 MG cells was carried out by first rinsing with PBS (15 mL T75 cm2 flask). Trypsin/EDTA solution (5 mL) was then added, and the cells rinsed. The flask was incubated at 37 °C for 6–10 min. As soon as the cells were detached, trypsinization was stopped by adding a complete medium. The cells were transferred to a test tube and centrifuged gently to let cell aggregates and debris sediment. The supernatant was then transferred to a new test tube, and an aliquot was taken to count cells.

2.3.2. Boron Uptake Assay

For uptake experiments, cell concentration at 2 × 10⁴ cell/cm2 in 24-well cell culture dishes was used. Boron solutions were prepared using the HEPES buffer medium made for cells. Cells were rinsed gently twice with the transport buffer and then preincubated for 15 to 30 minutes at 37 °C. After preincubation, drug solutions in buffer at different concentrations were added (250, 125, 62.5, 31.25 and 15.625 μM) to the dishes and were incubated at 37 °C. At each time point (1, 6 and 24 h), a test sample was removed, and the cell surface washed three times with PBS (1 mL) to remove residual medium and nonspecifically bound metal. Cells were then desorbed or lysed using 5% prewarmed HNO3 (0.5 mL) per well and were left for 1.5 h. This was then followed by aliquoting 500 μL into a 2 mL Eppendorf tube and filled to a total volume of 2 mL with Milli-Q water. Finally, a 0.5 ppm boron solution (2 mL) was added as the internal standard for ICP-MS analysis using ICP-MS (700 Series; Agilent Technologies, Santa Clara, CA, USA) operating at 1550 W, with a carrier gas flow rate of 0.91 L min−1, makeup gas flow of 0.24 L min−1 and a nebuliser pump rate of 0.1 rps. Beryllium and 10B standard solutions (1000 ppm) were used in the calibration. The total amount of the respective metal per well was calculated and averaged over the three replicates. Controls for this study consisted of testing buffer alone and through testing non-drug-loaded nanovehicles dosed onto cells.

2.3.3. Neutral Red Assay

To prepare for the neutral red assay, cells are passaged. Once cells were split, they were placed into a T75/T25 flask. Some cells were then left in the medium; cell concentration at 2 × 10⁴ cell/cm2 was counted. The number of cells in the medium was calculated into 20 mL of medium present in a reservoir. Then carefully into a 96-reservoir plate, 200 μL of cells were placed into wells and were left in the incubator till analysis (ca. 2 days). Once cells were ready, sample concentrations were placed on the cells. After each time point, samples were removed from the autoclave and rinsed with prewarmed PBS. The neutral red solution was added to the wells and then incubated for 3 h. The neutral red solution was removed and cleaned with prewarmed PBS. 50% Ethanol/1% acetic acid solution (100 μL) was added and put onto a shaker for 30 min. Results were then measured on an absorbance reader (Infinite m200 pro plate reader). The concentration of the actinomycin-D was 20 μM (negative control), the positive control was the use of the DMEM on its own.

2.3.4. Passaging of Cells

Samples were taken out from the incubation oven and checked under the microscope for cell growth; when confluence reached 80%, passaging of the cells was required. A pipette was used to withdraw all the media from the T75 flask, and the solution was withdrawn into a waste beaker. PBS (10 mL) was used to rinse out cells after taking out media; this was then followed by a gently swirling flask to clean out the cells. Trypsin (3 to 5 mL) was added to the T75 flask and then incubated for 5 to 10 min to remove the live cells from the base of the flask. After incubation, the trypsin solution was removed from the flask and placed into a centrifuge tube (evening out the tubes using media when necessary). The solution was mixed in a centrifuge tube prior to centrifugation. The mixture was then centrifuged for 5 min at 20 °C and 1500 rpm. While centrifugation was taking place in a new T75 flask, 19 mL of fresh media was placed into a fresh flask. After centrifugation, the medium was removed slowly, ensuring that the cells were not touched (i.e., pellet at the base); this was put into a waste beaker. The centrifuge tube was then gently tapped to remove the pellet from the base. This was followed by adding fresh 5 mL of the medium into a centrifuge tube with the pellet. The medium was mixed with cells using a pipette gently to avoid cell damage. The mixture (1 mL) was placed into the T75 flask. The T75 flask was then positioned into the incubation oven. Before doing any tests, the average number of cells was needed to be known per 1 mL.

2.3.5. Permeation and Uptake Studies

Permeation Studies

CaCo2 cells were passaged and then placed into 24 well-sized transwell migration assay plates at a concentration of 2.5 × 10⁴ cells per transwell plate. Cells were then put into the incubator. After three days, the cells were checked under a microscope for 80% confluence; once this was achieved, cells were treated with the prepared formulations.

Uptake Studies

U87-MG cells were first passaged and then placed in 24 well plates at a concentration of 2.5 × 10⁴ cells per well. Cells were then put into the incubator to allow growth. After three days, cells were checked under a microscope for 80% confluence. Once this was achieved, cells were treated with formulations to examine uptake levels of boron into U87-MG cells. Both permeation and uptake studies were conducted under one assay simultaneously. HEPES buffer, DMEM, and lysed cells using 0.1 M nitric acid were all tested individually to ensure no boron readings were detected using these materials in order to ensure accuracy and precision of the permeation and uptake study.

2.3.6. HEPES Transport Buffer

HEPES transport buffer was formed using a mixture of NaCl (127 mmol), KCl (5 mmol), MgCl2 (2 mmol), Na2HPO4 (0.5 mmol), CaCl2 (1.8 mmol), NaH2PO4 (0.5 mmol), HEPES (4-(2-hydroxyethyl)-1-piperazineethanesulfonic acid, 10 mmol) and D-glucose (10 mmol) which were all mixed into 100 mL LCMS grade ultrapure water. The pH of the mixture was then adjusted to 7.4 with NaOH.

3. Results

3.1. Synthetic Methods

3.1.1. Synthesis of But-3-yn-1-yl (Triphenyl phosphonium) Bromide (1)

Most DLCs employed in the synthesis of carboranyl DLCs present an amine functional group. Compound 1 (Figure 4), however, is a phosphine, which allows for the direct attachment of linkers such as 1-bromo-3-butyne via a SN2 reaction. The alkyne function is consequently used to form the carboranyl moiety in situ.
The progress of the reaction to form compound 1 was examined on TLC (silica plates) using hexane as the mobile phase. The Rf value obtained was 0.35. Compound 1 was then analysed using a variety of spectroscopic methods, and all data are presented below.
1H NMR: But-3-yn-1-yl (triphenyl phosphonium) bromide (1); (AV400 with CDCl3): 7–8 ppm (Aromatic C-H, multiplet, 1–6), 4.1 ppm (CH2-CH2, triplet, 8, J8-7 = 8.0 Hz), 2.9 ppm (CH2-CH2, triplet, 7, J7-8 = 8.0 Hz), 2.3 ppm (Alkyne C-H, singlet, 9).
13C NMR: But-3-yn-1-yl (triphenyl phosphonium) bromide (1); (AV400 with CDCl3): 12 ppm (aliphatic C-C, 8), 21.48 ppm (aliphatic C-C, 7), 72.4 ppm (alkyne C-CH, 9), 129.7 ppm (aromatic C-C, 3, 4, 5), 132.17 ppm (aromatic C-C, 2, 6), 135 ppm (aromatic C-C, 1).
FT-IR: But-3-yn-1-yl (triphenyl phosphonium) bromide (1): 3300 cm−1 (C-H stretch, alkyne, weak, 9), 3000–3100 cm−1 (C-H stretch, Aromatic C-H, medium, 1–6), (methylene (-CH2), medium, 7–8), 2850–3000 cm−1 (CH stretch), 1500–1600 cm−1 (C=C stretch, aromatic ring C=C, weak, 1–6), 1430–1470 cm−1 (C-H bend, methylene (-CH2), medium, 7–8).

3.1.2. Synthesis of (3-Carboranylpropyl) (Triphenyl phosphonium) Bromide (2)

The progress of the reaction for the formation of Compound 2 (Figure 5) was examined via TLC (Silica plates) using hexane as the mobile phase. The Rf value obtained was 0.42. The yield obtained where 85%, with the product having a fine texture and being yellow in colour. The purified product was analysed using a variety of spectroscopic methods, and all data are presented below.
1H NMR: (3-carboranylpropyl) (triphenyl phosphonium) bromide (2); (AV400 with DMSO): 7–8.1 ppm (Aromatic C-H, multiplet, 1–6), 3.5 ppm (CH2-CH2, triplet, 7 J7-8 = 7.8 Hz), 2.5 ppm (CH2-CH2, triplet, 8, J8-7 = 7.8 Hz), 0.5–1.5 ppm (B-H, carborane cage hydrogen atom, multiplet, 9).
13C NMR: (3-carboranylpropyl) (triphenyl phosphonium) bromide (2); (AV400 with CDCl3): 13–25 ppm (aliphatic C-C, 7, 8), 40 ppm (carborane B-CH, 9), 125.7 ppm (aromatic C-C, 3, 4, 5), 128.5 ppm (aromatic C-C, 2, 6), 135.3 ppm (aromatic C-C, 1).
FT-IR: (3-carboranylpropyl) (triphenyl phosphonium) bromide (2): 3000–3100 cm−1 (C-H stretch, aromatic (-CH), weak, 1–6), 2300–2600 cm−1 (B-H stretch, medium, 9), 1500–1600 cm−1 (C=C stretch, aromatic C=C, weak, 1–6), 1430–1470 cm−1 (C-H bend, methylene (-CH2), medium, 7–8), 1050–1150 cm−1 (B-H deformation, medium, 9), 800–860 cm−1 (B-H vibration, medium, 9).

3.1.3. Synthesis of But-3-yn-1-yl N9,N9-Diethyl-9H-benzo[a]phenoxazine-5,9-diamine Bromide (3)

The formation of the intermediate to form Compound 3 (Figure 6) allows for the functionalisation of the amine group with 1-bromo-3-butyne. Once this is formed, the DLC to the carborane dye can be formed in situ.
The formation of compound 3 was analysed through TLC (silica plates) using hexane as the mobile phase. The Rf value obtained was 0.31. But-3-yn-1-yl (N9,N9-diethyl-9H-benzo[a]phenoxazine-5,9-diamine) was analysed using a variety of spectroscopic methods, and all data are presented below.
1H NMR: But-3-yn-1-yl (N9,N9-diethyl-9H-benzo[a]phenoxazine-5,9-diamine) bromide (AV400 with DMSO): 6.2–8 ppm (aromatic C-H, multiplet, 7, 10, 11, 12, 13, 15, 17, 18), 3.5 ppm (amine (NH), multiplet, 19), 2.6 ppm (aliphatic C-H, multiplet, 21), 2.5 ppm (aliphatic C-H, multiplet, 20), 2.1 ppm (alkyne CH, singlet, 23), 1–1.3 ppm (aliphatic C-H, R-CH3, multiplet, 25, 26, 27, 28).
FT-IR: But-3-yn-1-yl (N9,N9-diethyl-9H-benzo[a]phenoxazine-5,9-diamine) bromide: 2950–3100−1 (C-H stretch, aromatic C-H, broad weak, 7, 10, 11, 12, 13, 15, 17, 18, 20, 21, 25, 26, 27, 28), 1643 cm−1 (alkyne stretch, medium, 22, 23), 1532 cm−1 (amine stretch, medium, 19).

3.1.4. Synthesis of (3-Carboranylpropyl) (N9,N9-Diethyl-9H-benzo[a]phenoxazine-5,9-diamine) Bromide (4)

The progress of the reaction for compound 4 (Figure 7) was analysed through TLC (silica plates) using hexane as the mobile phase. The Rf value obtained was 0.4. The yields obtained were around 85%, with the product having a fine texture and dark blue in colour.
1H NMR: (3-carboranylpropyl)-(N9,N9-diethyl-9H-benzo[a]phenoxazine-5,9-diamine) bromide (AV400 with DMSO): 6.2–8 ppm (aromatic C-H, multiplet, 7, 10, 11, 12, 13, 15, 17, 18), 3.3–3.5 ppm (amine (NH), multiplet, 19), 0.8–1 ppm (borohydride, B-H, multiplet, 22), 1.8–2.2 ppm (aliphatic C-H, multiplet, 20), 2.5 ppm (aliphatic C-H, multiplet, 21).
11B NMR: (3-carboranylpropyl)-(N9,N9-diethyl-9H-benzo[a]phenoxazine-5,9-diamine) bromide (AV400 with DMSO): −40 ppm (B-H bond), −20 ppm (C-H bond).
FT-IR: (3-carboranylpropyl)-(N9,N9-diethyl-9H-benzo[a]phenoxazine-5,9-diamine) bromide: 3223 cm−1 (aromatic C-H stretch, weak, 7, 10, 11, 12, 13, 15, 17, 18), 2924 cm−1 (C-H Stretch, medium, 26, 24), 2499 cm−1 (B-H stretch, medium, 22), 1582 cm−1 (amine stretch aromatic, medium, 19), 1000 cm−1(B-H deformation, medium, 22), 800–900 cm−1 (B-H vibration, medium).

3.1.5. Synthesis of But-3-yn-1-yl 3,7-Diamino-5-phenylphenazin-5-ium Bromide (5)

The formation of the intermediate to form compound 5 (Figure 8) allows for the functionalisation of the amine group with 1-bromo-3-butyne, which can form a more reactive alkyne bond via a SN2 reaction. Once formed, this can allow for the in situ formation of the carborane dye.
Compound 5 was formed by reducing the phenosafranine from a salt form to a neutral form; the progress of the reaction was carefully analysed through TLC (Silica plates) using hexane as the mobile phase. The Rf value obtained was 0.38.
Compound 5 was formed through firstly the transformation of 3,7-diamino-5-phenylphenazin-5-ium bromide from a salt form to a neutral form; the progress of the reaction was carefully analysed through TLC (silica plates) using hexane as the mobile phase. The Rf value obtained was 0.27. But-3-yn-1-yl 3,7-diamino-5-phenylphenazin-5-ium bromide was analysed using a variety of spectroscopic methods (see Section 3.2.2), and all data are presented below.
1H NMR: But-3-yn-1-yl 3,7-diamino-5-phenylphenazin-5-ium bromide: (AV400 with DMSO): 7–8.2 ppm (aromatic C-H, multiplet, 3, 4, 6, 10, 12, 13, 21, 22, 23, 24, 25), 5.8 ppm (aliphatic C-H, CH2-CH2, singlet, 16, 17), 3.36 ppm (alkyne CH, C-CH, singlet, 19), 2.66–3 ppm (amine, N-H, multiplet, 15), 2.51 ppm (amine, H-N-H, singlet, 26).
13C NMR: But-3-yn-1-yl 3,7-diamino-5-phenylphenazin-5-ium bromide: 39 ppm (amine C-NH, 11), 40 ppm (amine C-NH, 5), 41 ppm (alkane C-H, 17,18), 93 ppm (alkyne C-H, 19), 121 ppm (aromatic C-H, 12), 128 ppm (aromatic C-H, 10, 13), 131 ppm (aromatic C-H, 2, 7, 9, 14), 134 ppm (aromatic C-H, 20), 135 ppm (aromatic C-H, 21, 25), 136 ppm (aromatic C-H, 22, 23, 24), 137 ppm (aromatic C-H, 3, 6), 157 ppm (aromatic C-H, 4).
FT-IR: But-3-yn-1-yl 3,7-diamino-5-phenylphenazin-5-ium bromide: 3301 cm−1 (aromatic C-H, Weak, 3, 4, 6, 10, 12, 13, 21, 22, 23, 24, 25), 1643 cm−1 (alkyne stretch, medium, 18, 19), 3097 cm−1 (C-H Stretch, medium, 16, 17), 1532 cm−1 (amine stretch, medium, 25).

3.1.6. Synthesis of (3-Carboranylpropyl) (3,7-Diamino-5-phenylphenazin-5-ium) Bromide (6)

The progress of the reaction for compound 6 (Figure 9) was analysed through TLC (silica plates) using hexane as the mobile phase. The Rf value obtained was 0.38. The yields obtained were around 85%, with the product having a fine texture and dark red in colour.
1H NMR: (3-carboranylpropyl) (3,7-diamino-5-phenylphenazin-5-ium bromide): (AV400 with DMSO): 7–8.2 ppm (aromatic C-H, multiplet, 3, 4, 6, 10, 12, 13, 20, 21, 22, 23, 24), 5.8 ppm (aliphatic C-H, CH2-CH2, singlet, 16), 3.8 ppm (aliphatic C-H, CH2-CH2, singlet, 17), 2.6–3.5 ppm (amine, N-H, multiplet, 15), 2.4 ppm (amine, H-N-H, singlet, 25), 0.8–1.2 ppm (borohydride, B-H, multiplet, 18).
11B NMR: (3-carboranylpropyl) (3,7-diamino-5-phenylphenazin-5-ium bromide): (AV400 with DMSO): −40 ppm (boron hydrogen bond, 18), −20 ppm (carborane hydrogen bond, 18).
FT-IR: (3-carboranylpropyl) (3,7-diamino-5-phenylphenazin-5-ium bromide): 3226 cm−1 (aromatic C-H, Weak, 3, 4, 6, 10, 12, 13, 20, 21, 22, 23, 24), 2924 cm−1 (C-H Stretch, medium, 16, 17), 2522 cm−1 (B-H stretch, medium, 18), 1511 cm−1 (amine stretch, medium, 25), 1000 cm−1 (B-H deformation, medium, 18), 800–900 cm−1 (B-H vibration, medium, 18).

3.2. Formulation

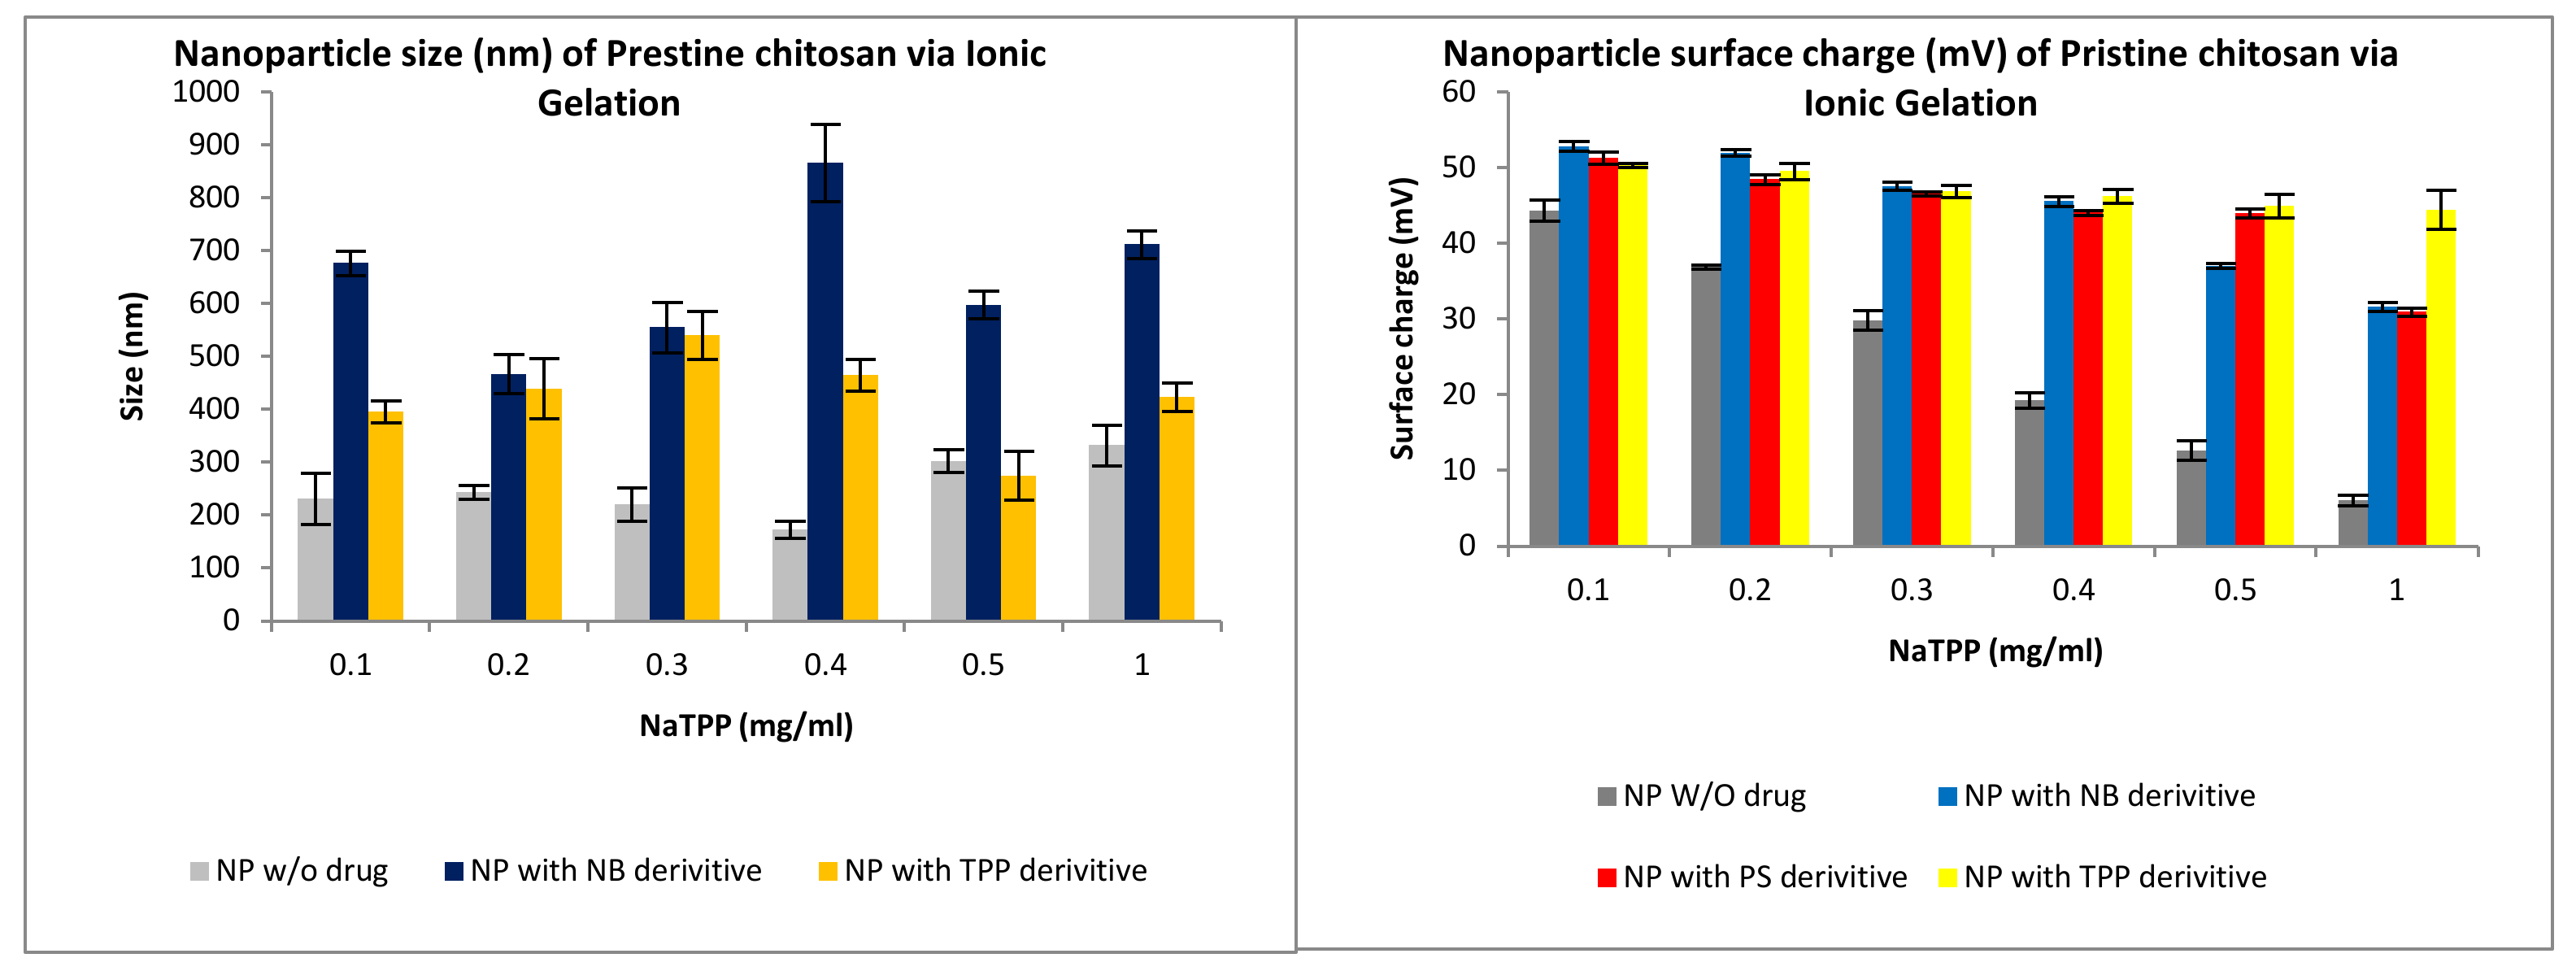
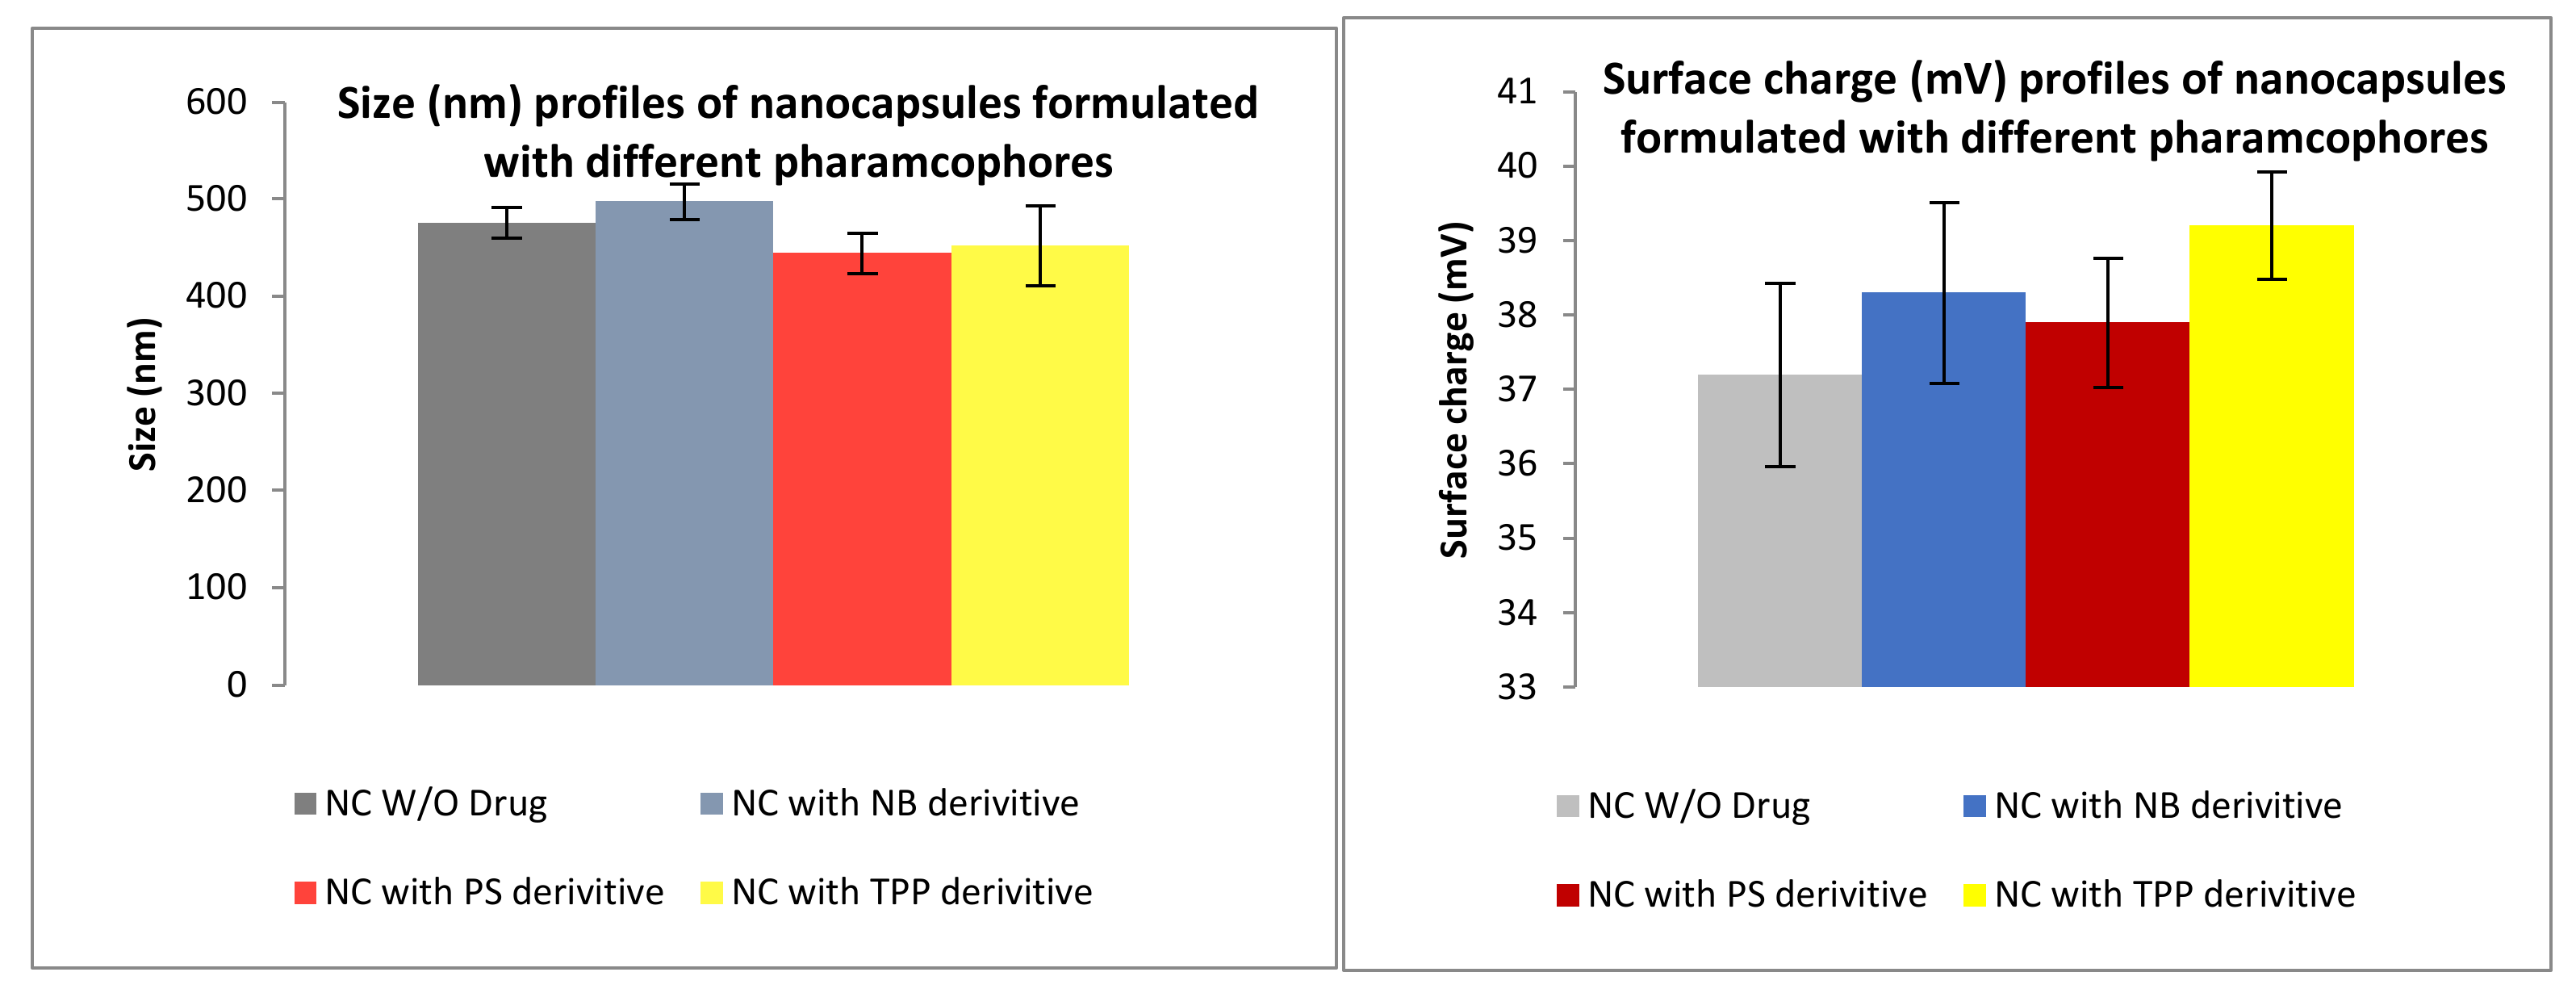
3.2.1. Size and Surface Charge Analysis via IG

The formulation of NP was performed via Ionotropic gelation (IG). The second formulation prepared was the use of chitosan in combination with polypyrrole (PPY). Figure 10 and Figure 11 indicate the results obtained whereby an increase in the crosslinker NaTPP showed a direct relationship to a decrease in surface charge while also having no clear effect on size. Figure 11 shows the physiochemical characteristics of the formulated nanocapsules encapsulating the drug, with nanocapsules showing similar characteristics all around.
Size and surface charge for Chitosan-polypyrrole Nanocapsules.

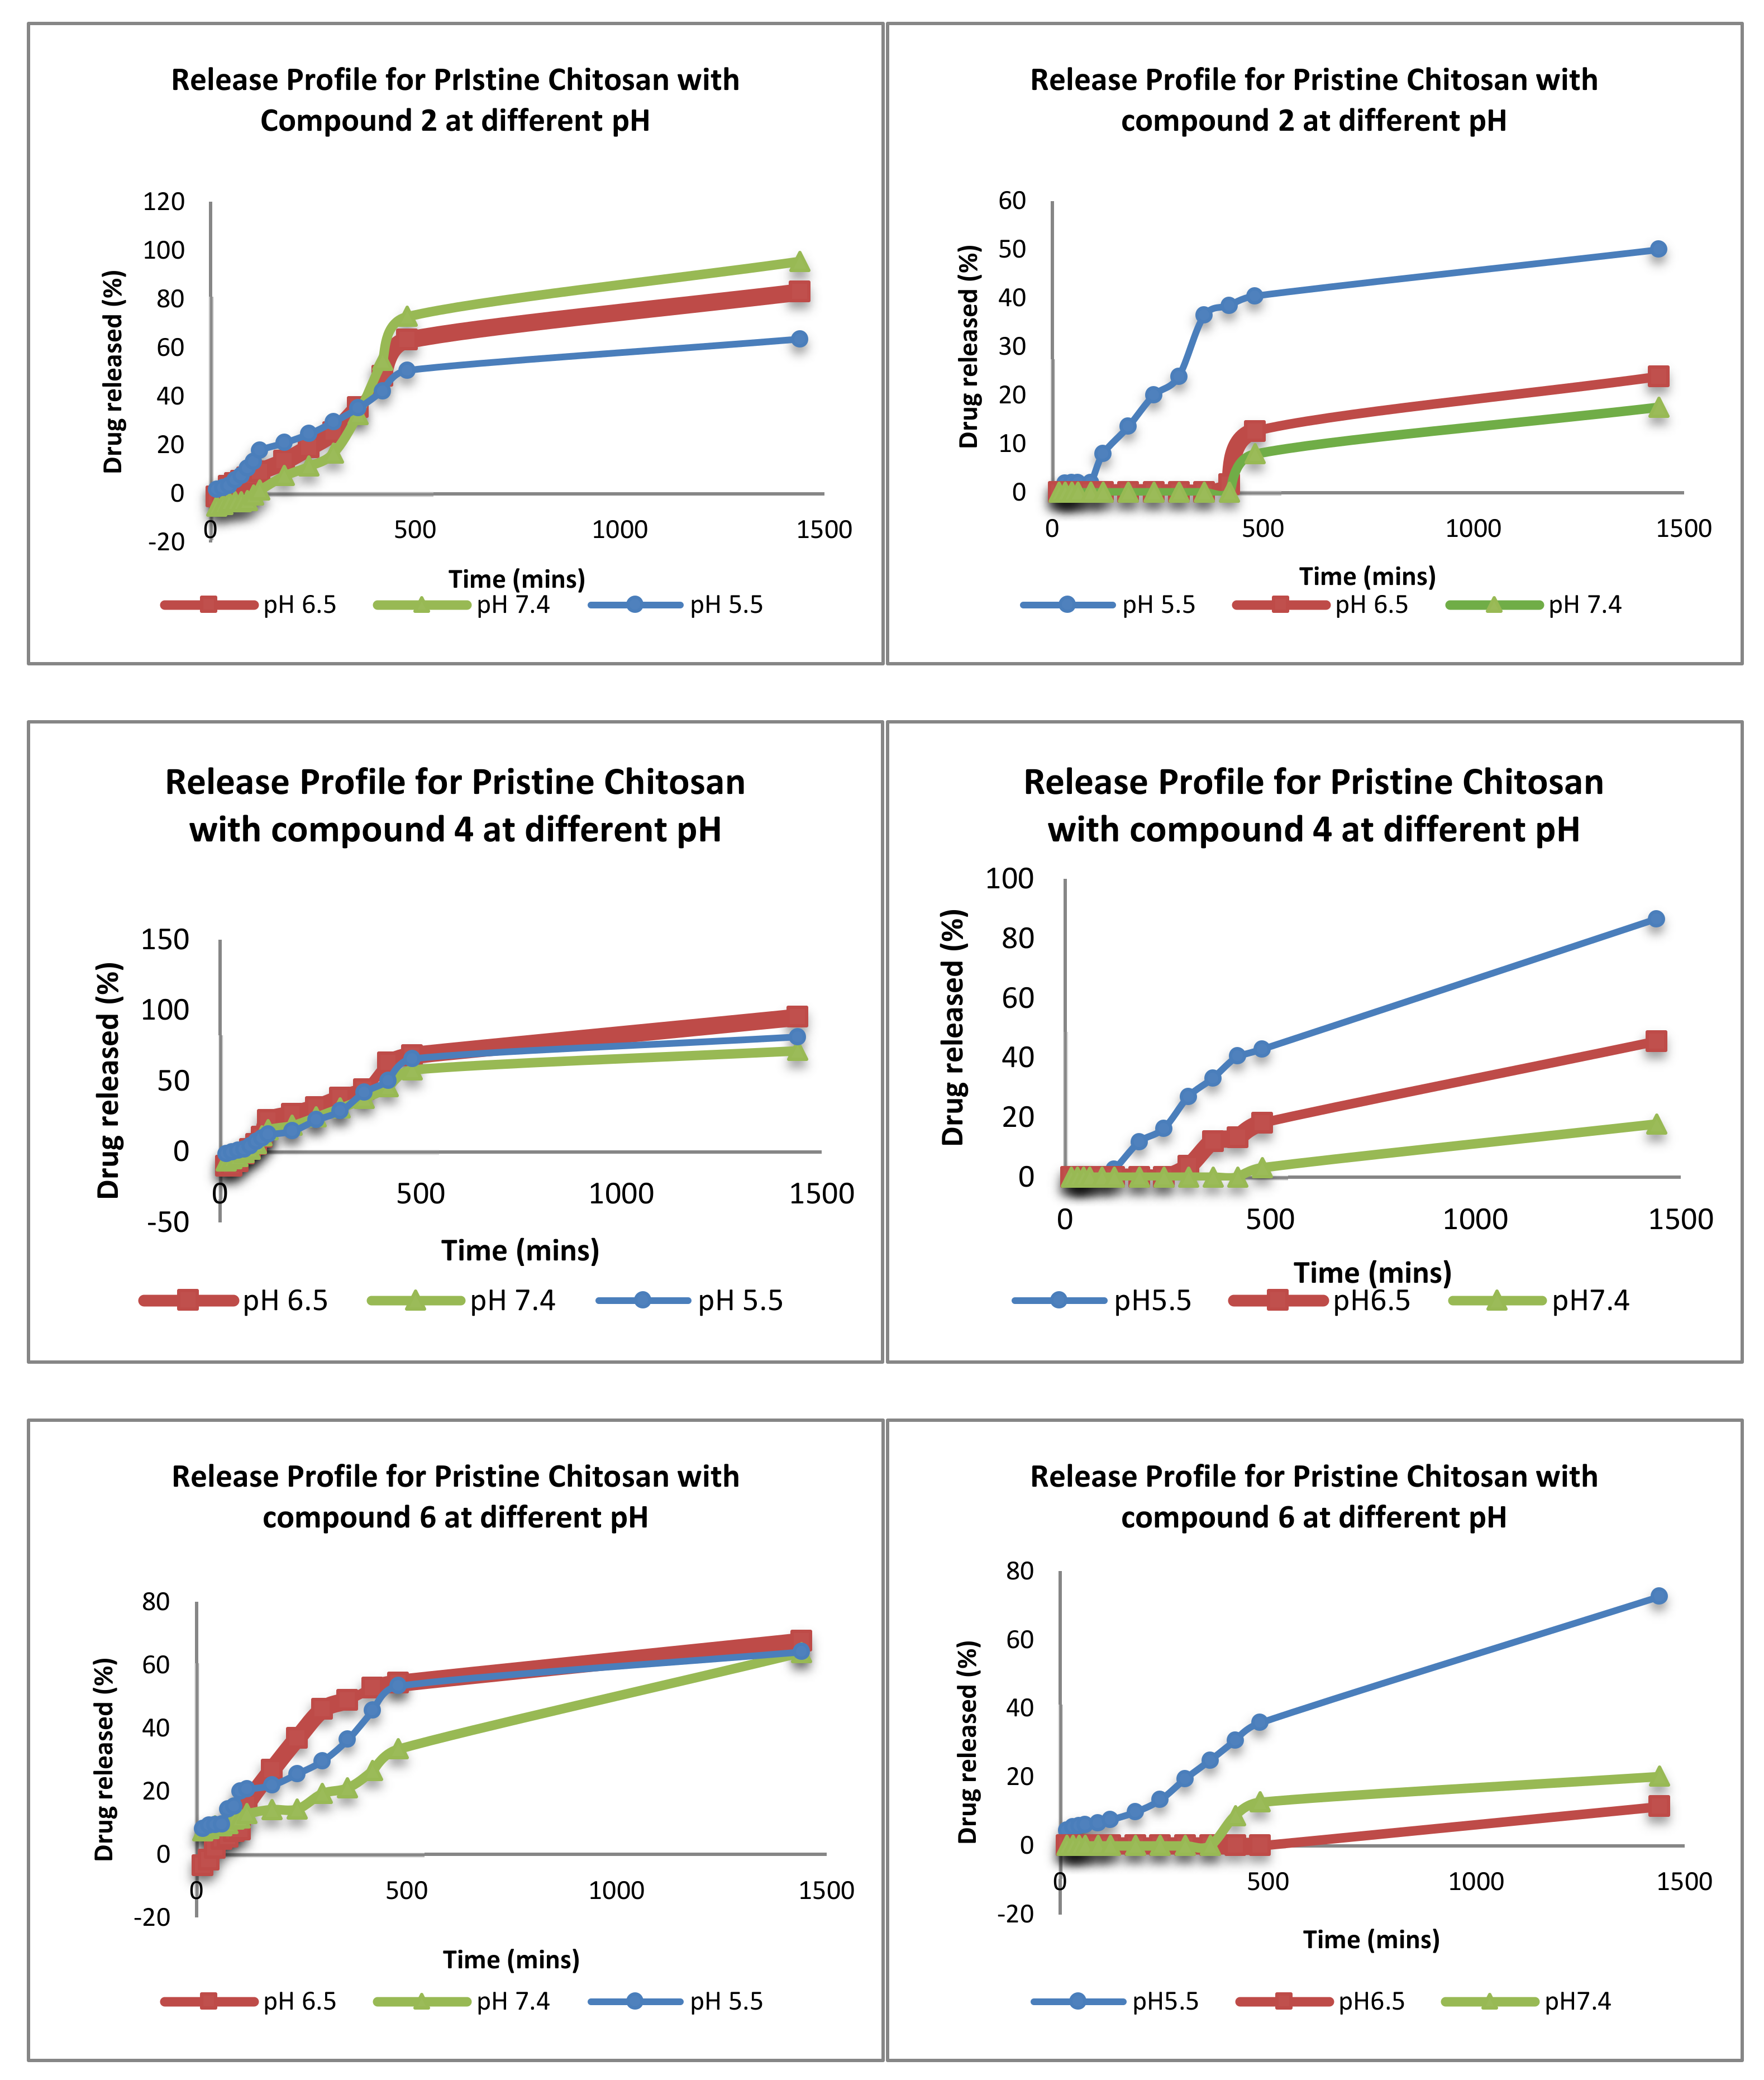
3.2.2. Ex-Vivo Release Studies

When performing release studies (Figure 12), three pH environments are used to assess the validity and suitability of these nanovehicles to selectively target tumour cells. The chosen pH values are pH 7.4 (mimicking the pH of the blood), pH 6.5 (pH of normal cells) and pH 5.5 (mimicking a tumour microenvironment). In addition, we compared the formulation of chitosan NP vs. PPY-CHIT NC.

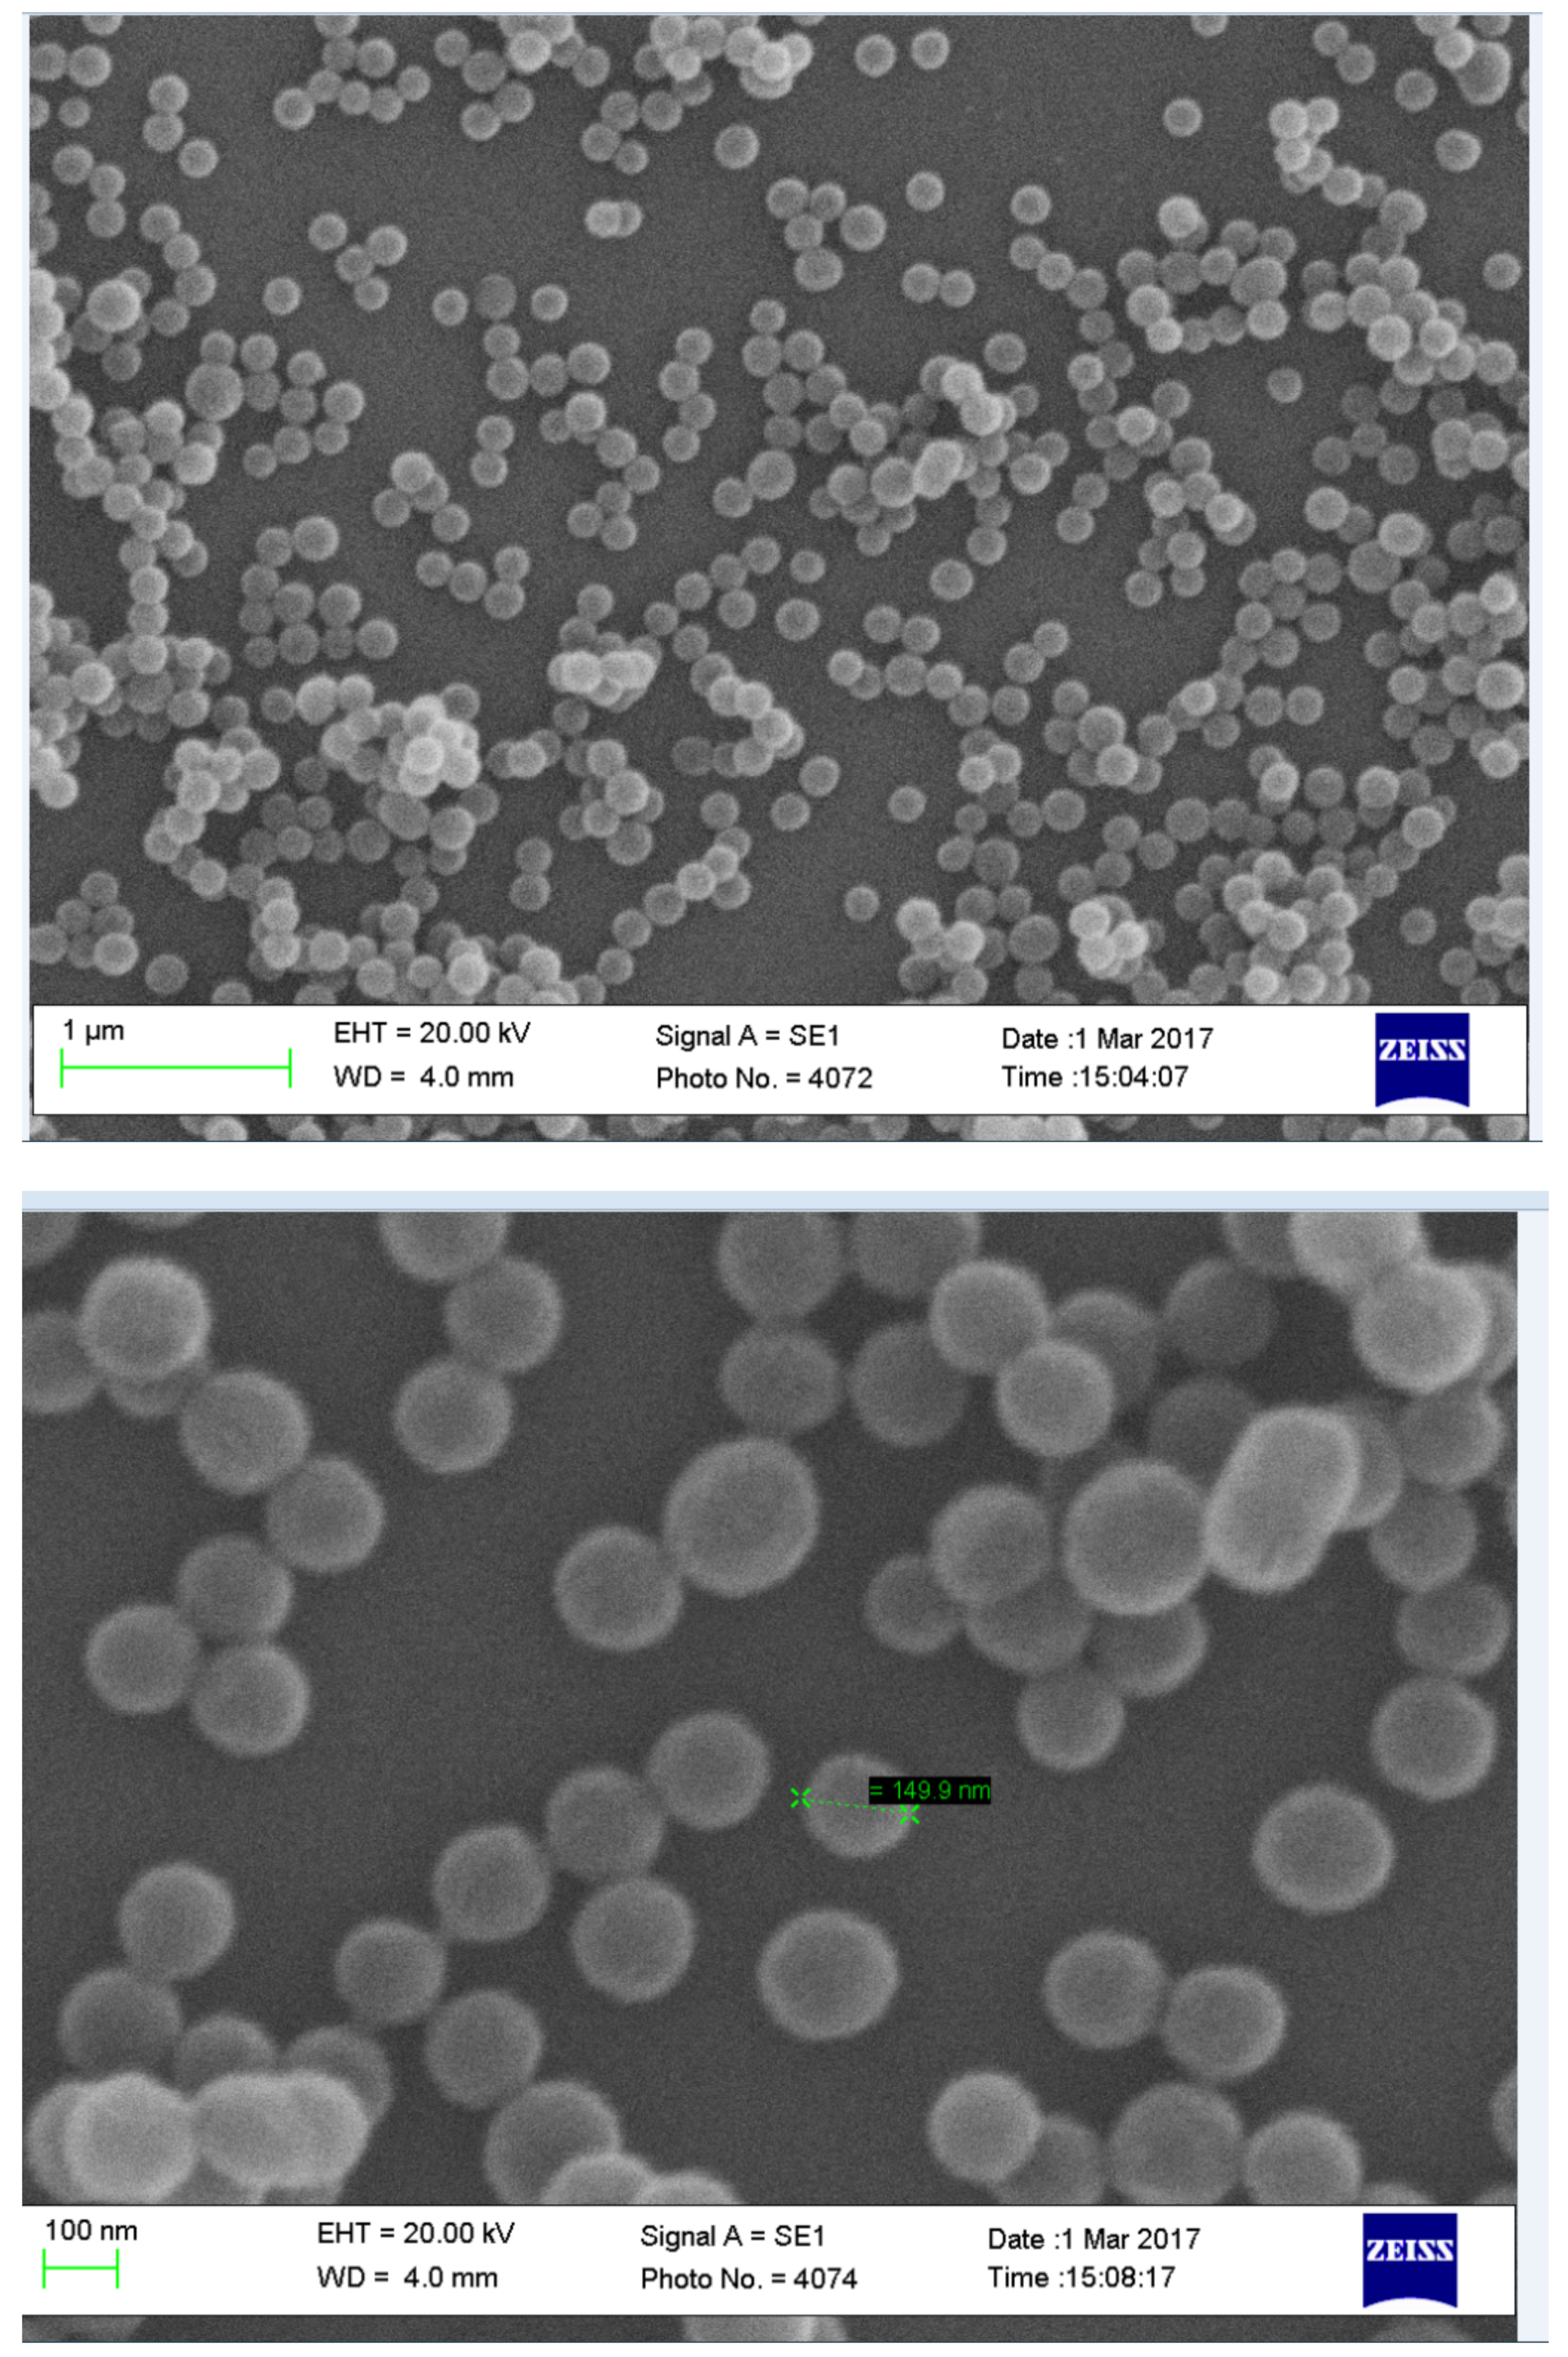
3.2.3. Scanning Electron Microscope for Loaded Nanoparticles

Scanning electron images showing the uniformity of non-drug-loaded nanoparticles with a size of around 150 nm (Figure 13). The nanoparticles are spherical in shape and are homogenous in size.

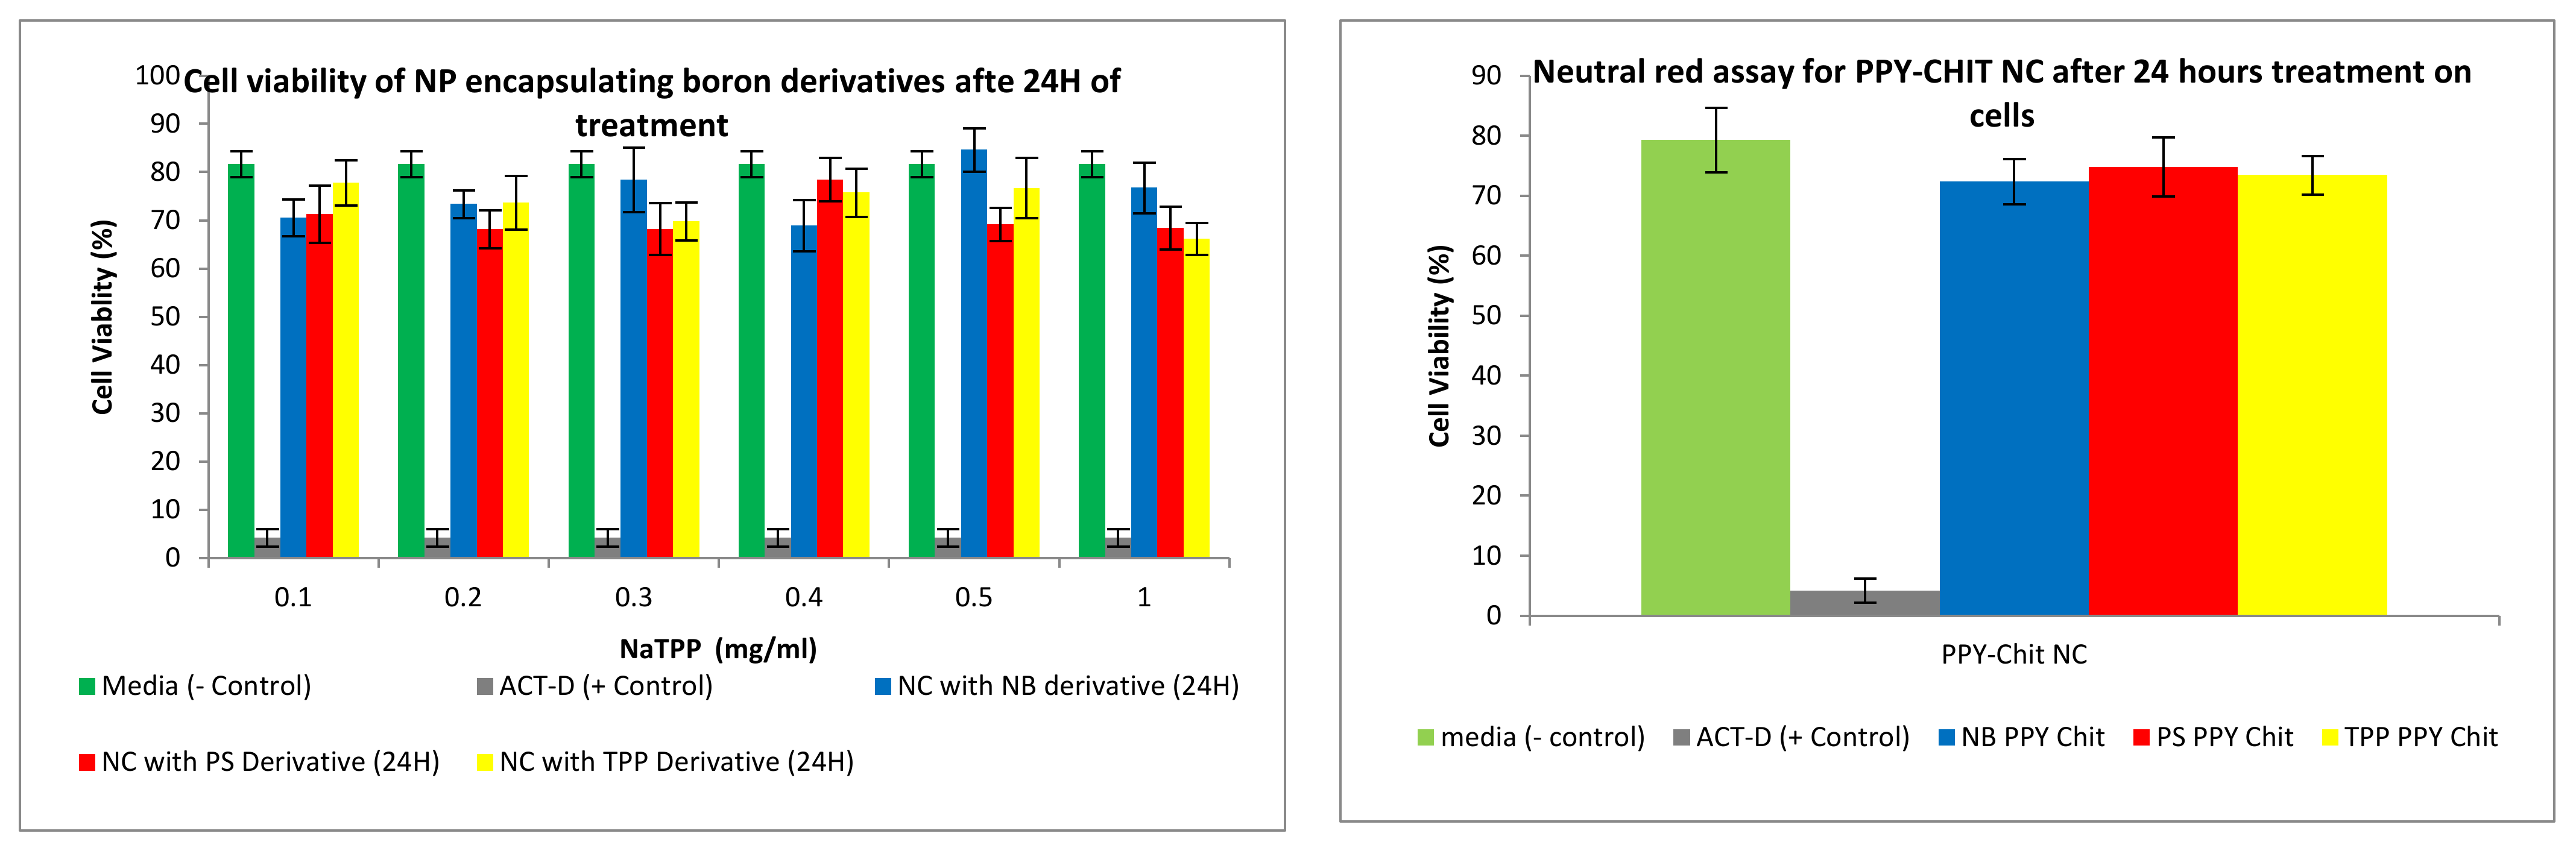
3.2.4. Neutral Red Toxicity Assays

A neutral red toxicity assay is an assay that measures the integrity of the cytoplasm within the membrane of cells. Figure 14 shows the toxicity of the different formulations when compared to negative control and positive control. The formulations showed little toxicity towards the cells, therefore showing promise towards being a suitable vehicle.

3.3. Preliminary Cell Studies

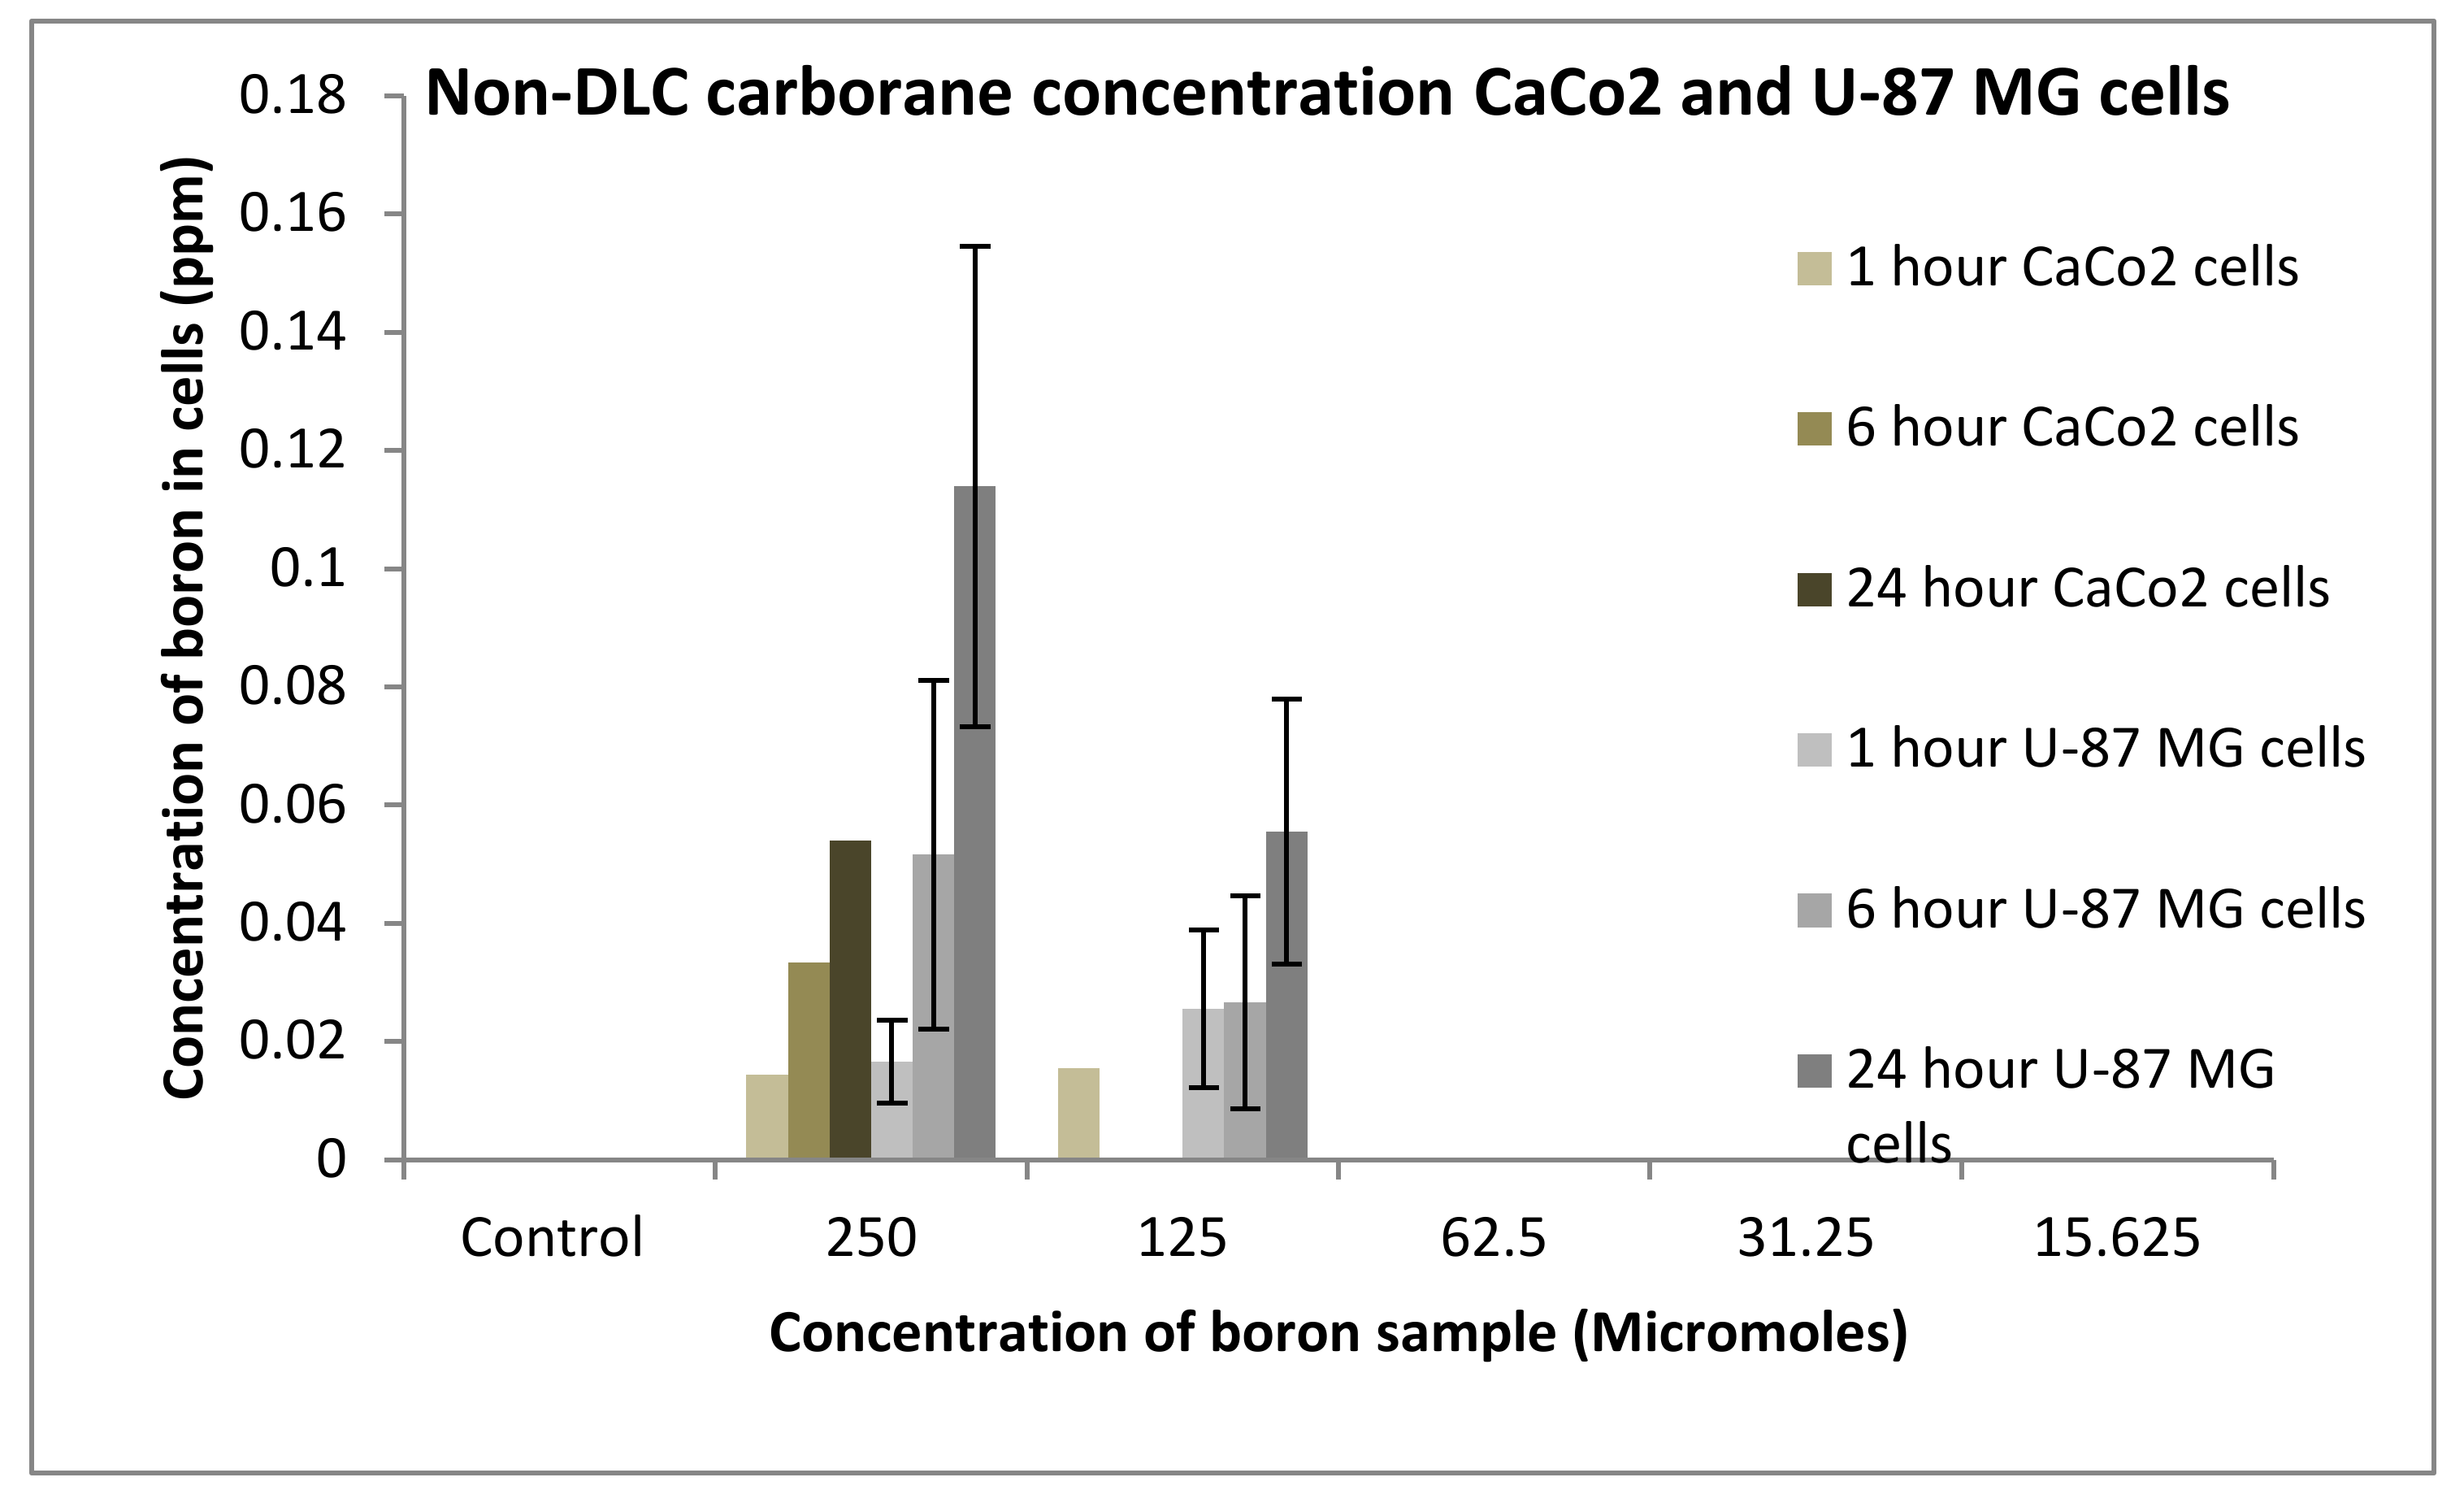
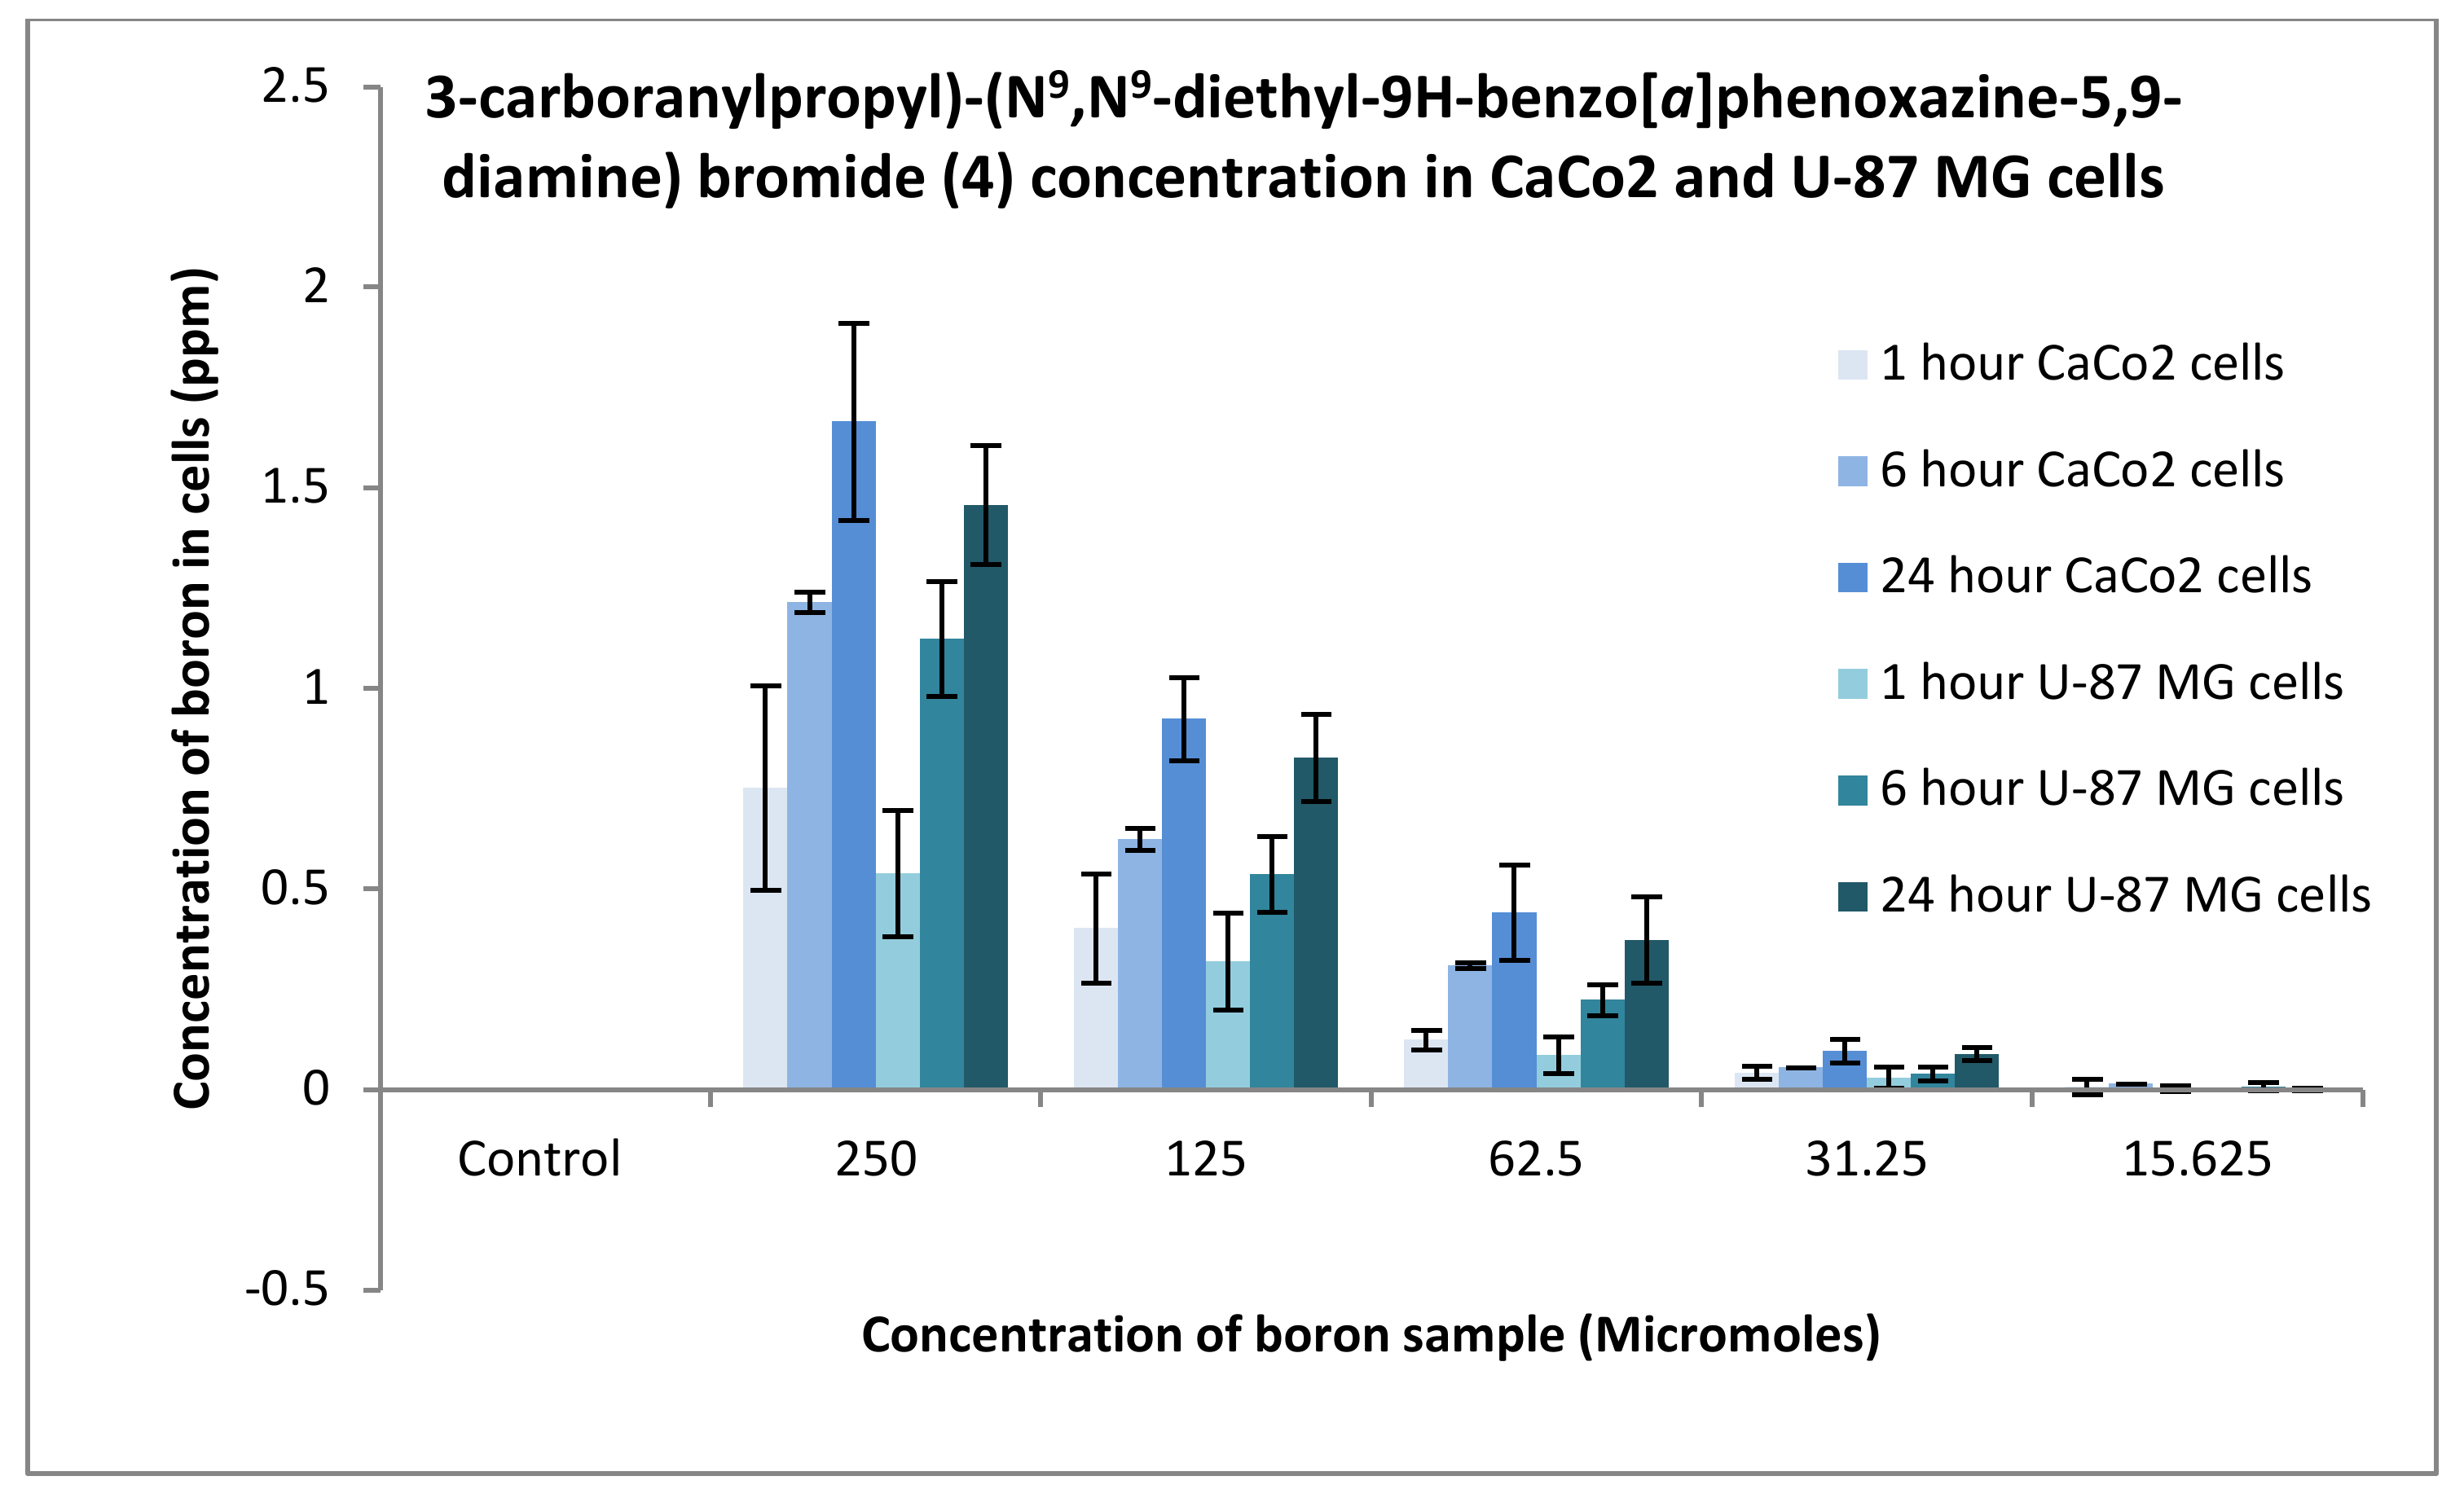
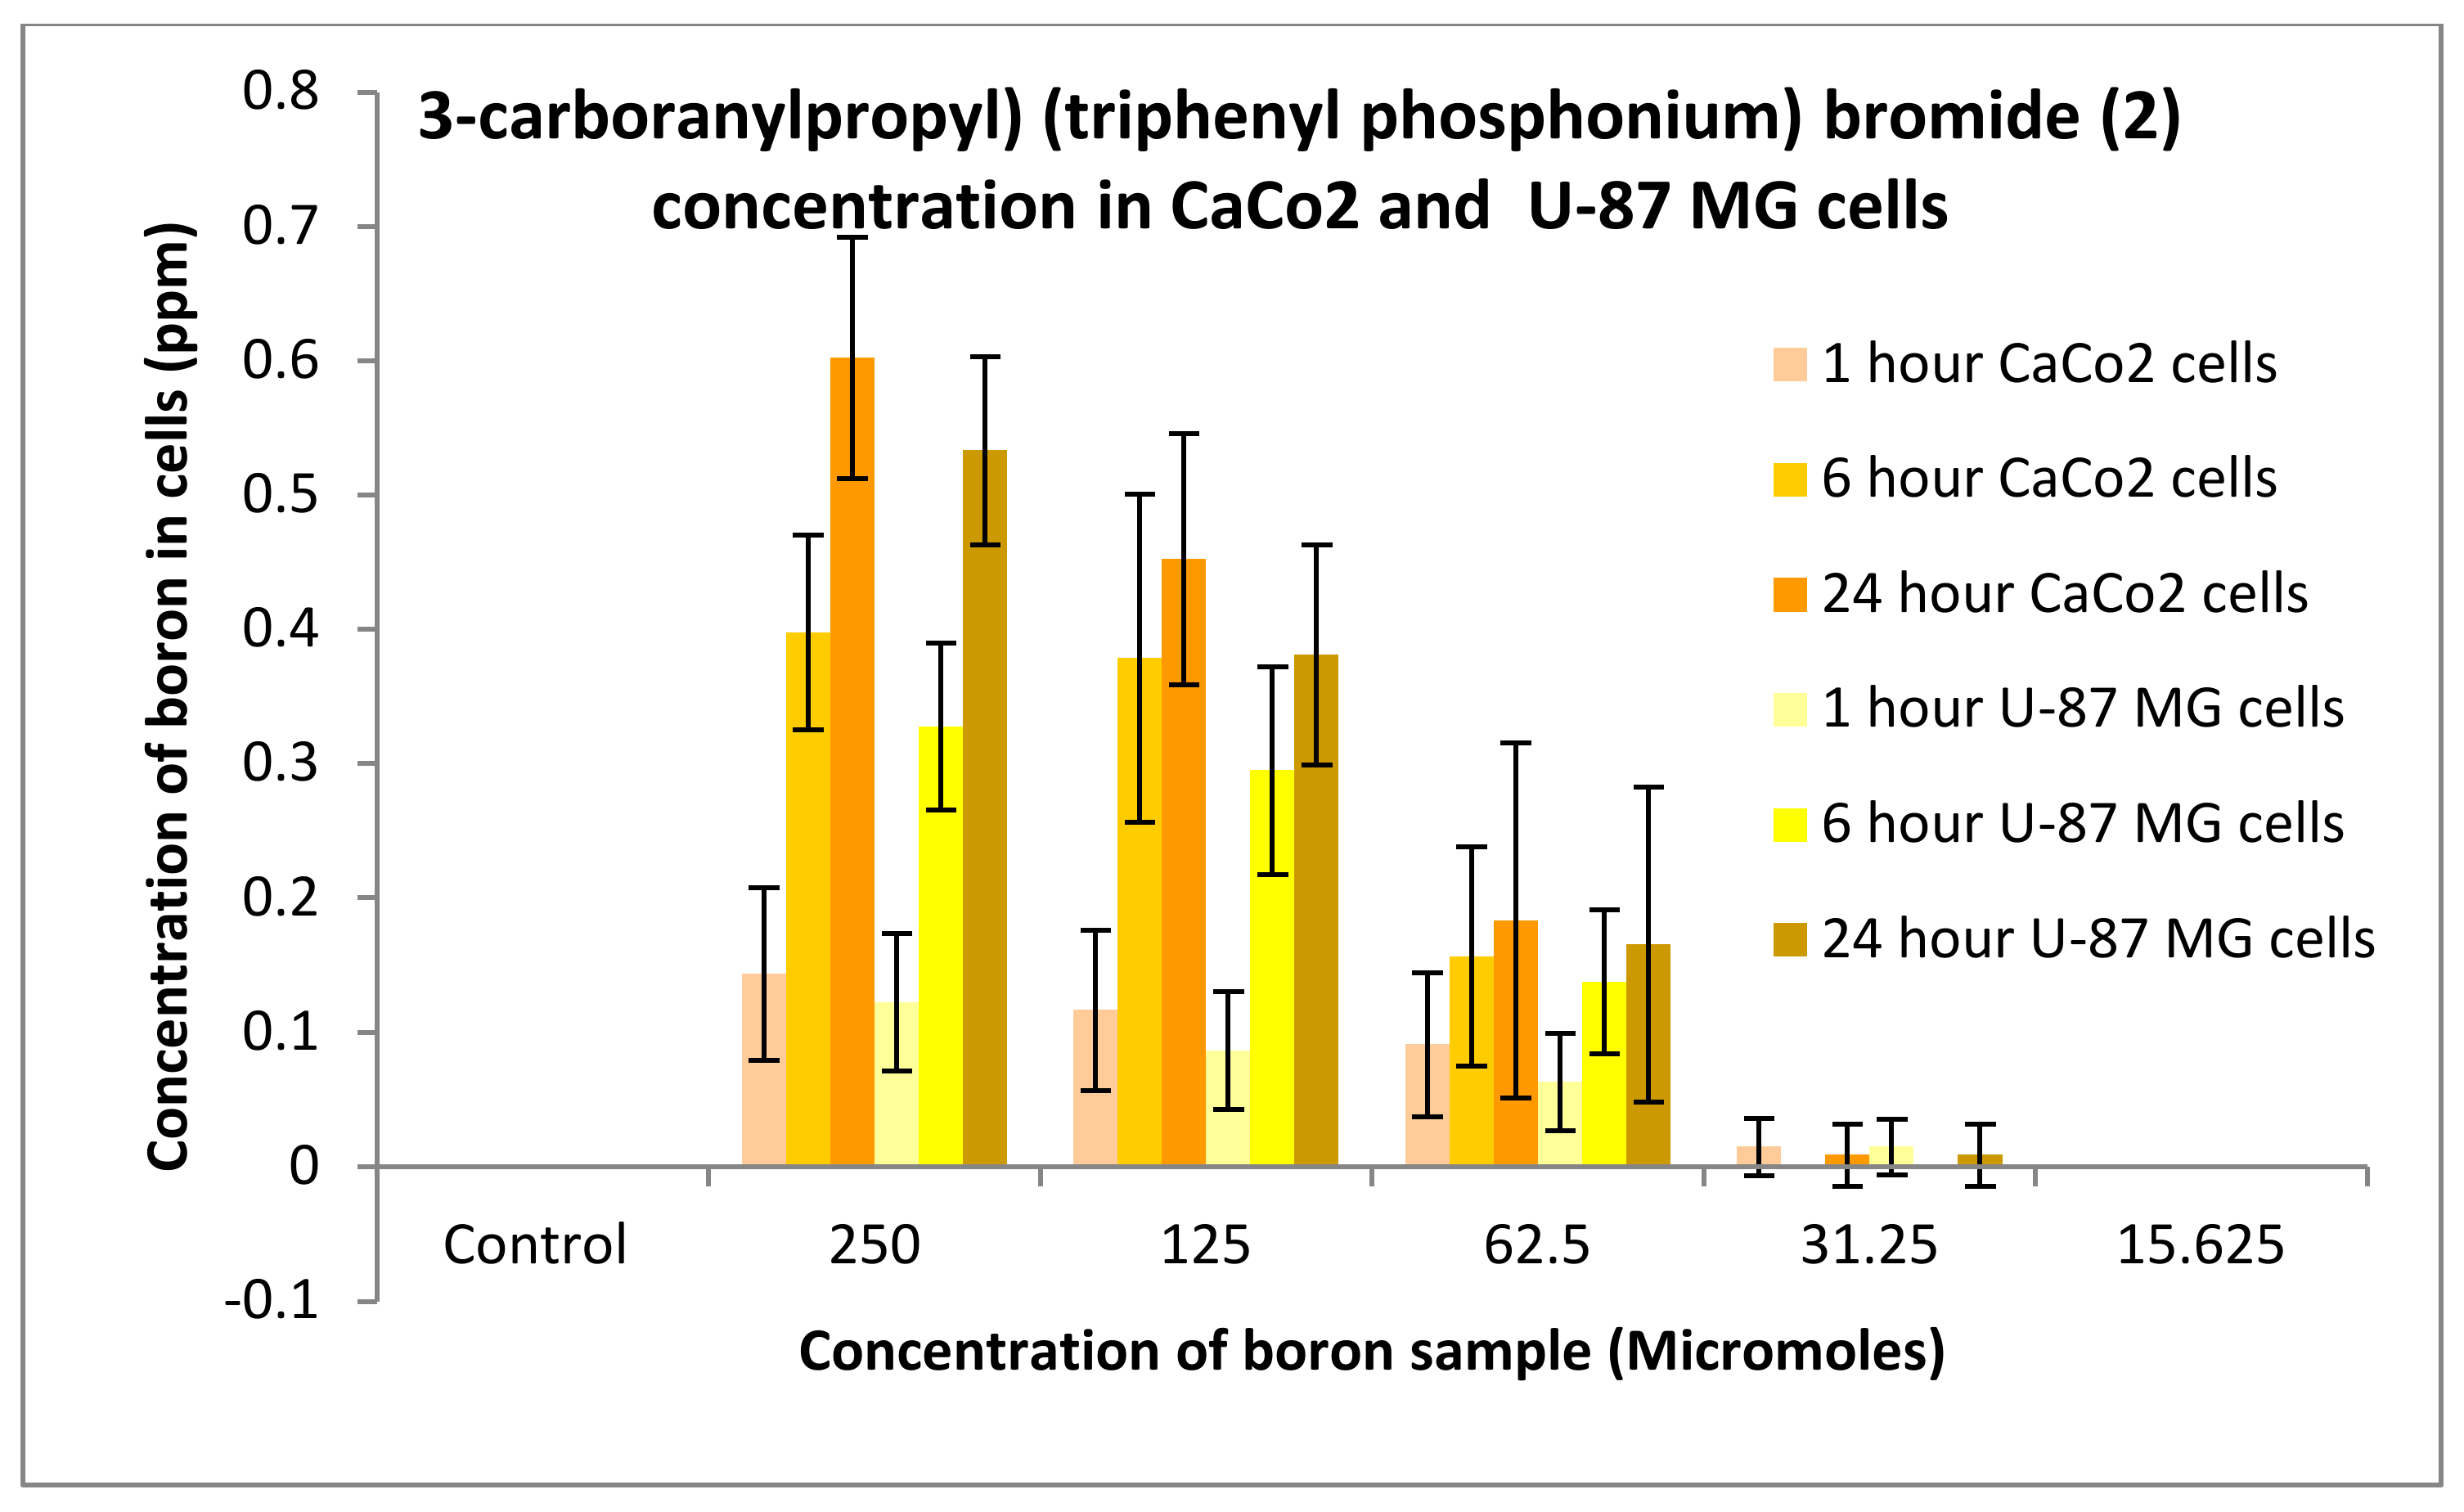
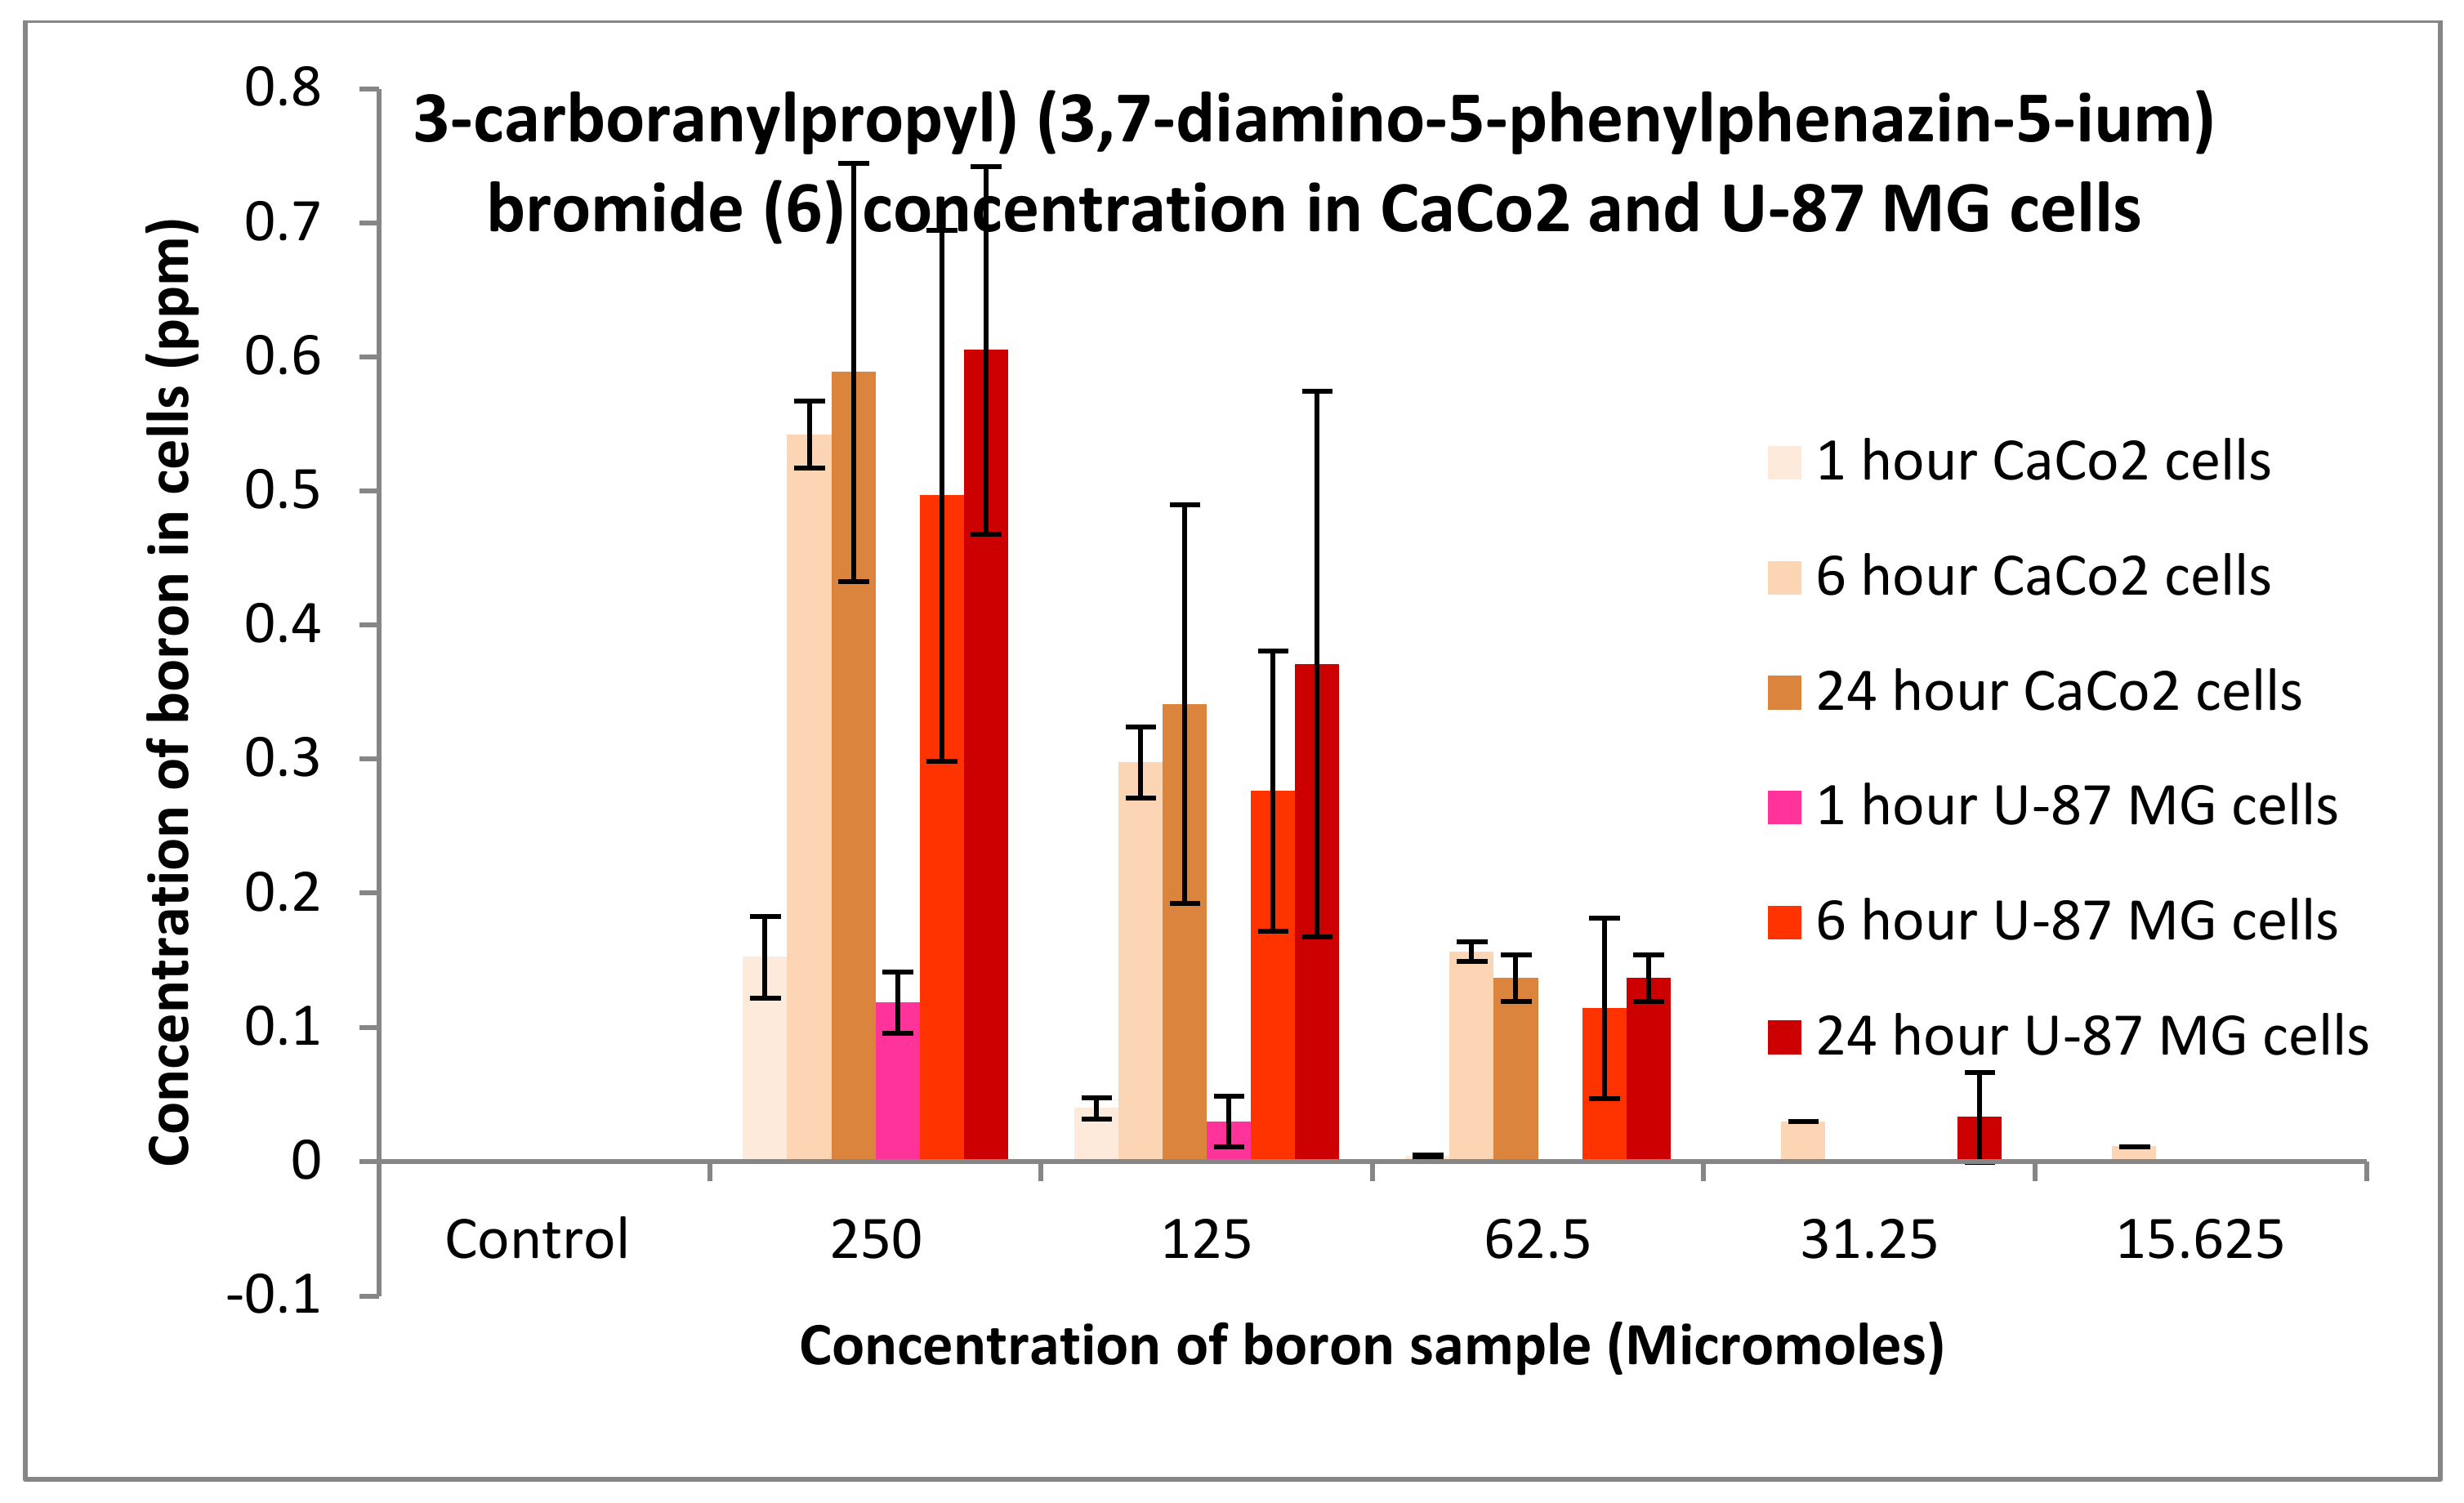
3.3.1. Boron Uptake Studies in CaCo2 Cells and U-87 MG Cells

The uptake of boron was undertaken on CaCo2 and U-87 MG cells, and the process was analysed using an ICP-MS (Agilent Technology 7700; nebuliser pump rate = 0.08 rps; makeup gas flow rate = 0.3 L/min; carrier gas flow rate = 1.4 L/min), whereby boron was taken as a control and the three compounds synthesised: compounds 2, 4 and 6. An increase in boron uptake into cells can be observed when compared against pristine decaborane (control). For example, compound 2 after 24 h boron uptake into CaCo2 cells was 0.6 ppm, and for compound 4, boron uptake was around 1.7 ppm (Figure 15 and Figure 16). Pristine decaborane showed boron uptake into cells of only 0.055 ppm, hence showing the significant capability of these boronated DLCs in accumulating boron into the tumour cells. Similarly, Figure 17 and Figure 18, the other boron moieties, showed an increase in boron concentrations over time, indicating a potential for selective delivery to both cell lines.

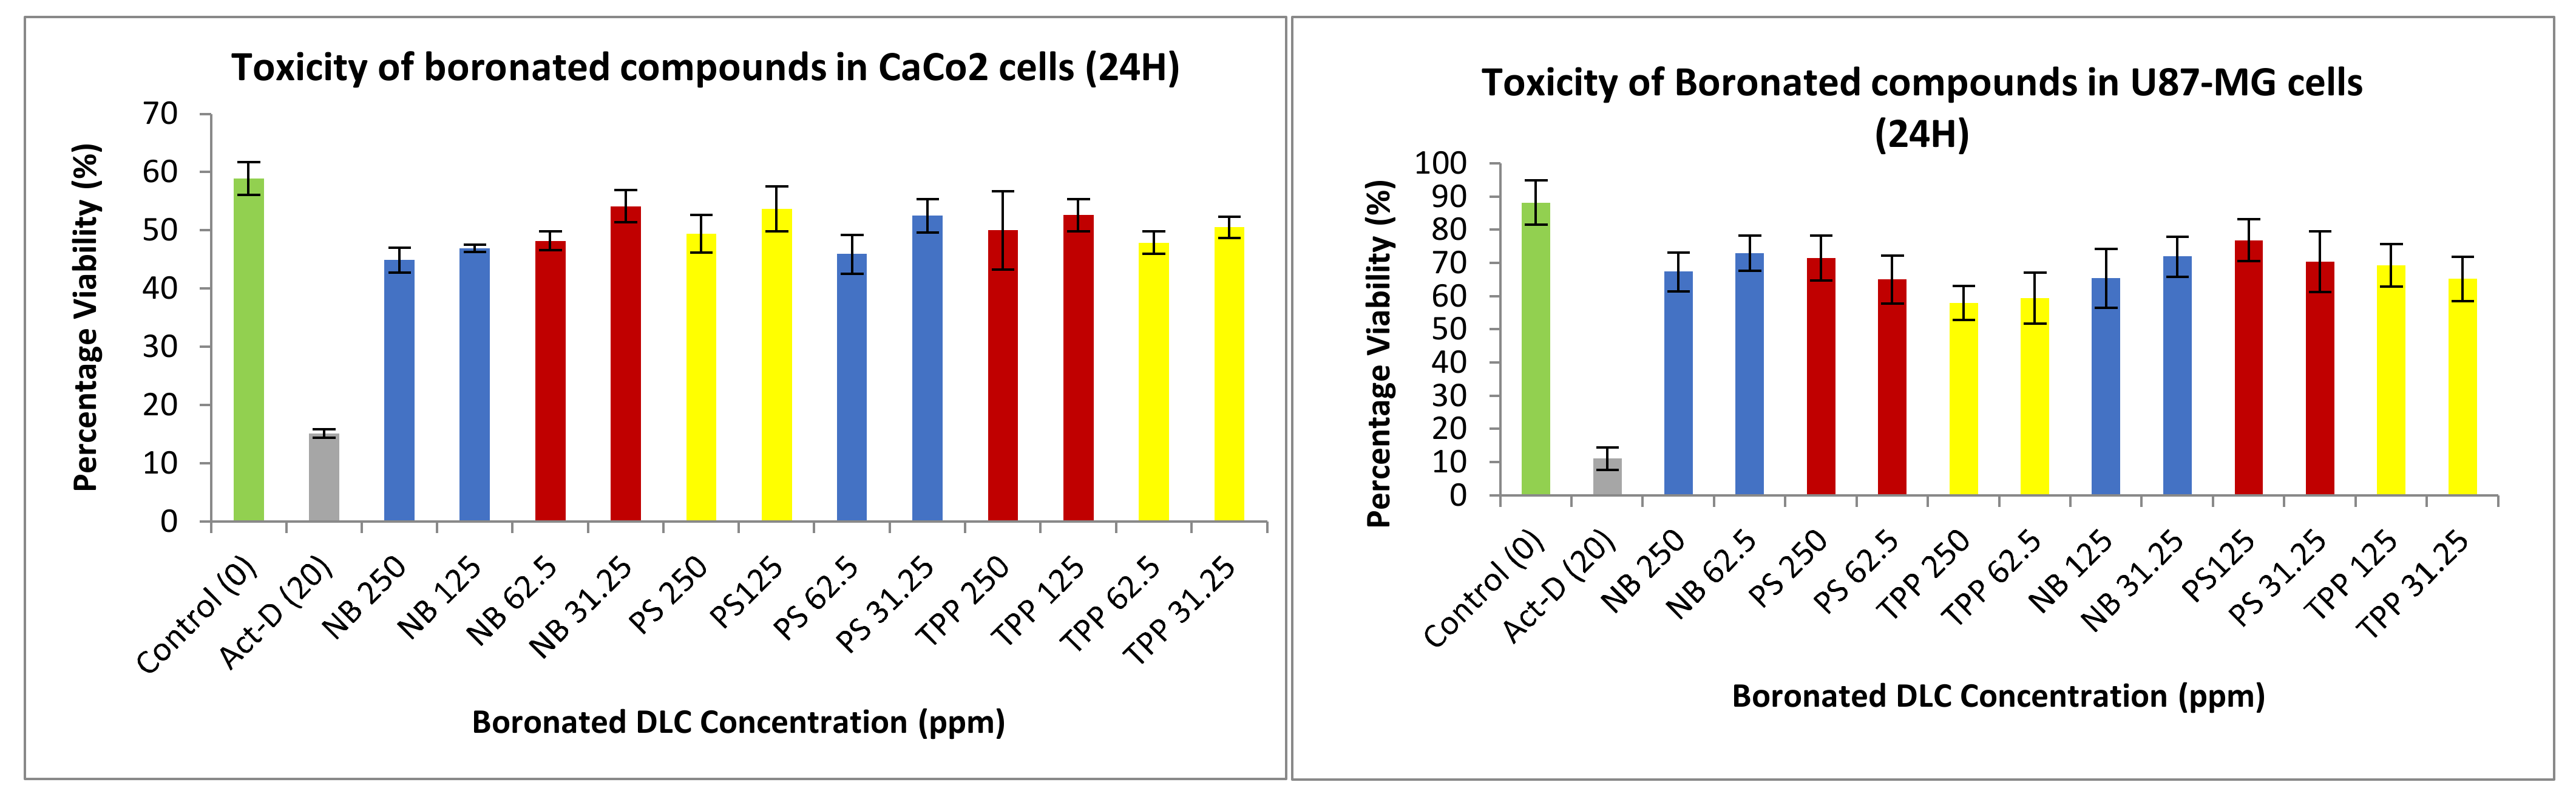
3.3.2. Neutral Red Toxicity Assays

In order to measure the integrity of the cytoplasm within the membrane of cells, a neutral red toxicity assay was carried out. Two controls were used: a negative control, whereby the media on its own (expected to keep the cells healthy) and the cytotoxic antibiotic actinomycin D (to cause lysis). All formulations treated on CaCo2 or U-87 MG cells after 24 h showed minimal toxicity towards the cells, hence rendering these safe and suitable for treating brain tumours (Figure 19).

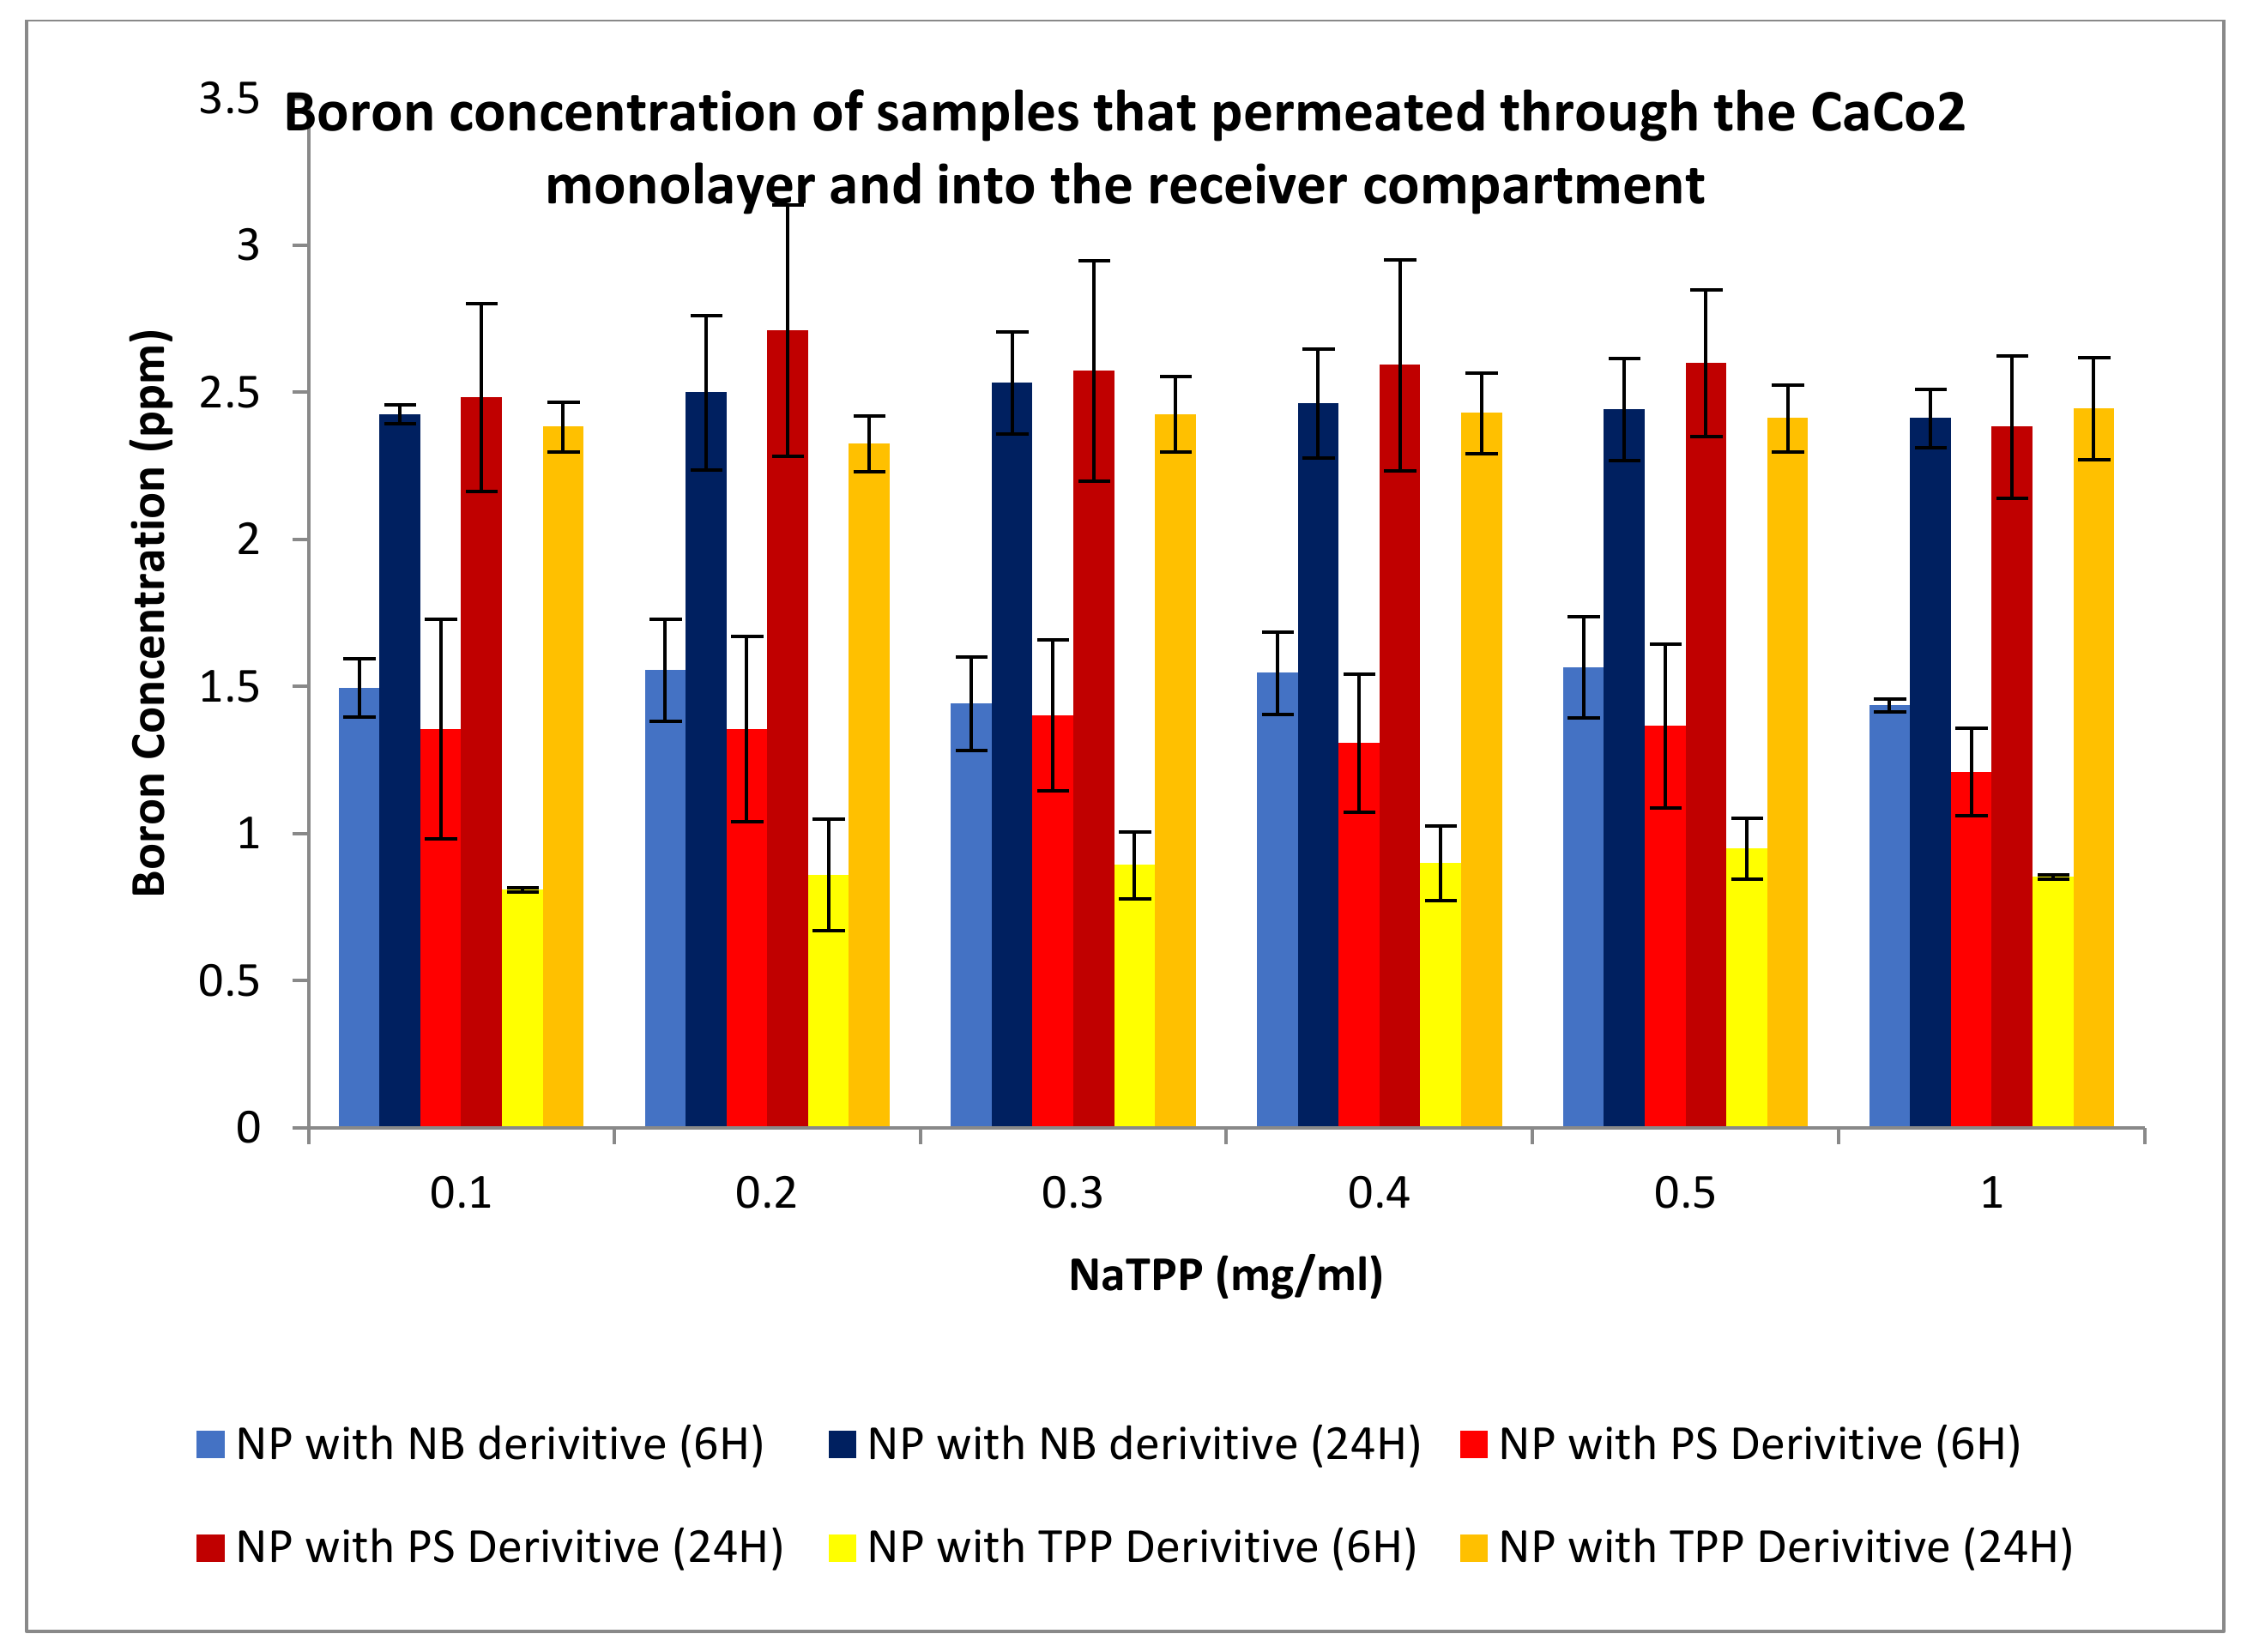
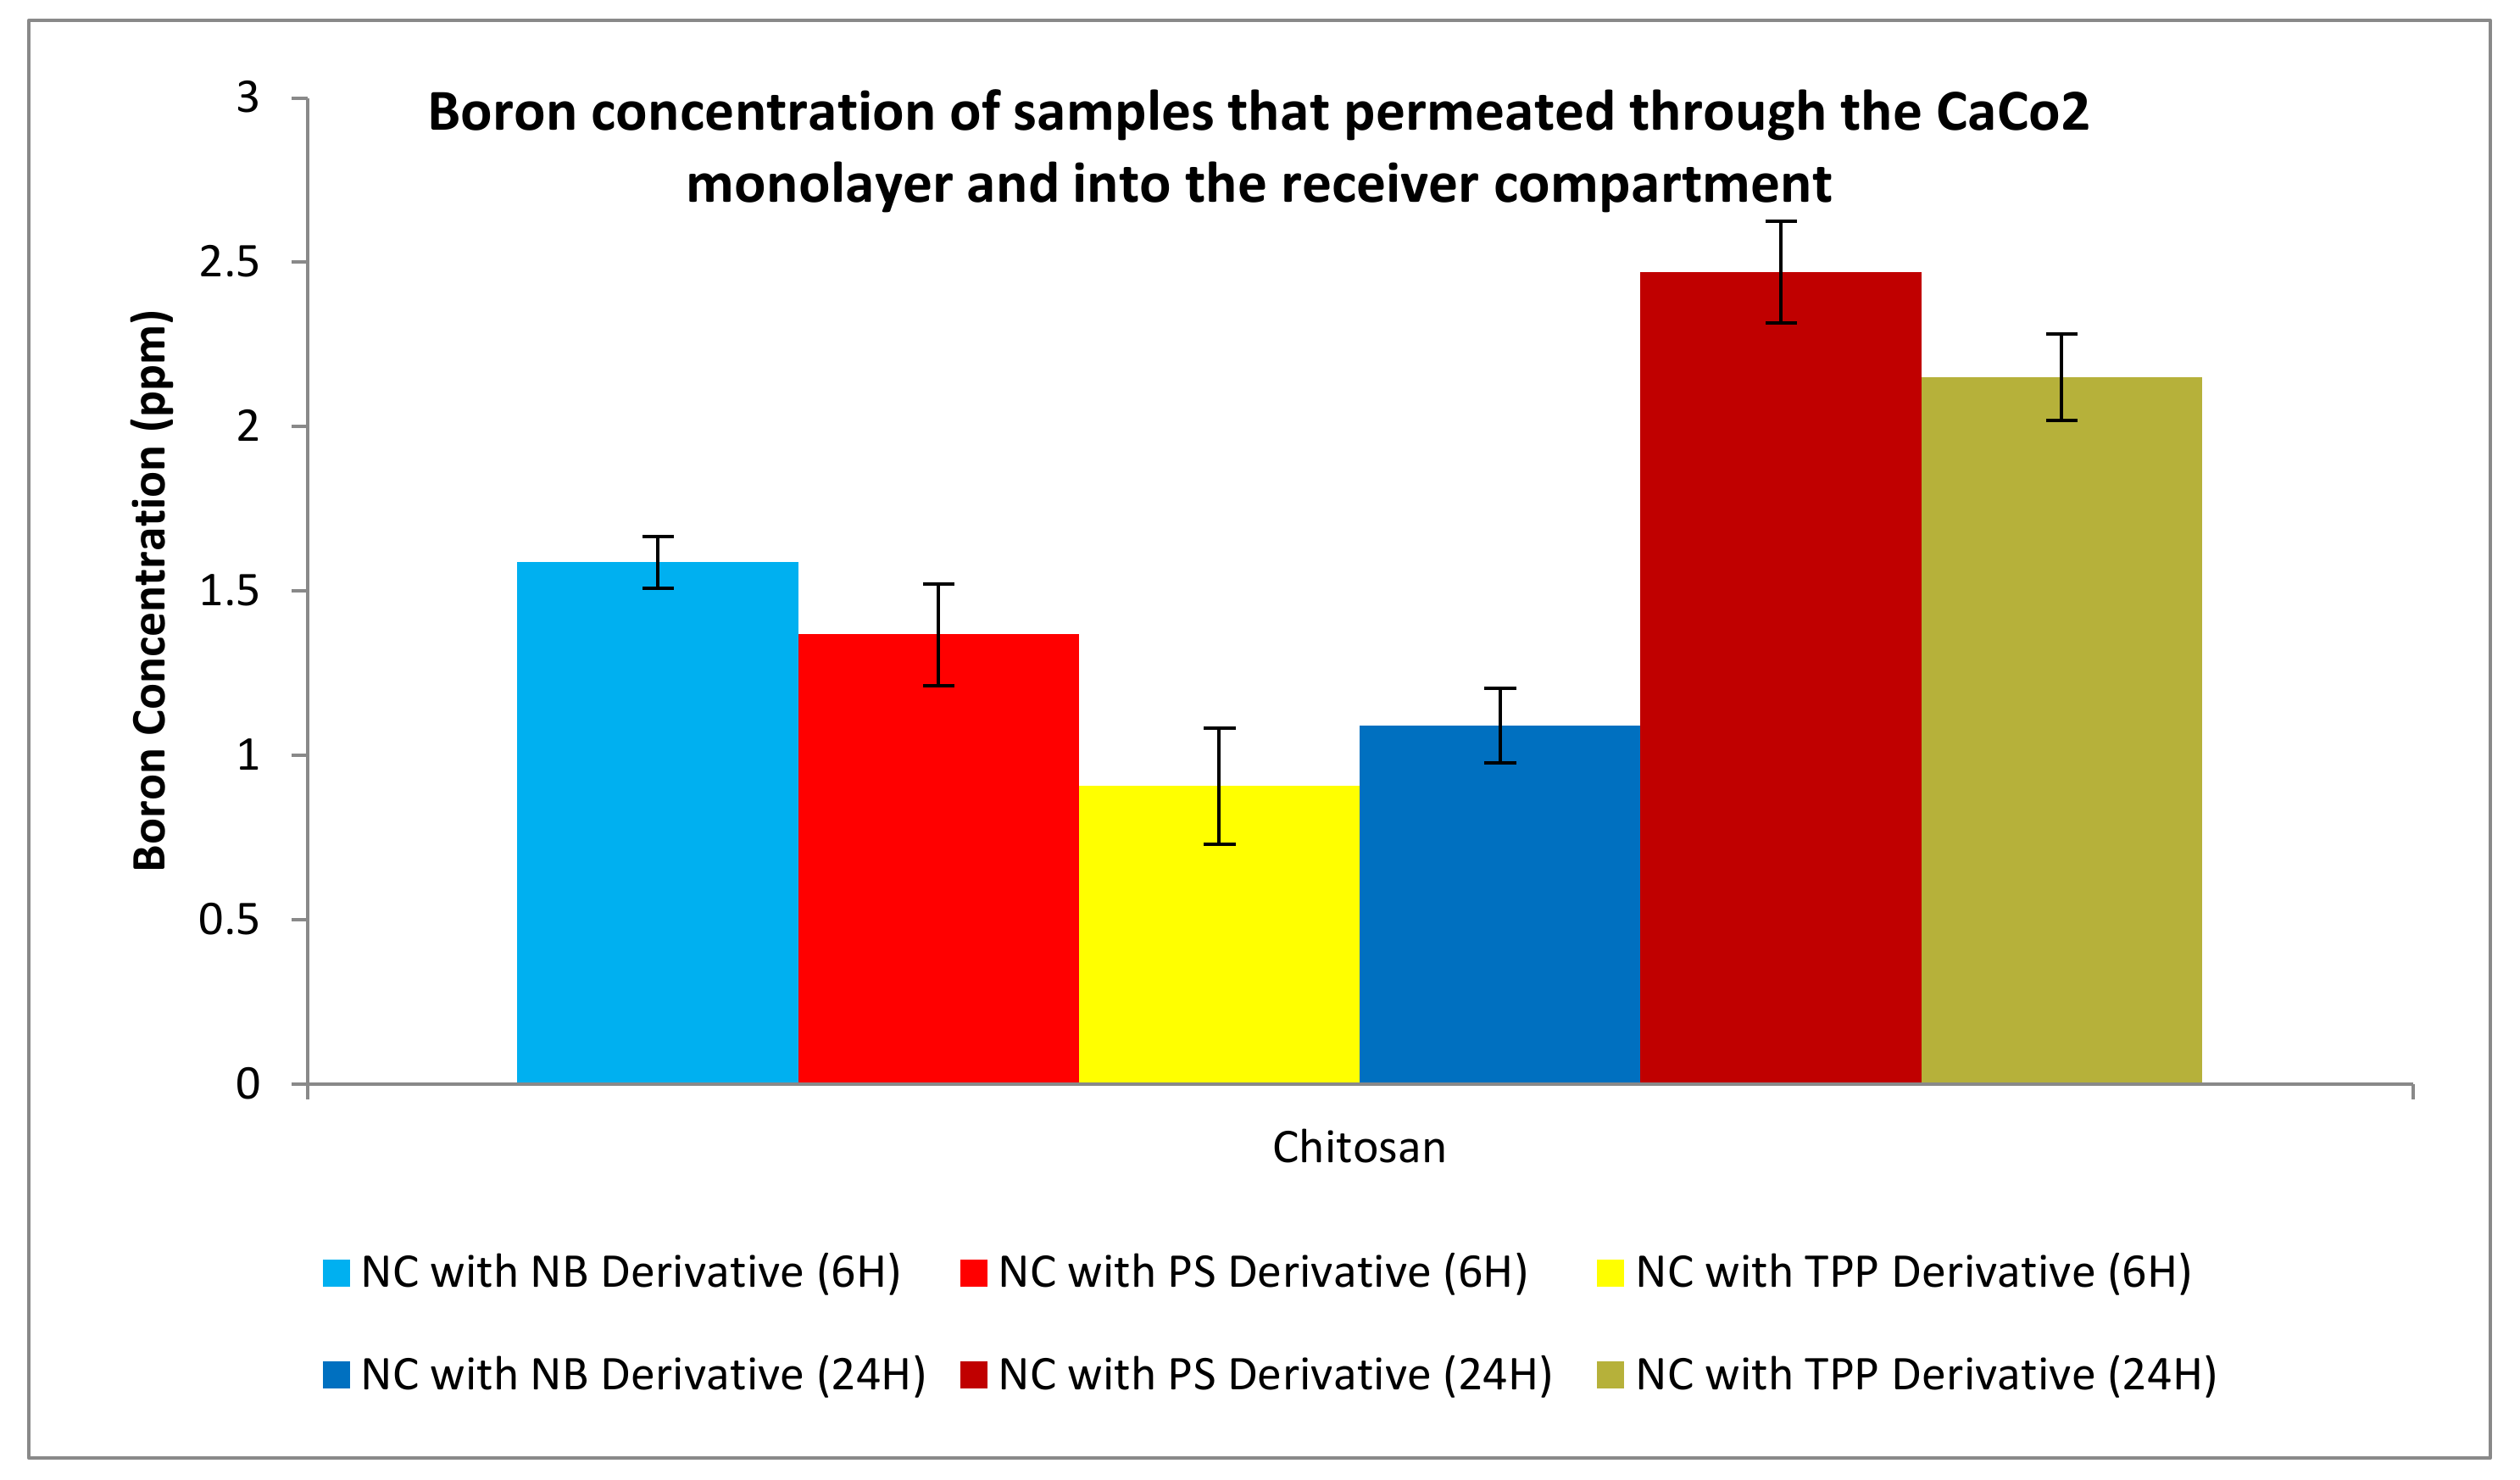
3.3.3. Permeation Studies

Permeation and uptake assays are carried out as part of one assay. First, for permeation, CaCo2 cells are plated onto transwell plates. Once plated, they are allowed to grow to about 80% confluence. The trans-epithelial electrical resistance (TEER) is measured. Readings of between 500 and 600 ohms are obtained; cells are treated with nanoparticle samples. Once these cells are treated with a sample, at different time points cells were lysed and measured via an ICP-MS for boron concentrations, Figure 20 shows that permeation of the nanoparticles occurred through the cellular monolayer and into the receiver compartment.
Figure 21 shows the permeation studies of the PPY-CHIT NC entrapped with the boron derivatives previously mentioned. The results below indicate that an increased amount of boron was taken up into the cells as time passed. This is apparent for all NC preparations except for the Nile blue derivative; the reasoning behind this is that some of the boron may have permeated into the cells, therefore, reducing the amount of boron free within the receiver compartment.

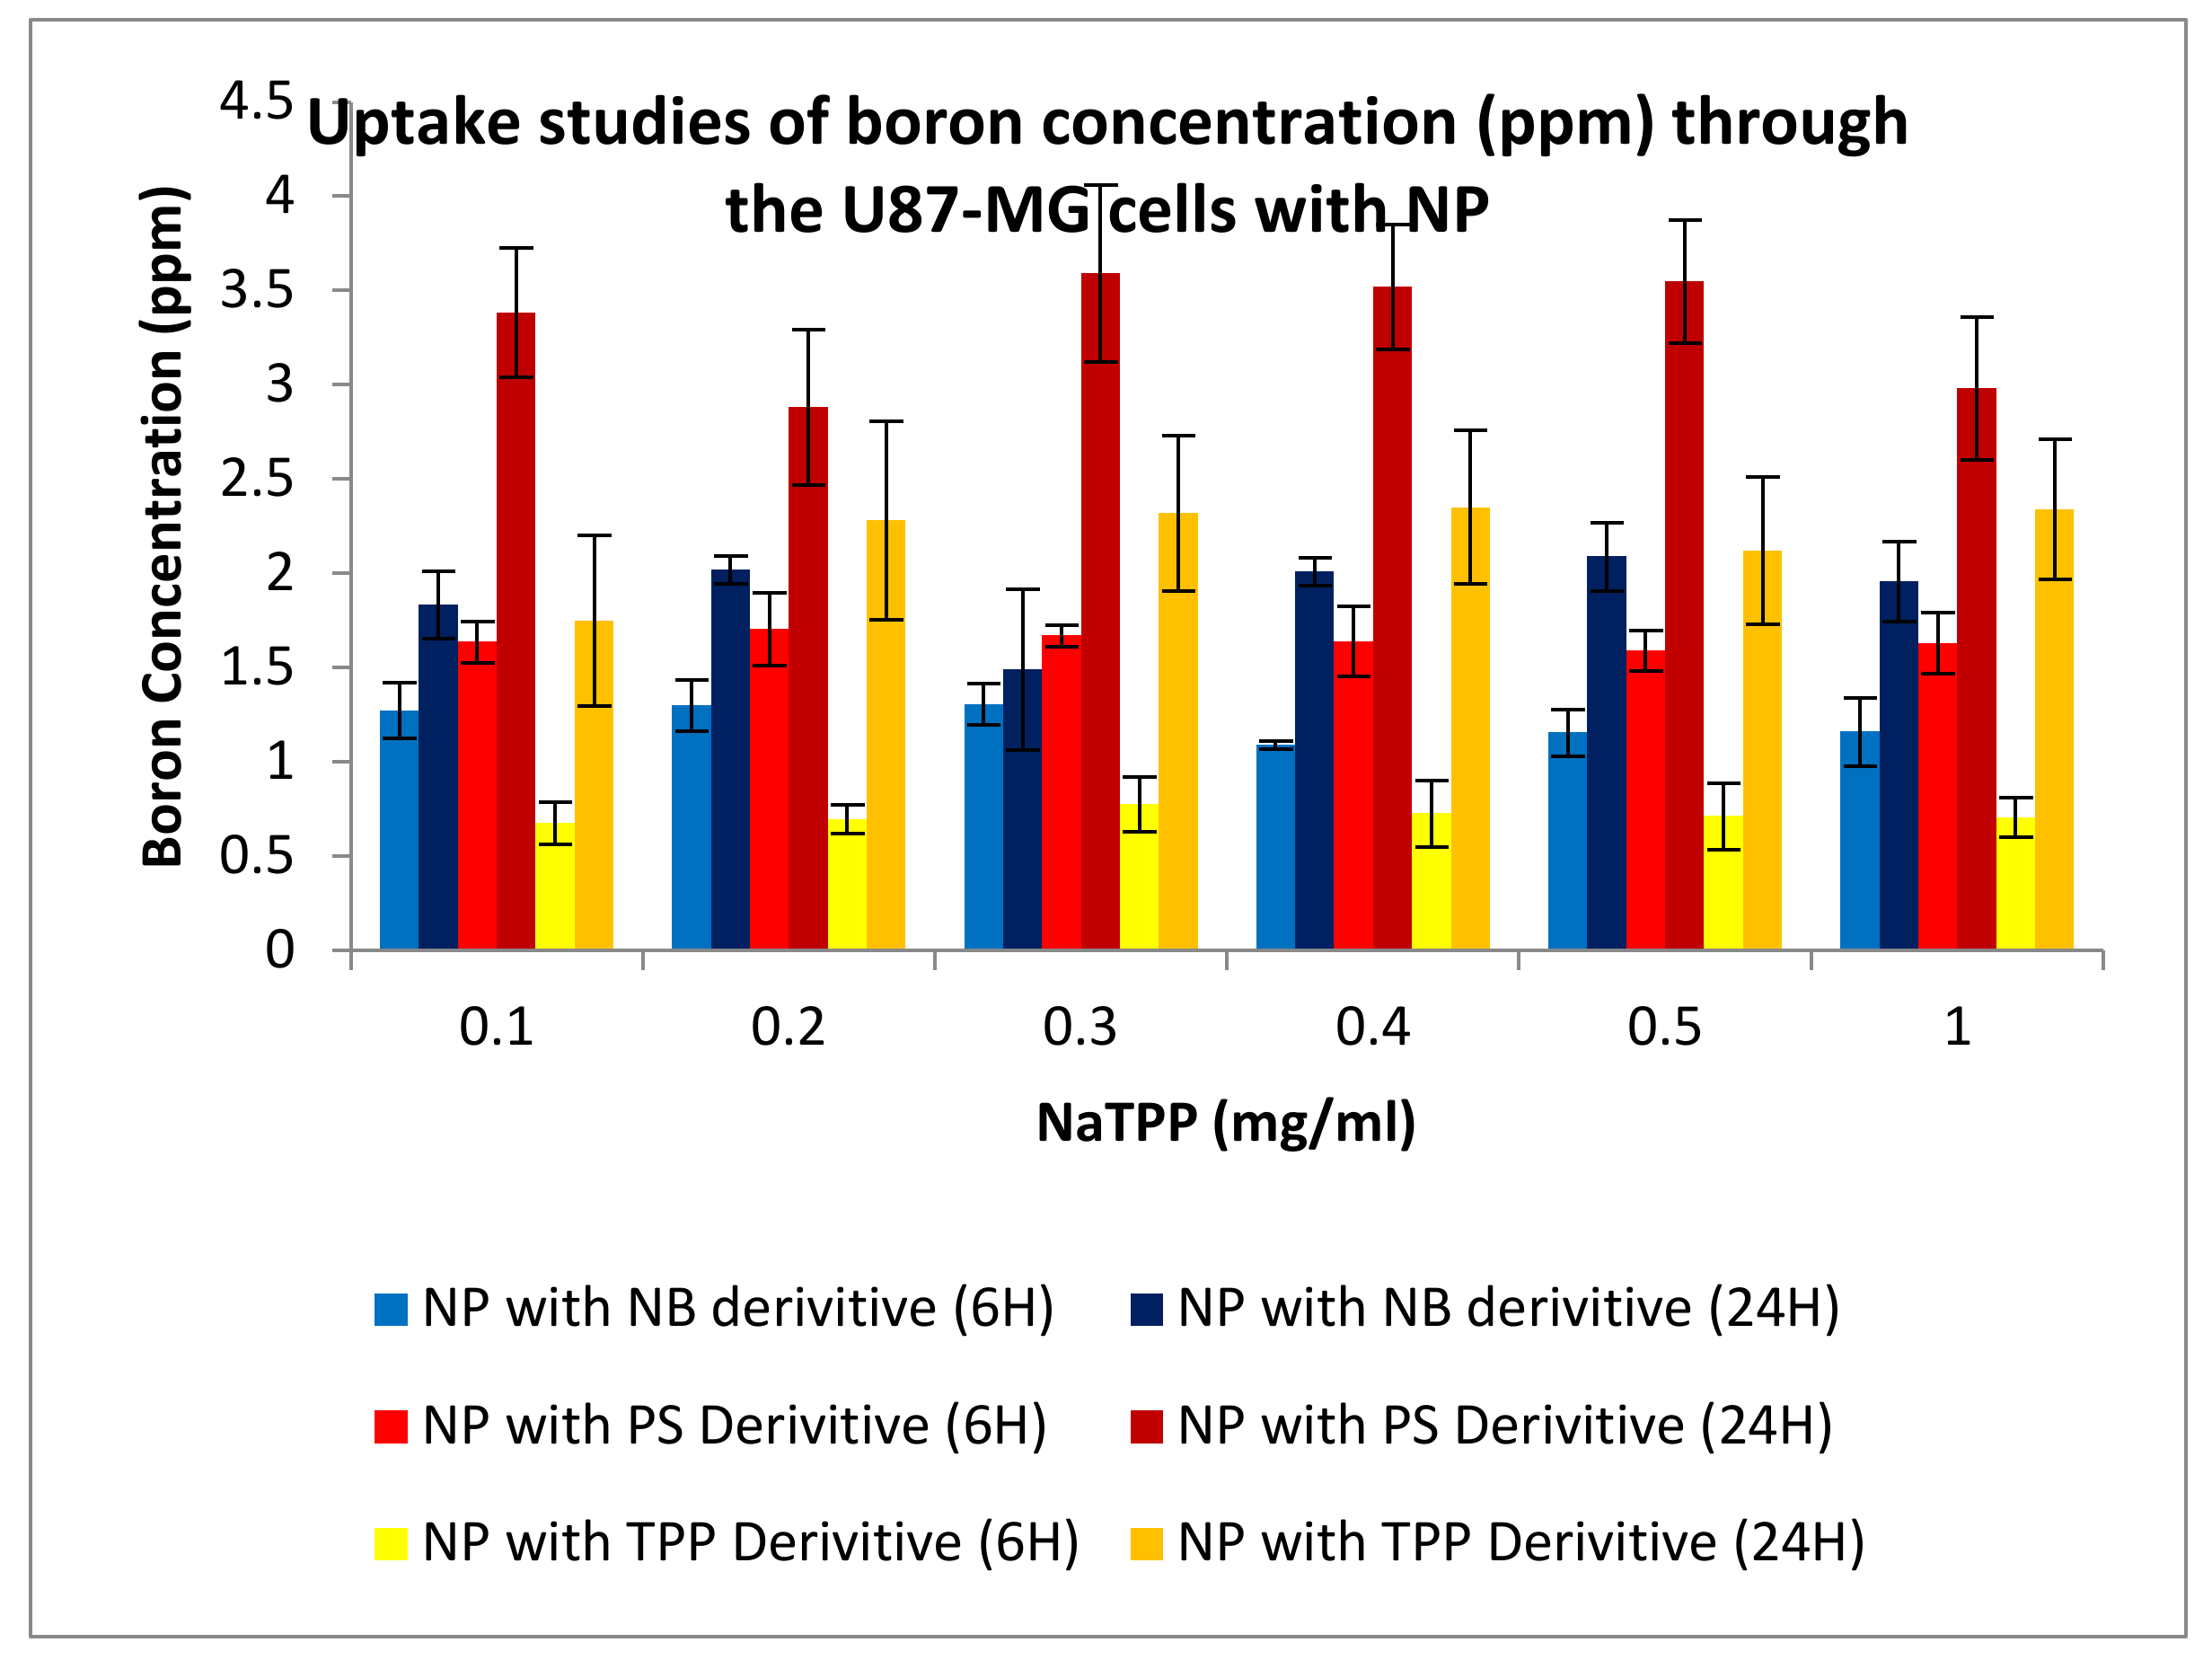
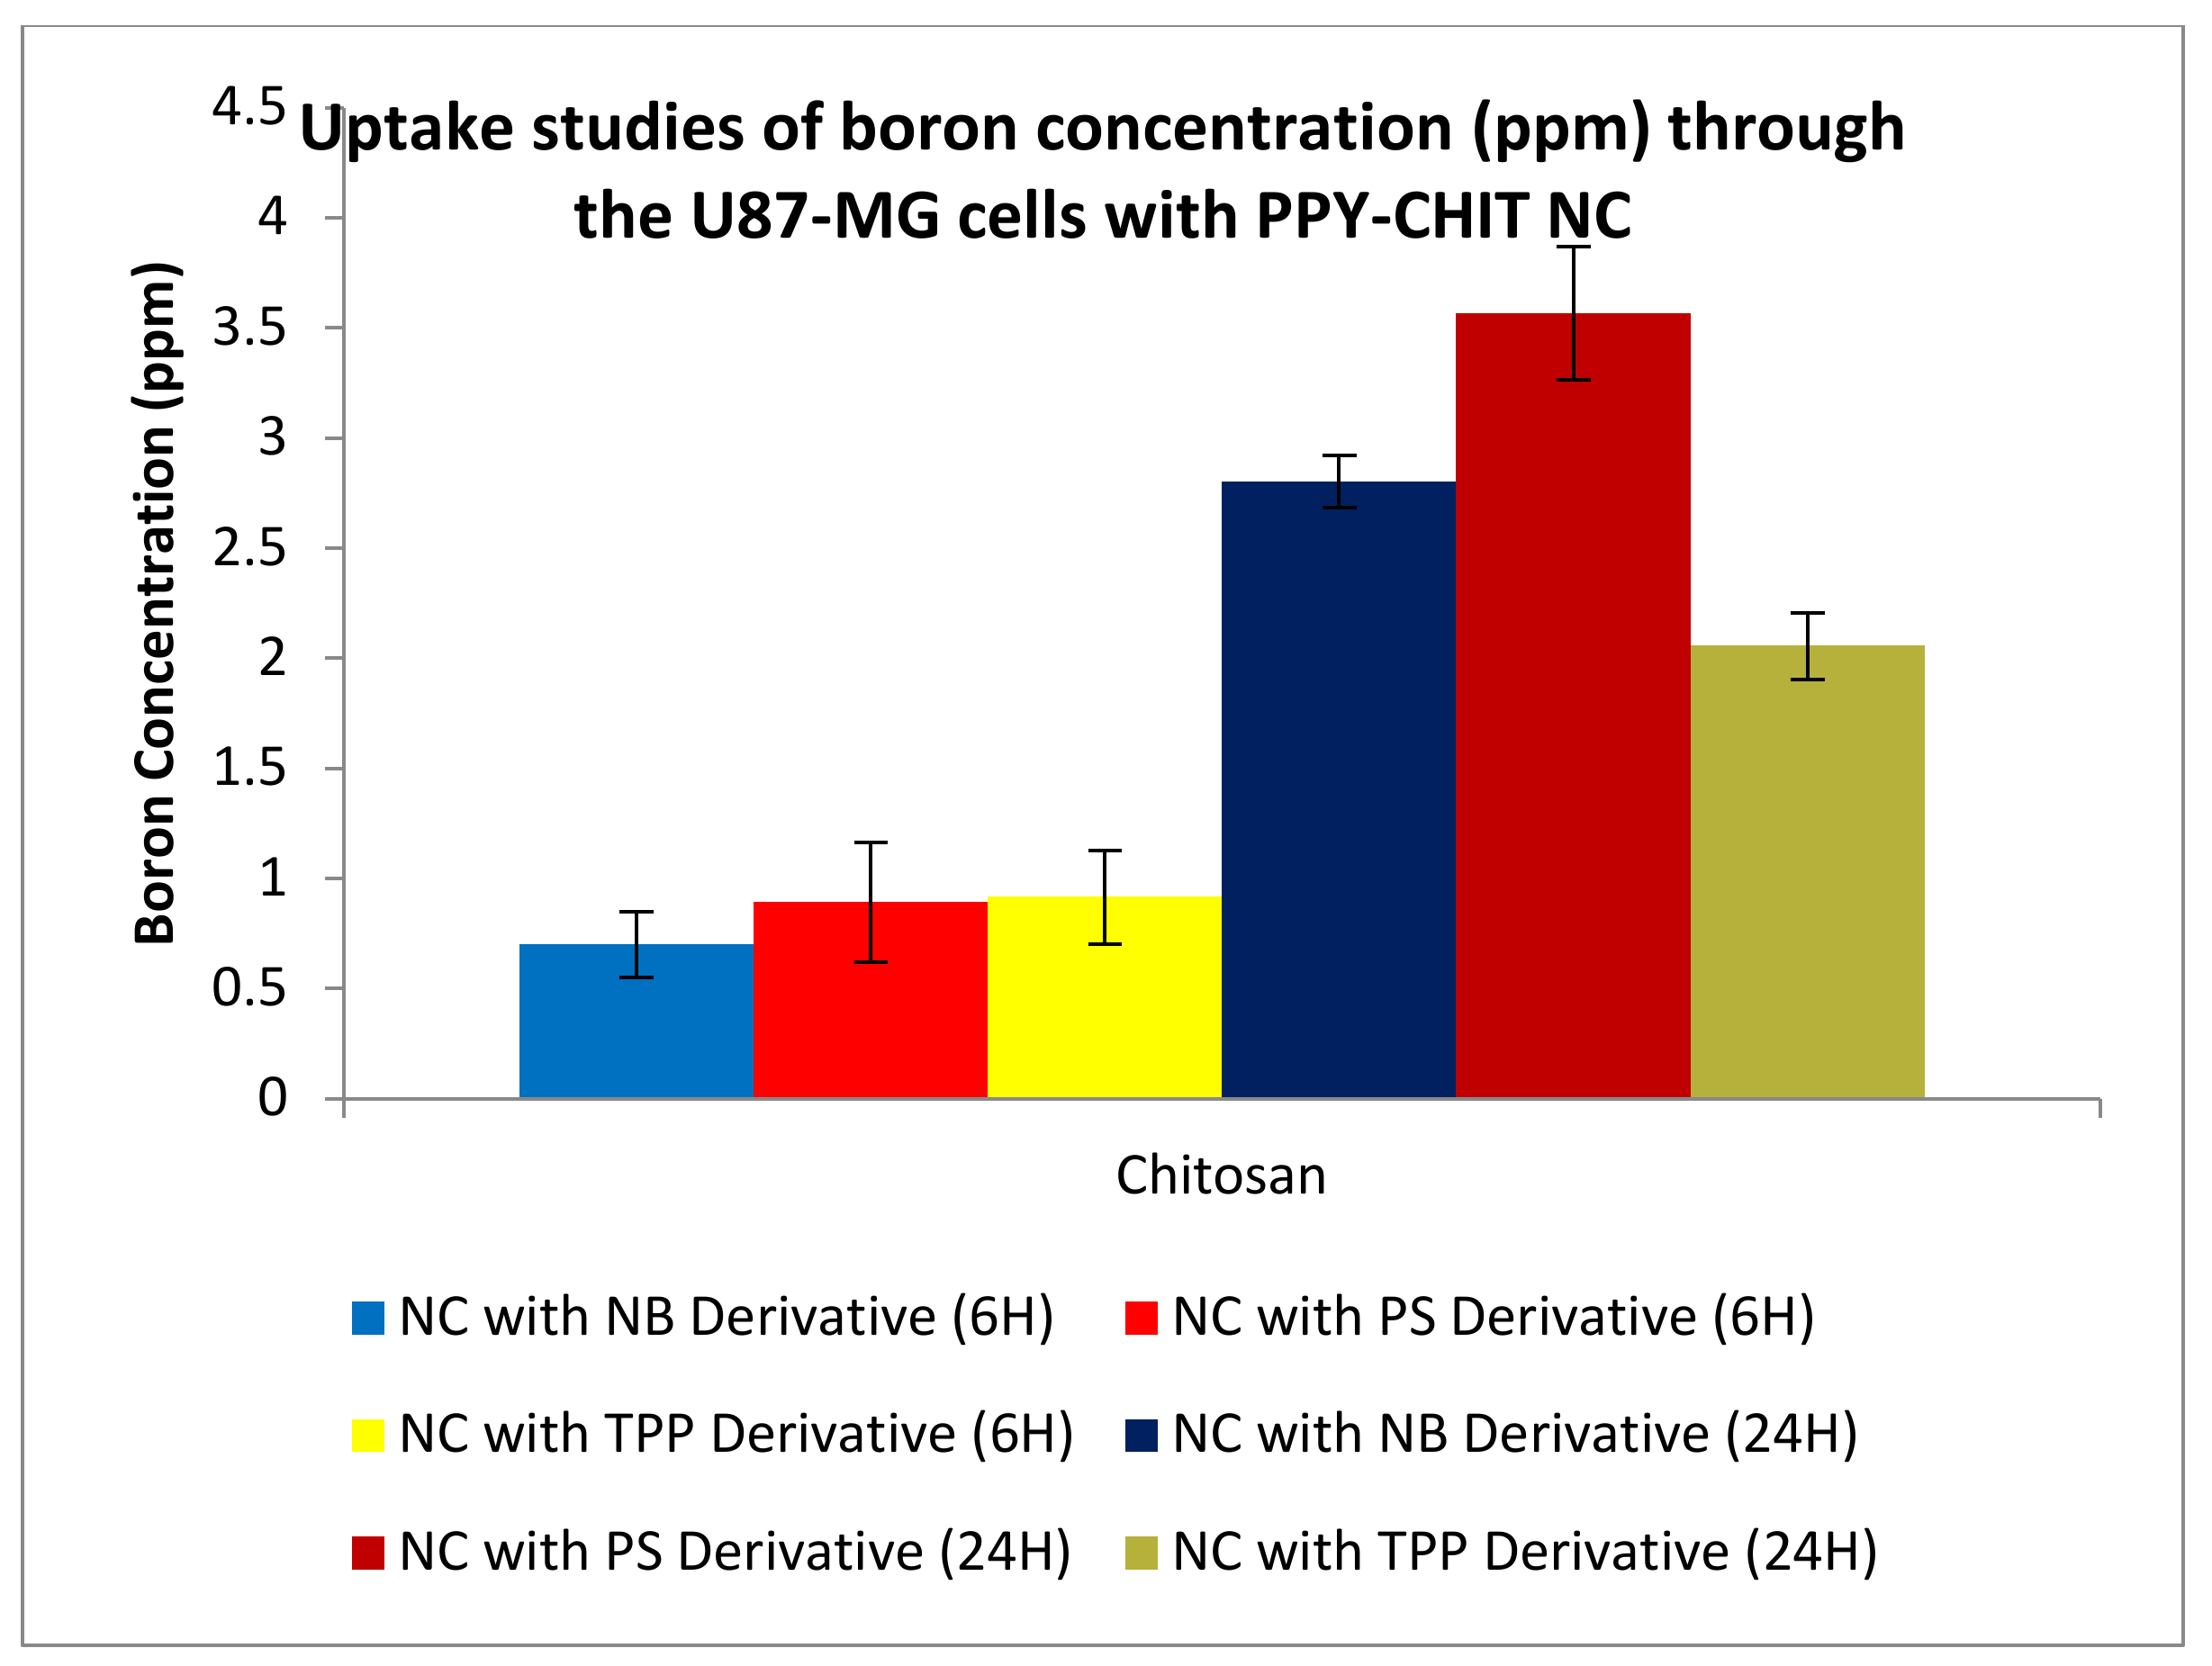
3.3.4. Uptake Studies

Uptake studies were undertaken in conjunction with the permeation studies. U-87 MG cells were plated on a 24 well-plate. These cells were then allowed to grow to a confluence of about 80%. Once this was achieved, the cells were put into the second part of the permeation and uptake assay. Samples were taken at 1, 6 and 24 h to check the amount of boron that was taken up by the cells. Figure 22 and Figure 23 show boron concentrations taken up by the U-87 MG cells after 6 and 24 h.

4. Discussion

The formulation of NP via Ionotropic gelation (IG) was prepared in order to gauge and set a standard set of results for chitosan-centred NP. Chitosan is used as a vehicle due to its capabilities in tumour targeting. In addition, it represents favourable physiochemical characteristics such as being biodegradable, biocompatible, hypoallergenic, FDA-approved, and safe to use. The copolymerisation of chitosan with polypyrrole was also introduced in this study; polypyrrole has been shown to have favourable characteristics in terms of safety, stability, high conductivity, and pH-responsive activity releasing the drug at more tumour specific regions [42]. PPy becomes conductive at lower pH values due to the protonation of the amine group, which makes it ideal for targeting cancer regions, as they are known to be lower in pH compared to normal healthy cell environments. This triggers the release of the encapsulated drug, while chitosan acts as a carrier. This formulation, in turn, would have the potential to transform cancer treatments due to overall improvement in treatment efficacy [43].
The size of the PPy-CHIT nanocapsules (NC), with and without pharmacophore, ranged from 440 to 500 nm (Figure 11), with an average encapsulation efficiency of 85%. The decrease, with the NC loaded with pharmacophore vs. non-drug-loaded, may be explained due to the pyrrole forming potential bonds with the boron moieties. This is particularly advantageous, as the smaller sizes are preferred in order to permeate the blood–brain barrier (BBB). The surface charge profiles (Figure 12) for the NC ranged from 37.9 to 39.2 mV for pharmacophore encapsulated NC. The surface charge was slightly lower for non-pharmacophore-loaded NC, giving a value of 37.2 mV, which is expected, as was previously explained.
There are a number of alterations that may be required for the nanodelivery systems to be more effective. The zeta surface charge is an important parameter for nanoparticle delivery through the BBB, as a study showed that highly positive surface charged nanovehicles might cause toxicity to the BBB [44]. Gao et al. [45] and Jallouli et al. [46] showed efficient drug delivery of positively surface charged (above 15 mV) vehicles across the BBB. These results are significant, as brain drug delivery is regulated by multiple factors, including size, shape, hydrophobicity, and surface charge. Having control over these features can help permeate through the BBB and help improve the therapeutic agent’s stability when in circulation [47,48,49]. In addition, the alteration of the size of the nanoparticles is essential in order to infiltrate the blood–brain barrier; this can be achieved through the potential modification of chitosan or polypyrrole. Several studies have shown an inverse correlation between the nanoparticle size and the BBB penetration [50,51,52]. The smaller the nanoparticles, the higher the penetration of the nanovehicle through the BBB. Furthermore, the shape of the nanovehicles influences the body distribution and cellular uptake [53].
Over the years, DLCs have been known to accumulate selectively at a higher rate in tumour cells [15] because mitochondria of tumour cells present a higher transmembrane potential than healthy ones. The positive surface charge of DLCs in combination with their lipophilicity allows for diffusion of DLCs at a higher rate into cancer cells. This can be favourably used to promote the selective accumulation of therapeutic amounts of boron into cancer cells [22]. In this study, three carboranyl DLCs: (3-carboranylpropyl) (triphenyl phosphonium) bromide (2), (3-carboranylpropyl) (N9,N9-diethyl-9H-benzo[a]phenoxazine-5,9-diamine) bromide (4), and (3-carboranylpropyl) (3,7-diamino-5-phenylphenazin-5-ium) bromide (6) were successfully synthesized and characterized. Results indicated promising signs of the accumulation of these compounds towards both CaCo2 and U-87 MG cell lines.
When performing release studies, three pH environments are used to assess the validity and suitability of these nanovehicles to selectively target tumour cells. The chosen pH values are pH 7.4 (mimicking the pH of the blood), pH 6.5 (pH of normal cells), and pH 5.5 (mimicking a tumour microenvironment). In addition, we compared the formulation of chitosan NP vs. PPy-CHIT NC. Results from Figure 12 show a clear difference in release profiles and indicate that the addition of polypyrrole has had a significant effect on the release profiles of the pharmacophore entrapped within the nanovehicle. Other pharmacophore-loaded NC show a similar trend in terms of release, with delayed release of entrapped drug at pH 6.5 and to a longer extent at pH 7.4. In most cases, it took between three to four hours for the drug to release in the higher pH values, compared to the immediate release shown via the IG formulation that is significantly better.
Furthermore, the release at 5.5 was immediate in the PPy-CHIT formulation due to two factors. First, the protonation that may have occurred at the amine terminal of the pyrrole may have allowed the vehicle to expand and hence allow for drug release through the pyrrole layers. Secondly, complete disintegration of NC may have occurred over time, causing the release of drug entrapped. The delay in release allowed for around 20–30% of the drug to be released after 24 h at pH 6.5 and 7.4 for all PPy-CHIT formulations. This is significantly lower than IG, whereby almost all drug within the nanoparticle is released. Finally, statistical analysis was performed on the release profile to compare the rates at which the drug was released from the second formulation as opposed to formulation via IG and values <0.01 were obtained consistently, showing that there is a significant difference between the two formulations in release time of the encapsulated compounds.
Regarding their synthesis, the three new boronated DLCs produced high yields, averaging between 73% and 78%. All spectroscopic characterisation data indicate that the new chemical entities were successfully synthesised. Additionally, the increasing difficulties in purchasing carboranes in the UK have been overcome by the adopted synthetic strategy, which forms the carboranyl cage in situ.
Preliminary in vitro evaluation consisted of uptake and toxicological studies. For the uptake studies, compounds 2 and 6 had an uptake of boron into CaCo2 cells after 24 h of 0.6 ppm. Conversely, compound 4 presented an uptake of 1.65 ppm. Comparison of boron accumulation with the control indicates a 20-fold increase in boron concentration into cancer cells compared to control. Similarly, the DLC-synthesized compounds showed an improved uptake potential on U-87 MG cells. These results confirm the high efficiency of DLC dyes in promoting the accumulation of boron into cancer cells. DLCs cause minimal variations in free energy change when crossing biological membranes, hence affording the diffusion of the boronated dye through the plasma membrane and into the cells.
As revealed in Figure 20, Figure 21, Figure 22 and Figure 23, nanovehicles showed the capability to permeate through the cellular monolayer. Boron levels obtained showed that after 6 h of testing, around 1.5, 1.4, and 1 ppm of boron had been able to permeate the cell using compound 2, 4, and 6 derivatives, respectively. After 24 h, there was a significant increase in permeation, as expected, with 2.5, 2.7, and 2.3 ppm of boron able to permeate the cellular monolayer for each compound, respectively. This is expected due to the increase in time, allowing more boron to enter the receiver compartment. These results have indicated that the NP delivery system is capable of permeating a cellular monolayer.
Uptake studies were undertaken in conjunction with the permeation studies. U-87 MG cells were plated on a 24 well-plate and were then allowed to grow to a confluence of about 80%. Once this was achieved, the cells were put into the second part of the permeation and uptake assay. Samples were taken at 1, 6, and 24 h to check the amount of boron that was taken up by the cells. The result would then indicate how many nanoparticles have permeated the cell monolayer of CaCo2 and gone to the basolateral compartment. The results below show graphs of formulation made against boron taken up into cells (ppm). Figure 22 and Figure 23 show uptake of boron measured on U-87 MG cells, with results indicating greater amounts of boron were taken up by cells over time. Boron uptake was also measured using an ICP-MS, after 6 h boron uptake registering 1.3, 1.7, and 0.7 ppm for the compounds 2, 4, and 6 derivatives, respectively. The boron uptake into cells increased on average 2-fold after 24 h, indicating the effectiveness of these vehicles to not only permeate the cellular monolayer but also to deliver boron to cancer cells.
A similar trend could be seen for the PPy-CHIT NC preparations, shown in Figure 22. The permeation and uptake studies were repeated five times with an average boron concentration calculated from those five separate assays. The neutral red assay examined post-treatment the integrity of the cytoplasm of the cell. The cytoplasm is integral to the cell as it fills each cell enclosed within the cell membrane; they include all the material inside and outside the nucleus. The integrity of the cytoplasm allows for all the processes within the cell to occur. Once this scaffold is broken, the cell’s integrity is compromised, and hence the cell is lysed. The positive control used was actinomycin-D, which inhibits transcription within the cell, killing it and giving it a low absorbance. The higher the absorbance values, the healthier the cell appears; this suggests that the cytoplasm could store a higher amount of neutral red dye. When tested on the CaCo2 and U-87 MG cell lines (Figure 19), the synthesized carboranyl DLCs showed a marked difference in cell health, therefore giving high absorbance values. This indicated that these compounds were nontoxic and suitable for use in the BNCT of tumours.

5. Conclusions

Brain tumours are difficult to treat not only due to their invasiveness but also due to the presence of the BBB. The brain is well protected by the BBB, preventing 95% of small and 100% of large molecules from entering and making the delivery of active pharmaceuticals a challenging and arduous task. Therefore, the delivery of drugs using innovative transport systems is needed. This research has found that copolymerization of chitosan with polypyrrole formulated into nanovehicles has the potential to form small nancomposites that can permeate a tight cellular monolayer. When combined with boron derivatives, they have also shown to be selective in the delivery and successful in the uptake into cells, giving them the potential to be a suitable combination for successful therapy.
BNCT is a therapeutic approach that can selectively destroy tumour cells without causing permanent, irreparable damage to the healthy, surrounding ones. In order to achieve the therapeutical outcome, selectively tagging boron to tumour cells is of paramount importance.
Polypyrrole and chitosan were used for their favourable properties; they are biocompatible, biodegradable, nontoxic and have good carrier properties. This study has shown that chitosan formulated NP and PPy-CHIT NC are capable of encapsulating a suitable boron pharmacophore at high efficiency. The formulation of chitosan in conjunction with PPy has shown the ability not only to be nontoxic but also beneficial in targeting tumour-like environments, as can be seen in the release studies comparing the two formulations. This is significant as selective drug delivery to the target site is essential for effective delivery to tumour tissue. IG formulated nanoparticles had no trend in varying pH values; this meant that the nanovehicles, although released gradually, do release the drug as soon as it is in the system. These results were nonbeneficial, as a delayed release of the drug was desired in order for the drug to be released once the vehicle reached the potential target site. Delayed release of the drug would also mean a reduced likelihood of toxicity occurring to potential patients. PPy allowed delayed release as the amine group present on the polypyrrole, at low pH values, protonates, enhancing conductivity. This would indicate that when the nanovehicle enter the tumour micro-environment (pH 5.5), it would preferentially release the drug load once at the target site.
In terms of preliminary cell work, for the toxicology assay, the nanovehicles showed positive results, with minor toxic effects occurring onto both the CaCo2 and U87-MG cell lines. The permeation and uptake studies assay indicated that both nanodelivery systems permeated through the cellular monolayer; therefore, boron was taken up by the U87-MG cells present. These results are promising as they validate the suggestion that the nanoparticles allow the drug within the nanovehicle to be released once permeated through the monolayer. This study also reported new boronated agents, which were fully characterized by spectroscopic techniques. Preliminary in vitro studies supported by boron quantification with ICP-MS have shown that these compounds are capable of accumulating therapeutically relevant concentrations of boron into tumour cells while presenting suitable toxicological profiles. All reported compounds and nanoformulations appear to be promising for future

Author Contributions

A.D. contributed in terms of investigation, writing (original draft) and visualization. R.G.A. contributed in terms of writing (review & editing) and supervision. G.C. contributed in terms of conceptualization, writing (review & editing), project administration and supervision. All authors have read and agreed to the published version of the manuscript.

Funding

This research received no external funding.

Institutional Review Board Statement

Not applicable.

Informed Consent Statement

Not applicable.

Data Availability Statement

The data presented in this study are available on request from the corresponding author.

Conflicts of Interest

The authors declare no conflict of interest.

References

  1. Brain Basics: Know Your Brain, National Institute of Neurological Disorders and Stroke. 2018. Available online: https://www.ninds.nih.gov/Disorders/Patient-Caregiver-Education/Know-Your-Brain (accessed on 14 October 2020).
  2. Aiello, L.C.; Wheeler, P. The Expensive-Tissue Hypothesis: The Brain and the Digestive System in Human and Primate Evolution. Curr. Anthropol. 1995, 36, 199–221. [Google Scholar] [CrossRef]
  3. Pakkenberg, B.; Gundersen, H.J. Neo-cortical neuron number in humans: Effect of sex and age. J. Comp. Neurol. 1997, 384, 312–320. [Google Scholar] [CrossRef]
  4. Mayer, F.; Mayer, N.; Chinn, L.; Pinsonneault, R.L.; Kroetz, D.; Bainton, R.J. Evolutionary conservation of vertebrate blood–brain barrier chemo-protective mechanisms in drosophila. J. Neurosci. 2009, 29, 3538–3550. [Google Scholar] [CrossRef]
  5. Harati, R.; Villégier, A.-S.; Banks, W.A.; Mabondzo, A. Susceptibility of juvenile and adult blood–brain barrier to endothelin-1: Regulation of P-glycoprotein and breast cancer resistance protein expression and transport activity. J. Neuroinflamm. 2012, 9, 273–288. [Google Scholar] [CrossRef] [Green Version]
  6. Luissint, A.C.; Artus, C.; Glacial, F.; Ganeshamoorthy, K.; Couraud, P.O. Tight junctions at the blood brain barrier: Physiological architecture and disease associated dysregulation, fluids barriers. Fluids Barriers CNS 2012, 9, 23–34. [Google Scholar] [CrossRef] [Green Version]
  7. Stamatovic, S.M.; Johnson, A.M.; Keep, R.F.; Andjelkovic, A.V. Junctional proteins of the blood-brain barrier: New insights into function and dysfunction. Tissue Barriers 2016, 4, 1154641–1154652. [Google Scholar] [CrossRef] [Green Version]
  8. Zheng, W.; Aschner, M.; Ghersi-Egea, J.F. Brain barrier systems: A new frontier in metal neuro-toxicological research. Toxicol. Appl. Pharmacol. 2003, 192, 1–11. [Google Scholar] [CrossRef] [Green Version]
  9. The Brain Tumour Society. Statistics for Brain Tumours in UK. 2018. Available online: https://www.thebraintumourcharity.org/get-involved/why-we-need-your-support/the-statistics-about-brain-tumours/ (accessed on 29 May 2020).
  10. Steliarova-Foucher, E.; O’Callaghan, M.; Ferlay, J.; Masuyer, E.; Rosso, S.; Forman, D.; Bray, F.; Comber, H. European Cancer Observatory: Cancer Incidence, Mortality, Prevalence and Survival in Europe. Eur. J. Cancer 2015, 51, 1131–1143. [Google Scholar] [CrossRef]
  11. Ostrom, Q.T. Brain Tumour Statistics. 2014. Available online: http://www.abta.org/about-us/news/brain-tumor-statistics/ (accessed on 29 May 2020).
  12. Visser, O.; Ardanaz, E.; Botta, L.; Sant, M.; Tavilla, A.; Minicozzi, P. Survival of adults with primary malignant brain tumours in Europe: Results of the EUROCARE-5 study. Eur. J. Cancer 2015, 51, 2231–2241. [Google Scholar] [CrossRef]
  13. The Brain Tumour Charity, Brain Tumour Prognosis. 2018. Available online: https://www.thebraintumourcharity.org/understanding-brain-tumours/getting-a-diagnosis/prognosis/prognosis-specific-brain-tumours/ (accessed on 14 October 2020).
  14. Treating a Malignant Brain Tumour. 2015. Available online: http://www.nhs.uk/Conditions/brain-tumour-malignant/Pages/Treatment.aspx (accessed on 29 May 2020).
  15. Sotiropoulou, P.A.; Christodoulou, M.S.; Silvani, A.; Herold-Mende, C.; Passarella, D. Chemical approaches to targeting drug resistance in cancer stem cells. Drug Discov. Today 2014, 19, 1547–1562. [Google Scholar] [CrossRef]
  16. Alifieris, C.; Trafalis, D.T. Glioblastoma multiforme: Pathogenesis and treatment. Pharmacol. Ther. 2015, 152, 63–82. [Google Scholar] [CrossRef]
  17. Lathia, J.D.; Mack, S.C.; Mulkearns-Hubert, E.E.; Valentim, C.L.; Rich, J.N. Cancer stem cells in glioblastoma. Genes Dev. 2015, 29, 1203–1217. [Google Scholar] [CrossRef] [Green Version]
  18. Calabrese, G.; Gomes, A.; Barbu, E.; Nevell, T.G.; Tsibouklis, J. Carborane-based derivatives of delocalised lipophilic cations for boron neutron capture therapy: Synthesis and preliminary in vitro evaluation. J. Mater. Chem. 2008, 18, 4864–4871. [Google Scholar] [CrossRef]
  19. Yu, Z.; Pestell, T.G.; Lisanti, M.P.; Pestell, R.G. Cancer Stem Cells. Int. J. Biochem. Cell Biol. 2012, 44, 2144–2151. [Google Scholar] [CrossRef] [Green Version]
  20. Gianpiero, C.; Anis, D.; Aikaterini, R.; Eirini, T.; Ioannis, V.S.; Dimitrios, F.G.; John, T. Boron-containing delocalised lipophilic cations for the selective targeting of cancer cells. Med. Chem. Commun. 2017, 8, 67–72. [Google Scholar] [CrossRef] [Green Version]
  21. Sauerwein, W. Principles and history of neutron capture therapy. Strahlenther. Onkol. 1993, 169, 1–6. [Google Scholar]
  22. Raju, M.R. Particle radiotherapy: Historical developments and current status. Radiat. Res. 1996, 145, 391–407. [Google Scholar] [CrossRef]
  23. Davis, M.A.; Little, J.B. Relative biological effectiveness of the 10B (n, α) 7Li reaction in HeLa cells. Radiat. Res. 1970, 43, 534–553. [Google Scholar] [CrossRef]
  24. Schiffer, D.; Cavalla, P.; Pilkington, G.J. Brain Tumour Invasion: Biological, Clinical and Therapeutic Considerations; Mikkelsen, T., Bjerkvig, R., Laerum, O.D., Rosenbaum, M.L., Eds.; Wiley-Liss: New York, NY, USA, 1998; pp. 161–184. [Google Scholar]
  25. Yamamoto, T.; Nakai, K.; Kageji, T.; Kumada, H.; Endo, K.; Matsuda, M.; Shibata, Y.; Matsumura, A. Boron neutron capture therapy for newly diagnosed glioblastoma. Radiother. Oncol. 2009, 91, 80–84. [Google Scholar] [CrossRef] [Green Version]
  26. Don, A.S.; Hogg, P.J. Mitochondria as cancer drug targets. Trends Mol. Med. 2004, 10, 372–378. [Google Scholar] [CrossRef]
  27. Weissig, V.; Cheng, S.M.; D’Souza, G.G. Mitochondrial pharmaceutics. Mitochondrion 2004, 3, 229–244. [Google Scholar] [CrossRef]
  28. Talegaonkar, S.; Mishra, P.R. Intranasal delivery: An approach to bypass the blood brain barrier. Indian J. Pharmacol. 2004, 36, 140–147. [Google Scholar]
  29. Illum, L. Nasal drug delivery—Possibilities, problems and solutions. J. Control. Release 2003, 87, 187–198. [Google Scholar] [CrossRef]
  30. Djupesland, P.G.; Messina, J.C.; Mahmoud, R.A. The nasal approach to delivering treatment for brain diseases: An anatomic, physiologic and delivery technology overview. Ther. Deliv. 2014, 5, 709–733. [Google Scholar] [CrossRef] [Green Version]
  31. Welch, M.J.; Hawker, C.J.; Wooley, K.L. The advantages of nanoparticles for PET. J. Nucl. Med. 2009, 50, 1743–1746. [Google Scholar] [CrossRef] [PubMed] [Green Version]
  32. Akagi, T.; Matsusaki, M.; Akashi, M. Pharmaceutical and Medical Applications of Poly-Gamma-Glutamic Acid. Amino-Acid Homopolym. Occur. Nat. 2010, 15, 119–153. [Google Scholar]
  33. Wu, Y.; Yang, W.; Wang, C.; Hu, J.; Fu, S. Chitosan nanoparticles as a novel drug delivery system for ammonium glycyrrhizinate. Int. J. Pharm. 2005, 295, 235–245. [Google Scholar] [CrossRef] [PubMed]
  34. Malmo, J.; Sandvig, A.; Vårum, K.M.; Strand, S.P. Nanoparticle mediated P-glycoprotein silencing for improved drug delivery across the blood-brain barrier: A siRNA-chitosan approach. PLoS ONE 2013, 81, e54182. [Google Scholar] [CrossRef] [PubMed] [Green Version]
  35. Garcia-Valdez, O.; Champagne-Hartley, R.; Saldivar-Guerra, E.; Champagne, P.; Cunningham, M.F. Modification of chitosan with polystyrene and poly (n-butyl acrylate) via nitroxide-mediated polymerization and grafting from approach in homogeneous media. Polym. Chem. 2015, 6, 2827–2836. [Google Scholar] [CrossRef]
  36. Singh, R.; Lillard, J.W. Nanoparticle-based targeted drug delivery. Exp. Mol. Pathol. 2009, 86, 215–223. [Google Scholar] [CrossRef] [Green Version]
  37. Elgadir, M.A.; Uddin, M.S.; Ferdosh, S.; Adam, A.; Chowdhury, A.J.; Sarker, M.Z. Impact of chitosan composites and chitosan nanoparticle composites on various drug delivery Systems: A review. J. Food Drug Anal. 2015, 23, 619–629. [Google Scholar] [CrossRef] [PubMed] [Green Version]
  38. Mitra, A.; Dey, B. Chitosan microspheres in novel drug delivery systems. Indian J. Pharm. Sci. 2011, 73, 355. [Google Scholar] [PubMed]
  39. Ramya, R.; Jayachandran, V.; Kwon, K.S.; Sudha, P.N. Biomedical Applications of Chitosan: An Overview. J. Biomater. Tissue Eng. 2012, 2, 100–111. [Google Scholar] [CrossRef]
  40. Pillay, V.; Tsai, T.S.; Choonara, Y.E.; du Toit, L.C.; Kumar, P.; Modi, G.; Naidoo, D.; Tomar, L.K.; Tyagi, C.; Ndesendo, V.M. A review of integrating electroactive polymers as responsive systems for specialized drug delivery applications. J. Biomed. Mater. Res. Part A 2014, 102, 2039–2054. [Google Scholar] [CrossRef] [PubMed]
  41. Uppalapati, D.; Boyd, B.J.; Garg, S.; Travas-Sejdic, J.; Svirskis, D. Conducting polymers with defined micro- or nanostructures for drug delivery. Biomaterials 2016, 111, 149–162. [Google Scholar] [CrossRef]
  42. Lu, X.; Chao, D.; Chen, J.; Zhang, W.; Wei, Y. Preparation and characterization of inorganic/organic hybrid nanocomposites based on Au nanoparticles and polypyrrole. Mater. Lett. 2006, 60, 2851–2854. [Google Scholar] [CrossRef]
  43. Cheng, D.; Xia, H.; Chan, H.S.O. Facile Fabrication of AgCl@Polypyrrole-Chitosan Core-Shell Nanoparticles and Polymeric Hollow Nanospheres. Langmuir 2004, 20, 9909–9912. [Google Scholar] [CrossRef]
  44. Lockman, P.R.; Koziara, J.M.; Mumper, R.J.; Allen, D.D. Nanoparticle surface surface charges alter blood–brain barrier integrity and permeability. J. Drug Target. 2004, 12, 635–641. [Google Scholar] [CrossRef]
  45. Gao, X.; Qian, J.; Zheng, S.; Changyi, Y.; Zhang, J.; Ju, S. Overcoming the blood–brain barrier for delivering drugs into the brain by using adenosine receptor nano-agonist. ACS Nano 2014, 8, 3678–3689. [Google Scholar] [CrossRef]
  46. Jallouli, Y.; Paillard, A.; Chang, J.; Sevin, E.; Betbeder, D. Influence of surface surface charge and inner composition of porous nanoparticles to cross blood–brain barrier in vitro. Int. J. Pharm. 2007, 344, 103–109. [Google Scholar] [CrossRef]
  47. Goldsmith, M.; Abramovitz, L.; Peer, D. Precision nanomedicine in neurodegenerative diseases. ACS Nano 2014, 8, 1958–1965. [Google Scholar] [CrossRef]
  48. Barbu, E.; Molnar, E.; Tsibouklis, J.; Gorecki, D.C. The potential for nanoparticle-based drug delivery to the brain: Overcoming the blood–brain barrier. Expert Opin. Drug Deliv. 2009, 6, 553–565. [Google Scholar] [CrossRef]
  49. Lockman, P.R.; Mumper, R.J.; Khan, M.A.; Allen, D.D. Nanoparticle technology for drug delivery across the blood–brain barrier. Drug Dev. Ind. Pharm. 2002, 28, 1–13. [Google Scholar] [CrossRef] [PubMed]
  50. Etame, A.B.; Smith, C.A.; Chan, W.C.; Rutka, J.T. Design and potential application of PEGylated gold nanoparticles with size-dependent permeation through brain microvasculature. Nanomed. Nanotechnol. Biol. Med. 2011, 7, 992–1000. [Google Scholar] [CrossRef] [PubMed]
  51. Hanada, S.; Fujioka, K.; Inoue, Y.; Kanaya, F.; Manome, Y.; Yamamoto, K. Cell-based in vitro blood–brain barrier model can rapidly evaluate nanoparticles’ brain permeability in association with particle size and surface modification. Int. J. Mol. Sci. 2014, 15, 1812–1825. [Google Scholar] [CrossRef] [PubMed] [Green Version]
  52. Sonavane, G.; Tomoda, K.; Makino, K. Biodistribution of colloidal gold nanoparticles after intravenous administration: Effect of particle size. Colloids Surf. B Biointerfaces 2008, 66, 274–280. [Google Scholar] [CrossRef]
  53. Decuzzi, P.; Godin, B.; Tanaka, T.; Lee, S.Y.; Chiappini, C.; Liu, X. Size and shape effects in the bio-distribution of intravascularly injected particles. J. Control. Release 2010, 141, 320–327. [Google Scholar] [CrossRef] [PubMed]
Figure 1. BNCT steps: selective delivery of 10B-drugs to tumour cells is followed by irradiation with slow neutrons (1n), leading to tissue repair. (Adapted from Calabrese et al. [20]).
Applsci 11 10738 g001
Figure 2. The structure of common Delocalized Lipophilic Cations (DLCs).
Applsci 11 10738 g002
Figure 3. Chemical structure of chitosan.
Applsci 11 10738 g003
Figure 4. Structure of but-3-yn-1-yl (triphenyl phosphonium) bromide (1).
Applsci 11 10738 g004
Figure 5. Structure of (3-carboranylpropyl) (triphenyl phosphonium) bromide (2).
Applsci 11 10738 g005
Figure 6. Structure of but-3-yn-1-yl (N9,N9-diethyl-9H-benzo[a]phenoxazine-5,9-diamine) bromide (3).
Applsci 11 10738 g006
Figure 7. Structure of (3-carboranylpropyl)-(N9,N9-diethyl-9H-benzo[a]phenoxazine-5,9-diamine) bromide (4).
Applsci 11 10738 g007
Figure 8. Structure of but-3-yn-1-yl 3,7-diamino-5-phenylphenazin-5-ium bromide (5).
Applsci 11 10738 g008
Figure 9. Structure of (3-carboranylpropyl) (3,7-diamino-5-phenylphenazin-5-ium) bromide (6).
Applsci 11 10738 g009
Figure 10. Size and surface charge characteristics of nanoparticles (NP) formulated via ionotropic gelation for compound 2 (TPP), compound 4 (NB) and compound 6 (PS).
Applsci 11 10738 g010
Figure 11. Size and surface charge characteristics of PPY-CHIT nanocapsules (NC) formulated via copolymerization for compound 2 (TPP), compound 4 (NB) and compound 6 (PS).
Applsci 11 10738 g011
Figure 12. The release profiles of the different pharmacophores in different pH.
Applsci 11 10738 g012
Figure 13. Images showing SEM image non-drug-loaded chitosan nanoparticles formulated with a concentration of 0.4 mg/mL NaTPP via ionotropic gelation.
Applsci 11 10738 g013
Figure 14. Neutral red assay for nanocomposites formulated via ionotropic gelation treated on CaCo2 cell lines. Cell lines were tested on compound 2 (TPP), compound 4 (NB) and compound 6 (PS).
Applsci 11 10738 g014
Figure 15. Uptake of boron for non-DLC containing carborane into CaCo2 and U87 MG cells after 1, 6 and 24 h.
Applsci 11 10738 g015
Figure 16. Uptake of boron for 3-carboranylpropyl) (triphenyl phosphonium) bromide (2) into CaCo2 and U87 MG cells after 1, 6 and 24 h.
Applsci 11 10738 g016
Figure 17. Uptake of boron for 3-carboranylpropyl)-(N9,N9-diethyl-9H-benzo[a]phenoxazine-5,9-diamine) bromide (4) into CaCo2 and U87 MG cells after 1, 6 and 24 h.
Applsci 11 10738 g017
Figure 18. Uptake of boron for 3-carboranylpropyl) (3,7-diamino-5-phenylphenazin-5-ium) bromide (6) into CaCo2 and U87 MG cells after 1, 6 and 24 h.
Applsci 11 10738 g018
Figure 19. Toxicity of different concentrations of DLC functionalised carboranes on CaCo2 and U-87 MG cells after 24 h. Assays were repeated five times, with each assay containing triplicate readings for the same concentrations. Toxicity studies were performed at different concentrations for compound 2 (TPP), compound 4 (NB), and compound 6 (PS).
Applsci 11 10738 g019
Figure 20. Boron concentrations of the compound that has permeated through a cellular monolayer from nanoparticles (NP) formulated through ionotropic gelation. Boron concentrations for permeated boron were undertaken for compound 2 (TPP), compound 4 (NB), and compound 6 (PS).
Applsci 11 10738 g020
Figure 21. Boron concentration of compounds that have permeated through the cellular monolayer for nanocapsules (NC) formulated with chitosan and polypyrrole. Boron concentration for permeated boron was undertaken on compound 2 (TPP), compound 4 (NB), and compound 6 (PS).
Applsci 11 10738 g021
Figure 22. Uptake studies for boron into U87-MG cells with nanoparticles (NP) formulated via ionotropic gelation; boron uptake was undertaken on compound 2 (TPP), compound 4 (NB), and compound 6 (PS).
Applsci 11 10738 g022
Figure 23. Uptake studies of boron into U87-MG cells from nanocapsules (NC) formulated with chitosan and polypyrrole; uptake of boron was conducted for compound 2 (TPP), compound 4 (NB), and compound 6 (PS).
Applsci 11 10738 g023
Publisher’s Note: MDPI stays neutral with regard to jurisdictional claims in published maps and institutional affiliations.

