Article

Automated Breast Lesion Detection and Characterization with the Wavelia Microwave Breast Imaging System: Methodological Proof-of-Concept on First-in-Human Patient Data

1
Medical Imaging Department, MVG Industries, 91140 Villejust, France
2
Department of Radiology, Galway University Hospital, Saolta University Healthcare Group, H91 YR71 Galway, Ireland
3
Discipline of Surgery, Lambe Institute for Translational Research, School of Medicine, National University of Ireland Galway, H91 TK33 Galway, Ireland
4
Department of Surgery, Galway University Hospital, Saolta University Healthcare Group, H91 YR71 Galway, Ireland
*
Author to whom correspondence should be addressed.
Appl. Sci. 2021, 11(21), 9998; https://doi.org/10.3390/app11219998
Submission received: 28 September 2021 / Revised: 18 October 2021 / Accepted: 19 October 2021 / Published: 26 October 2021

Abstract

:
Microwave Breast Imaging (MBI) is an emerging non-ionizing imaging modality, with the potential to support breast diagnosis and management. Wavelia is an MBI system prototype, of 1st generation, which has recently completed a First-In-Human (FiH) clinical investigation on a 25-symptomatic patient cohort, to explore the capacity of the technology to detect and characterize malignant (invasive carcinoma) and benign (fibroadenoma, cyst) breast disease. Two recent publications presented promising results demonstrated by the device in this FiH study in detecting and localizing, as well as delineating size and malignancy risk, of malignant and benign palpable breast lesions. In this paper, the methodology that has been employed in the Wavelia semi-automated Quantitative Imaging Function (QIF), to support breast lesion detection and characterization in the FiH clinical investigation of the device, is presented and the critical design parameters are highlighted.

1. Introduction

Microwave Breast Imaging (MBI) uses the scattering wave, or reflected wave, that arises from the contrast in dielectric properties between the various breast tissues, in the microwave frequency range [1]. The increased volume of water within the denser breast tissues is responsible for the detectable electromagnetic scattering associated with microwave imaging. The increase in sodium and water, particularly in-bound water within the tumor cells, is expected to lead to even greater conductivity and permittivity of the tumorous tissues [2,3]. Due to the dielectric contrast, back-scattered radar signals are physically generated, when the breast is illuminated with low-power electromagnetic waves in the microwave frequency range.
MBI has been investigated as a novel modality for the detection of breast disease, offering a non-ionizing, non-compressive approach [4,5,6] and as a potential diagnostic management strategy in the monitoring of neoadjuvant chemotherapy [7]. To date, a total of at least 10 MBI system prototypes have been employed in human subject tests, to investigate the clinical utility of MBI [8,9,10,11]. Despite encouraging clinical results being reported, several recurrent limitations, as outlined in [12], remain unresolved across most studies and justify further clinical research with alternative MBI systems, such as Wavelia.
WaveliaTM is an MBI system prototype, of 1st generation, which demonstrated the ability to detect dielectric contrast between tumor phantoms and synthetic fibroglandular tissue in preclinical studies [13] and has recently completed a First-In-Human (FiH) clinical investigation on a 25-symptomatic patient cohort, hosted in NUIG Clinical Research Facility Galway, Ireland. In this study (ClinicalTrials.gov NCT03475992), the Wavelia MBI system was evaluated in the clinical setting for the first time, using mammography as the reference conventional imaging modality and post-surgery histology data to assess the size of the cancers. Ultrasound, MRI and core biopsy data were also collected as a reference and were available as part of the patient’s standard of care. In this FiH study, Wavelia demonstrated the capacity to detect and approximate underlying breast abnormalities to the appropriate location, in patients with palpable biopsy-confirmed invasive carcinomas and benign breast lesions, such as cysts and fibroadenomas [12]. The device also demonstrated promising results in delineating the size and malignancy risk of the detected breast lesions [14].
The methodology that was employed in the Wavelia semi-automated Quantitative Imaging Function (QIF) during this FiH study, to support morphological breast lesion detection based on persistence, lesion sizing and lesion characterization in a low-dimensional feature space, spanning shape and texture-based features, is presented in this article.

2. Materials and Methods

The Wavelia MBI Quantitative Imaging Function (QIF) was initially conceived using experimental MBI datasets from anthropomorphic breast phantoms [13,15] and was further developed and configured following training on the available FiH patient datasets [12,16]. The MBI parametric radar image formation and clinical feature extraction are performed offline at this stage of development of Wavelia.

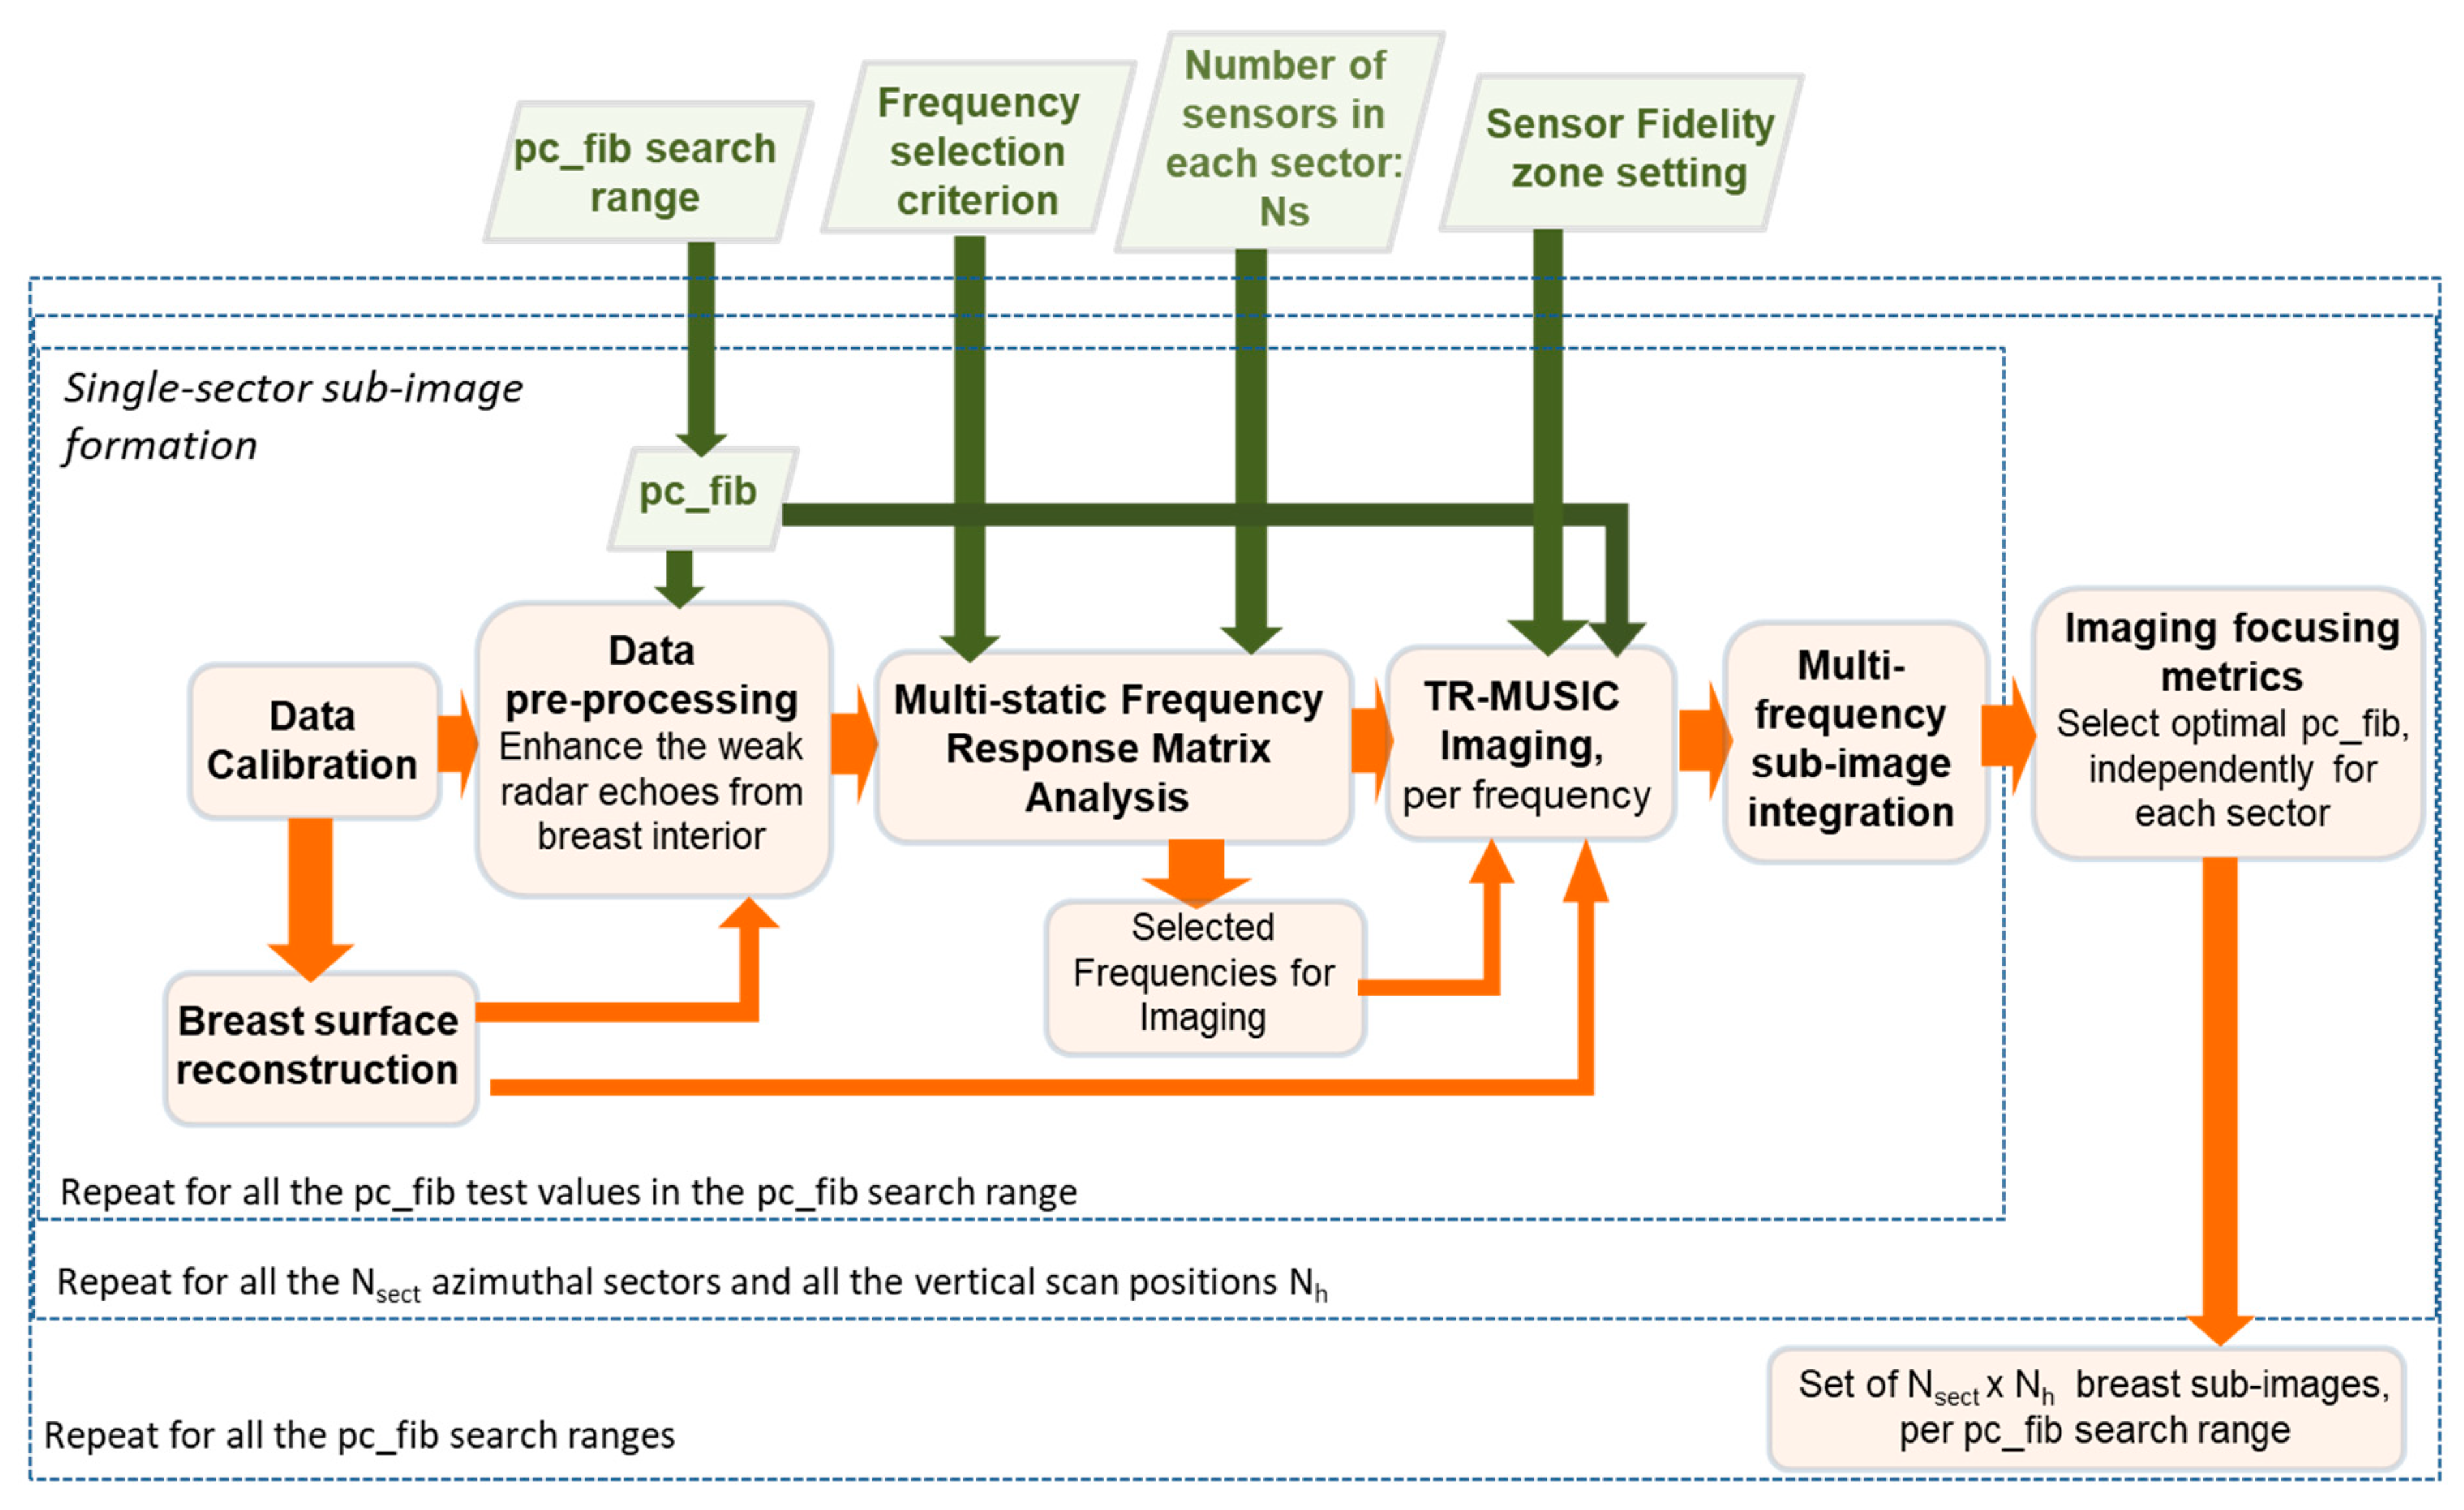
2.1. Wavelia MBI: Parametric Radar Image Formation

The Wavelia MBI system operates using 18 antennae arranged in a circle in a horizontal plane outside a cylinder. With the patient lying in the prone position, one breast is submerged at a time into the cylinder, which is filled with a creamy transition liquid. The liquid has dielectric properties similar to the ones of the human skin within the microwave frequency spectrum, thus favoring the penetration of the electromagnetic waves in the breast. The device illuminates the breast using low-power electromagnetic waves in the frequency range [0.5–4] GHz. The probe array moves vertically below the examination table and illuminates the breast at regular intervals of 5 mm. Coronal sections of the breast, of a given thickness (10 mm) are generated using the MBI data at each vertical scan position of the probe array. Partially overlapping consecutive coronal breast sections, formed per azimuthal sector of illumination based on multi-static radar detection technology, are integrated to form a 3D MBI image of the dielectrically contrasted interior breast tissues.
As specified in prior publications on Wavelia MBI [13,15], the multi-static radar imaging algorithm, which is employed for MBI image formation, is the Time-Reversal Multiple SIgnal Classification (TR-MUSIC) algorithm, which was originally conceived for the detection of obscured radar targets in heavily cluttered environments [17]. The intensity of the TR-MUSIC images gets maximized in the imaging pixels where the MBI sensor array illumination vector is more orthogonal to the noise subspace; thus, the image intensity is indicative of the probability for the presence of a dielectrically contrasted scatterer on each pixel of the image. The noise subspace is estimated at each frequency, by means of decomposition and analysis of the Multi-Static Frequency Response Matrix (MFRM) of the imaging array. The illumination vector of the imaging array, at each pixel p of the imaging scene and each frequency f, is defined as:
G sec t ( p , f ) = [ g 0 ( p T R x sec t , 1 , p , f ) g 0 ( p T R x sec t , 2 , p , f ) g 0 ( p T R x sec t , N s , p , f ) ] T
with:
g 0 ( p T R x sec t , i , p , f ) = j H 0 ( 1 ) ( 2 π f c 0 ( e r , t r a n s ( f ) d ^ O u t O f B r e a s t , i , p + e ^ r , I n B r e a s t ( f ) d ^ I n B r e a s t , i , p ) )
the assumed underlying ElectroMagnetic (EM) wave propagation model for the antenna element at position p T R x sec t , i , H 0 ( 1 ) the Hankel function of 1st kind and 0th order, c0 the speed of light in vacuum, e r , t r a n s ( f ) the known permittivity of the transition liquid at the frequency f, d ^ O u t O f B r e a s t , i , p an estimate of the distance travelled by the EM wave in the transition liquid up to reaching the imaging pixel p, d ^ I n B r e a s t , i , p an estimate of the distance travelled by the EM wave within the breast up to reaching the pixel p, and:
e ^ r , I n B r e a s t ( f ) = ( p c f i b e ^ r , f i b r o g l a n d u l a r ( f ) + ( 1 p c f i b ) e ^ r , a d i p o s e ( f ) ) 10 2
the average permittivity of the background healthy tissues of the breast, defined as a weighted average (weighting by pc_fib) of the adipose tissue and fibro-glandular tissue “mean” dielectric properties, as derived by Sugitani et al. [18].
The breast external envelope is reconstructed at first using the Wavelia MBI scan data. The geometry is exploited to split the imaging scene in “Out of breast” and “In breast” segments and further estimate d ^ O u t O f B r e a s t , i , p and d ^ I n B r e a s t , i , p for each transceiver i and each pixel p in the imaging scene.
The critical elements of the tailored implementation of TR-MUSIC in the Wavelia QIF are summarized below and in the flowchart of Figure 1.
  • Sectorization of the imaging scene: Considering the high level of heterogeneity of the breast tissues, but also the potentially irregularly shaped breast tumours, MBI image formation is performed using sectorized subsets of the circular sensor network of the Wavelia MBI system, at each vertical scan position. Both the physical size of the sensor sub-array (sector) and the number Ns of sensors used for the elementary sub-image formation is critical to the achievable performance of the MBI system, in terms of unambiguous detection and valid characterization of breast lesions. Ns = 6 was fixed in the Wavelia QIF for the FiH clinical investigation.
  • Sensor fidelity zone setting: Bounding the portion of the imaging scene, being efficiently illuminated by each sensor sub-array. In the current implementation of the Wavelia QIF, a spatial filter activates the contribution of a given antenna to a given pixel p in the imaging scene, only if the Euclidean distance between the pixel and the phase centre of the antenna is inferior to a pre-set value dmax.
  • Automated, data-driven, frequency selection for imaging: The TR-MUSIC imaging is performed per frequency. In the Wavelia QIF, a limited number of frequency points is automatically selected for imaging in each azimuthal sector of illumination, based on the information content of the MFRM at each frequency. The employed frequency selection criterion was previously defined in [15].
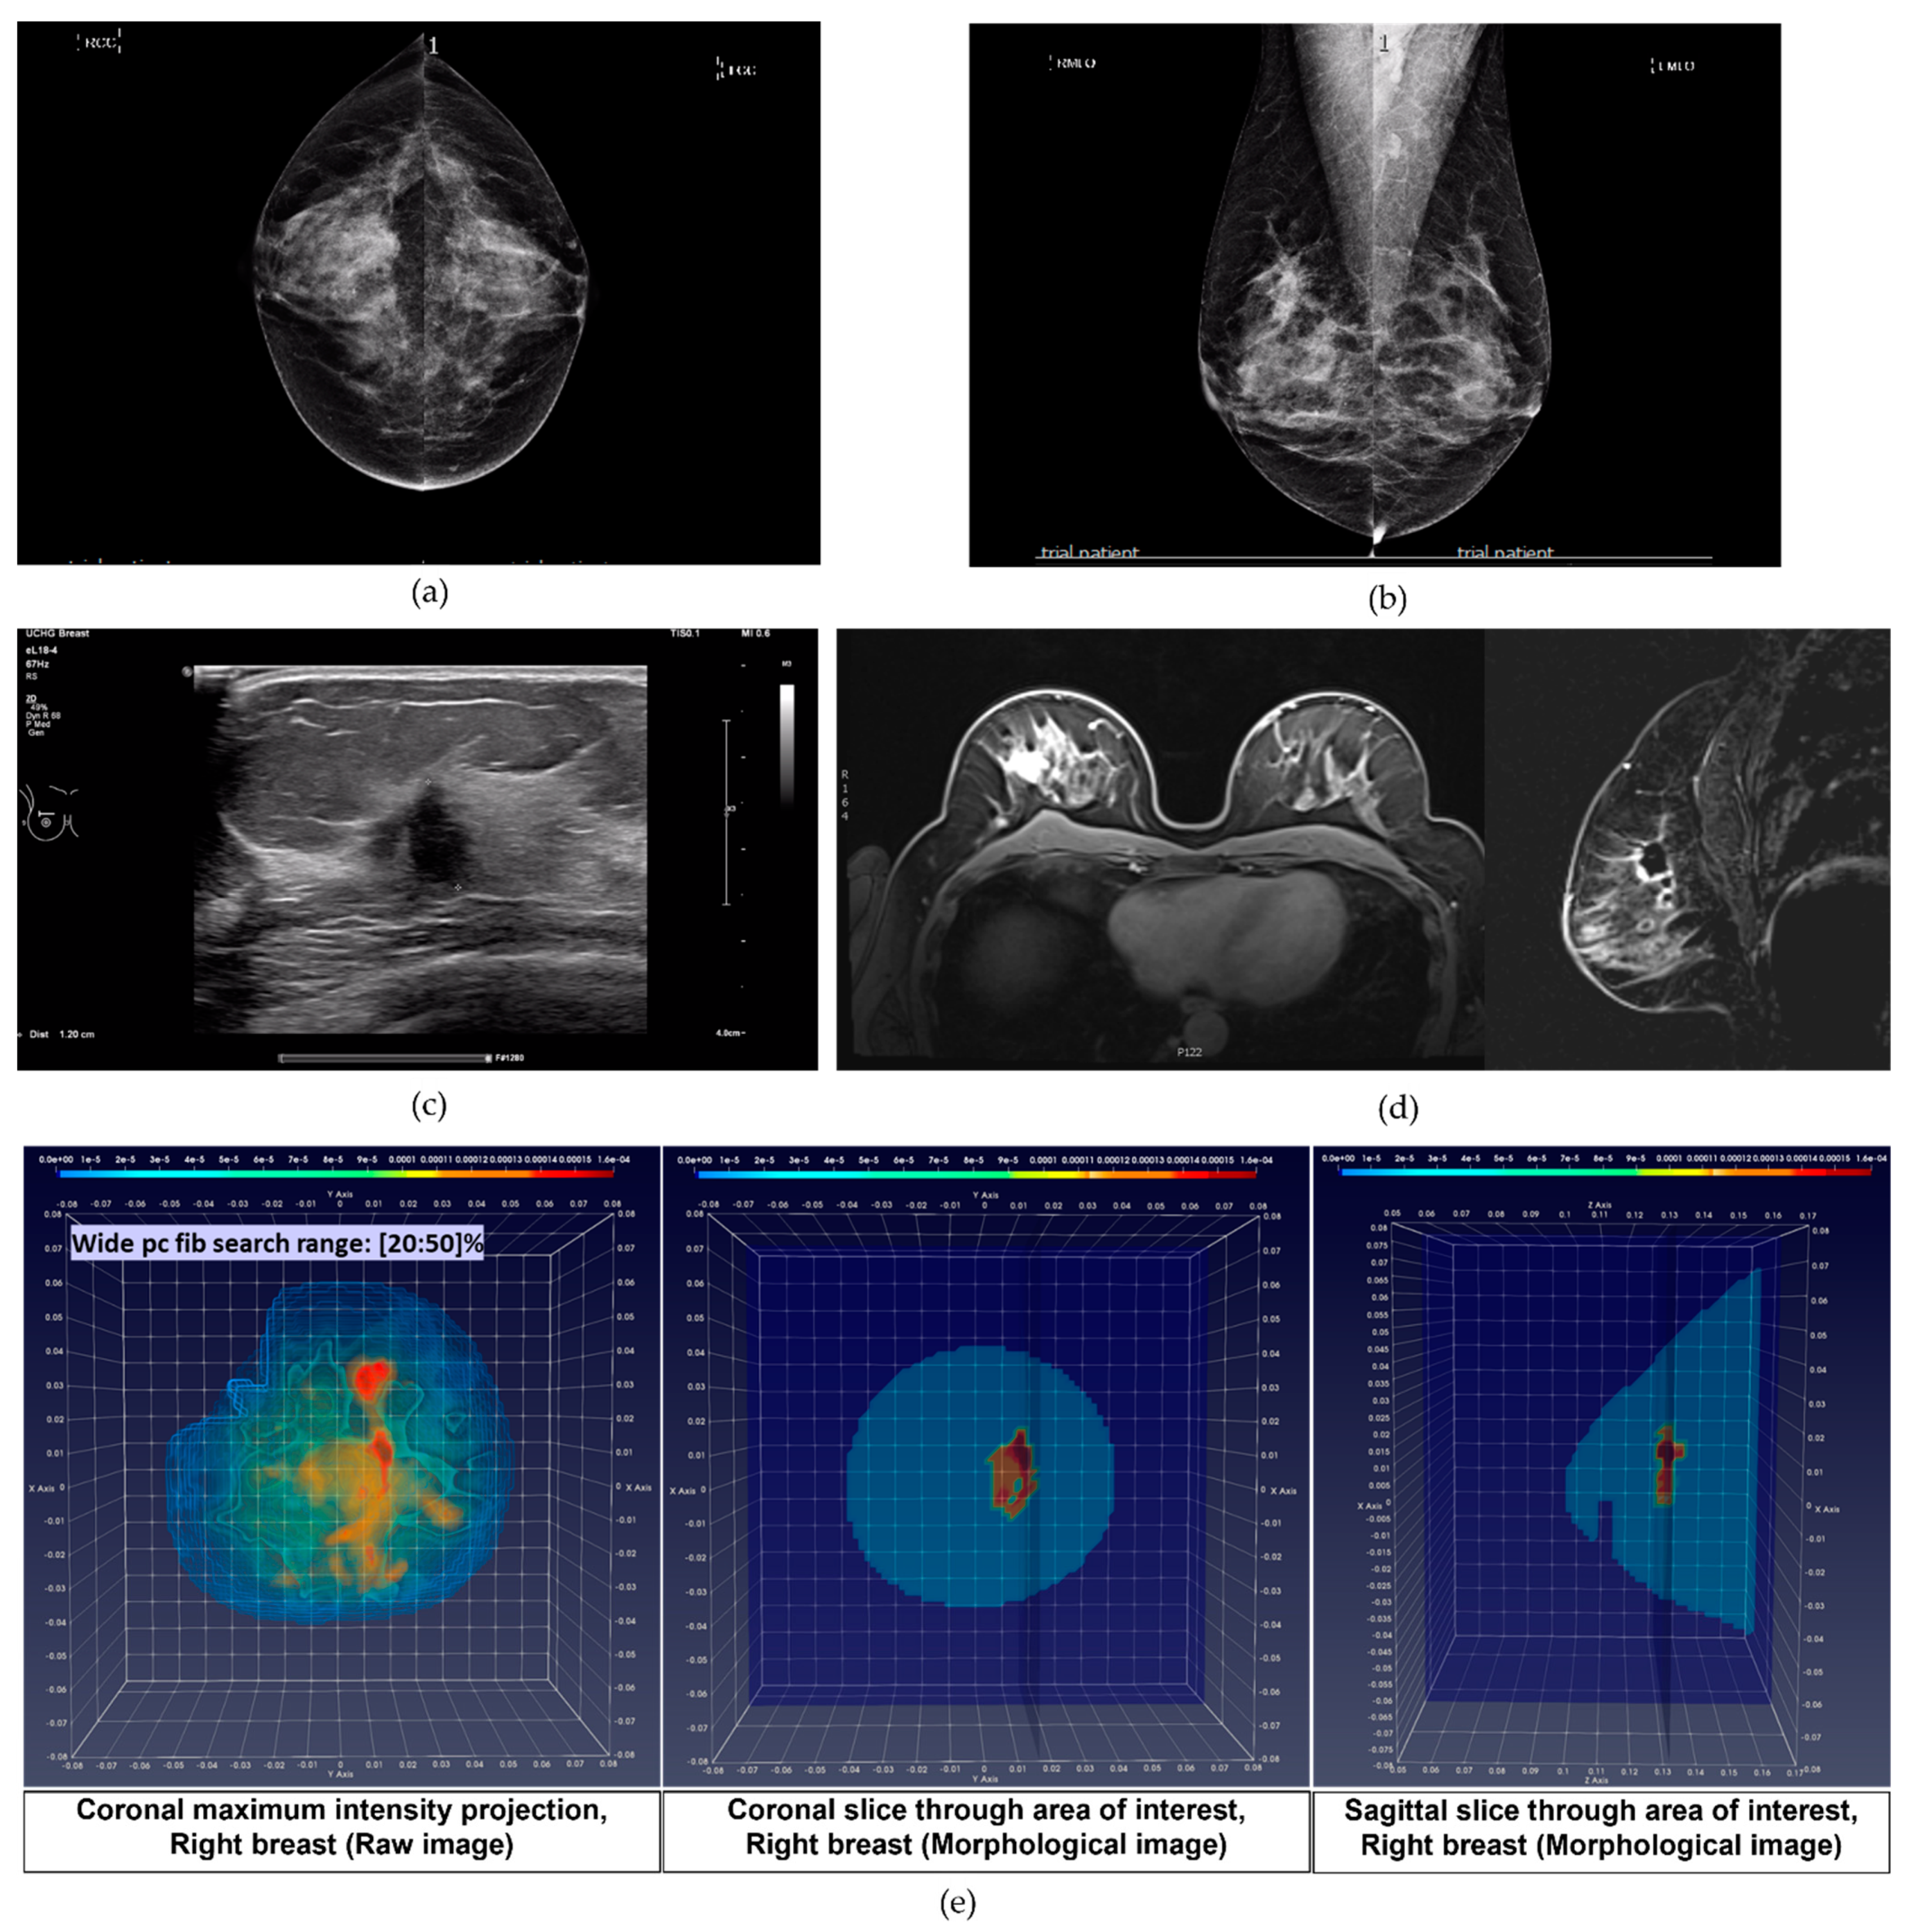
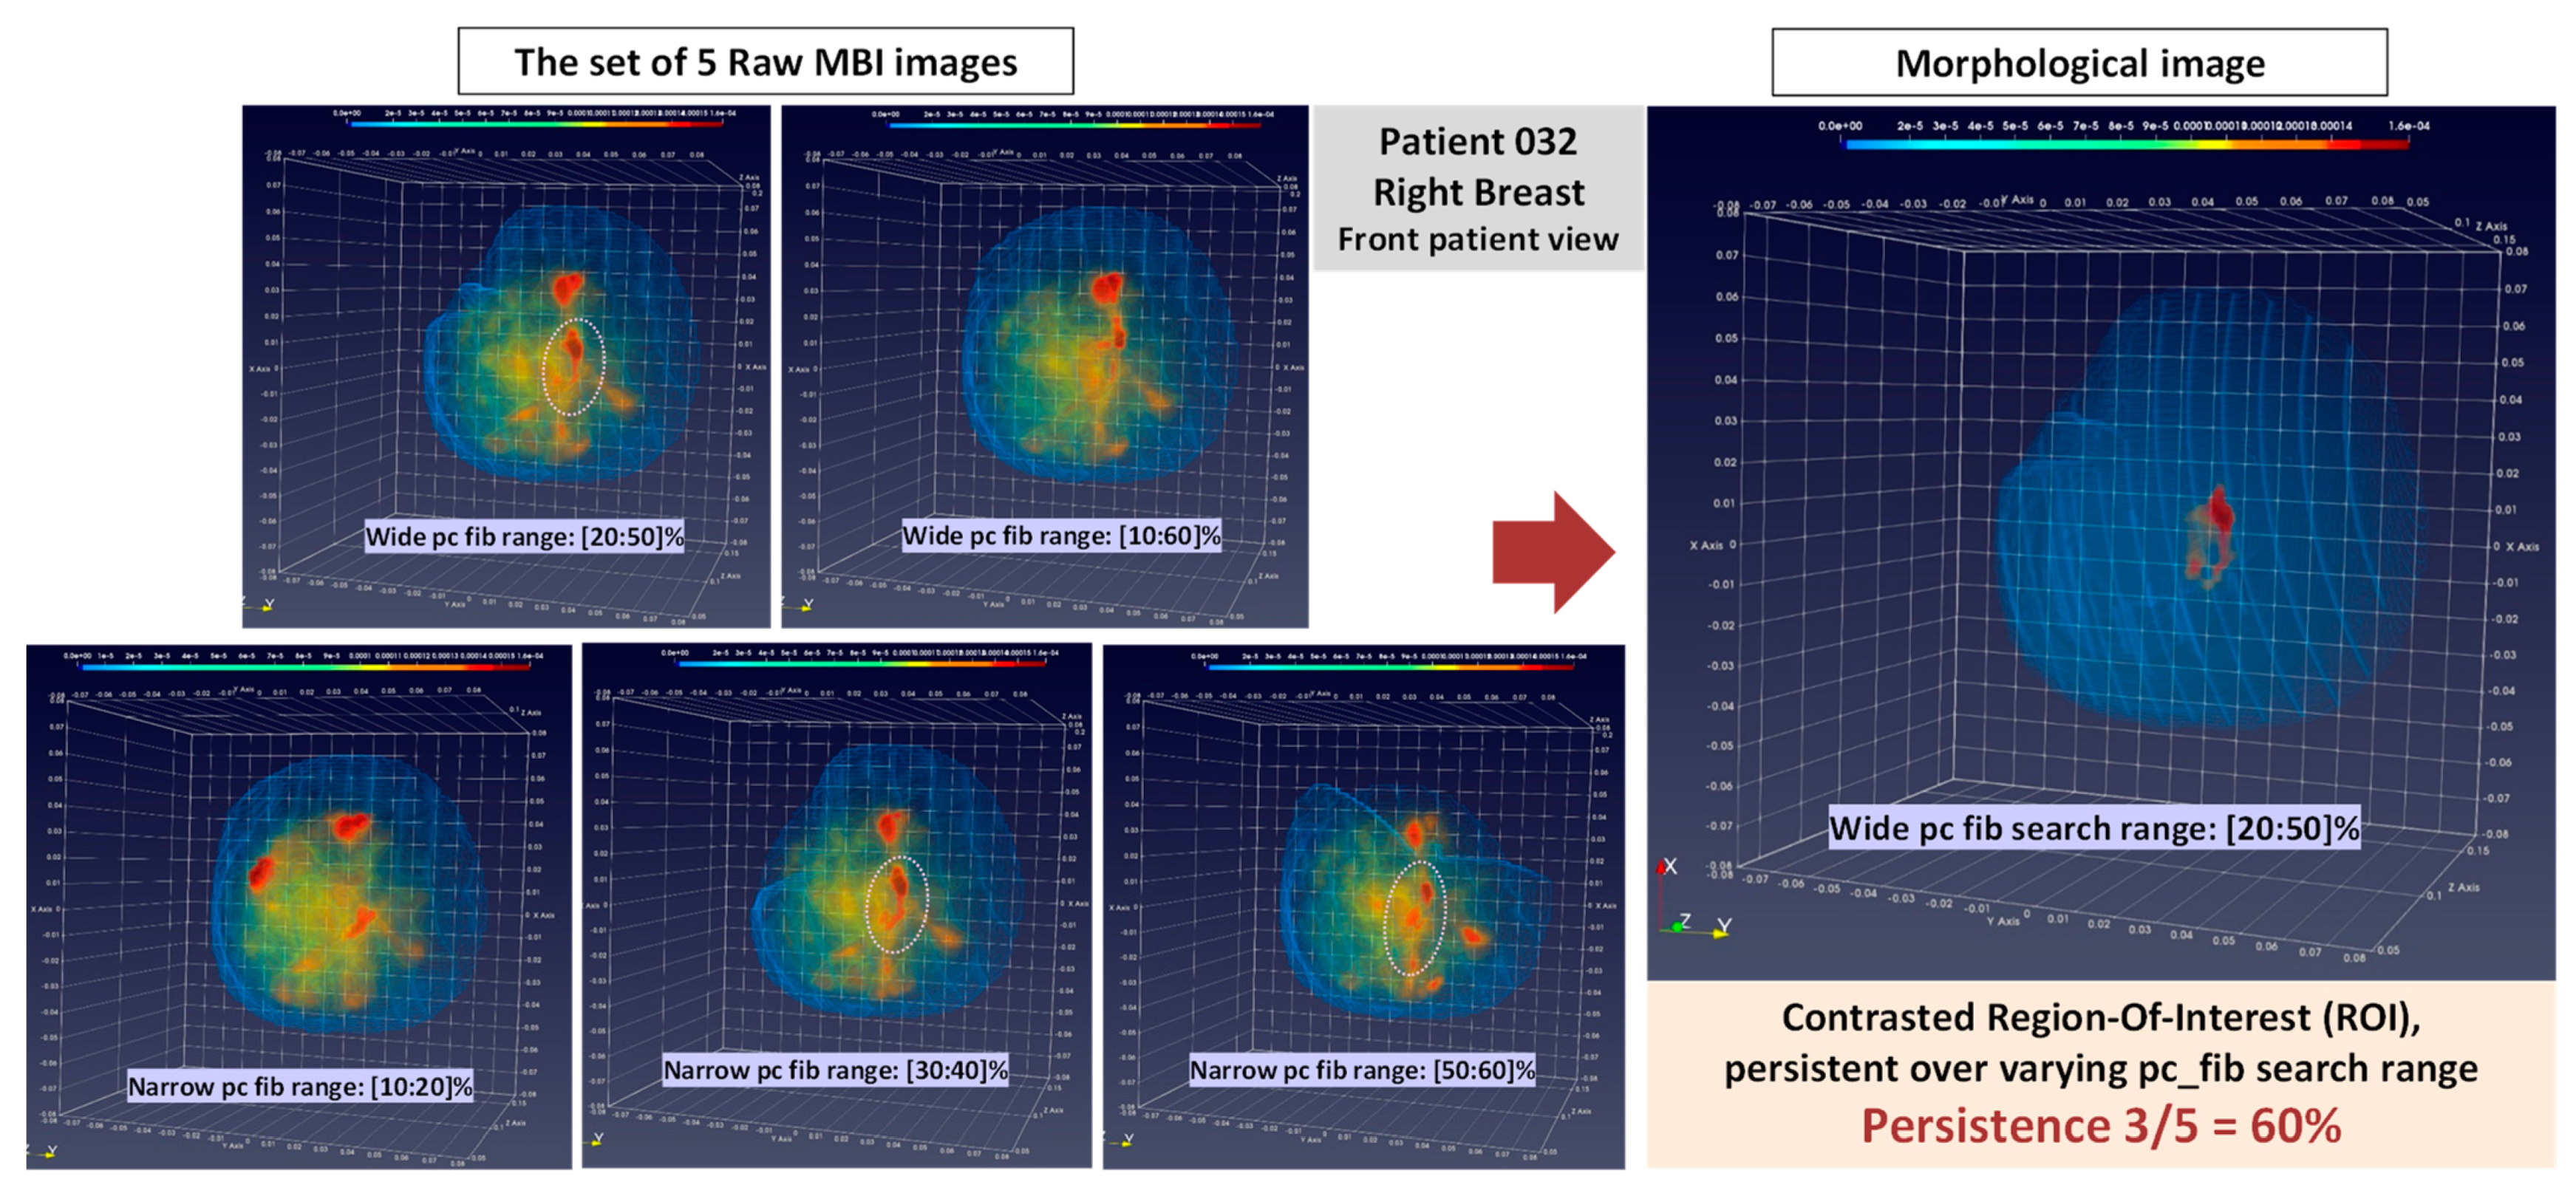
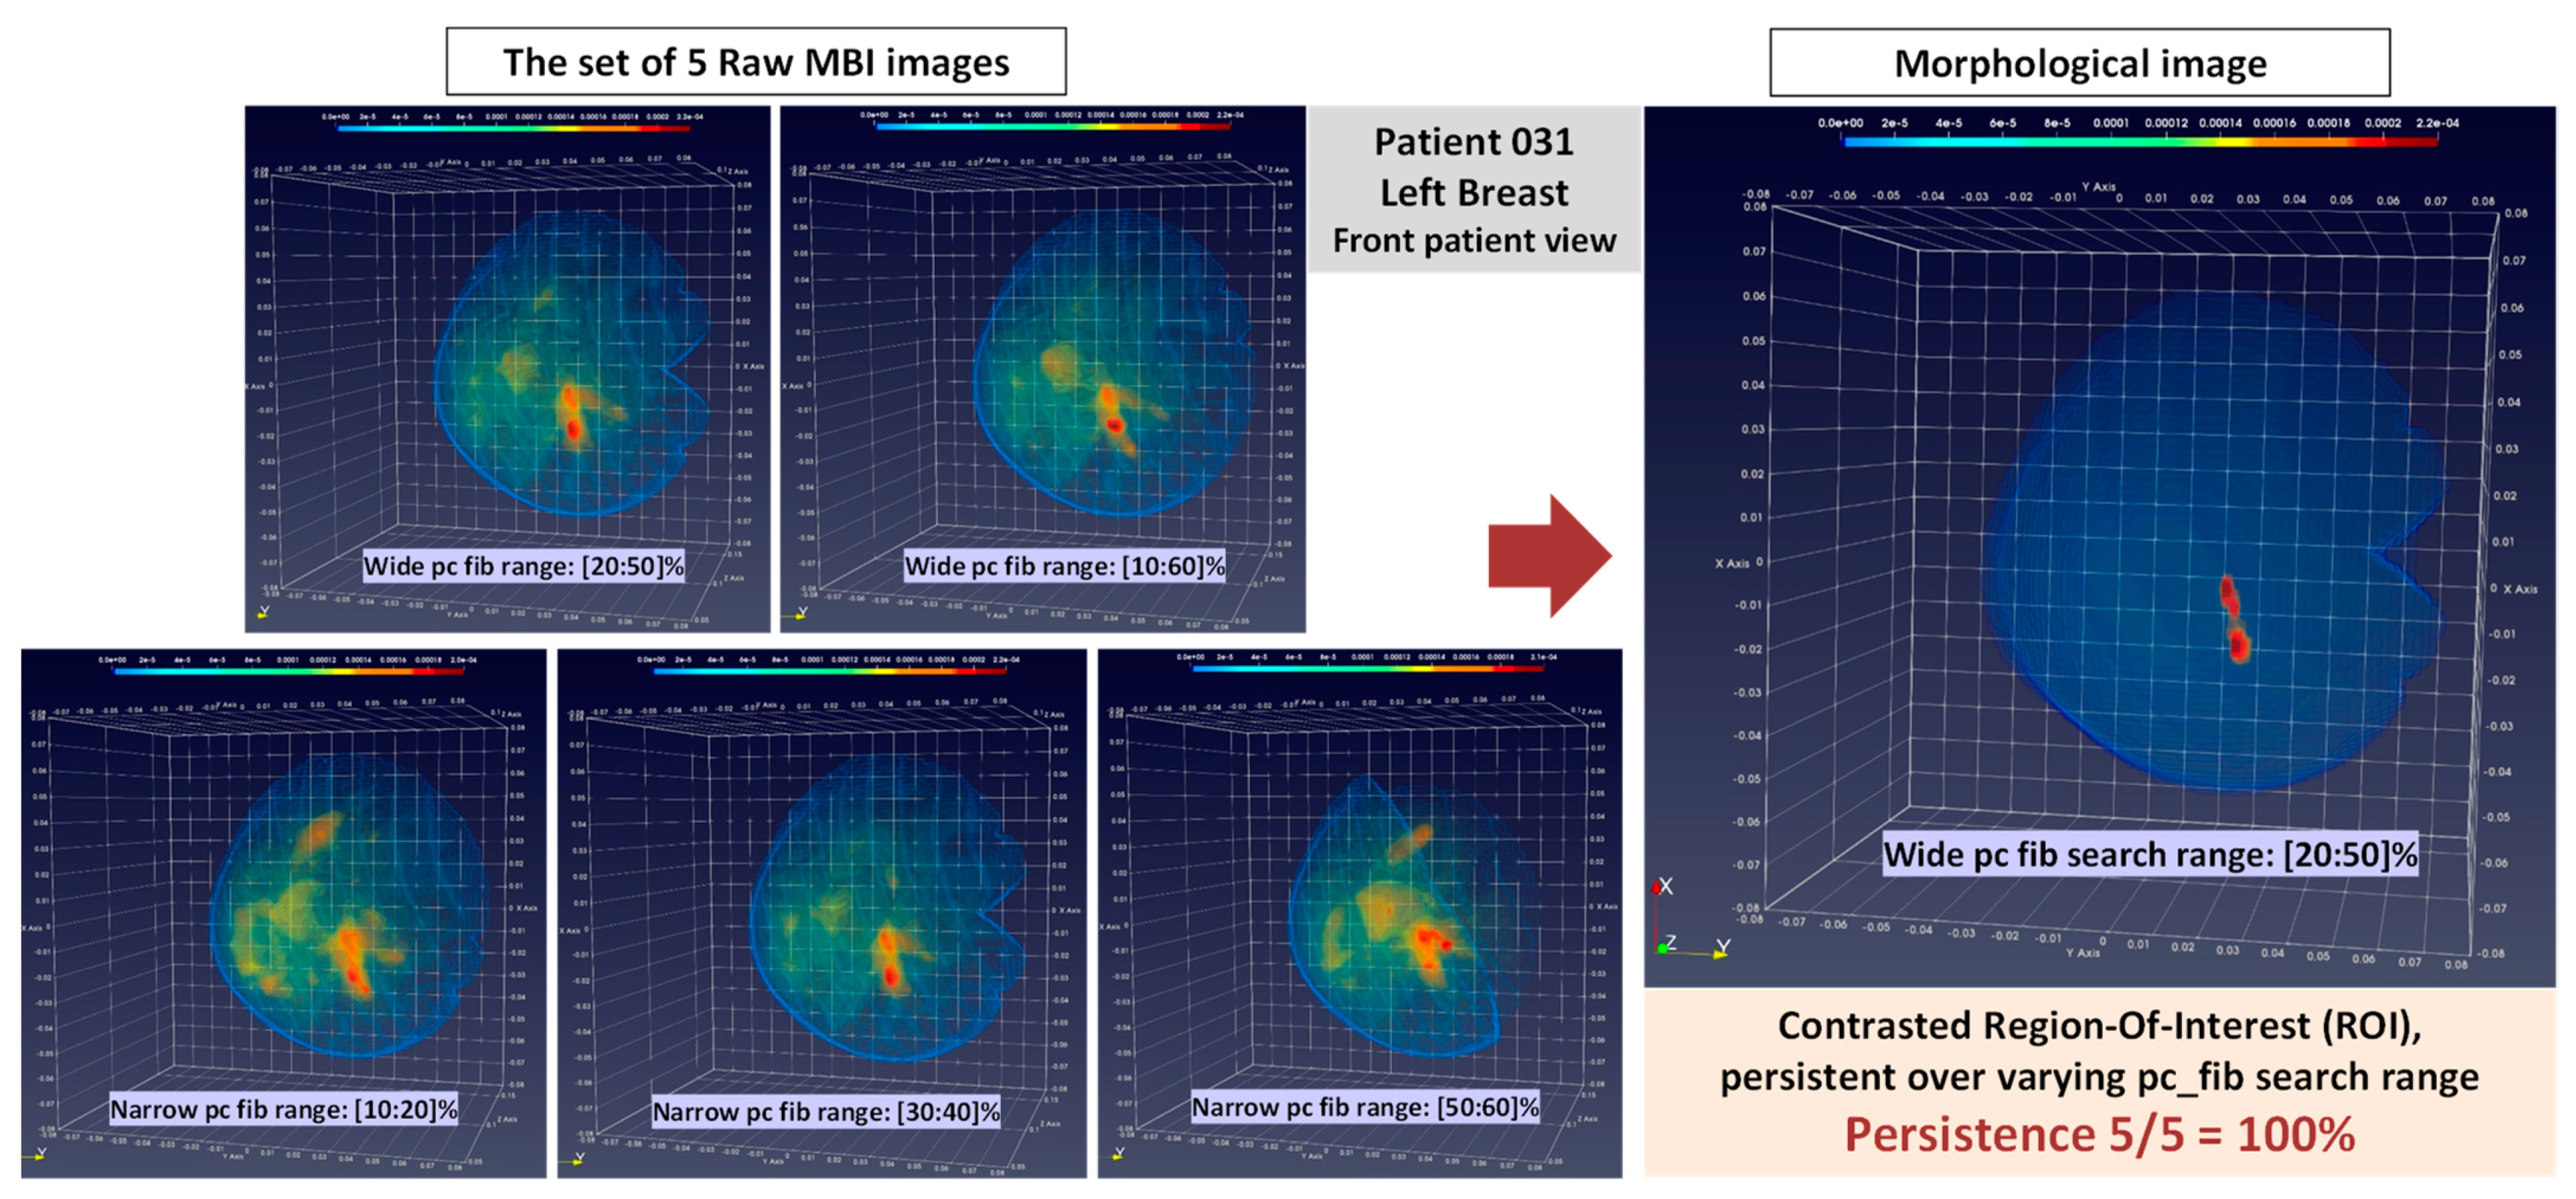
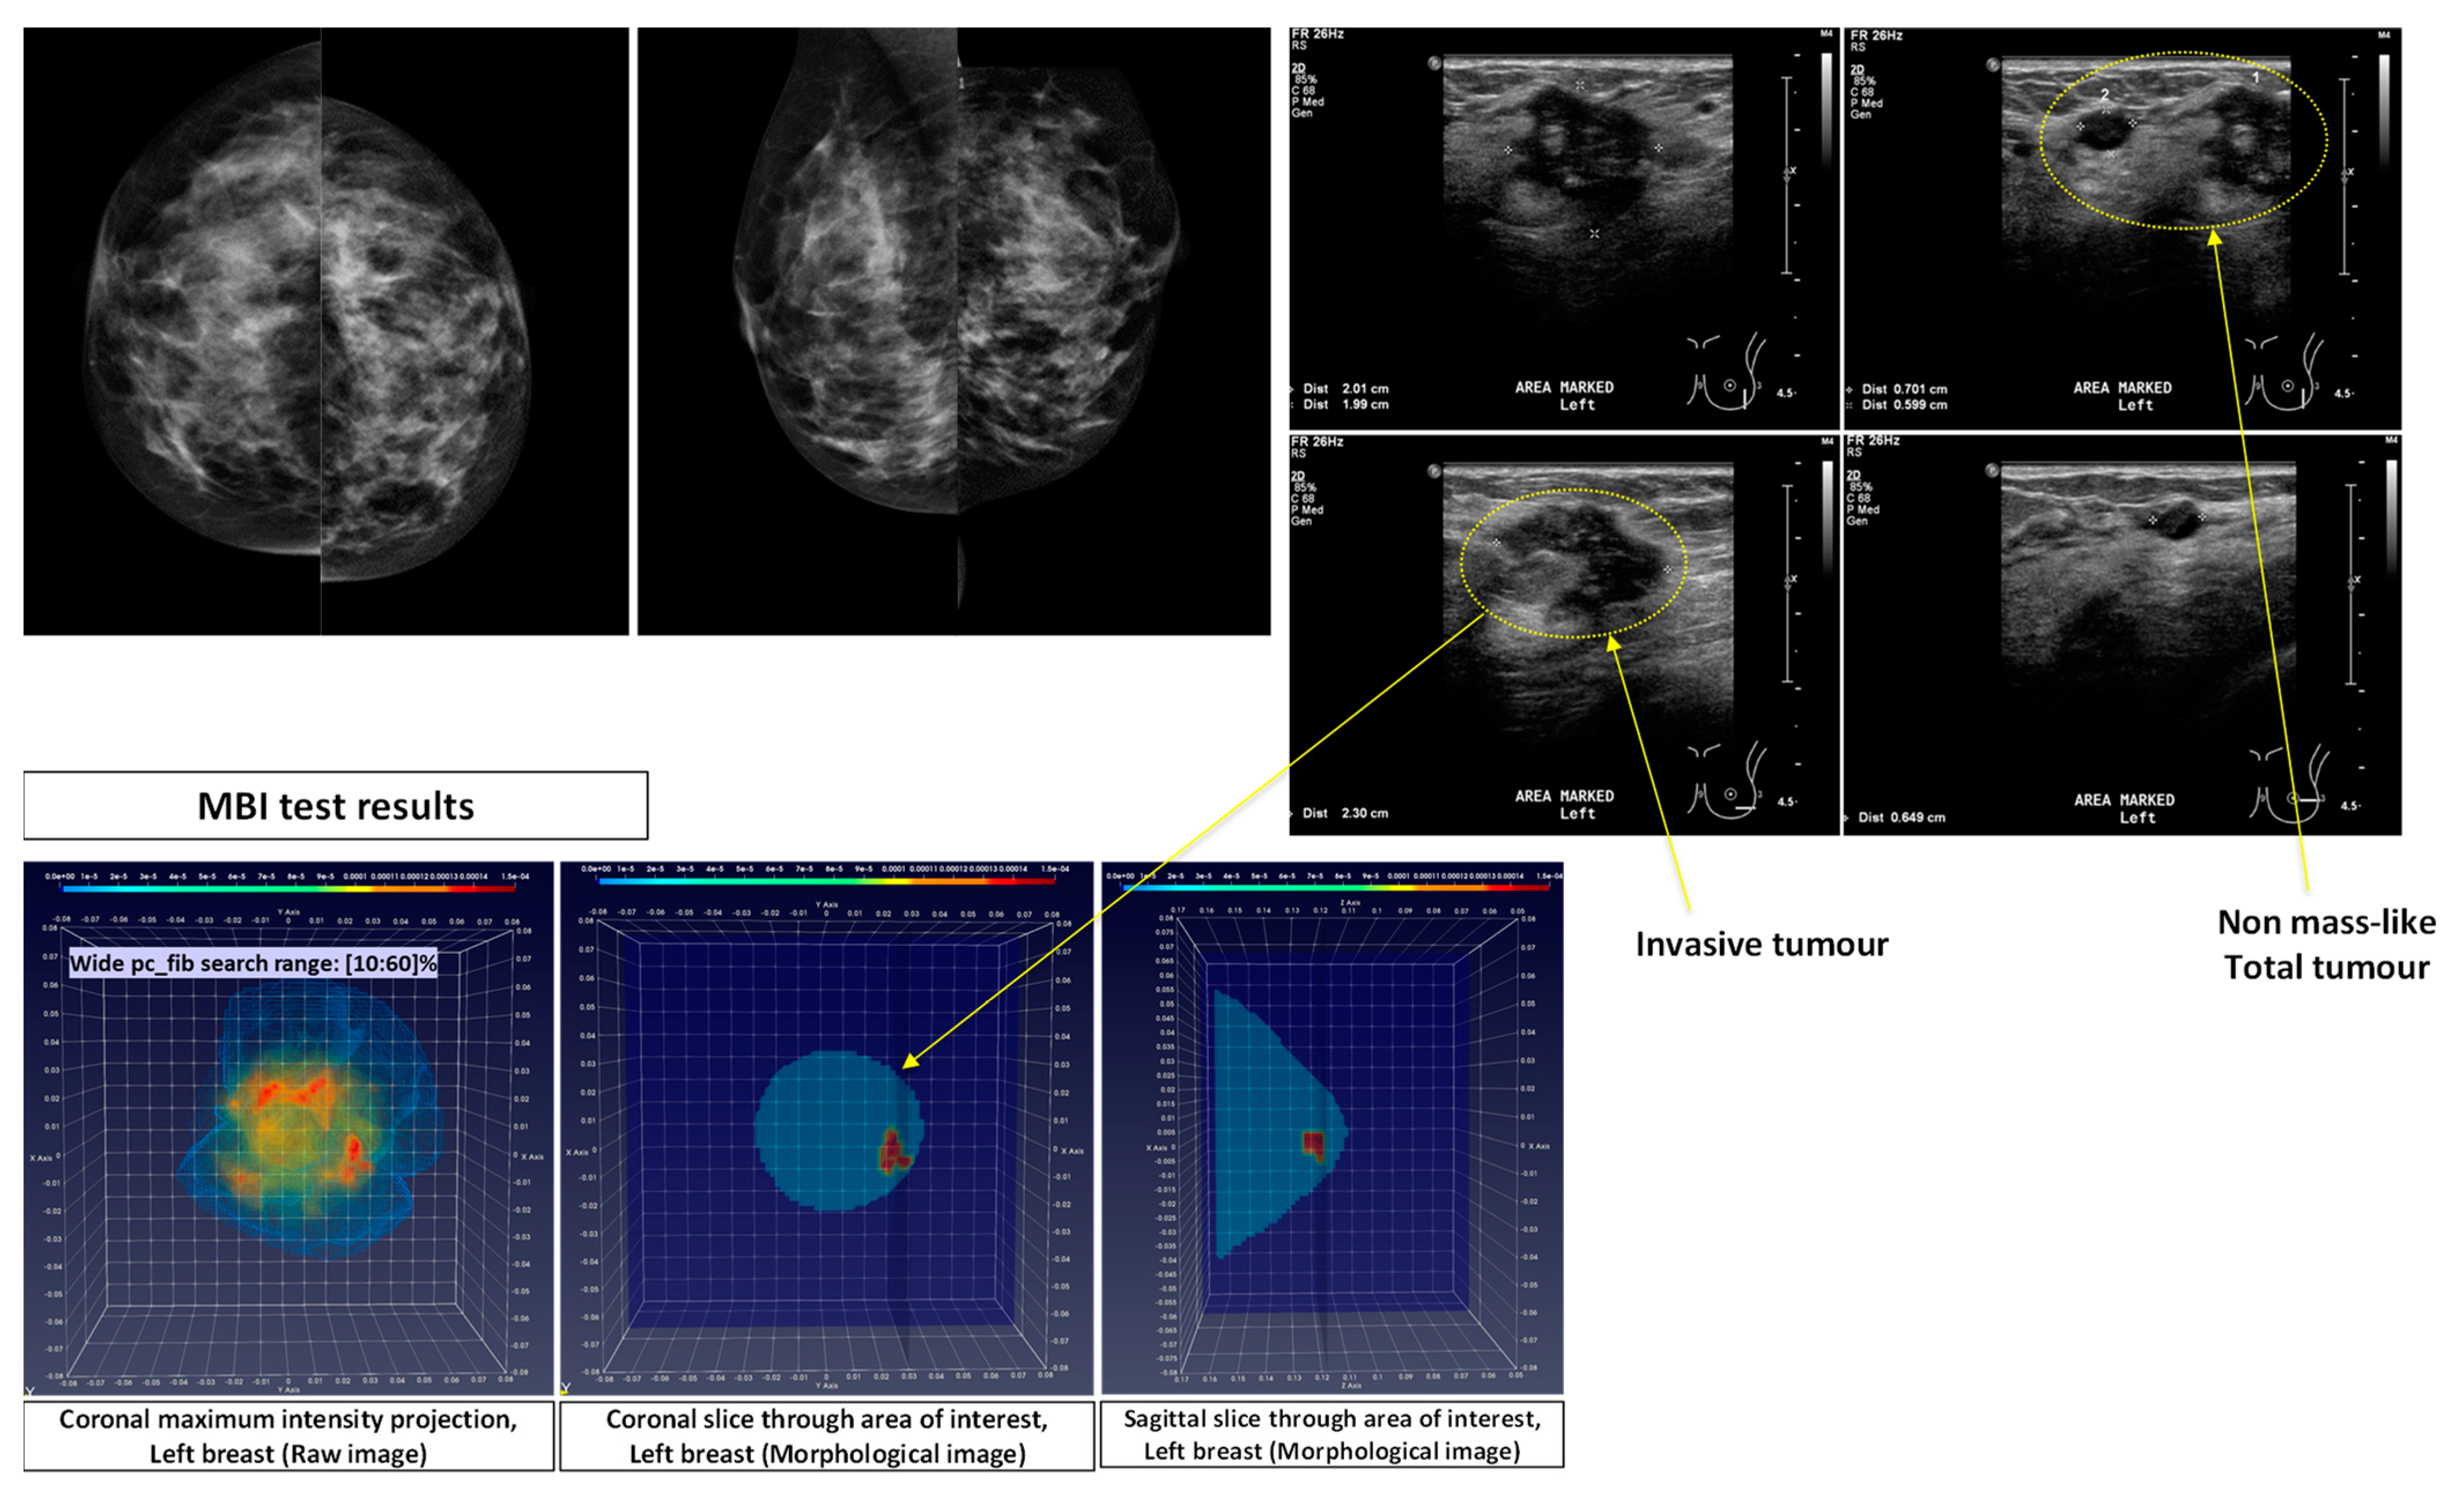
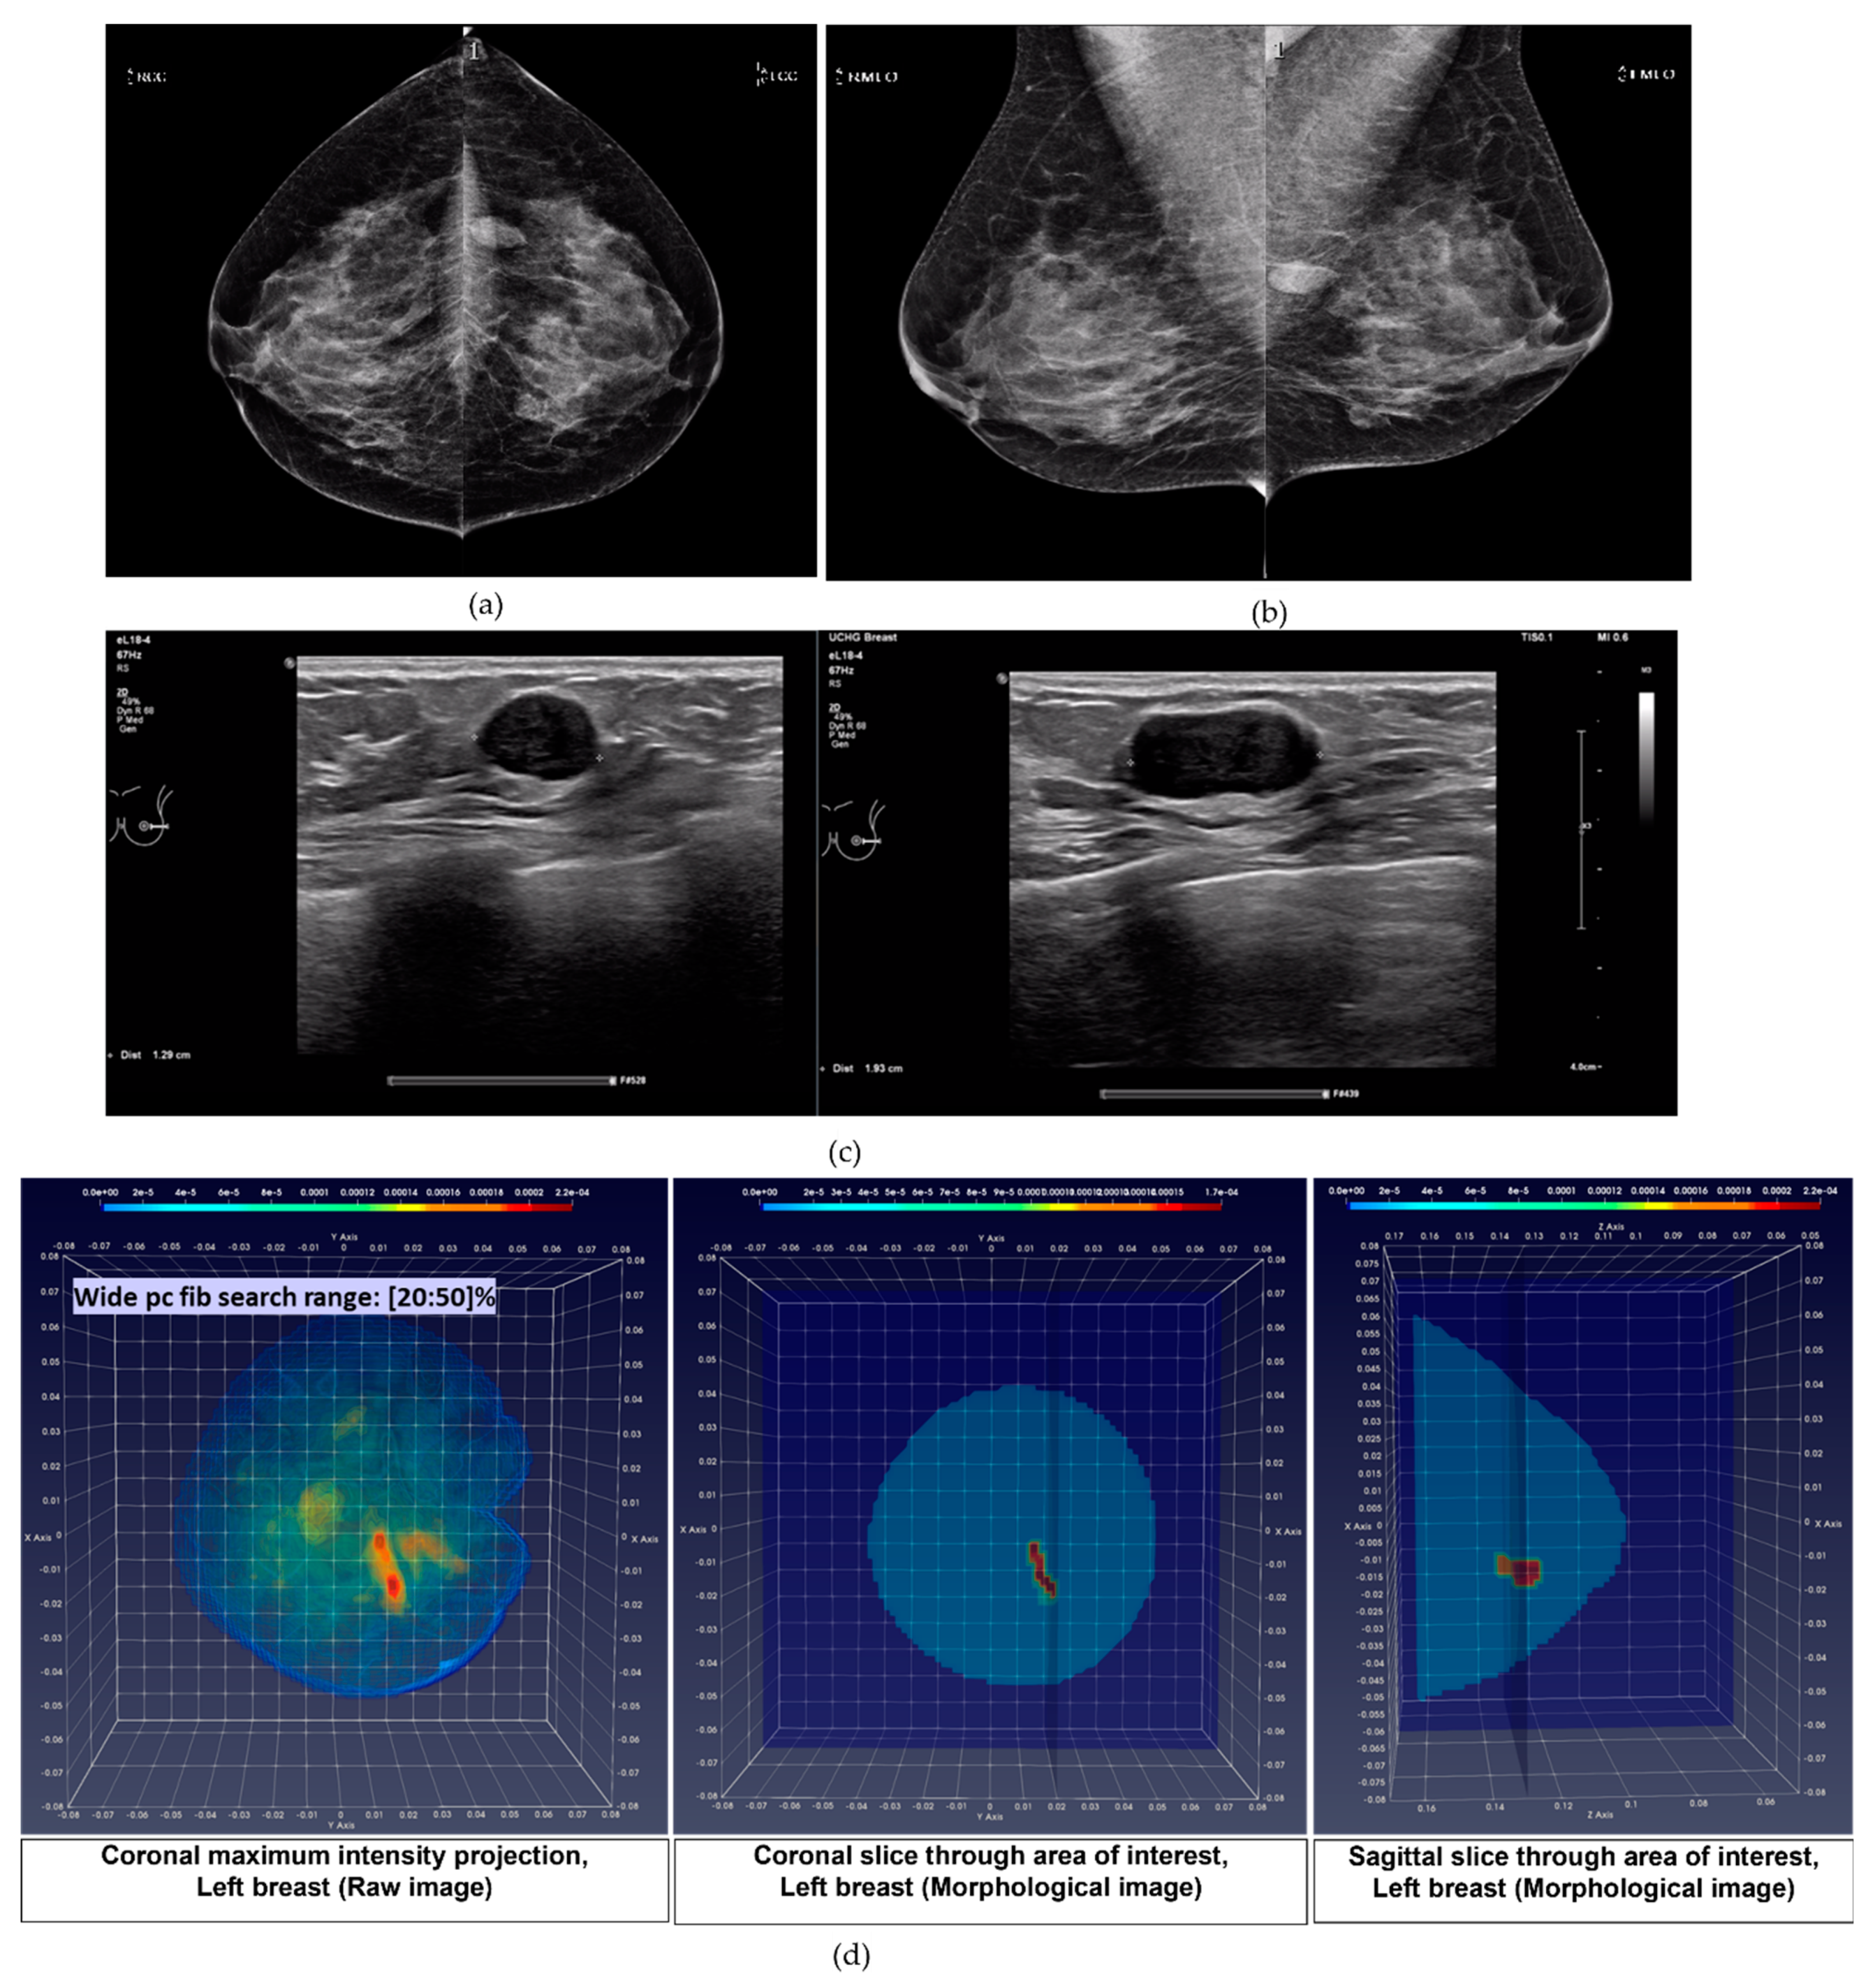
  • pc_fib parameter setting in multiple search ranges: A large variability exists in the dielectric properties of each breast tissue type over the population, as demonstrated by multiple studies involving ex-vivo dielectric measurements of a large sample of excised breast tissues [18,19,20,21]. Considering that the full dielectric map of each breast cannot become practically available, data-driven techniques are employed in the Wavelia QIF to deduce the unknown dielectric properties of the healthy breast tissue in each breast, by assessing the pc_fib parameter. The pc_fib parameter, which is involved in the formulation of the illumination vector of the MBI sensor array, is physically associated with the percentage of fibro-glandular tissue along the propagation path within the breast, from a given transmitting antenna to the interrogated imaging pixel and back to a given receiving antenna, as defined in Equations (1)–(3). The Wavelia QIF generates a set of parametric MBI radar images under various assumptions on pc_fib. The generated set of parametric images is further evaluated in terms of focusing, using the image curvature [22,23] as a focusing quality measure. To better handle the heterogeneity of the breast and potentially better reveal the non-uniform angular response of the breast lesions to MBI, the pc_fib parameter setting is performed independently in each azimuthal imaging sector, while employing multiple search ranges. In the Wavelia QIF, X1 wide and X2 narrow pc_fib parameter search ranges are systematically employed for image formation, thus a total number of X = (X1 + X2) MBI images are formed per patient’s breast.
The wide pc_fib search ranges result in 3D MBI images including the most complete representations of the detected breast lesion shape. The narrow pc_fib search ranges are expected to lead to partial representations of the detectable breast lesions. The X = 5 pc_fib search ranges, which were systematically employed during the FiH clinical investigation of Wavelia, are listed below:
  • Wide pc_fib search range #1 (W1): pc_fib ϵ [10 20 30 40 50 60]%
  • Wide pc_fib search range #2 (W2): pc_fib ϵ [20 30 40 50]%
  • Narrow pc_fib search range #1 (n1): pc_fib ϵ [10 20]%
  • Narrow pc_fib search range #2 (n2): pc_fib ϵ [30 40]%
  • Narrow pc_fib search range #3 (n3): pc_fib ϵ [50 60]%
As explained in the next subsection, the persistent presence of a Region-Of-Interest (ROI) in the set of X MBI parametric radar images of a given breast is further exploited, to support the association of automatically extracted ROIs with breast lesions and validate their reporting for clinical analysis.

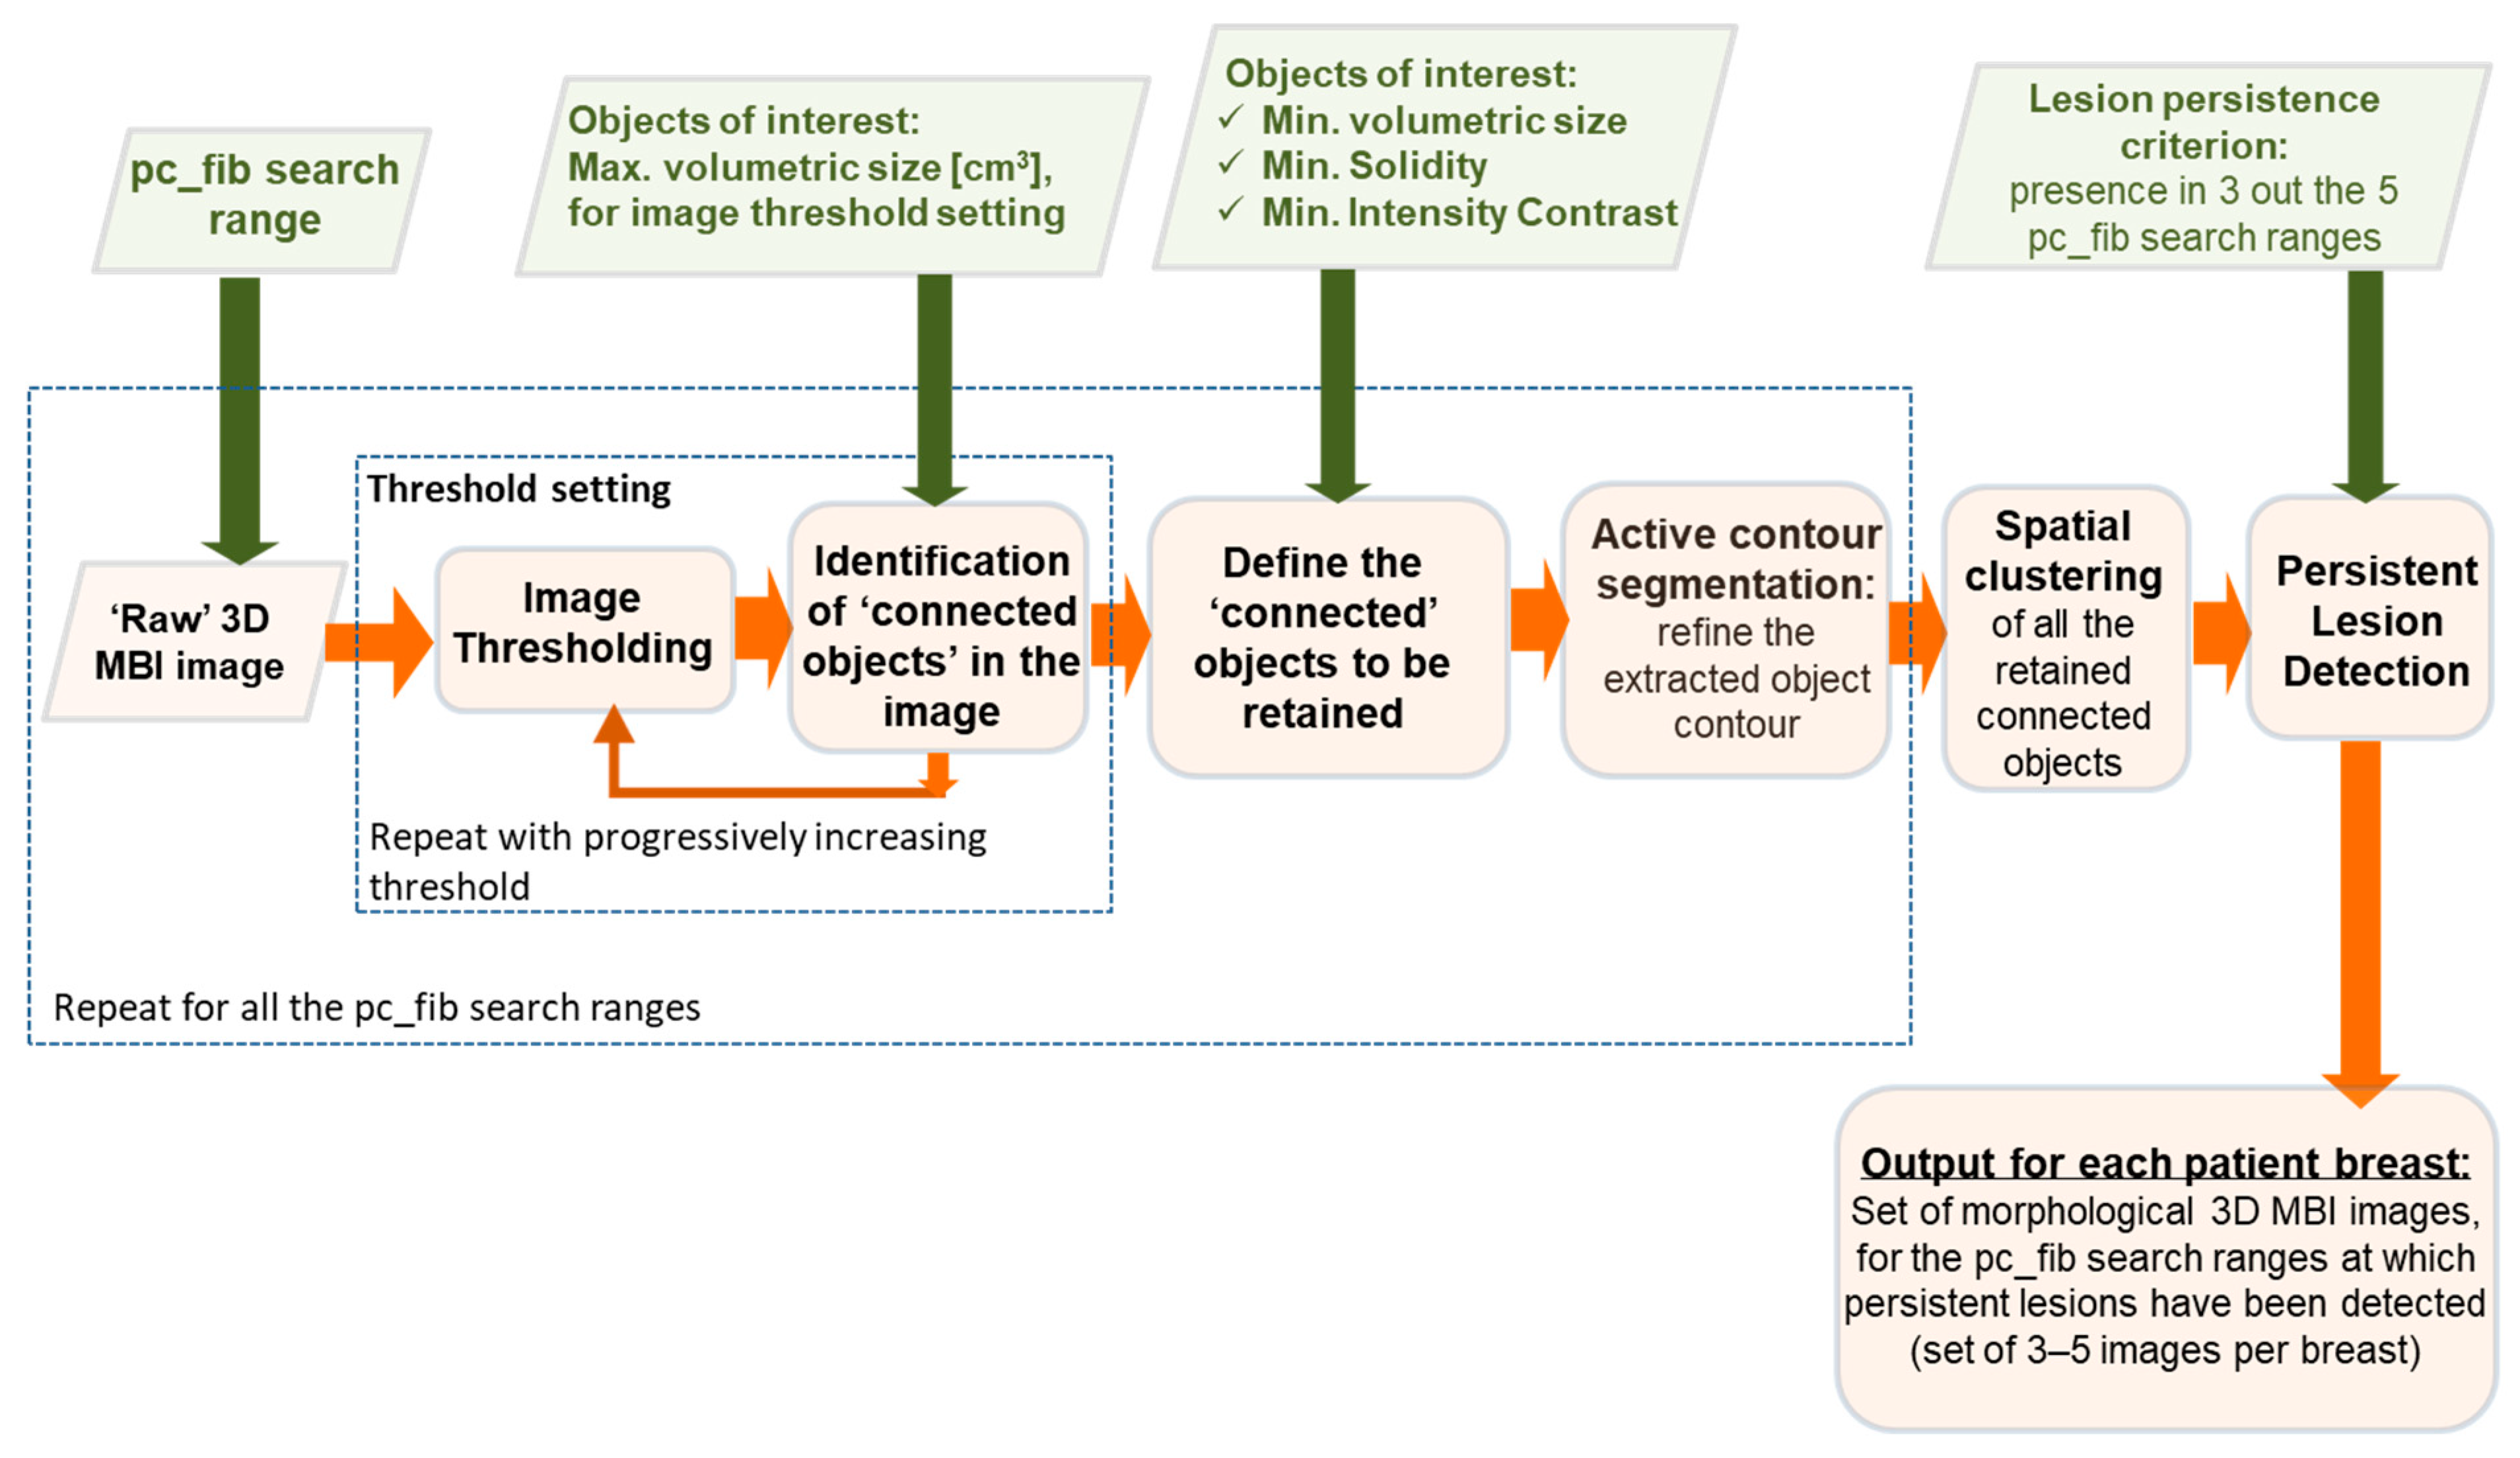
2.2. Morphological MBI Image Post-Processing: Breast Lesion Detection Based on Persistence

Automated breast lesion detection is performed in the Wavelia QIF by means of morphological post-processing of the set of parametric radar images, which are formed with the employment of X = 5 search ranges for the pc_fib parameter. Automated segmentation of ROIs and association, or not, to a breast lesion is based on morphological properties (solidity and volume) of the ROI and its persistence on the set of parametric radar images, which is evaluated by means of spatial clustering. The persistent visibility of a ROI over multiple pc_fib search ranges is indicative of the association of the ROI with a physical object (breast lesion) in the MBI image. On the other hand, the presence of a ROI in the minority of the pc_fib search ranges under test is indicative of it being associated with an imaging artefact. This setting has been inspired by the “breast mass” definition for mammography, as the space-occupying a 3D lesion seen in two different projections [24]. To the authors’ knowledge, no such breast lesion detection method, based on persistence in a set of parametric images carrying redundant information content, has ever been integrated into any of the state-of-the-art MBI systems before. A second novel element of the proposed method is the coupling of morphological properties (solidity) with the notion of persistence to validate a ROI detection.
The automated breast lesion detection method, as designed and integrated into the Wavelia QIF for the FiH clinical investigation of device prototype #1, is outlined below and in the block diagram in Figure 2.
  • Iterative Image threshold setting: The following operation is first-of-all performed to set a threshold for the raw 3D MBI image, with no a priori available on how normal breast tissue is represented in this type of image:
    • Progressive increase in the image threshold, starting from the null threshold,
    • At each iteration, identification of the “connected” objects in the thresholded image,
    • Threshold setting based on the maximal accepted volumetric size of “connected” objects, potentially defining a breast mass in the image (default value 3 cm3, in this implementation).
  • Semi-automated ROI extraction, based on morphological properties: The connected objects to be retained as ROIs, are defined based on a set of user-defined characteristics, including:
    • Volumetric size: all the small objects, of volume inferior to 1 cm3, are removed from the FiH clinical data analysis, considering the status of the Wavelia system prototype #1 in terms of minimum size of detectable lesions.
    • Solidity: this structural feature measures the density (or convexity) of an object. A measure of solidity can be obtained as a ratio of the volume of the object to the volume of a convex hull of the object. A value of 100% indicates a solid object, and a value less than 100% indicates an object having an irregular boundary or containing holes. All connected objects with solidity >30% have been ultimately retained, for the data analysis of the FiH clinical investigation of Wavelia.
    • Intensity Contrast: In case of ambiguity (i.e., multiple connected objects to be retained in a single 3D MBI image, based on the volume and solidity criteria), each connected object is retained as ROI, only if it is associated with the maximal intensity in the image and is minimally contrasted (by at least 5%) against the intensity of all the “competing” connected objects in the image.
  • Refinement of the ROI segmentation: An Active Contour segmentation module (Chan-Vese algorithm for segmentation without edges [25]) has been configured and employed to refine the contour of the extracted ROIs, in order to enable a more valid characterization of the lesions in terms of shape and texture, as defined in the following sub-section. This module may have a critical impact, especially in the case of small lesions, which are low contrasted against the background healthy breast tissue.
  • Spatial clustering of the ROIs which have been extracted on the set of X MBI images, formed with varying pc_fib search ranges, is performed. In the current implementation of the Wavelia QIF, the Euclidean distance between the centroids of two ROIs is required to be shorter than dR = 1 cm for the ROIs to be associated with the same lesion in the breast.
  • Persistence over varying pc-fib search range: Five pc-fib search ranges (2 wide and 3 narrow) are systematically used during the FiH clinical investigation of Wavelia to generate parametric 3D MBI images of each patient’s breast, as earlier stated. Detection of a breast lesion in a minimum number of parametric images (3 out of the 5 pc_fib search ranges) is required for a ROI to be considered persistent and validated.

2.3. Combination of 3D Shape Descriptors and Texture Features for Breast Lesion Characterization with Microwave Breast Imaging (MBI)

Apart from using reflected microwave energy to reconstruct images of the breast, additional information on the size, shape, and surface texture can be extracted and potentially exploited for discrimination between benign and malignant breast lesions using microwaves [1]. Malignant tumors usually present the following characteristics: irregular and asymmetric shapes, blurred boundaries (lack of sharpness), rough and complex surfaces with spicules or micro-lobules, non-uniform permittivity, and irregular tissue density. Conversely, benign tumors tend to have the following characteristics: well-circumscribed contours, compactness, and a smooth surface. Previous research works on breast lesion characterization/classification with MBI [26,27,28,29,30] considered principally the MBI received signals as input to a classifier, with or without dimensionality reduction. These state-of-the-art research works [26,27,28,29,30] have been based on simulated datasets and/or simplified experimental setups; no evaluation of such methods on patient clinical datasets has been published to date. Among the state-of-the-art MBI prototypes which have been tested on clinical datasets, two of them published studies on breast lesion classification with MBI. Early concept work on the exploitation of the pattern of the frequency-domain Radio-Frequency (RF) responses of the ROIs representing the breast lesions in the MBI image was published in [31] for the MARIA M5 [4] MBI system. For the MammoWave MBI system, machine learning methods were employed with raw received signals in the frequency domain to classify them as healthy or non-healthy responses [32].
In the Wavelia QIF a module is integrated for the characterization of the ROIs which have been prior detected and validated based on morphological properties and their persistence, and thus associated with breast lesions. This module includes the following operations:
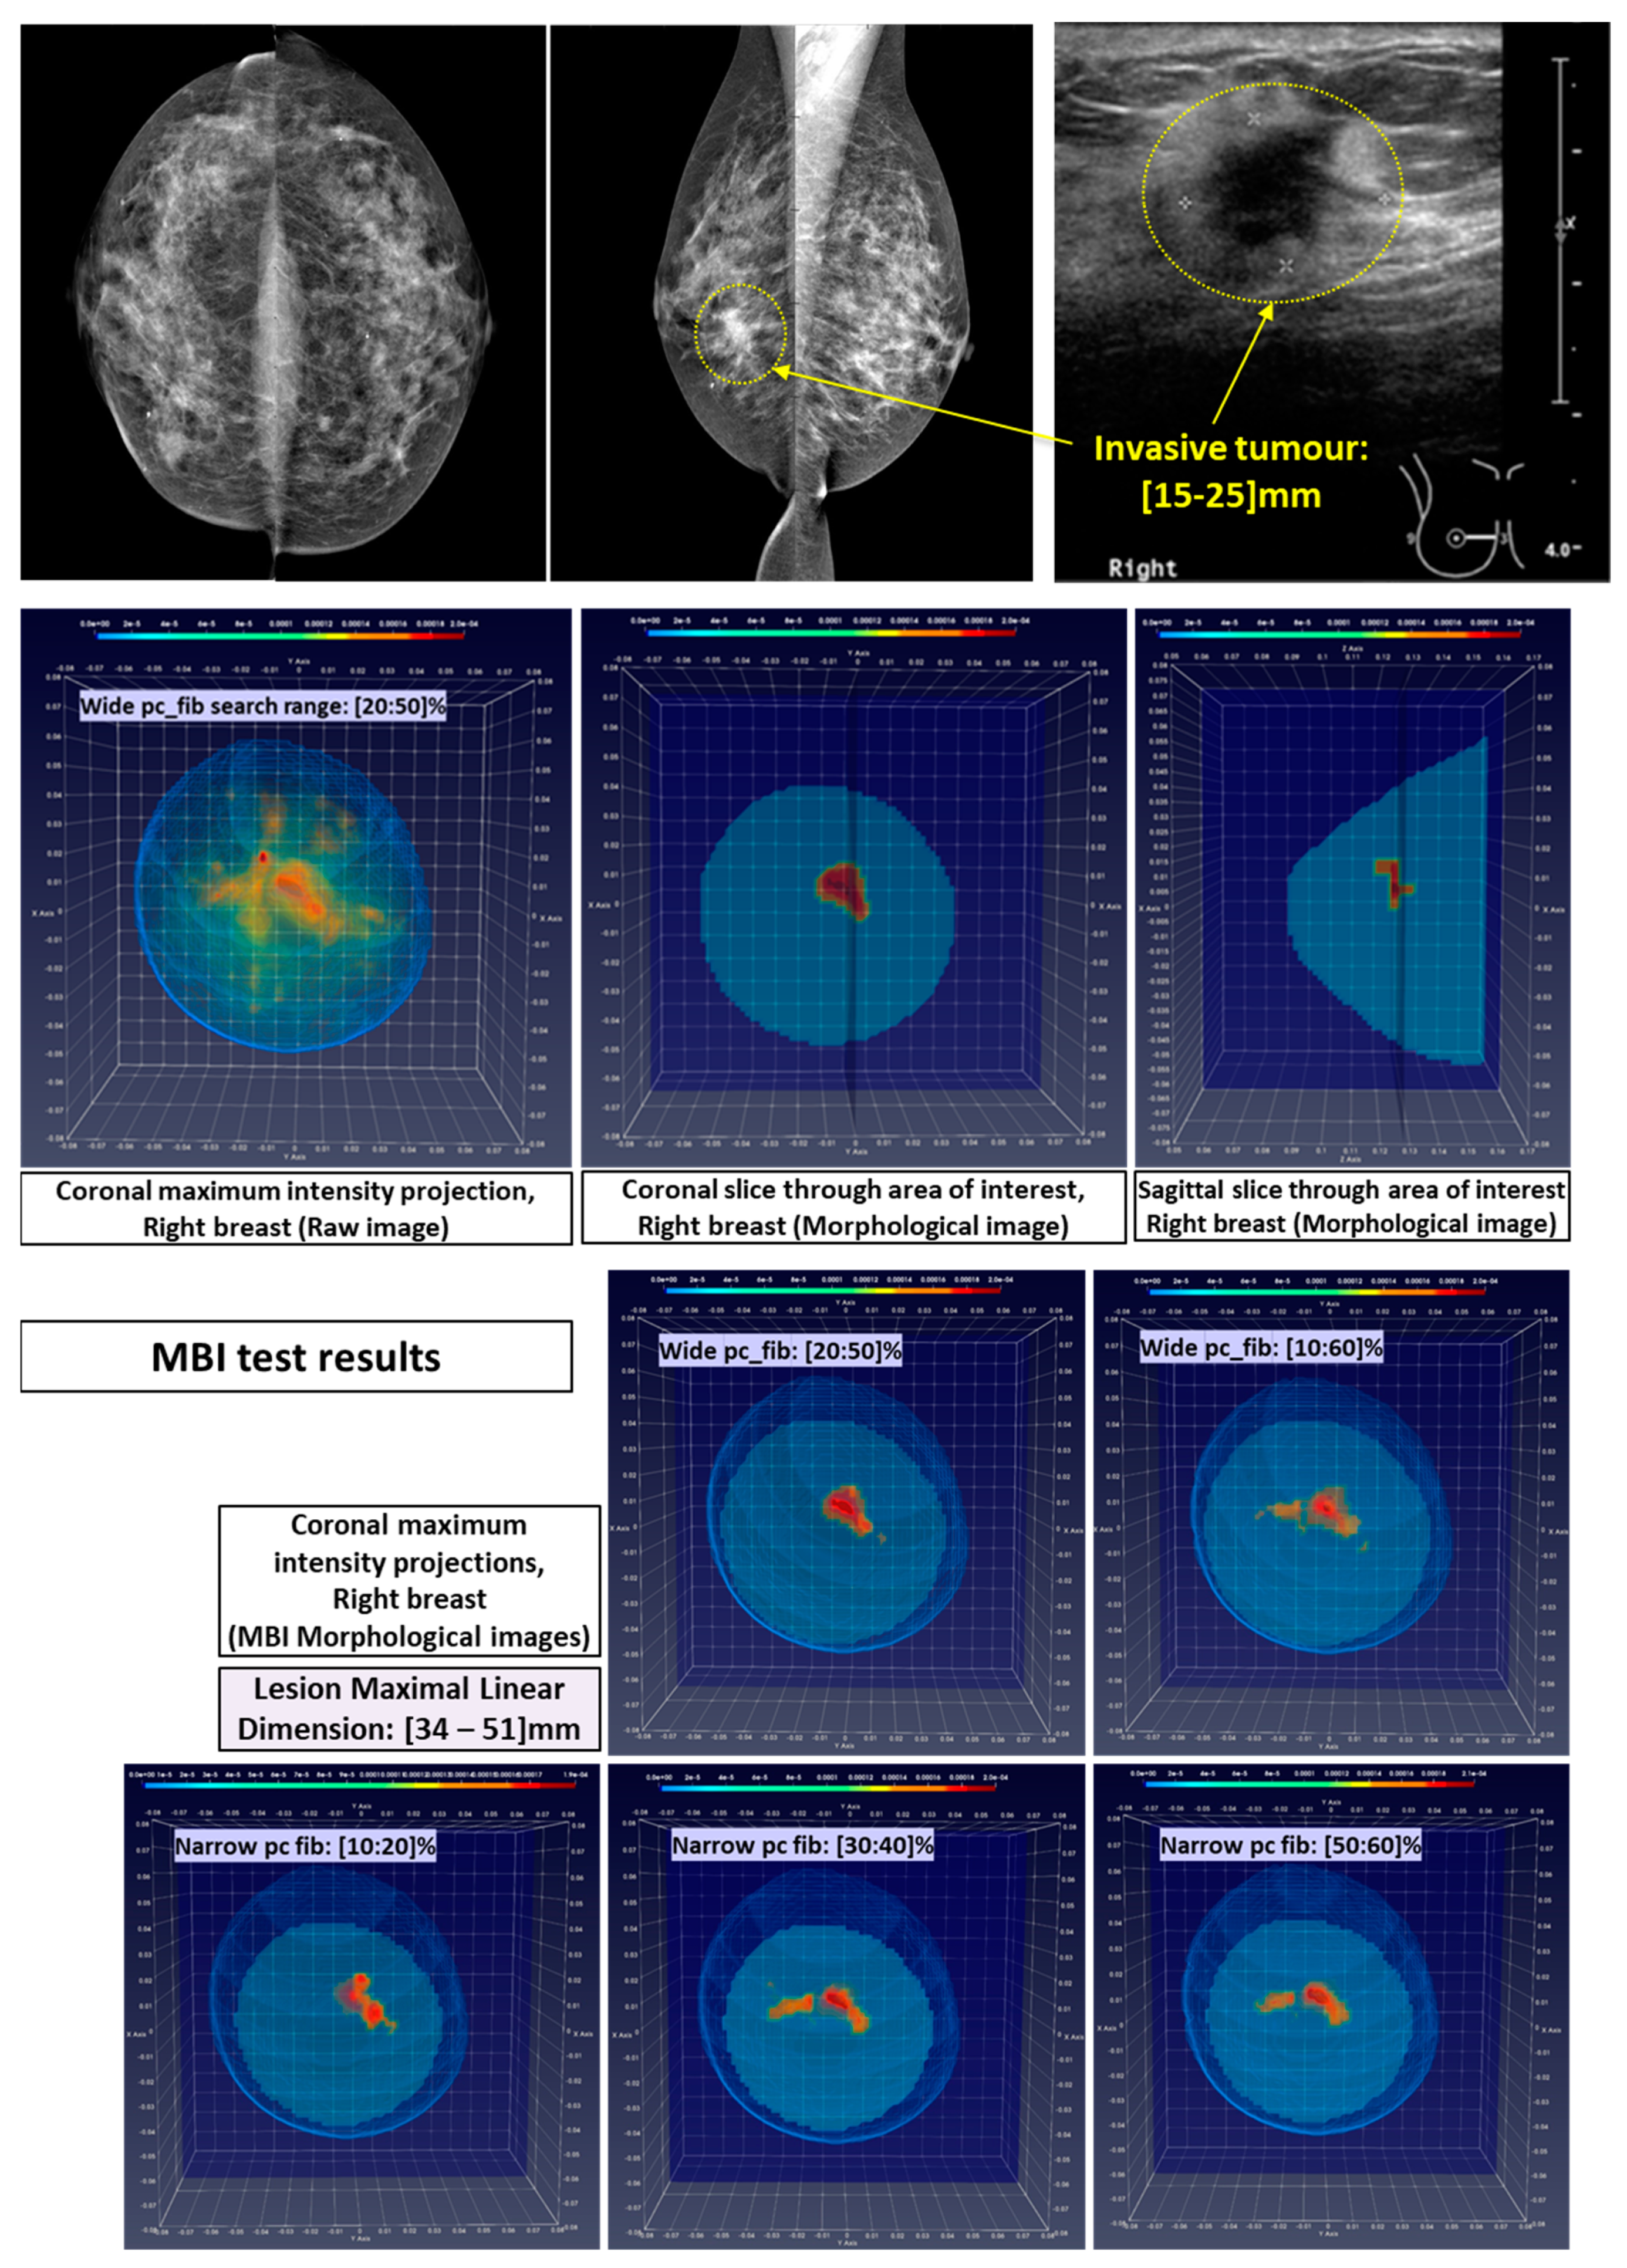
  • Breast Lesion sizing: by means of fitting an ellipsoid to the ROI associated with the persistent lesion detection, in the 3D MBI images that have been generated by applying either of the two wide pc_fib search ranges. The greatest linear dimension of the lesion is defined as the length of the longest axis of the fitted ellipsoid. This definition is compatible with the conventional method that is applied for sizing breast abnormalities based on 2D mammography and ultrasound images [24,33]. During the FiH clinical investigation, the Wavelia MBI system showed promise for measuring lesion size with a more favorable linear trend between MBI and post-surgery histological lesion size, compared to the results obtained for conventional imaging [14]. Two challenging patient cases in terms of breast lesion sizing are indicatively discussed in Results Section 3.2, to better highlight the status of the MBI lesion sizing method, as integrated into the current version of the Wavelia QIF.
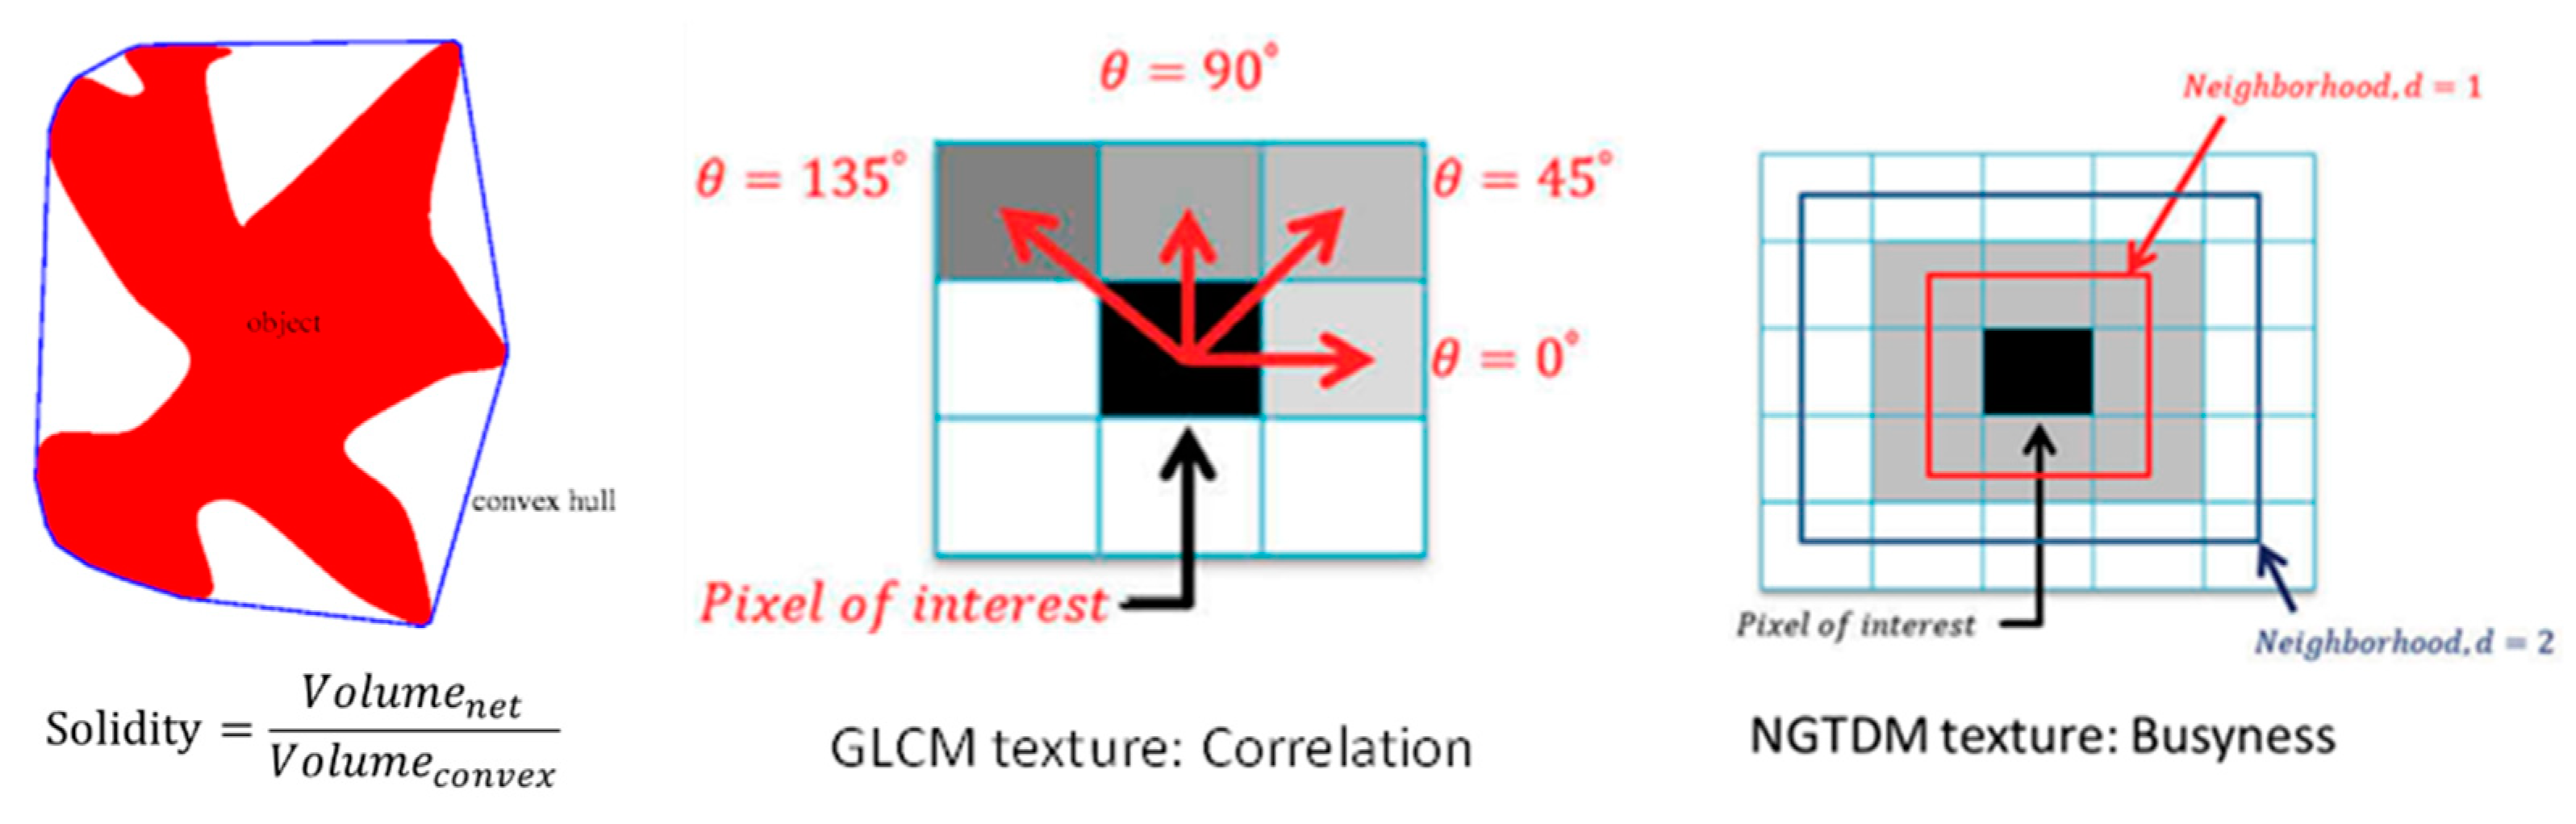
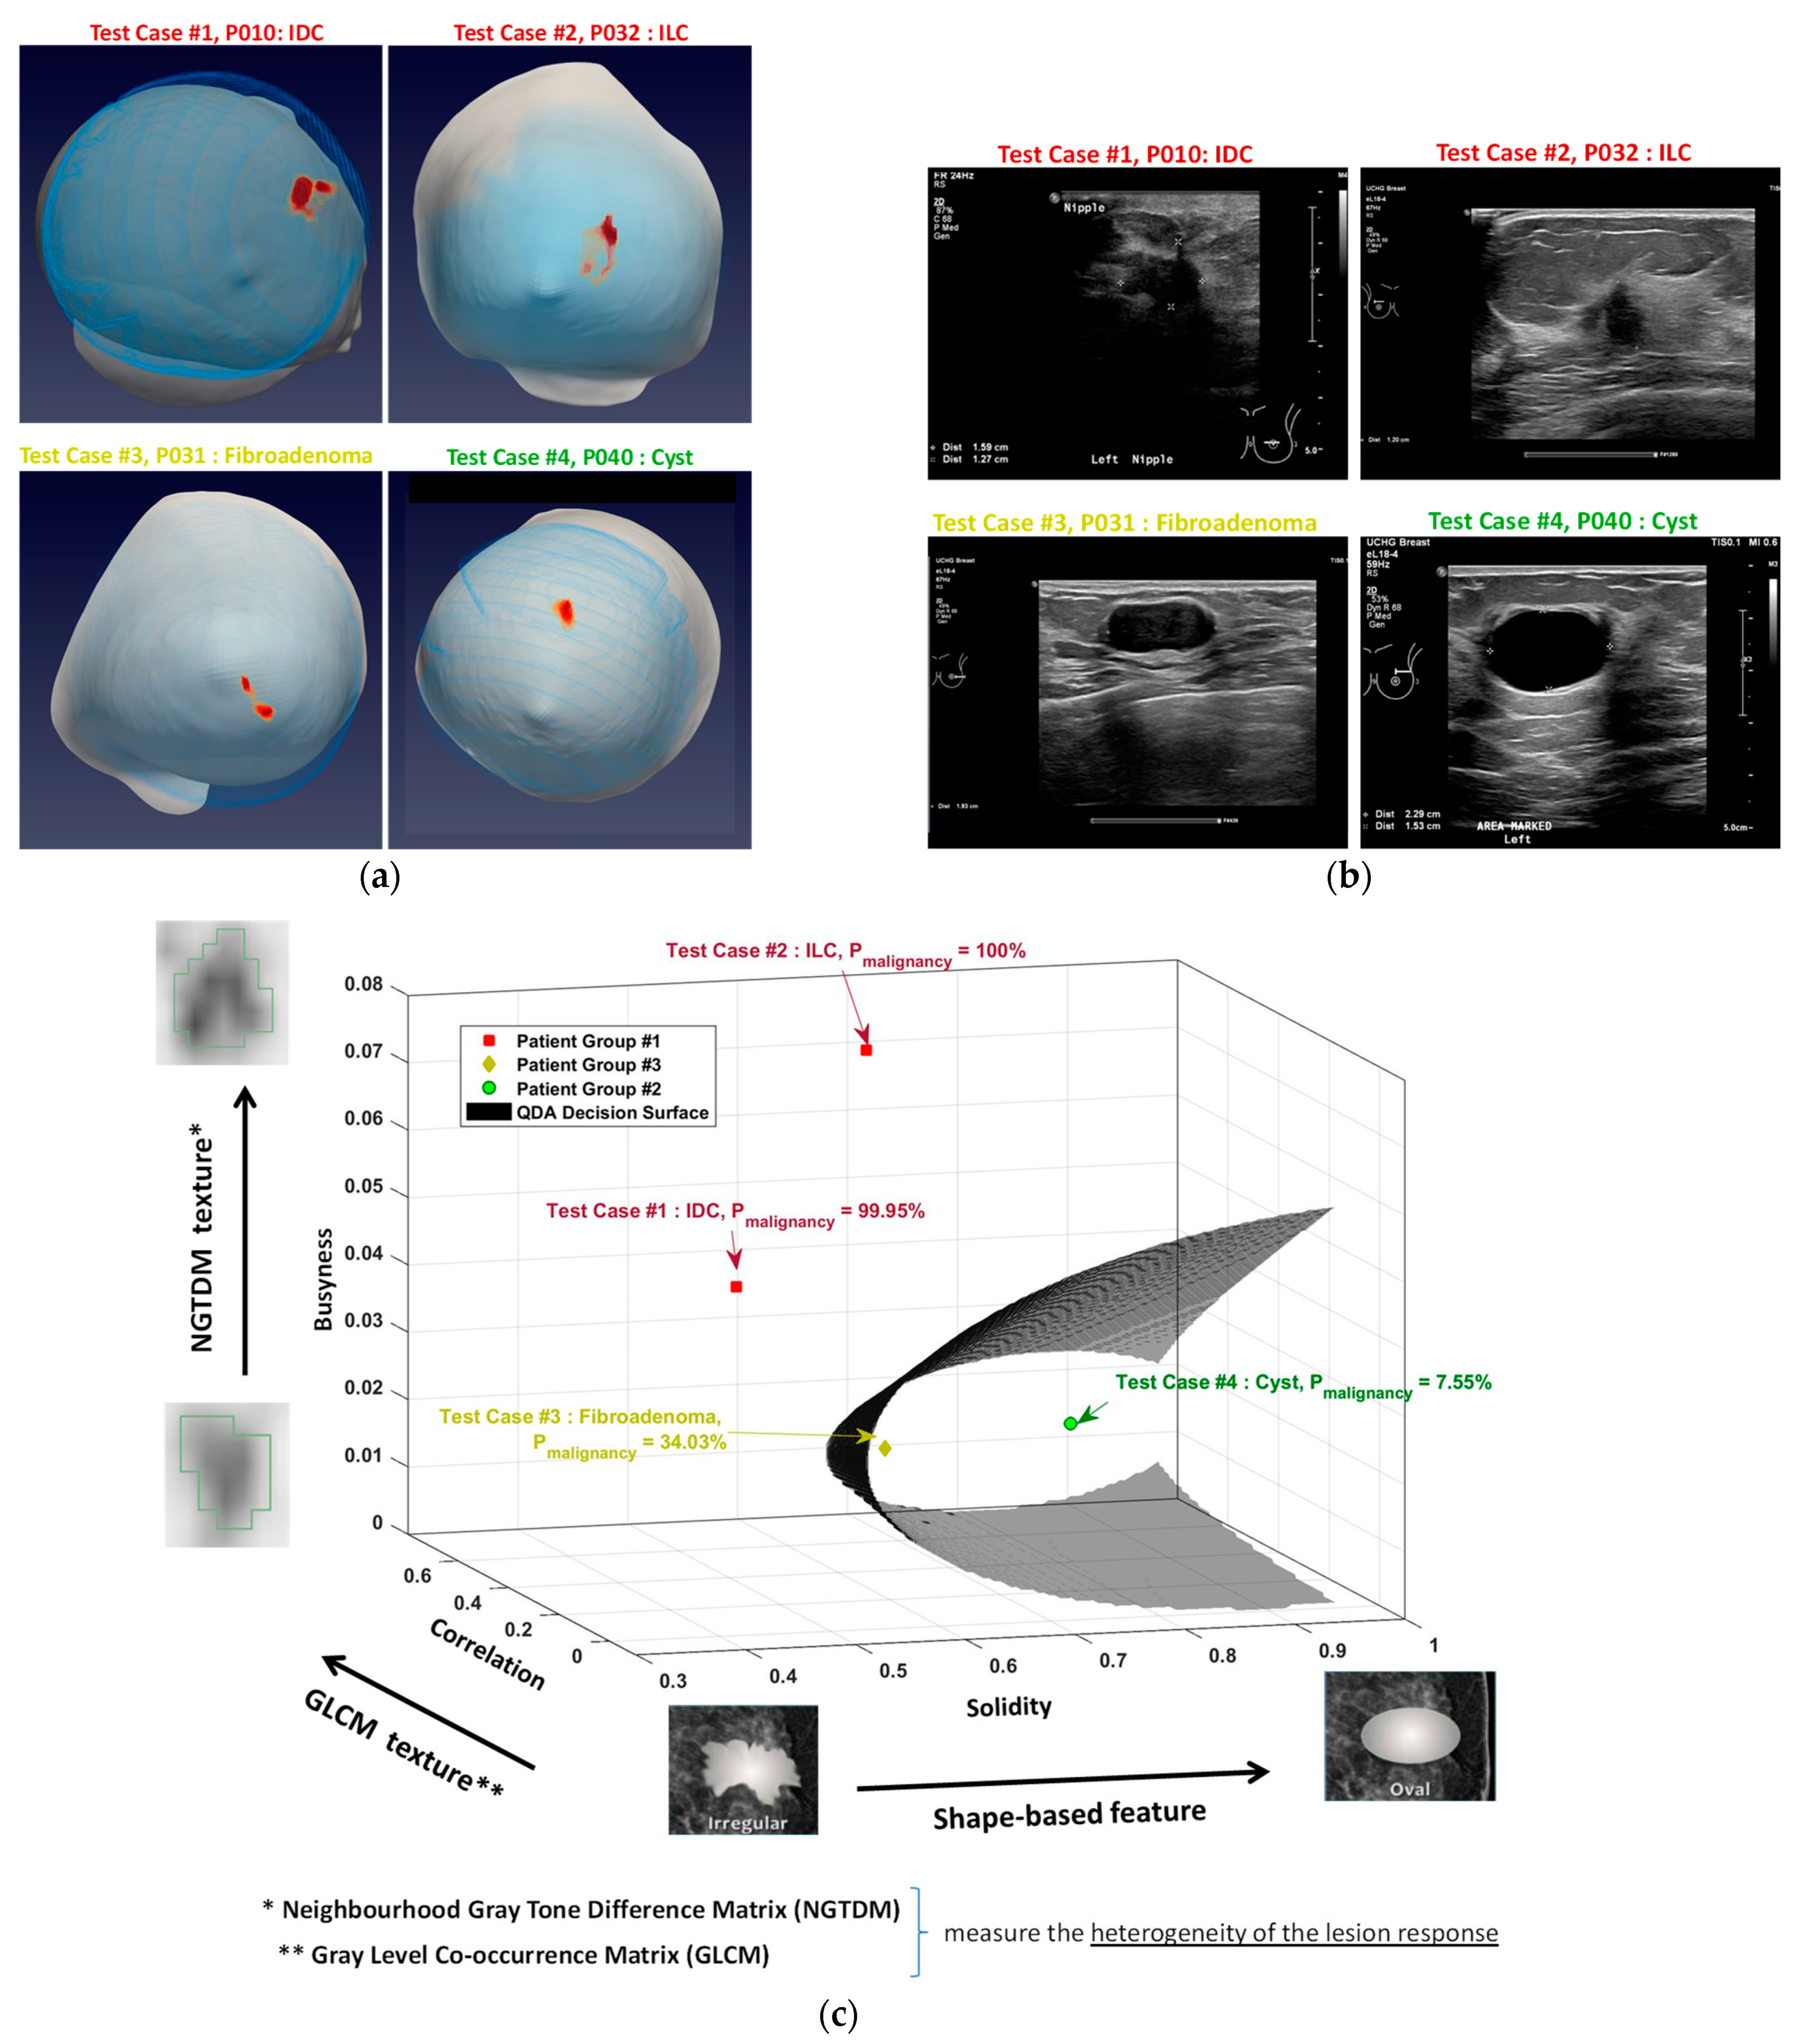
  • Malignant-to-benign Breast Lesion labelling is performed in the Wavelia QIF using a combination of 3 features, extracted from morphologically validated ROIs in the MBI images. The selected features include: a shape descriptor [34], a Gray-Level Co-occurrence Matrix (GLCM) texture feature [35] and a Neighborhood Gray Tone Difference Matrix (NGTDM) texture feature [36]. The 3 features which were selected in the Wavelia QIF implementation for the FiH study of the investigational device are more specifically the following:
    Shape descriptors—Solidity: This feature measures the density, or the convexity, of an object. It is computed as the ratio of the volume of the object to the volume of the convex hull of the object, as illustrated in Figure 3. Breast lesion scoring, in terms of risk for malignancy, is routinely based on visual inspection and evaluation of the shape and margins of the imaged breast lesion, as per BIRADS [24,33]. Shape descriptors have been earlier considered for breast lesion classification with mammography [34,37] and ultrasound [38].
    GLCM texture—Correlation: The GLCM texture features measure the spatial relationship between pixels per specific directions, thus highlighting the properties of uniformity, homogeneity, randomness, and linear dependency of the image [35]. More specifically, the “correlation” feature varies between 0 (uncorrelated) and 1 (perfectly correlated), showing the linear dependency of gray level values to their respective voxels, as graphically illustrated in Figure 3.
    NGTDM texture—Busyness: The NGTDM texture features measure the spatial relationship among three or more pixels neighborhood, closely approaching the human perception of the image [36], as graphically illustrated in Figure 3 More specifically, for the “busyness” feature, a high value indicates a “busy” image, with rapid changes of intensity between pixels and its neighborhood.
Texture-based features have been earlier considered in Radiomics Research for cancerous lesions identification on CT, PET and MRI images [39,40,41]. Breast lesion classification, employing texture features on multi-parametric breast MRI images has also been introduced in the state-of-the-art [42].
In contrast to the Radiomics Research studies, which suggest the employment of high-dimensional feature vectors (typical size > 30) [39,40,41], appropriate feature selection has been considered in the Wavelia QIF, to achieve malignant-to-benign lesion separability in a feature space of low dimensionality. To the authors’ knowledge, no shape-based or texture-based feature extraction from Microwave Breast Images (MBI) has ever been considered in the past.
The 3-dimensional (3-d) lesion feature vector data [Solidity; Correlation; Busyness] is exploited in a malignant-to-benign breast lesion classification framework in the Wavelia QIF. A 2-class discrimination problem is defined, with: (i) Class #1: Malignant breast lesions, and (ii) Class #2: Benign breast lesions. Two classifiers have been trained in this 3-d feature space. The two classifiers, i.e., a Naïve Bayesian (NB) classifier and a Quadratic Discriminant Analysis (QDA) classifier, were selected such that their decision hypersurface partitions the 3-d feature space in two disjoint and continuous manifolds (malignant lesions subspace vs. benign lesions subspace).
In the Wavelia FiH clinical investigation [12], female patients were recruited from the symptomatic unit to one of three groups: Biopsy-proven breast cancers (Group-1), unaspirated cysts (Group-2) and biopsy-proven benign breast lesions (Group-3). For the training of the 2 classifiers:
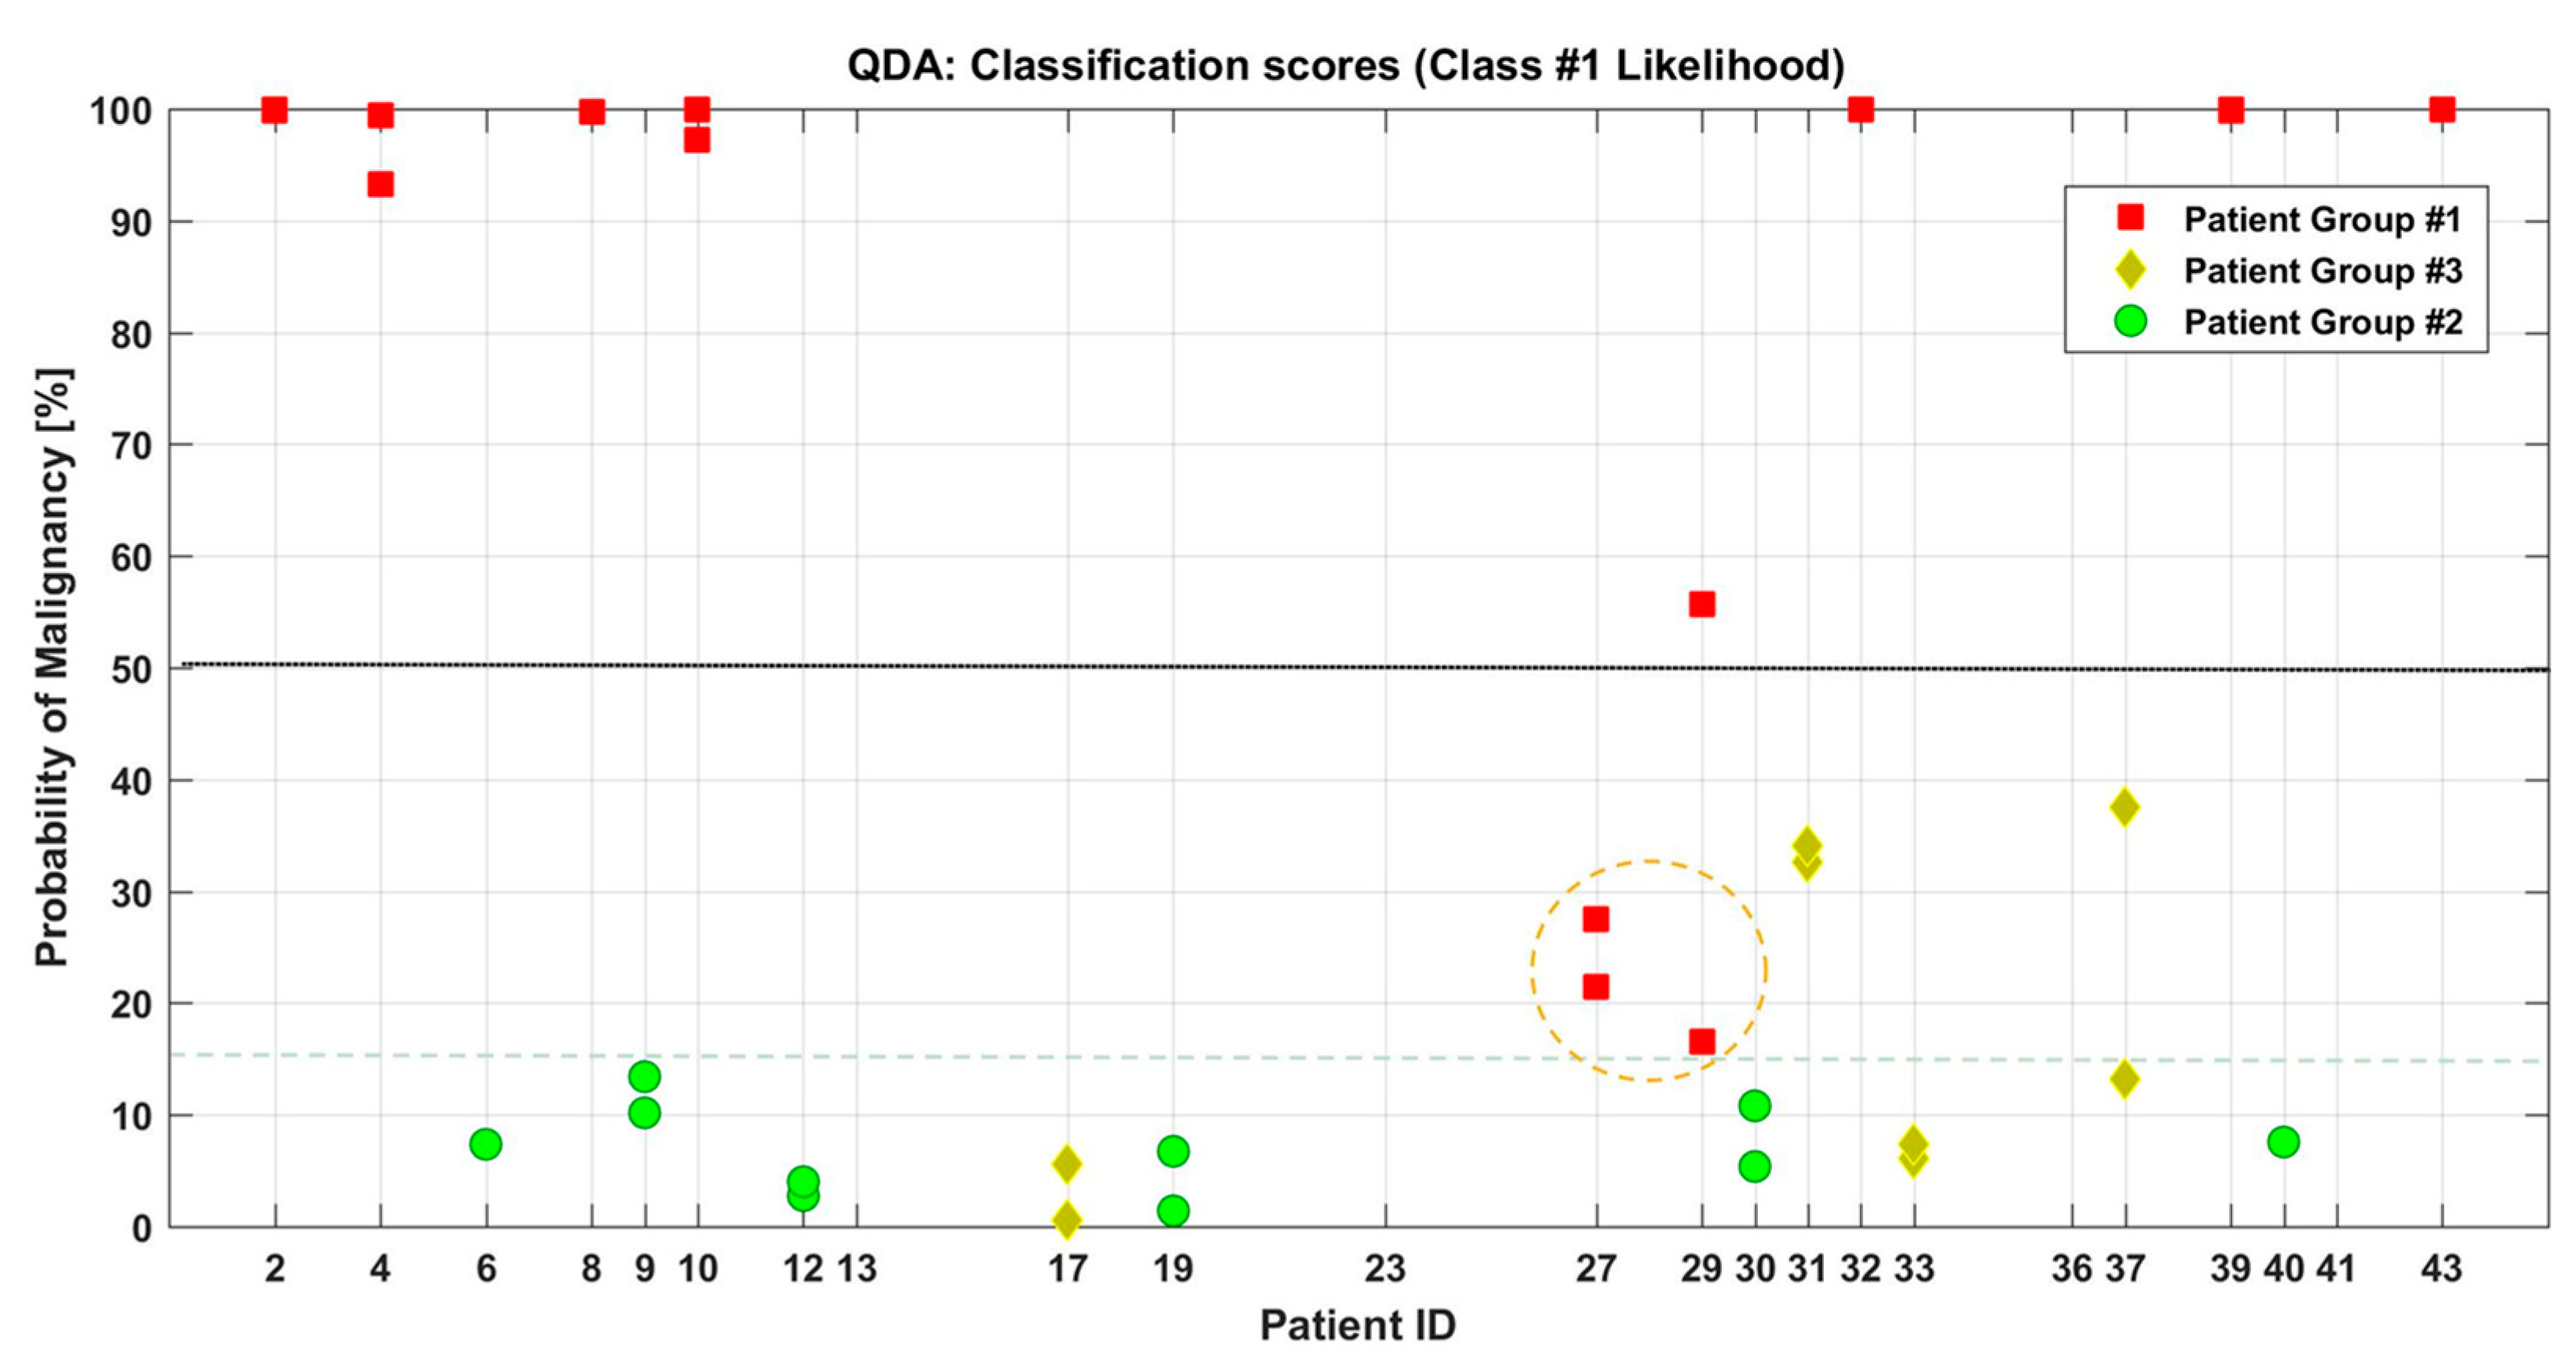
  • The Group-1 patient datasets were labelled as Class #1.
  • The Group-2 and Group-3 patient datasets were labelled as Class #2.
A total of 25 patients underwent MBI in this FiH study. Of these, 24 were included in the final data analysis (11 Group-1, 8 Group-2 and 5 Group-3 patients). The patient who was excluded from the final analysis was a patient who presented with a palpable lump which was determined to be normal breast tissue, and who also had small, scattered, cysts appearing in a different breast quadrant.
Given the small total number of analyzed patients, the number of training data samples which was extracted from each patient dataset equals the number of pc_fib search ranges for which the detection of each breast lesion was morphologically validated based on persistence. This implies that each detected breast lesion was represented by 3–5 points in the 3-d feature space, as depicted in Figure 4c. The confusion matrix and classification loss were estimated for the two trained classifiers by means of 10-fold cross-validation (i.e., 10 partitions of the full dataset in disjoint training and test datasets) to evaluate the potential for discrimination between malignant and benign breast lesions with Wavelia MBI. The confusion matrices and the decision surfaces are shown for the two classifiers in Figure 4a–c. This proof-of-concept FiH patient dataset suggested the good potential for discrimination between malignant and benign lesions in the defined 3-d feature space. The two classifiers demonstrated very comparable performance and associated classification loss 11.5–12.5%, as depicted in Figure 4.

3. Results

3.1. Semi-Automated Breast Lesion Detection Based on Persistence

The Wavelia MBI algorithm for morphological breast lesion detection based on persistence has been specified in the previous section. The lesion persistence is assessed over a set of MBI images that were generated under varying assumptions on the dielectric properties of the healthy tissue of the breast (varying pc_fib parameter search ranges). Lesions that are morphologically detected in at least 3 out of the 5 pc_fib search ranges under evaluation are considered persistent and validated. The principle of the breast lesion detection method is illustrated in Figure 5, Figure 6, Figure 7 and Figure 8 on two indicative patient test cases.
  • Patient 032: Group-1: 54-years old patient with an Invasive Lobular Carcinoma (ILC) of size 30 mm (MRI data) at the 12 o’clock position of the Right Breast. Breast density: BIRADS Category c, Volumetric Breast Density (VBD) = 13.3%.
  • Patient 031: Group 3: 38-years old patient with a Fibroadenoma of size 19 mm (Ultrasound) in the lateral Left Breast. Breast density: BIRADS Category c, VBD = 10.8%.
The achieved persistence level of each breast lesion on MBI may vary depending on the histological type of the lesion and the density of the breast. It is interesting to note that the 30 mm ILC of Patient 032, which was not clearly visible on both mammogram and ultrasound, was persistent at 60% (i.e., 3 out of the 5 raw MBI images formed with the employment of distinct pc_fib search ranges) with MBI. More than a single dominant ROIs were visible on the raw MBI images. In Figure 6, the ROI which was extracted and validated in terms of morphological properties, sufficient intensity contrast against the other competing ROIs in each image and persistence over varying pc_fib search ranges is presented encircled in the 3 out of the 5 raw MBI images in which it was detectable. As illustrated in Figure 7 and Figure 8, the fibroadenoma of Patient 031 was persistent at 100% (i.e., 5 out of the 5 raw MBI images formed with the employment of distinct pc_fib search ranges) and was predominantly visible with MBI. Both patients had comparably dense breasts (P032: VBD = 13.3%, P031, VBD = 10.8%); however, the difference in terms of consistency of the two lesions may have been the principal reason for the distinct level of persistence of the response of the two lesions to MBI. The MBI scan datasets for the two patients have been processed using the same configuration of the Wavelia QIF.
In future upgraded implementations of the Wavelia QIF, both the persistence level over the varying assumption of the dielectric properties of the healthy tissue in the breast (varying pc_fib search ranges), but also the presence of a single dominant ROI or various competing ROIs in the image, may serve to define a confidence level for each MBI lesion detection, to better support the diagnosis.

3.2. Breast Lesion Sizing: Correlation with Conventional Imaging and Post-Surgery Histology

For two of the cancer patients, post-surgery histological analysis of the excised tumor demonstrated total tumor sizes which were much larger than the invasive tumor size. This was the case with Patient 002 and Patient 029, as reported in Table 1. The conventional imaging data (Mammography, Ultrasound) and the MBI imaging test results are depicted in Figure 9 for the case of Patient 002 and in Figure 10 for Patient 029.
It is interesting to observe in Table 1 and in Figure 9 that for the Patient 002 case the MBI lesion size estimate varies considerably depending on the pc_fib search range. Maximal linear dimension [34–51] mm, overestimated against the conventional imaging but better fitting to the total tumor size as confirmed with post-surgery histological analysis of the excised tumor, was retrieved with MBI for this lesion. For a subset of 3 out of the five 5 pc_fib search ranges being systematically evaluated in the Wavelia QIF, the irregularly shaped finding of the MBI system extended over a large volume (maximal linear dimension = 51 mm), including the core of the invasive tumor, as identified at triple assessment. By comparison with the patient’s mammograms, it was deemed reasonable to consider that the Wavelia MBI system detected either the total tumor, or the invasive tumor and a concentration of fibro-glandular tissue adjacent to it. For the second subset of pc_fib search ranges, the size of the MBI detection was smaller, and its location seemed to correlate closely with the invasive tumor site. Due to the uncertainty on the orientation and the deformability of the patient’s breast during the MBI scan, inaccuracies in the 3D reconstruction and localization of the tumor may arise when compared to conventional imaging data. This difficulty is not considered to be MBI-specific though. The registration of multi-modality imaging data of any kind, in the case of soft and deformable organs, like the breast, is a challenging task due to variations in the natural suspended position of the breast in the upright, supine and prone position.
Patient 029 was a patient with very dense breasts (VBD = 15.4%). It is clear in Figure 10 that the delineation of the margins of the tumor was not evident on the mammogram. In the radiology report, the presence of a 20 mm spiculated mass in the lower outer quadrant of the Left breast and calcifications extending anteriorly and medially from the mass and measuring up to (42 mm) × (47 mm) was reported. Ultrasound scan of the Left breast highlighted a 23 mm irregular hypoechoic mass in the lower outer quadrant (concurring with the invasive tumor), and a smaller node of 7 mm with indeterminate appearance, immediately superior to the mass. The total inclusive diameter of both lesions was reported to be 37 mm in the craniocaudal direction, concurring with the total tumor size. MBI highlighted the presence of two persistent ROIs. The two ROIs are clearly visible in the raw MBI image shown in Figure 10. The ROI which was morphologically validated was located in the lower outer quadrant of the breast, had a maximal linear dimension of 24.5 mm and was associated with the invasive tumor in this analysis. The second ROI of volumetric size > 3 cm3 and rather low solidity (≈0.4) was present in the upper breast and could be, interestingly, associated with the extended zone of calcifications, as reported on the patient’s mammogram. In the current version of the Wavelia QIF, the ROI definition is based on the notion of pixel connectivity, thus “discontinuous” constellations such as the one highlighted on ultrasound for this patient case and concurring with the total tumor size (as confirmed with post-surgery histology) could not be revealed. This patient case represents a limitation, which may be addressed in subsequent versions of the Wavelia semi-automated lesion sizing method.

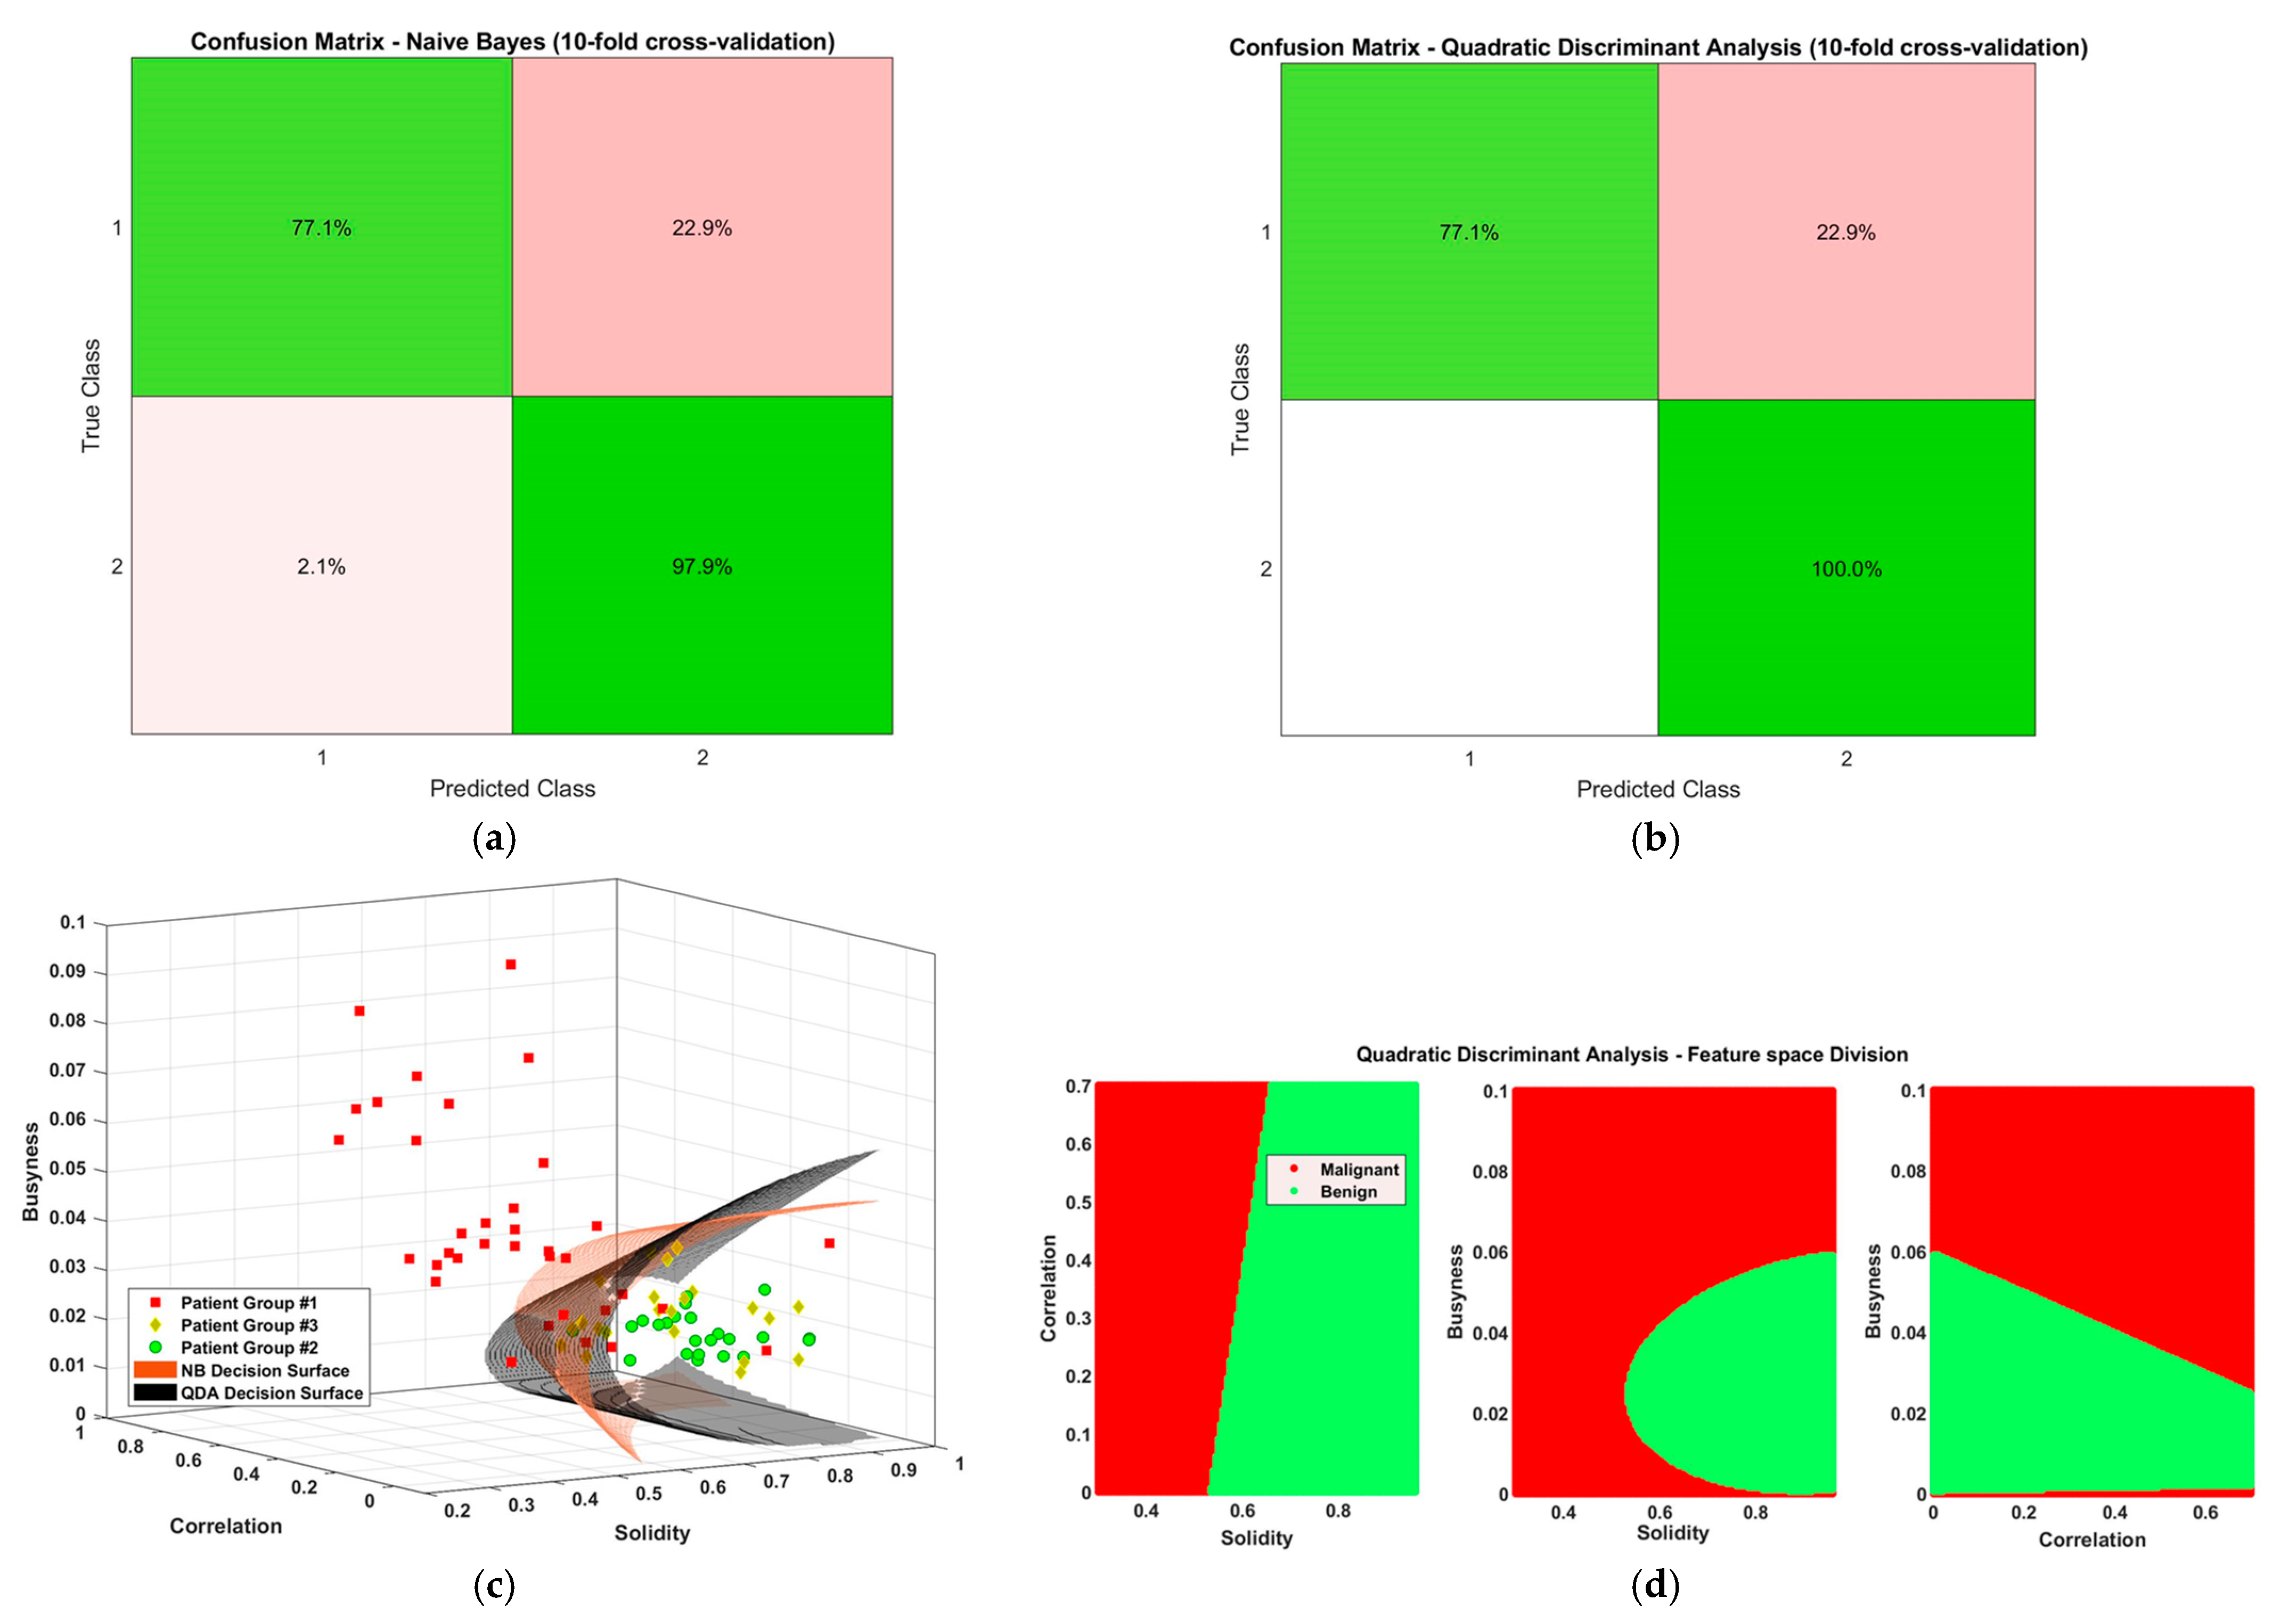
3.3. Discrimination between Malignant and Benign Breast Lesions in a 3-d Feature Space (Shape-Based and Texture-Based Feature Employment)

While three narrow pc_fib search ranges are systematically used, together with the two wide pc_fib search ranges, to analyze the persistence of radar echoes for lesion detection, for the characterization of the detected lesions, i.e., sizing, shape and texture analysis, the wide pc_fib search ranges are mostly adequate to be employed, as they are expected to be associated with the most complete representations of the lesions in the available set of MBI images. In the course of the FiH clinical investigation of Wavelia, mapping of the wide pc_fib search range detections in the 3-d feature space was performed and the posterior probability for each detection to be associated to “Class #1 = Malignant lesion” (i.e., probability of malignancy) was computed, as predicted by the trained QDA classifier.
If a breast lesion was detected and validated in both wide pc_fib search range MBI images, two probabilities of malignancy were reported for the breast lesion, as depicted in Figure 11. The maximal probability of malignancy was ultimately considered to represent a unique MBI classification score for the lesion in the data analysis. Patient 027 was the only Group-1 patient (IDC) for whom the probability of malignancy was inferior to 50%, for both wide pc_fib search ranges. Patient 029 (IDC) was an ambiguous case, with a probability of malignancy 16.5% and 55.7% for the 2 wide pc_fib search ranges, correspondingly. As depicted in Figure 10, this was a patient with very dense breasts, thus rendering the ROI delineation sensitive to the specific parameterization of the MBI morphological detector (Wavelia QIF), in its current version. The probability of malignancy was superior to 95% for all the other Group-1 patients (invasive carcinomas), inferior to 38% for all the Group-3 lesion detections (biopsied benign lesions) and inferior to 14% for all the Group-2 lesion detections (cysts).
In Figure 12, four patient cases are used to illustrate the impact of the three selected features (solidity, correlation, busyness) on the MBI lesion classification score. The MBI morphological images (i.e., ROIs detected and validated based on morphological properties and persistence) are superimposed with the outer surface of the breast, as reconstructed using the auxiliary Wavelia Optical Breast Contour Detection (OBCD) subsystem, in Figure 12a for the four patient test cases. The Wavelia OBCD subsystem which is employed to reconstruct the external surface of the breast with high resolution, based on optical data, was earlier introduced in [12,13,16]. This superposition serves to better highlight the location of the MBI breast lesion detection with reference to the nipple of the breast, which is visible in the OBCD reconstruction. Ultrasound images of the four patient test cases are included in Figure 12b, for a straightforward comparison with the MBI findings, both in terms of the morphology of each lesion and its localization in the breast. Mapping of the four breast lesions (1 IDC, 1 ILC, 1 fibroadenoma and 1 cyst) on the 3-d feature space of Wavelia MBI, together with the QDA decision surface, are shown in Figure 12c. The probability of malignancy, as predicted by the trained QDA classifier, is also annotated for each of the four lesions. The values of the three features and the associated probabilities of malignancy are reported in Table 2. The morphological detection (W1 or W2 pc_fib search range) which was associated with the highest probability of malignancy, has been used to represent each patient test case in Figure 12, and in Table 2.
It is interesting to observe the following:
  • the clear differentiability of the simple cyst (Patient 040) in terms of higher solidity,
  • the fibroadenoma and the two cancerous lesions had similar solidity levels, however clear distinction was achieved between the benign and the two malignant lesions in terms of texture features,
  • both the correlation and the busyness feature values were slightly increased in the case of the malignant lesions, with the increase being more notable on the busyness feature,
  • substantially increased busyness value was associated with more heterogeneous lesion patterns, which may be interpretable as being indicative of distributed non-mass like ILC’s, such as in the Patient 032 case.
This illustration highlights the physical reasoning behind the selection of the three specific features, for benign-to-malignant MBI lesion classification, based on shape and texture in the Wavelia QIF. It also serves to justify the achievable level of separability with this small proof-of-concept FiH dataset, while working with continuous subspace manifolds and very simple classifier models. The potential generalization of the above findings is intended to be confirmed with future clinical investigations, involving larger and more diverse patient datasets. Expansion of the feature space to include additional dimensions (features), supporting the generalization of the above findings on larger patient cohorts, will be also evaluated further during the development of Wavelia.

4. Discussion and Conclusions

In this article, the methodology that was employed in the Wavelia semi-automated Quantitative Imaging Function (QIF) during the FiH clinical investigation of the device, to support morphological breast lesion detection based on persistence, lesion sizing and lesion characterization in a low-dimensional feature space, spanning shape and texture-based features, has been outlined and the critical design parameters highlighted.
Semi-automated breast lesion detection using morphological post-processing of a set of parametric radar images, which are formed with Wavelia MBI under varying assumptions on the dielectric properties of the healthy background tissue of the breast was introduced in the Wavelia QIF. Automated segmentation of ROIs and association, or not, to a breast lesion is based on morphological properties (solidity, volume) of the ROI and its persistence on the set of parametric images, as evaluated based on spatial clustering. The novelty of the proposed method lies in the exploitation of the notion of persistence and its combination with the solidity feature to support validation of ROI detection in MBI images.
A methodology for malignant-to-benign breast lesion discrimination, based on mapping in a low-dimensional feature space, which spans both shape-based features (solidity) and texture-based features (correlation, busyness), and training of a Naïve Bayes (NB) and Quadratic Discriminant Analysis (QDA) classifier was also introduced in the Wavelia QIF. An interesting level of separability between malignant and benign breast lesions was achieved, with a classification loss of 11.5% estimated with 10-fold cross-validation for the trained QDA classifier. This is a result pending to be verified, reproduced, and validated with larger datasets in future clinical investigations of Wavelia. While extensive research work is already published on Radiomics applied to the well-established breast imaging modalities, to our knowledge, it is the first time that shape descriptors and texture-based features are computed for ROIs extracted from MBI images, to support breast lesion characterization and malignant/benign lesion labelling.
In this FiH study, which was conducted in 25 patients, the Wavelia #1 prototype system demonstrated the preliminary potential to detect and discriminate between malignant and benign palpable breast lumps, the imaging procedure had no safety issues and patients reported a favorable experience of the MBI scan. Although the number of subjects included in the FiH study was small and was not intended to permit a clinically meaningful statistical analysis, the promising findings from this study provided initial data to support the valid clinical association of the technology and warranted the preparation of further clinical investigations, with an upgraded prototype version of the Wavelia system (Wavelia #2) and its semi-automated QIF, to progressively address the identified technological challenges. Larger and more diverse patient datasets are needed to validate these findings and delineate the cases where the Wavelia MBI modality may offer a beneficial adjunct to current diagnostic protocols.
For the first conception of the Wavelia QIF and its feasibility testing for the first time in the clinical setting, simplifications were imposed to the FiH data processing for the analysis to become more straightforward. The two most important limitations of this analysis, which are intended to be loosened in future clinical investigations for the Wavelia QIF to become sufficiently realistic and clinically meaningful, are discussed in the two following paragraphs.
Palpable breast lesions larger than 1 cm3 were only considered in the current implementation of the Wavelia QIF. All the objects with a volumetric size inferior to 1 cm3 were excluded and not morphologically validated with the Wavelia QIF. This setting was fixed in accordance with the expected minimum size of the detectable lesion with the first prototype of Wavelia and in order to avoid extreme degradation of the overall specificity of the system.
Detection of a single abnormality zone, which remained persistently contrasted against the surrounding breast tissues, was targeted with the applied MBI imaging algorithm and morphological lesion detector, at this preliminary stage of development, and in the context of the FiH feasibility study of Wavelia. Patients with bilateral breast disease were excluded and the focus was on the detection of a single (the largest) cyst, in the case of patients with multiple cysts in their breasts. This constraint is planned to be loosened in future clinical investigations, while evolving towards more realistic and generalized subsequent phases of the clinical evaluation of the Wavelia QIF.
The MBI scans were performed at least two weeks following the biopsy, in the case of Group-1 (invasive carcinoma) and Group-3 (benign biopsied lesion) patients. The two-week time lapse was considered sufficient to allow healing of the biopsy site in the breast. It is noteworthy though that, in most of these patients, a metallic biopsy clip was placed in their breast, as standard-of-care practice, to mark the tumor site. The size of the biopsy clip was small (~3 mm) compared to the targeted tumor sizes in this study (all palpable lumps), therefore its impact on the MBI images and the associated breast lesion detectability and characterization results were not considered to be significant. However, as the impact of the presence of a biopsy clip has not been characterized so far, future clinical investigations enabling the MBI examination to be performed prior to biopsy will be needed to investigate the impact of the biopsy clip. In this FiH study, there were only two Group-1 patients (P008, P043—both ILC’s) and one Group-3 patient (P017—fibroadenoma) with no biopsy clip placed in their breast prior to the MBI examination and positive MBI findings nevertheless.
Quantitative evaluation, by means of a computable confidence level, is also planned to be implemented in subsequent versions of the Wavelia QIF, such that the imaging system performance can be assessed both in terms of lesion detectability rate and detection confidence level, in the case of various lesion types (solid/liquid, mass-like/non-mass-like, malignant/benign) and different breast density levels. Other factors, such as the breast size, the location of the lesion in the breast (superficial/deep, distance to the chest wall), the size of the lesion, the patient’s age and breast deformability in the scanner, will also be investigated in terms of achievable lesion detectability rate and detection confidence level, as well as malignant-to-benign lesion separability. The assessment of these factors will be only feasible at a pivotal clinical investigation stage, and after sufficient stabilization of the Wavelia MBI scanning system and the associated QIF.

5. Patents

Two patents have been filed resulting from the work reported in this manuscript. The first patent covers the morphological breast lesion detection method, based on persistence, including sectorization of the imaging scene and MBI image reconstruction using multiple pc_fib search ranges. The second patent covers the malignant-to-benign breast lesion discrimination method, based on mapping in a low-dimensional feature space employing both the solidity feature and texture-based features, applied to ROIs extracted from MBI images.

Author Contributions

Conceptualization, A.F., L.D., B.M.M. and M.J.K.; methodology, A.F., L.D. and J.D.G.C.; software, A.F. and J.D.G.C.; validation, A.F., L.D., J.D.G.C.; formal analysis, A.F., B.M.M., L.D., J.D.G.C., S.M.A.E. and M.J.K.; investigation, B.M.M., S.M.A.E. and M.J.K.; resources, L.D., A.F., and M.J.K.; data curation, A.F., B.M.M., J.D.G.C.; writing—original draft preparation, A.F.; writing—review and editing, L.D., J.D.G.C., B.M.M. and M.J.K.; visualization, A.F. and J.D.G.C.; supervision, L.D., A.F. and M.J.K.; project administration, L.D. and A.F.; funding acquisition, L.D. and A.F. All authors have read and agreed to the published version of the manuscript.

Funding

This research received no external funding.

Institutional Review Board Statement

The study was conducted according to the guidelines of the Declaration of Helsinki and approved by the Institutional Review Board (or Ethics Committee) of Galway University Hospital.

Informed Consent Statement

Informed consent was obtained from all subjects involved in the study.

Conflicts of Interest

Authors L. Duchesne, A. Fasoula and J.D. Gil Cano are employed by MVG Industries, the company that has funded this study and is currently conducting clinical investigations of Wavelia, and have a financial interest in the outcome of those clinical investigations. Authors B. M. Moloney, S. M. Abd Elwahab and M.J. Kerin were investigators for the First-in-Human (FiH) clinical investigation of Wavelia and were funded by their institution. The authors declare no conflict of interest.

References

  1. Conceição, R.; Mohr, J.; O’Halloran, M. An Introduction to Microwave Imaging for Breast Cancer Detection; Conceição, R.C., Mohr, J.J., O’Halloran, M., Eds.; Biological and Medical Physics, Biomedical Engineering; Springer International Publishing: Cham, Switerland, 2016; ISBN 978-3-319-27865-0. [Google Scholar]
  2. Gabriel, C. Compilation of the Dielectric Properties of Body Tissues at RF and Microwave Frequencies. Environ. Health 1996. Report N.AL/OE-TR-1996-0037. Available online: http://www.brooks.af.mil/HSC/AL/OE/OER/Title/Title.html (accessed on 18 October 2021).
  3. Campbell, A.M.; Land, D.V. Dielectric properties of female human breast tissue measured in vitro at 3.2 GHz. Phys. Med. Biol. 1992, 37, 193–210. [Google Scholar] [CrossRef] [PubMed]
  4. Shere, M.; Lyburn, I.; Sidebottom, R.; Massey, H.; Gillett, C.; Jones, L. MARIA® M5: A multicentre clinical study to evaluate the ability of the Micrima radio-wave radar breast imaging system (MARIA®) to detect lesions in the symptomatic breast. Eur. J. Radiol. 2019, 116, 61–67. [Google Scholar] [CrossRef]
  5. Sani, L.; Ghavami, N.; Vispa, A.; Paoli, M.; Raspa, G.; Ghavami, M.; Sacchetti, F.; Vannini, E.; Ercolani, S.; Saracini, A.; et al. Novel microwave apparatus for breast lesions detection: Preliminary clinical results. Biomed. Signal Process. Control 2019, 52, 257–263. [Google Scholar] [CrossRef]
  6. Janjic, A.; Cayoren, M.; Akduman, I.; Yilmaz, T.; Onemli, E.; Bugdayci, O.; Aribal, M.E. SAFE: A Novel Microwave Imaging System Design for Breast Cancer Screening and Early Detection—Clinical Evaluation. Diagnostics 2021, 11, 533. [Google Scholar] [CrossRef]
  7. Meaney, P.M.; Kaufman, P.A.; Muffly, L.S.; Click, M.; Poplack, S.P.; Wells, W.A.; Schwartz, G.N.; di Florio-Alexander, R.M.; Tosteson, T.D.; Li, Z.; et al. Microwave imaging for neoadjuvant chemotherapy monitoring: Initial clinical experience. Breast Cancer Res. 2013, 15, R35. [Google Scholar] [CrossRef] [Green Version]
  8. Benny, R.; Anjit, T.A.; Mythili, P. An overview of microwave imaging for breast tumor detection. Prog. Electromagn. Res. B 2020, 87, 61–91. [Google Scholar] [CrossRef]
  9. Moloney, B.M.; O’Loughlin, D.; Abd Elwahab, S.; Kerin, M.J. Breast Cancer Detection—A Synopsis of Conventional Modalities and the Potential Role of Microwave Imaging. Diagnostics 2020, 10, 103. [Google Scholar] [CrossRef] [Green Version]
  10. O’Loughlin, D.; O’Halloran, M.; Moloney, B.M.; Glavin, M.; Jones, E.; Elahi, M.A. Microwave Breast Imaging: Clinical Advances and Remaining Challenges. IEEE Trans. Biomed. Eng. 2018, 65, 2580–2590. [Google Scholar] [CrossRef]
  11. Kwon, S.; Lee, S. Recent Advances in Microwave Imaging for Breast Cancer Detection. Int. J. Biomed. Imaging 2016, 2016, 5054912. [Google Scholar] [CrossRef] [PubMed]
  12. Moloney, B.M.; McAnena, P.F.; Abd Elwahab, S.M.; Fasoula, A.; Duchesne, L.; Gil Cano, J.D.; Glynn, C.; O’Connell, A.; Ennis, R.; Lowery, A.J.; et al. Microwave Imaging in Breast Cancer—Results from the First-In-Human Clinical Investigation of the Wavelia System. Acad. Radiol. 2021. [Google Scholar] [CrossRef] [PubMed]
  13. Fasoula, A.; Duchesne, L.; Gil Cano, J.; Lawrence, P.; Robin, G.; Bernard, J.-G. On-Site Validation of a Microwave Breast Imaging System, before First Patient Study. Diagnostics 2018, 8, 53. [Google Scholar] [CrossRef] [PubMed] [Green Version]
  14. Moloney, B.M.; McAnena, P.F.; Elwahab, S.M.; Fasoula, A.; Duchesne, L.; Gil Cano, J.D.; Glynn, C.; O’Connell, A.; Ennis, R.; Lowery, A.J.; et al. The Wavelia Microwave Breast Imaging system–tumour discriminating features and their clinical usefulness. Br. J. Radiol. 2021. epub ahead of print. [Google Scholar] [CrossRef]
  15. Fasoula, A.; Moloney, B.M.; Duchesne, L.; Cano, J.D.G.; Oliveira, B.L.; Bernard, J.; Kerin, M.J. Super-resolution radar imaging for breast cancer detection with microwaves: The integrated information selection criteria. In Proceedings of the 41st Annual International Conference of the IEEE Engineering in Medicine & Biology Society (EMBC), Berlin, Germany, 23–27 July 2019. [Google Scholar]
  16. Fasoula, A.; Duchesne, L.; Moloney, B.M.; Gil Cano, J.D.; Chenot, C.; Oliveira, B.L.; Bernard, J.-G.; Abd Elwahab, S.M.; Kerin, M.J. Pilot patient study with the Wavelia Microwave Breast Imaging system for breast cancer detection: Clinical feasibility and identified technical challenges. In Proceedings of the 2020 14th European Conference on Antennas and Propagation (EuCAP), Copenhagen, Denmark, 15–20 March 2020. [Google Scholar]
  17. Devaney, A. Super-resolution processing of multi-static data using time reversal and MUSIC. J. Acoust. Soc. Am. 2000. Available online: https://ece.northeastern.edu/fac-ece/devaney/preprints/paper02n_00.pdf (accessed on 18 October 2021).
  18. Sugitani, T.; Kubota, S.; Kuroki, S.; Sogo, K.; Arihiro, K.; Okada, M.; Kadoya, T.; Hide, M.; Oda, M.; Kikkawa, T. Complex permittivities of breast tumor tissues obtained from cancer surgeries. Appl. Phys. Lett. 2014, 104, 253702. [Google Scholar] [CrossRef]
  19. Lazebnik, M.; Popovic, D.; McCartney, L.; Watkins, C.B.; Lindstrom, M.J.; Harter, J.; Sewall, S.; Ogilvie, T.; Magliocco, A.; Breslin, T.M.; et al. A large-scale study of the ultrawideband microwave dielectric properties of normal, benign and malignant breast tissues obtained from cancer surgeries. Phys. Med. Biol. 2007, 52, 6093–6115. [Google Scholar] [CrossRef] [PubMed]
  20. Martellosio, A.; Bellomi, M.; Pasian, M.; Bozzi, M.; Perregrini, L.; Mazzanti, A.; Svelto, F.; Summers, P.E.; Renne, G.; Preda, L. Dielectric Properties Characterization From 0.5 to 50 GHz of Breast Cancer Tissues. IEEE Trans. Microw. Theory Tech. 2017, 65, 998–1011. [Google Scholar] [CrossRef]
  21. Summers, P.E.; Vingiani, A.; Di Pietro, S.; Martellosio, A.; Espin-Lopez, P.F.; Di Meo, S.; Pasian, M.; Ghitti, M.; Mangiacotti, M.; Sacchi, R.; et al. Towards mm-wave spectroscopy for dielectric characterization of breast surgical margins. The Breast 2019, 45, 64–69. [Google Scholar] [CrossRef]
  22. Pertuz, S.; Puig, D.; Garcia, M.A. Analysis of focus measure operators for shape-from-focus. Pattern Recognit. 2013, 46, 1415–1432. [Google Scholar] [CrossRef]
  23. O’loughlin, D.; Krewer, F.; Glavin, M.; Jones, E.; O’halloran, M. Focal quality metrics for the objective evaluation of confocal microwave images. Int. J. Microw. Wirel. Technol. 2017, 9, 1365–1372. [Google Scholar] [CrossRef] [Green Version]
  24. Sickles, E.A.; D’Orsi, C.J.; Bassett, L.W.; Appleton, C.M.; Berg, W.A.; Burnside, E.S. Acr Bi-Rads®Mammography. In ACR BI-RADS®Atlas, Breast Imaging Reporting and Data System; American College of Radiology: Reston, VA, USA, 2013; Volume 5. [Google Scholar]
  25. Chan, T.F.; Vese, L.A. Active contours without edges. IEEE Trans. Image Process. 2001, 10, 266–277. [Google Scholar] [CrossRef] [Green Version]
  26. Chen, Y.; Gunawan, E.; Low, K.S.; Wang, S.C.; Soh, C.B.; Putti, T.C. Effect of Lesion Morphology on Microwave Signature in 2-D Ultra-Wideband Breast Imaging. IEEE Trans. Biomed. Eng. 2008, 55, 2011–2021. [Google Scholar] [CrossRef] [PubMed]
  27. Davis, S.K.; Van Veen, B.D.; Hagness, S.C.; Kelcz, F. Breast Tumor Characterization Based on Ultrawideband Microwave Backscatter. IEEE Trans. Biomed. Eng. 2008, 55, 237–246. [Google Scholar] [CrossRef]
  28. Gerazov, B.; Conceicao, R.C. Deep learning for tumour classification in homogeneous breast tissue in medical microwave imaging. In Proceedings of the IEEE EUROCON 2017-17th International Conference on Smart Technologies, Ohrid, Macedonia, 6–8 July 2017; pp. 564–569. [Google Scholar]
  29. Oliveira, B.; Godinho, D.; O’Halloran, M.; Glavin, M.; Jones, E.; Conceição, R. Diagnosing Breast Cancer with Microwave Technology: Remaining challenges and potential solutions with machine learning. Diagnostics 2018, 8, 36. [Google Scholar] [CrossRef] [PubMed] [Green Version]
  30. Conceição, R.C.; Medeiros, H.; Godinho, D.M.; O’Halloran, M.; Rodriguez-Herrera, D.; Flores-Tapia, D.; Pistorius, S. Classification of breast tumor models with a prototype microwave imaging system. Med. Phys. 2020, 47, 1860–1870. [Google Scholar] [CrossRef]
  31. Doshi, T.; Lyburn, I.; Sidebottom, R.; Gibbins, D. Radio-wave imaging: Frequency response as an aid to lesion characterization. Early concept work. In Proceedings of the Symposium Mammographicum, Liverpool, UK, 8–10 July 2018. [Google Scholar]
  32. Rana, S.P.; Dey, M.; Tiberi, G.; Sani, L.; Vispa, A.; Raspa, G.; Duranti, M.; Ghavami, M.; Dudley, S. Machine Learning Approaches for Automated Lesion Detection in Microwave Breast Imaging Clinical Data. Sci. Rep. 2019, 9, 10510. [Google Scholar] [CrossRef] [Green Version]
  33. Mendelson, E.B.; Böhm-Vélez, M.; Berg, W.A. ACR BI-RADS® Ultrasound. In ACR BI-RADS®Atlas, Breast Imaging Reporting and Data System; American College of Radiology: Reston, VA, USA, 2013. [Google Scholar]
  34. De Brito Silva, T.F.; de Paiva, A.C.; Silva, A.C.; Braz Júnior, G.; de Almeida, J.D.S. Classification of breast masses in mammograms using geometric and topological feature maps and shape distribution. Res. Biomed. Eng. 2020, 36, 225–235. [Google Scholar] [CrossRef]
  35. Haralick, R.M.; Shanmugam, K.; Dinstein, I. Textural Features for Image Classification. IEEE Trans. Syst. Man. Cybern. 1973, SMC-3, 610–621. [Google Scholar] [CrossRef] [Green Version]
  36. Amadasun, M.; King, R. Textural features corresponding to textural properties. IEEE Trans. Syst. Man. Cybern. 1989, 19, 1264–1274. [Google Scholar] [CrossRef]
  37. Safdarian, N.; Hedyezadeh, M. Detection and Classification of Breast Cancer in Mammography Images Using Pattern Recognition Methods. Multidiscip. Cancer Investig. 2019, 3, 13–24. [Google Scholar] [CrossRef]
  38. Sadad, T.; Hussain, A.; Munir, A.; Habib, M.; Ali Khan, S.; Hussain, S.; Yang, S.; Alawairdhi, M. Identification of Breast Malignancy by Marker-Controlled Watershed Transformation and Hybrid Feature Set for Healthcare. Appl. Sci. 2020, 10, 1900. [Google Scholar] [CrossRef] [Green Version]
  39. Vallières, M.; Freeman, C.R.; Skamene, S.R.; El Naqa, I. A radiomics model from joint FDG-PET and MRI texture features for the prediction of lung metastases in soft-tissue sarcomas of the extremities. Phys. Med. Biol. 2015, 60, 5471–5496. [Google Scholar] [CrossRef] [PubMed]
  40. Parekh, V.; Jacobs, M.A. Radiomics: A new application from established techniques. Expert Rev. Precis. Med. Drug Dev. 2016, 1, 207–226. [Google Scholar] [CrossRef] [PubMed] [Green Version]
  41. Coroller, T.P.; Grossmann, P.; Hou, Y.; Rios Velazquez, E.; Leijenaar, R.T.H.; Hermann, G.; Lambin, P.; Haibe-Kains, B.; Mak, R.H.; Aerts, H.J.W.L. CT-based radiomic signature predicts distant metastasis in lung adenocarcinoma. Radiother. Oncol. 2015, 114, 345–350. [Google Scholar] [CrossRef] [PubMed]
  42. Parekh, V.S.; Jacobs, M.A. Multiparametric radiomics methods for breast cancer tissue characterization using radiological imaging. Breast Cancer Res. Treat. 2020, 180, 407–421. [Google Scholar] [CrossRef] [Green Version]
Figure 1. Wavelia MBI radar image formation: the critical parameters.
Applsci 11 09998 g001
Figure 2. Wavelia MBI: morphological image post-processing for breast lesion detection based on persistence.
Applsci 11 09998 g002
Figure 3. The 3-d feature vector employed in Wavelia for malignant-to-benign breast lesion discrimination.
Applsci 11 09998 g003
Figure 4. Average confusion matrices for the 2 trained classifiers, estimated with 10-fold cross-validation, (a) NB classifier, (b) QDA classifier, (c) the training dataset and the decision hypersurfaces of the 2 classifiers, (d) Partitioning of the 3-d feature space illustrated with 3 cuts for the QDA classifier.
Applsci 11 09998 g004
Figure 5. Patient 032, ILC in the Right Breast: (a) Bilateral mammogram Cranio-Caudal (CC) view, (b) Bilateral mammogram Medio-Lateral Oblique (MLO) view, (c) Ultrasound scan, Right Breast, (d) MRI scan, bilateral axial image and sagittal image of the Right breast (e) MBI test results, Right Breast.
Applsci 11 09998 g005
Figure 6. Patient 032, Right breast: ILC morphological detection based on persistence, with Wavelia #1 MBI.
Applsci 11 09998 g006
Figure 7. Patient 031, Fibroadenoma in the Left Breast: (a) Bilateral mammogram Cranio-Caudal (CC) view, (b) Bilateral mammogram Medio-Lateral Oblique (MLO) view, (c) Ultrasound scan, Left Breast, (d) MBI test results, Left Breast.
Applsci 11 09998 g007
Figure 8. Patient 031, Left Breast: Fibroadenoma morphological detection based on persistence, with Wavelia MBI.
Applsci 11 09998 g008
Figure 9. Patient 002, Invasive Ductal Carcinoma (IDC) at the 3 o’clock position of the Right breast (Breast density: BIRADS Category c, VBD = 8.5%): Bilateral Mammogram, Ultrasound and MBI test results of the Right Breast.
Applsci 11 09998 g009
Figure 10. Patient 029, IDC in the Left breast (Breast density: BIRADS Category c, VBD = 15.4%): Bilateral Mammogram, Ultrasound Scan and MBI test results of the Left Breast.
Applsci 11 09998 g010
Figure 11. Posterior probability of malignancy (classification score) per patient case in the Wavelia FiH study.
Applsci 11 09998 g011
Figure 12. Breast Lesion Characterization in the Wavelia 3-d feature space—Four illustrative patient test cases: (a) morphologically validated persistent ROI detections with Wavelia MBI, (b) Ultrasound images, (c) mapping in the Wavelia 3-d feature space, probability of malignancy and QDA decision surface.
Applsci 11 09998 g012
Table 1. Breast lesion size: maximal linear dimension [mm].
Patient IDPost-Surgery HistologyMBIConventional Imaging
Invasive
Tumor
Total
Tumor
W1W2Max.MammographyUltrasoundMax.
P0022040513451251525
P029223524.519.824.5203737
Table 2. Wavelia MBI lesion feature values and derived probability of malignancy.
Patient
ID
Lesion
Histological Type
FeaturesProbability of
Malignancy [%]
SolidityCorrelationBusyness
P010Invasive Ductal Carcinoma0.5290.4960.04199.95%
P032Invasive Lobular Carcinoma0.6610.5560.074100%
P031Fibroadenoma0.6430.4030.01834.03%
P040Simple Cyst0.8160.4220.027.55%
Publisher’s Note: MDPI stays neutral with regard to jurisdictional claims in published maps and institutional affiliations.

