Featured Application
Economic sustainability can enhance firms’ competitive strategy and the development of new business opportunities. The economic aspects of sustainability are of key importance to organizations and concern not only firms’ survival efforts but also to base solid grounds to thrive and grow, which can be of interest to a broader audience because it may also concern the value of co-creation through partnerships with the stakeholders.
Abstract
An important part of environmental degradation is caused by the discharge of untreated or mistreated wastewater. The reuse of water is paramount to the National Strategic Plan for the Water Supply and Wastewater Sanitation Sector in Portugal and Spain. Since centralized treatment systems have proved to be inefficient, tackling environmental issues requires a regional approach. Wastewater treatment plants (WWTPs) mitigate environmental impacts and contribute to the financial savings of other firms. However, the literature evaluating WWTPs’ financial performance and economic sustainability is scarce. The implementation of a resource recovery technology depends heavily on economic viability. Thus, this paper analyses the financial sustainability of 222 WWTPs in the Iberian Peninsula by NUTS II regions in 2016–2019 to assess the region with the best performance and financial stability and provide regional policy implications. Using the SABI database, this research encompasses a numerical and narrative analysis of key financial ratios. Results show that firms in Algarve and La Rioja exhibit higher financial sustainability when compared to other regions. Results can foster enhancements in the governance of regulated utilities.
1. Introduction
Water is a limited yet renewable resource of high economic value. Water scarcity can occur due to climatic, hydrological conditions, or excessive demand. Only 3% of the planet’s water is freshwater, and about 1.75% is frozen and trapped in glaciers, polar ice caps, and deep-water tables [1], and less than 0.01% is available for direct consumption on the surface of the continents [2]. At this rate, by 2025, about two-thirds of the planet’s population may not have access to drinking water [3]. Through its 2030 Agenda for Sustainable Development, the United Nations has encouraged the adoption of water desalination and water reuse technologies worldwide [4], namely the Sustainable Development Goal (SDG) 6—Clean water and sanitation. However, investment in resource management has been seriously neglected. An important part of the environmental degradation suffered by the planet is caused by the discharge of untreated or mistreated wastewater [5].
Wastewater contains many types of pollutants, such as biodegradable and non-biodegradable organics, suspended solids, nutrients, heavy metals, pesticides, pathogens, etc. In this context, the elimination of pathogens (viruses, bacteria, and parasites) remains a crucial part of their treatment [6]. Another type of pollutant, hormonal disruptors, includes a wide variety of substances, including drugs, pesticides, plastic product additives, bleaching agents, cleaning agents, etc. [7]. However, wastewater, although apparently easily treated, is generating an increase in eutrophication events, resulting in mass deaths of aquatic organisms, reduction in biodiversity, red tides, etc. [8]. The negative consequences for public health and the environment due to the contamination of water by bacteria, nitrates, phosphates, and solvents in rivers and lakes that flow into the oceans are evident. On the other hand, the increase in drinking water consumption has demanded alternative solutions regarding the supply that increase costs and hinder the maintenance and improvement of treatment services [5]. As a result, resource recovery in the wastewater sector has persisted basically underexplored and embodies a research frontier enticing greater attention in the past decade [9].
Wastewater treatment includes separation of suspended and dissolved solids, oxidation of oxygen-seeking components, neutralization, and removal of toxic substances, as well as the removal of unfixed dyes [10]. Nevertheless, wastewater treatment methods, in addition to being efficient, must be sustainable [11], and although sustainability is often understood as exclusively environmental, the concept includes economic and ethical-social aspects [12].
In Spain, the situation of wastewater treatment and water reuse changed with the Water Law, approved in 1985. A new strategy was initiated regarding pollution control due to numerous stipulations that changed the traditional approach of discharges that were considered [13]. The new approach incorporated in the Water Law was soon changed when Spain joined the European Economic Community (EEC) in 1986 and had to comply with the European normative regarding water quality. Firstly, Spain had to incorporate directives with quality objectives (bathrooms, fish life, pre-drinking, etc.), and next directives of emission standards whose main exponent was the Directive 91/271/EEC concerning urban wastewater treatment. In Spain, large-scale purification began with the National Plan of Sanitation and Water Treatment (1995–2005, PNSD), whose main objective was to abide by the Directive 91/271/EEC. In 2018, Spain was classified as the country with the highest rates of wastewater reuse from the European Union, and it belongs to the top 10 worldwide [13]. Many previously published studies have addressed wastewater treatment from a variety of perspectives. However, studies referring exclusively to wastewater treatment productivity and economic impact are scarce. Upon reviewing all the available literature on the subject, we find that only a few have been published on this subject in Spain [14,15].
In Portugal, companies providing water supply and wastewater sanitation services are designated as managing entities. Its management model can be of the type of direct service provision, delegation of service to a company, or even its concession [16]. For most of the Portuguese population, the complete sanitation system is adopted, from collection in buildings to proper disposal in the receiving water environment, the collection rate is very close to the wastewater treatment index. However, there are important regional asymmetries in terms of water availability [17]. In this context, the implementation of water production systems for reuse is increasingly important as a way of minimizing pressure on water bodies in the country. The reuse of water is part of the planning of water resources in Portugal provided for in the National Strategic Plan for the Water Supply and Wastewater Sanitation Sector [18] that was in force from 2014 to 2020. Thus, although the use of treated wastewater for various purposes is seen as a central axis of sustainable management of water resources, there is not, even in regions of greater water scarcity, a widespread practice of using urban wastewater in Portugal [16]. Centralized treatment systems are inefficient in treating wastewater at reusable levels. Furthermore, it has been reported in the literature (for example, the work of [19]) that large, centralized treatment systems that require more electricity are not a sustainable option due to the intermittent power supply and insecure resources for operation and maintenance. Therefore, wastewater treatment must be performed in a regional context, close to its point of generation. Decentralized approaches allow not only treat wastewater but also allow the reuse of water and nutrients, as well as energy efficiency, as wastewater is rich in nutrients. Wastewater treatment plants (WWTPs) perform the important task of mitigating environmental impacts caused by organizations and households at the end-of-pipe. They focus on the operational environmental performance either regulated by laws, contributing to financial savings, or increasing customer satisfaction [20]. However, the literature so far falls short on evaluating these companies’ own financial performance and economic sustainability. Evaluating the economic sustainability of any business is important because it affects firm survival in the market. Therefore, it compromises the recycling chain necessary for the environmental sustainability of a given economy. In other words, economic viability performs as a substantial barrier to the implementation of a resource recovery technology [21]. On the other hand, the exploration of the system symbioses across neighboring waste generation sites allows tackling the environmental issues faced by the generation of wastewater [21].
In addition, worldwide water scarcity requires the integration of water policy in the circular economy (CE) to improve the quantity and quality of water by promoting its reuse and optimizing the amount of energy, minerals, and chemicals used in the operation of water systems [22]. In this context, a stream of literature estimates the market value of water to drive water savings to a circular paradigm, to improve economic and environmental decision making [23]. However, most small, and medium enterprises (SMEs) face specific challenges, such as access to finance and difficulties implementing the CE [24]. Therefore, the process of the implementation of CE should start by managing change within the organization [25]. This is only feasible if the organization is economically sustainable. Accordingly, the regional agendas aim at identifying opportunities for accelerating and transitioning to more efficient and sustainable use of resources and reconciling together with regional stakeholders [26]. Yet, despite the establishment of the Green Deal by the European Commission in 2019, political progress has been tenuous in terms of achieving long-term sustainability goals [27]. Wastewater policy measures have been primarily guided by considerations of cost efficiency and large-scale infrastructure [28], incapable of preventing excessive water consumption and of supporting the pillars of sustainable development [29]. Furthermore, water is not the major concern in the CE agendas of the member states, unlike materials and waste. Still, in the Iberian Peninsula, the emphasis on water is more evident in political plans when compared to concerns with the land [30].
Thus, the purpose of this paper is to analyze the financial sustainability of wastewater treatment companies in the Iberian Peninsula by NUTS II regions to assess the region with the best performance and financial stability and provide regional policy implications. It is a relevant topic in the actual management research agenda. Hence, this study addresses new insights in this area by correlating wastewater treatment plants’ (WWTPs) financial aspects with circular economy principles and evaluating these companies’ own financial performance and economic sustainability. Evaluating the economic sustainability of any business is fundamental because it affects firm survival in the market. The literature so far falls short in these evaluating studies. The Iberian Peninsula was chosen because this region has some special characteristics, and this research area is less developed in this geographic area [15,16,22] and, to the best of our knowledge, few references are available. The SABI database provides financial reports for 222 Portuguese and Spanish firms during 2016–2019. This research encompasses a numerical and narrative analysis of key financial ratios. The results show that firms in Algarve (Portugal) and La Rioja (Spain) exhibit higher financial sustainability when compared to other regions. In what follows, Section 2 reviews the literature on financial analysis, Section 3 describes the data and methodology, Section 4 exhibits and discusses results, and Section 5 presents the conclusions, limitations, and avenues of future research.
2. Materials and Methods
A firm’s annual accounts, especially income statements and balance sheets, are the most relevant data to analyze the firm’s financial performance. It helps for the assessment of business strengths and weaknesses [31]. Basically, analysts convert data from these statements into financial metrics, ratios that assist in decision making, trying to respond to such questions as: How effectively has the firm performed, relative to its own past performance and/or relative to its competitors? How is the firm liable to perform in the future? Grounded on expectations about future performance, what is the value of this firm?
Accounting information regarding profitability, liquidity, indebtedness, and growth is critical to measuring financial sustainability [32]. Indeed, studies show that firms with relatively lower earnings, negative profits, and larger declines in operating income, high indebtedness, and few probabilities to growth are more likely to experience bankruptcy.
So, the objective of this paper is to analyze the financial sustainability of wastewater treatment companies in the Iberian Peninsula by NUTS II regions to assess the region with the best performance and financial stability and provide regional policy implications.
2.1. Methodology
According to the work of [33], business economic sustainability is classified through its business financial performance, competitiveness, and the economic impact generated by the firm and its stakeholders. This research encompasses a numerical and narrative analysis of key financial ratios to 47 Portuguese firms (active in 2019) operating in the NACE Rev. 2 code 37 and 175 Spanish firms from the same sector from 2016 to 2019. A longitudinal study helps to understand the evolution of a firm’s financial situation, so 4 years of observations were used. We choose to calculate ratios of different groups to achieve an overall picture of the firm’s financial sustainability, namely profitability, liquidity, indebtedness, and growth. All ratios were calculated per firm and per year. In a second step, the software IBM SPSS, version 27, was used for statistical analysis.
Profitability ratio analysis is a suitable approach to measure a firm’s performance because it means the firm’s ability to generate earnings. Firms’ profitability is essential both for shareholders and creditors because profits allow for dividends and funds for covering debts. Examples include return on assets (ROA), return on equity (ROE), cash return on assets, return on debt, return on retained earnings, return on revenue, risk-adjusted return, return on invested capital, and return on capital employed. This paper employs the two first measures, which are the most used: ROA and ROE (e.g., the work of [34,35]).
The ROA is one of the best-known ratios of profitability. It measures the firm’s economic profitability, and it can be used as an indicator of a firm’s efficiency in using its investments to generate profits. The formula is:
Return on Assets (ROA) = Net income/Total Assets
ROA should be positive and the highest as possible since it means that with less investment (total assets), the firm is more able to have profits. Although, if too high may mean that the firm needs to do new investments in fixed assets to continue to grow and follow the market needs.
The ROE measures the firm’s ability to generate profits using shareholders’ investments. It is also known as shareholders return. The calculation formula is as follows:
Return on Equity (ROE) = Net income/Total Equity
This ratio shows how much profit is generated by the monetary unit of shareholders’ equity. In other words, it measures how efficient is the money from shareholders being used for the generation of earnings. In view of this, ROE, as well as ROA, should be positive, and a high value is desirable because that would mean efficiency in the use of investors’ funds.
Liquidity ratios measure firms’ ability to pay off current debt obligations without raising external capital. Examples of liquidity ratios are current ratio, quick ratio, and operating cash flow ratio. This paper uses the current ratio measured as:
Current Ratio = Current Assets/Current Liabilities
This ratio measures a firm’s ability to pay off its current liabilities (payable within one year) with its current assets (cash, accounts receivable, and inventories). It evaluates the coverage of short-term debts in an emergency. The higher the ratio, the better the firm’s liquidity position. Although, if too high may mean that a firm is not doing efficient investments (e.g., high value of trade receivables may lead to bad debts and not to operational cash flows).
Indebtedness ratios allow understanding a firm’s capital structure, being useful to assess long-term financial risk since it provides information about firms’ capacity to fulfill their long-term financial commitments. This paper uses the ratio of leverage, also known as debt ratio. When liabilities finance most of the assets, the firm is considered highly leveraged and is regarded as riskier for lenders. The debt ratio is calculated as:
Debt Ratio = Total Liabilities/Total Assets
This ratio helps investors and creditors to analyze the overall debt burden on the firm as well as the firm’s ability to pay off the debt in the future. The highest the debt ratio, the highest the firm’s risk since it has more obligations to pay back.
To understand the firm’s growth opportunities, the annual growth of sales is calculated. The higher the firm’s sales, the greater the probability of increasing earnings and profits. Moreover, these firms also have more opportunities to do new investments. It is measured as follows:
Growth = (Sales year t − Sales previous year)/Sales previous year
Finally, the value-added ratio (VAR) is calculated as follows. It is a ratio of productivity that shows the efficiency of the firm’s activity. It is calculated as follows:
VAR = Gross value added/Sales
A high value of VAR means that the firm is being more efficient in contributing to GDP. Per unit of sales, the firm is contributing VAR units to add value to the economy.
2.2. Data
The aim of this paper is to analyze and compare firms’ financial sustainability across NUTs II regions, using key financial indicators. For it, firms with the primary code of NACE Rev. 2 code 37—Sewerage from Portugal and Spain were selected in the SABI database, from Bureau van Dijk. After it, in the same database, the firm’s financial reporting was collected. Only private firms and active in 2019 were included. The final sample comprises 47 Portuguese firms and 175 Spanish firms for 4 years (from 2016 to 2019). The last year with available data was 2019. We decide to analyze 4 years of observations to understand the evolution of a firm’s financial situation since a singular year does not provide us insights into its future financial sustainability.
The data is an unbalanced panel, summing 173 and 646 observations to Portugal and Spain, respectively. Table 1 characterizes the sample, showing the firm’s distribution across regions and by size, as well as the number of individuals per km2 (population density). Panel A presents information about Portuguese firms, while panel B presents information about Spanish firms.

Table 1.
Sample characterization.
In Portugal, the northern region concentrates 36.2% of WWTPs, followed by Lisbon with 34% of firms in the sample. The islands (Azores and Madeira) concentrate only 4.2% of firms. Most firms are SMEs (44 out of 47 firms, 93.6% of the sample), which is also most of the Portuguese firms. Large-size firms are only located in Lisbon (4.3%) and in the north (2.1%). Moreover, Lisbon is the capital of Portugal and where most of the individuals concentrated, and it is the 2nd region with the highest representation in the sample. Madeira, while it is the second region with a higher population density, only has one private firm in the sewerage sector.
Regarding Spain, the distribution across regions is more similar. The region of Catalonia concentrates 17.2% of the WWTPs, followed by Andalusia with 13.9%. The smallest regional share is to Cantabria, with 0.6%, followed by Asturias and Extremadura (both with 1.2%). SMEs also prevail in Spain (171 out of 173 firms), with a representation of 98.8% of the total firms. Only in Valencian community and Madrid is one large firm in this sector. Madrid, the capital of Spain, has the highest population density, but it is the 3rd region with the highest regional share of WWTPs. Castilla y León is the region with fewer individuals per km2 and is the 7th region with more firms in the sample. Cantabria is a region with great desertification. The information in Table 1 exhibits regional asymmetries not only in terms of the number of firms in this sector as well as population density, which calls the need to understand the impact of regional differences in a firm’s financial sustainability.
Table 2 shows the mean values of annual accounting information, namely total assets, and total equity (from balance sheet), sales and net income (from income statement), number of employees, and age of the company, per region.
Table 2.
Mean values of main accounting information (annual data) per region.
Analyzing Table 2, the following facts emerge to Portugal: (1) the northern region, in which most of the firms of our sample are located, presents the highest values of total assets, total equity, and sales (in mean). (2) The greater net income (in mean) is in Lisbon, the region with more population density. It is also the region where firms employ more people (69.82). (3) Firms located in Alentejo, Azores, and Madeira have, in mean, losses. Although, these regions have few companies operating in the sewerage sector. Moreover, Alentejo is a region with fewer habitants per square kilometer, and Madeira and Azores are two islands. (4) Azores only have one private firm operating in the sewerage sector, but in the mean is the older firm. Most of the firms in this sector are young firms. (5) Madeira only has one active firm, which was created during the period analyzed. (6) In Alentejo, the number of workers is less than one (0.33 in mean) since the information from the SABI database is that some firms have no employees, which may be because they subcontract services and have other activities.
In Spain, the region of Madrid presents the highest values of total assets, total equity, net income, sales, number of employees, and age (in mean). These facts can be explained due to the population density as well as the existence of a large-size company. In the opposite relation is Cantabria region with the worse financial situation but have only one company operating in this sector.
Comparing the two countries, while in Portugal there are huge differences among regions, in Spain, the difference between the regions with worse and better financial situations is less evident. Moreover, Portuguese firms in some regions have losses (negative net income), while the Spanish counterparts have (in mean) profits. This situation is also evident in the total equity since some Portuguese firms present negative equity, it means, liabilities are not only to finance the firm’s assets (investment), but also the negative equity that results from losses of previous years, and in Spain, there is no evidence of that problem. Finally, Portuguese firms employ in mean more people than Spanish ones.
3. Results
To understand the economic sustainability of this sector, we analyze a set of financial indicators, namely from the group of profitability, liquidity, indebtedness, firm’s growth, and efficiency. Table 3 present the descriptive statistics of the ratios calculated, namely mean, standard deviation, minimum and maximum. As the sample is an unbalanced data sample, the number of observations is different, as not always there was enough information to calculate all financial ratios.
Table 3.
Financial statistics.
According to Table 3, Portugal firms have, in mean, 10.45 years old, being the younger with 0 years (created in the year of analysis) and the oldest with 39 years. This fact suggests that most firms in this sector are young and recently created.
Return on assets (ROA) is in mean positive (0.02), meaning that firms are efficient in managing their investments. However, not all firms have profits, which explain the minimum value of ROA (−2.01). Regarding ROE is also positive in mean (0.11), but there is great dispersion among the sample. The maximum value (ROE = 21.50) is a false positive since the firm has both net income and total equity negative, which means that not only present losses, but it is also in technical bankruptcy. Other firms present negative net income (as shown in Table 2), and therefore a negative ROE.
The current ratio is higher than the unity, suggesting that firms can pay their short-term debts with their current assets. The dispersion among the sample is high, showing great dispersion among firms. The firm’s indebtedness is, in mean, high (90.13%), meaning that liabilities are the main source to finance the firm’s investment (only 10% is equity—own source). This adds additional costs and risks to firms, which in turn decreases their solvency. While some firms do not present liabilities, others are to indebtedness since the maximum value is 4717.80%, indicating that liabilities not only cover total investment (assets) but also the negative equity.
Sales growth is positive (SG = 23.85% in mean), which proves that this sector is growing. Once again, the dispersion among the sample is huge, with some firms with a decrease in sales and others with a great increase. Finally, per unit of sales, firms contribute 0.42 to GDP, which confirms its contribution to the Portuguese economy as well as the firm’s efficiency. However, not all firms contribute to the country’s economic growth (minimum value is negative).
In Spain, in mean firms have 14.10 years old, with the oldest one with 57 years, and some were created during the period analyzed. Even if in mean net income is positive, there are huge differences among the sample, which impact profitability ratios. Both ratios of profitability (ROA and ROE) are in mean negative. While the more profitable firm exhibits a ROA = 1.30, this firm is profitable in that year but has huge losses of previous periods, the less profitable firm has a ROA = −0.33 and not only presents losses but also negative total equity (technical bankruptcy).
Current assets are higher than current liabilities (current ratio), which means that most firms can pay their debts. However, there are huge differences among the sample (the difference between the maximum and the minimum value are huge). The firm’s indebtedness is more than half of total assets (65.66%), but while some firms do not present liabilities, others are to indebtedness since the maximum value is 3063.71%, indicating that liabilities not only cover total investment (assets) but also the negative equity.
In mean, sales are growing every year (SG = 38.10% in mean), but there is great dispersion among the sample. Finally, per unit of sales, firms contribute 0.62 to GDP, which confirms its contribution to the Spanish economy as well as the firm’s efficiency.
Comparing both countries, the older firm in the sewerage industry is in Spain. In mean, Portuguese firms are profitable, but the Spanish ones are not due to huge asymmetries across firms. The current ratio is smaller, and leverage is higher in Portugal, comparing to Spain. Finally, in both countries, in mean, firms’ sales are growing every year, and firms are efficient and contributing to the economy. A firm’s financial sustainability can be different across regions, so we analyze the same ratios by NUTs II regions. The average values for each financial ratio are summarized in Table 4.
Table 4.
Mean values for financial ratios, by NUTs II regions, 2016–2019.
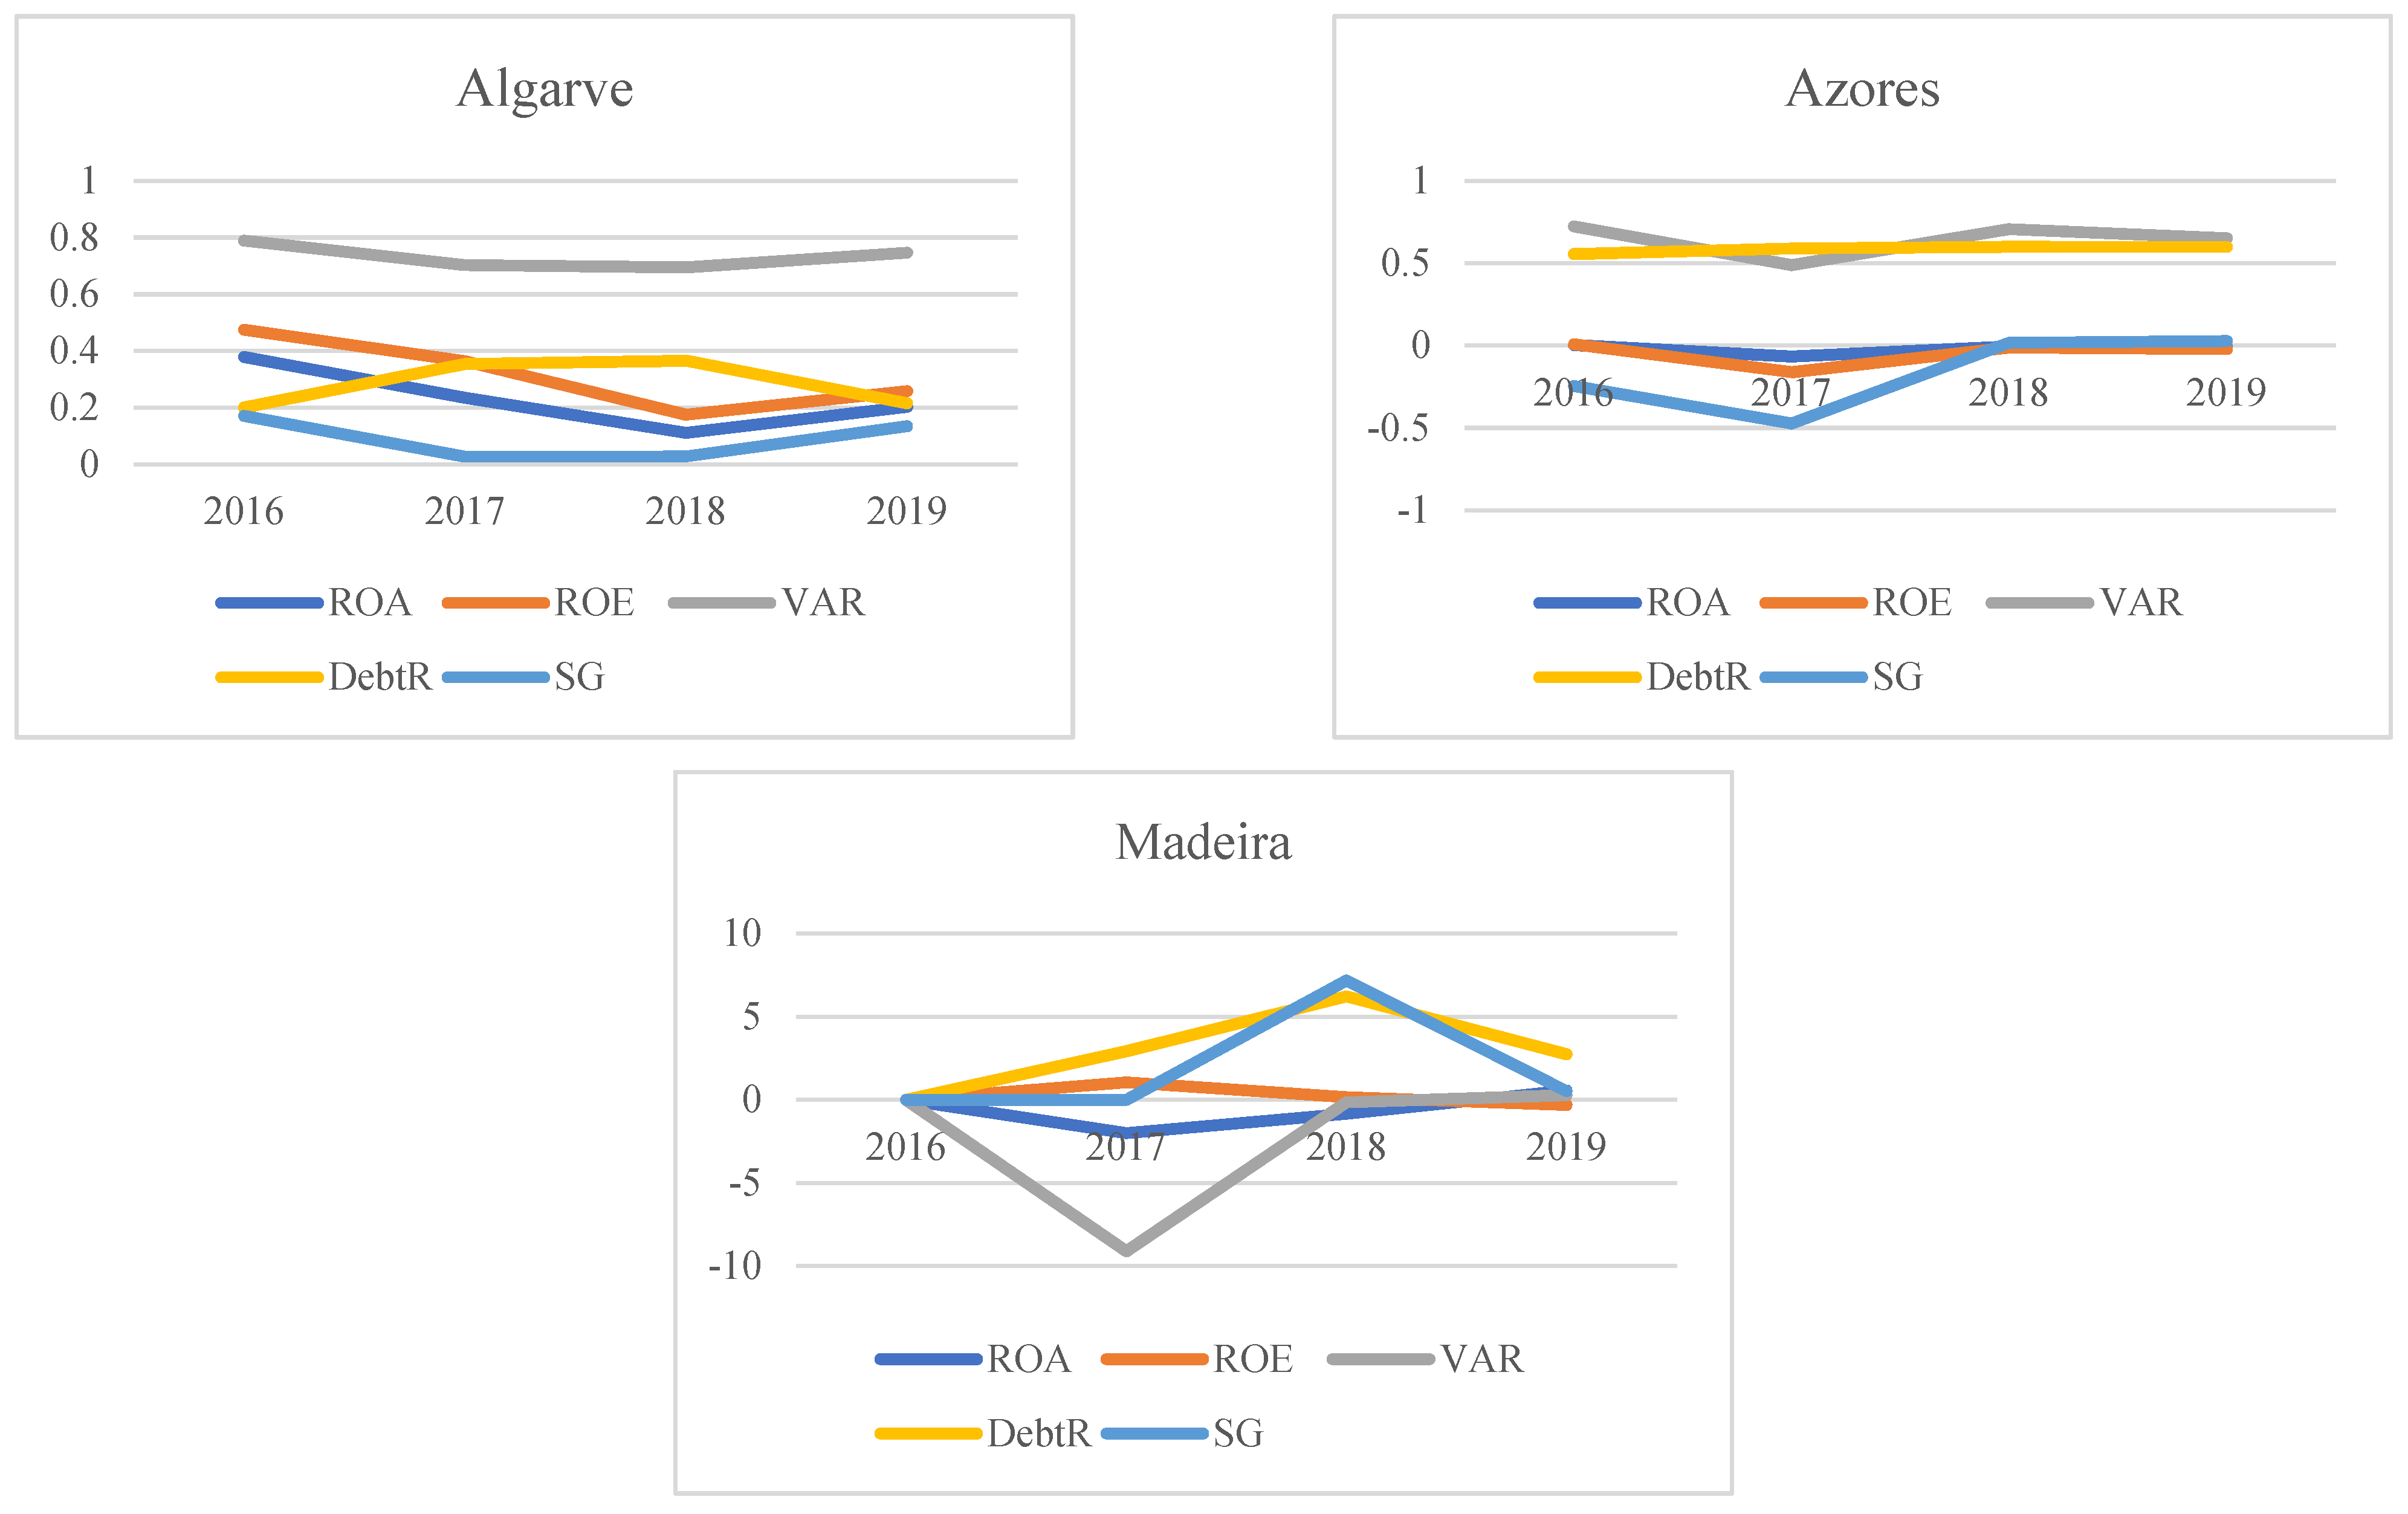
In Portugal, regarding the profitability ratios, regional asymmetries can be observed. The Algarve region shows the best economic performance (ROA = 23.20%) and financial performance (ROE = 31.81%). Although, in this region, there is only one firm in the sample. On the contrary, Madeira presents negative performance, which means, in this region, firms present losses (ROA = −76.90%; ROE = 29.66%, which is a false positive as in mean firms present both net income and total equity negative as presented in Table 2). Madeira, while the second region regarding population density, only has one firm, a young company operating in this sector (in the sample), which can explain these results.
Additionally, even being both regions (Algarve and Madeira) attractive to tourism, their financial situation is quite singular. In mean, all firms from the different regions exhibit liquidity higher than one, which means, have enough current assets to pay short-term debts. The better liquidity is evidence in the northern region (current ratio = 13.09), while Madeira has the smallest safety margin (current ratio = 1.62).
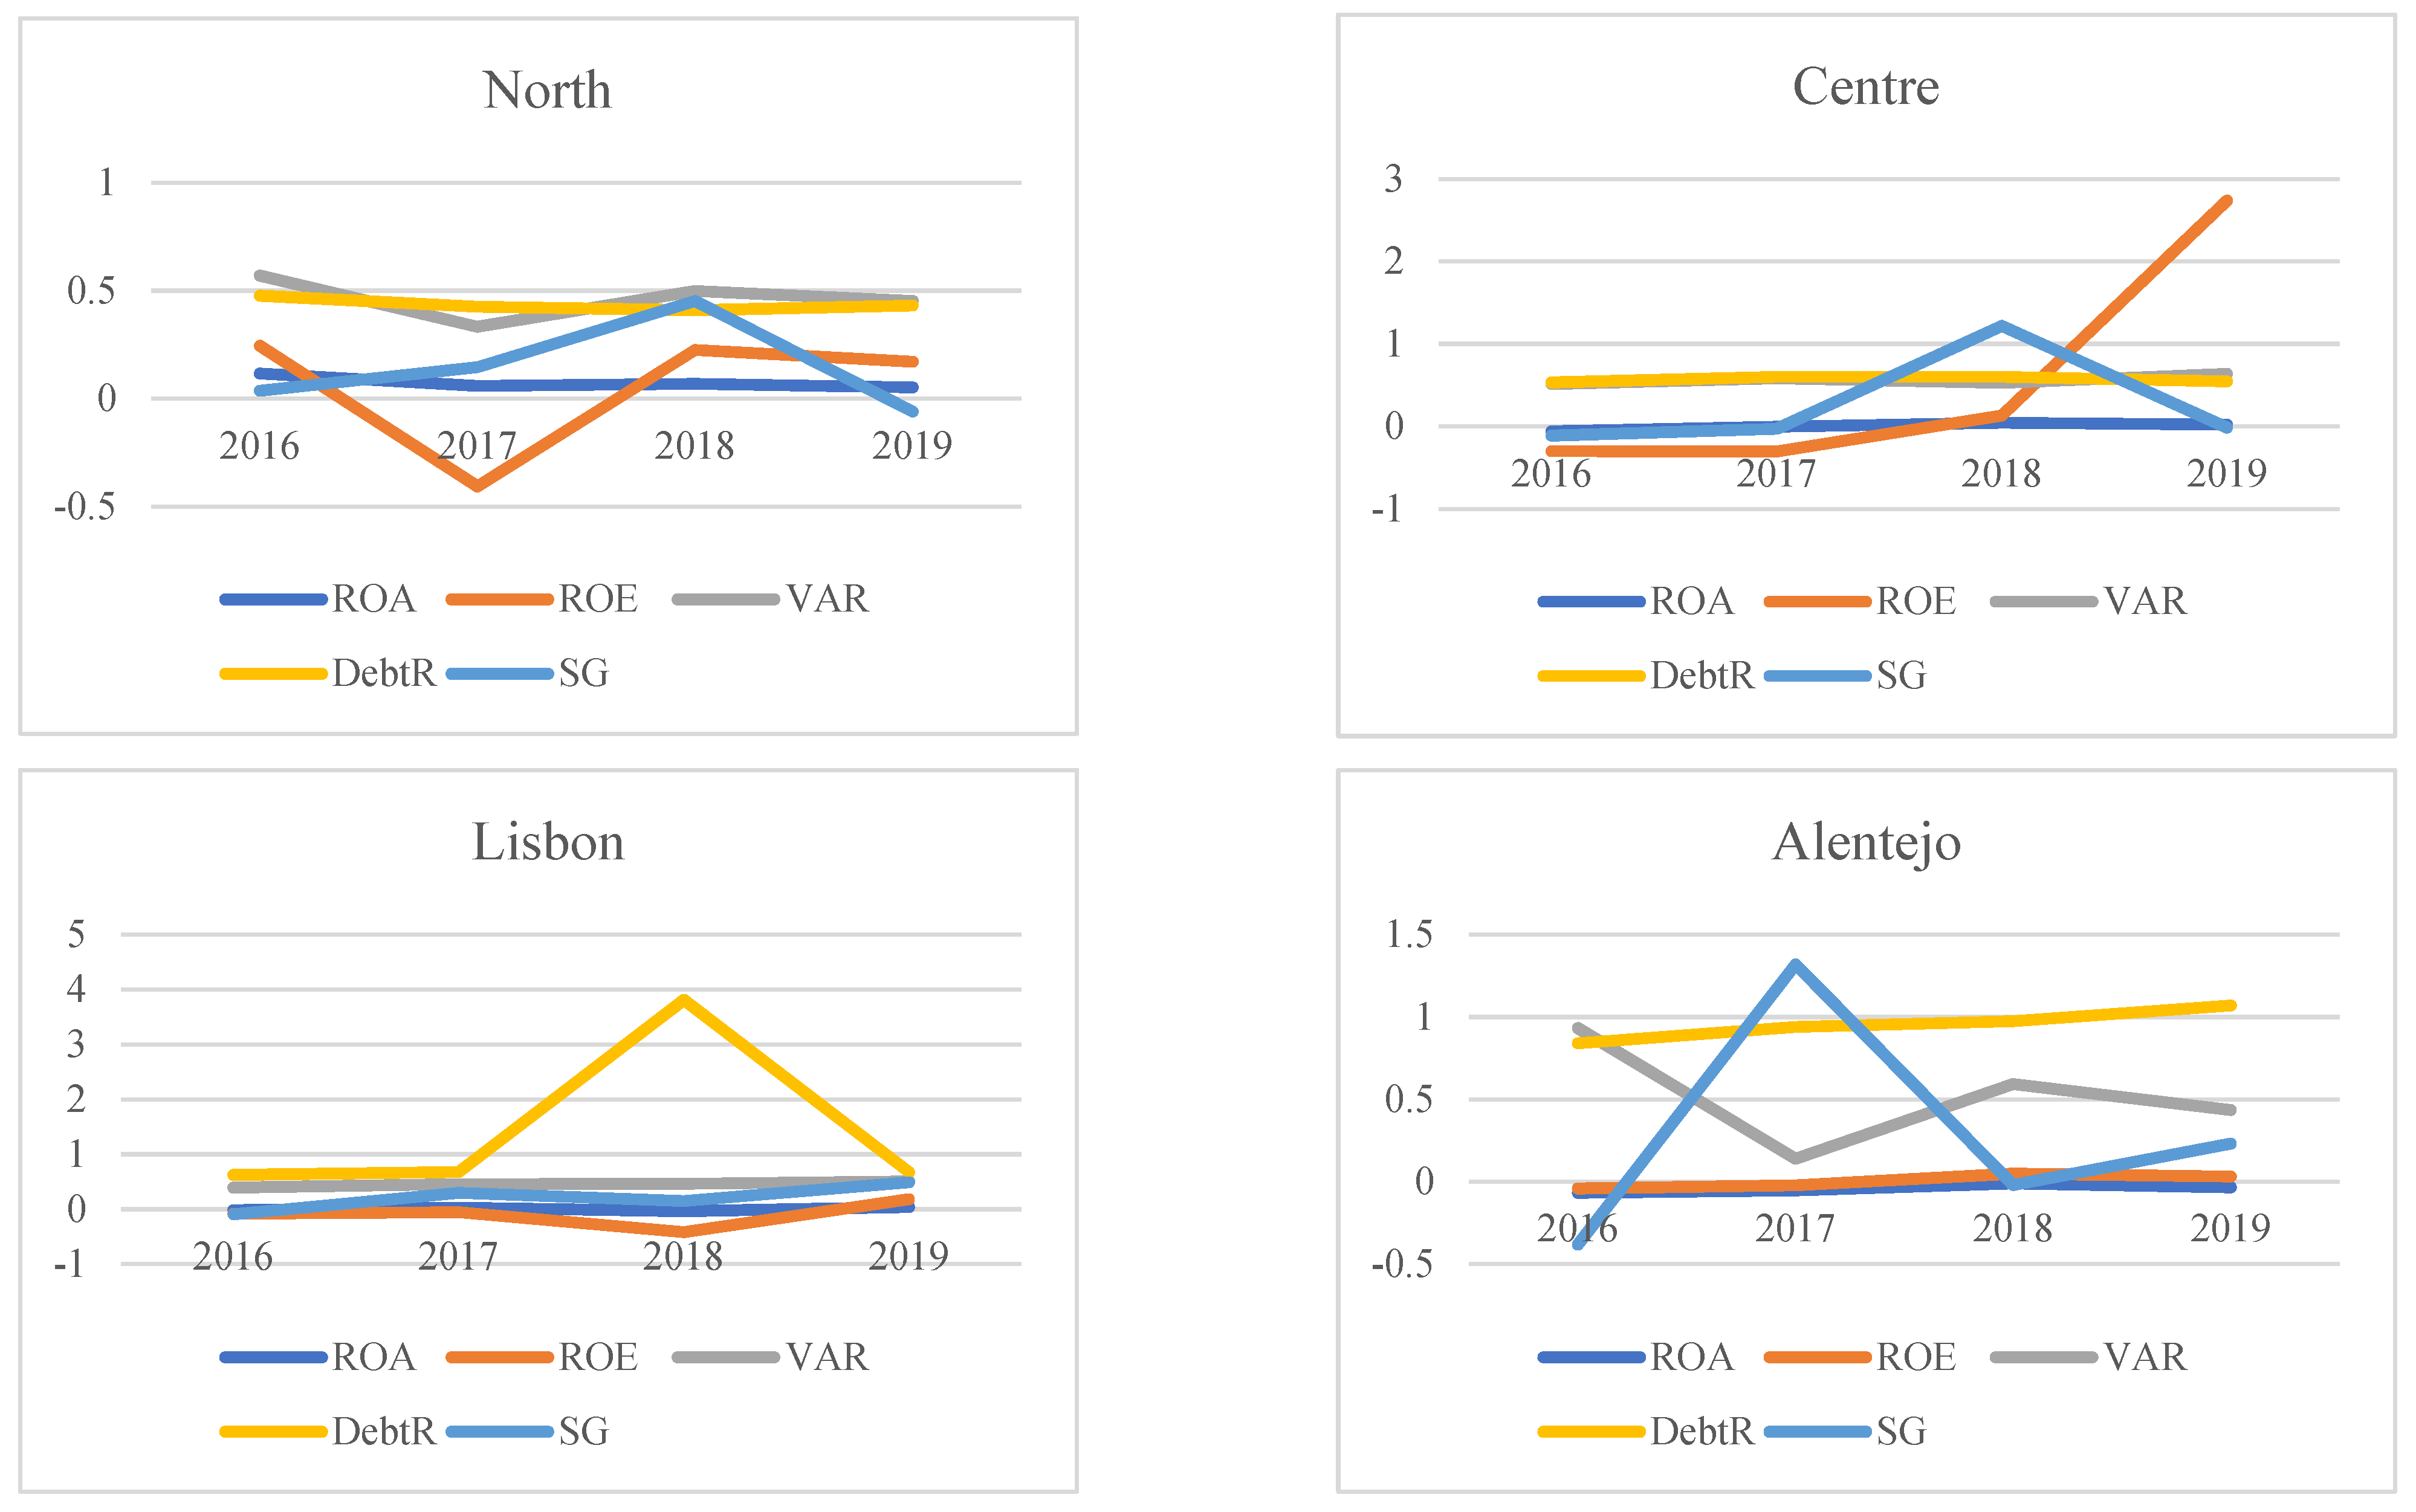
Concerning indebtedness (debt ratio), we can observe different situations: while some regions finance total assets with both equity and liabilities (North, Center, Alentejo, Algarve, and Azores), which is the accurate form of finance, others are in technical bankruptcy (in mean), since total equity is negative and thus liabilities must finance total assets as well as the negative equity (Madeira and Lisbon). In Madeira, firms are more dependent on liabilities (debt = 396.14%), while firms in Algarve display the best position regarding financial independence from third parties (debt ratio = 28.44%), followed by firms in the north (debt ratio = 43.43%). Sales growth is in mean positive, except to Azores (SG = −16.83%). The region with the greater increase in revenues is Madeira (SG = 384.31%), but it can be explained since it is a new company entering the market. In North, Center, Lisbon, and Alentejo, sales growth is quite similar, in mean, suggesting that even in regions where firms are older, they can continue to increase sales (or due to an increase in prices or in quantity). Finally, all Portuguese regions contribute to the gross domestic product (positive VAR), except the firm from Madeira, proving the relevance of this sector to the country’s economic growth. The region with greater contribution is Algarve, followed by Azores. Comparing the average results by regions, Algarve appears to be better off than the other regions in Portugal regarding financial sustainability of firms operating in sewerage, in the last 4 years available, since they have mean profits, liquidity, are less indebted, and are growing their activity and contribute to the country GDP. However, only one firm is operating in this region. The second region with better financial sustainability is the north.
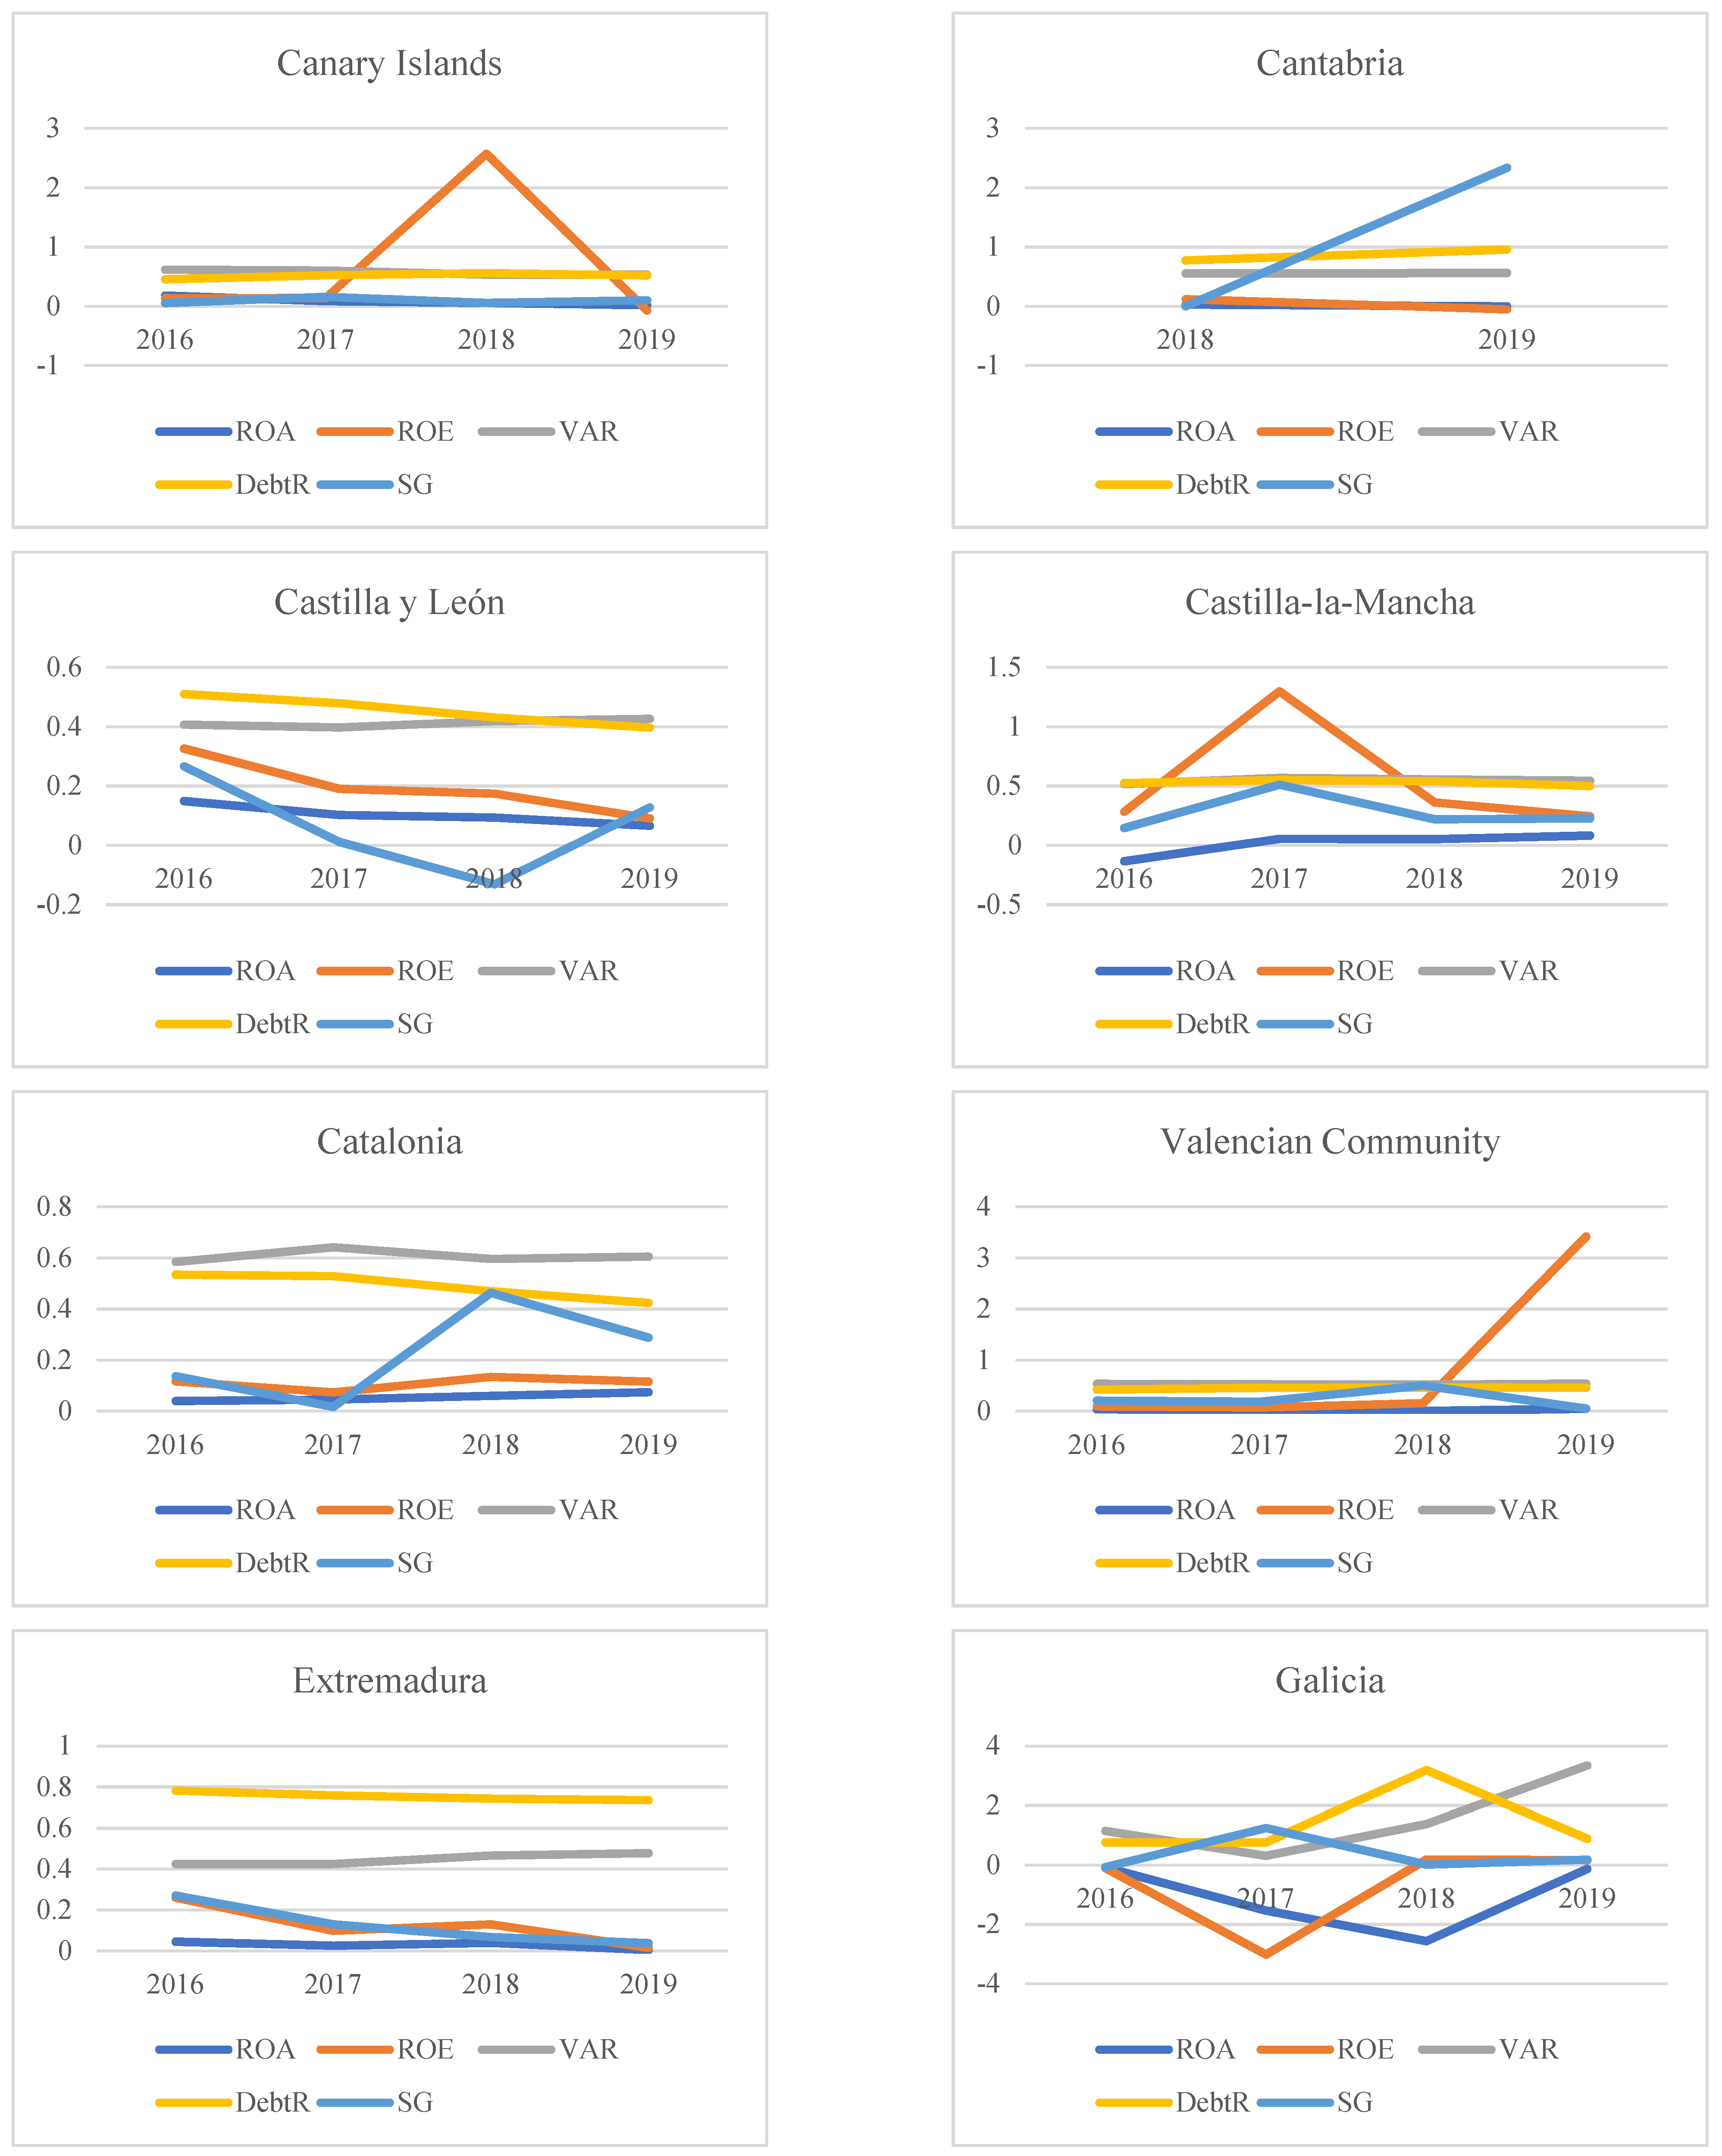
To Spain, only the regions of Asturias and Galicia (near the north of Portugal) present losses in mean (negative ROA and ROE), while firms in La Rioja are the most profitable firms. These regions are noted as the regions with fewer habitants per square kilometer, and neither are the regions with fewer firms operating in the sewerage sector.
In mean, all regions present current assets higher to current liabilities (current ratio), being Cantabria, the region with less safety margin (but results are regarding a singular firm), and Andalusia (the second region more representative in the Spanish sample) the region with the highest one. Firms in Galicia are highly indebted since liabilities are not only to cover total assets as well as negative equity. This region not only presents the smallest profitability but also higher levels of leverage, which are signs of financial problems. On another side, La Rioja has the more profitable firms and is less indebted. Only in Asturias and Navarra, firms have difficulties growing annually, while in Cantabria, the firm’s annual growth is higher than 233%, but there is only a firm in this region, which is a young firm, which justifies this finding. Finally, the less profitable regions are the ones with greater contribution to the Spanish GDP (Galicia and Asturias) and Castilla y León, the region with less value added. Firms in the La Rioja region appear to be better off than the other regions in Spain regarding profitability and indebtedness. Moreover, firms in this region present annual growth and are efficient. The region with more unstable financial sustainability is Galicia. The evolution of the financial and economic performance by regions in 2016–2019 is shown in Figure 1 in Portugal and Figure 2 in Spain.
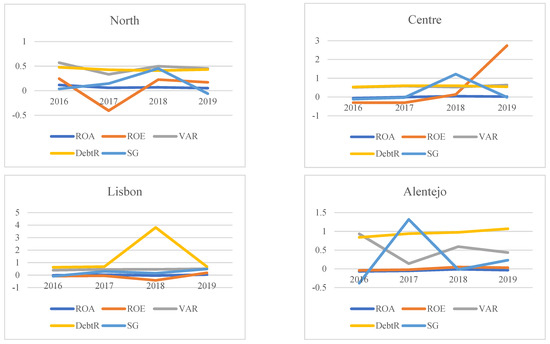
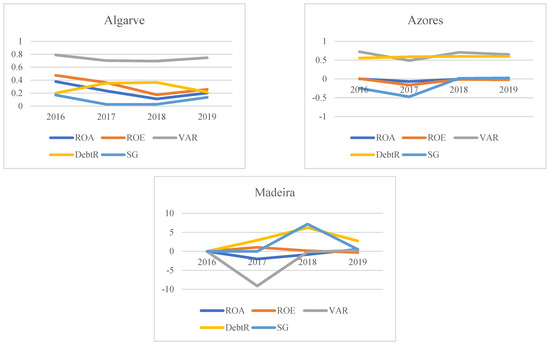
Figure 1.
Evolution of financial and economic performance by Portuguese NUTs II regions, 2016–2019. ROA: return on assets; ROE: return on equity; VAR: value-added ratio; DebtR: debt ratio; SG: sales growth.
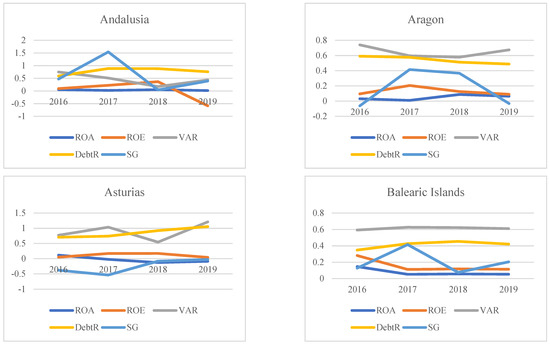
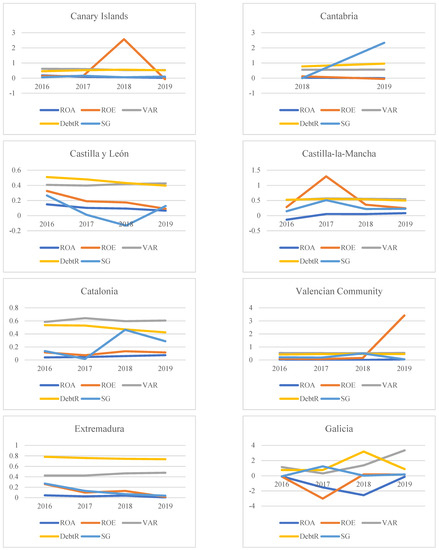
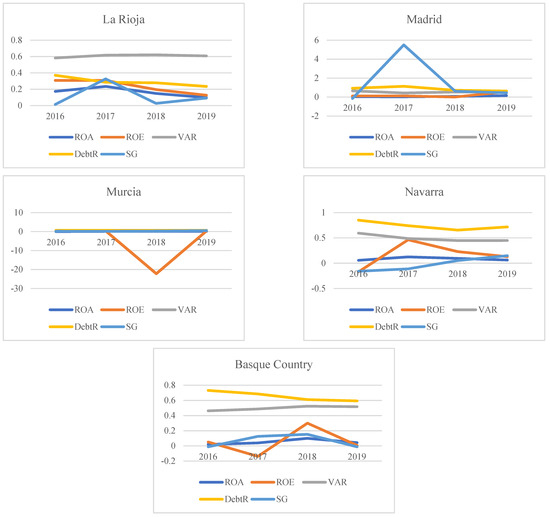
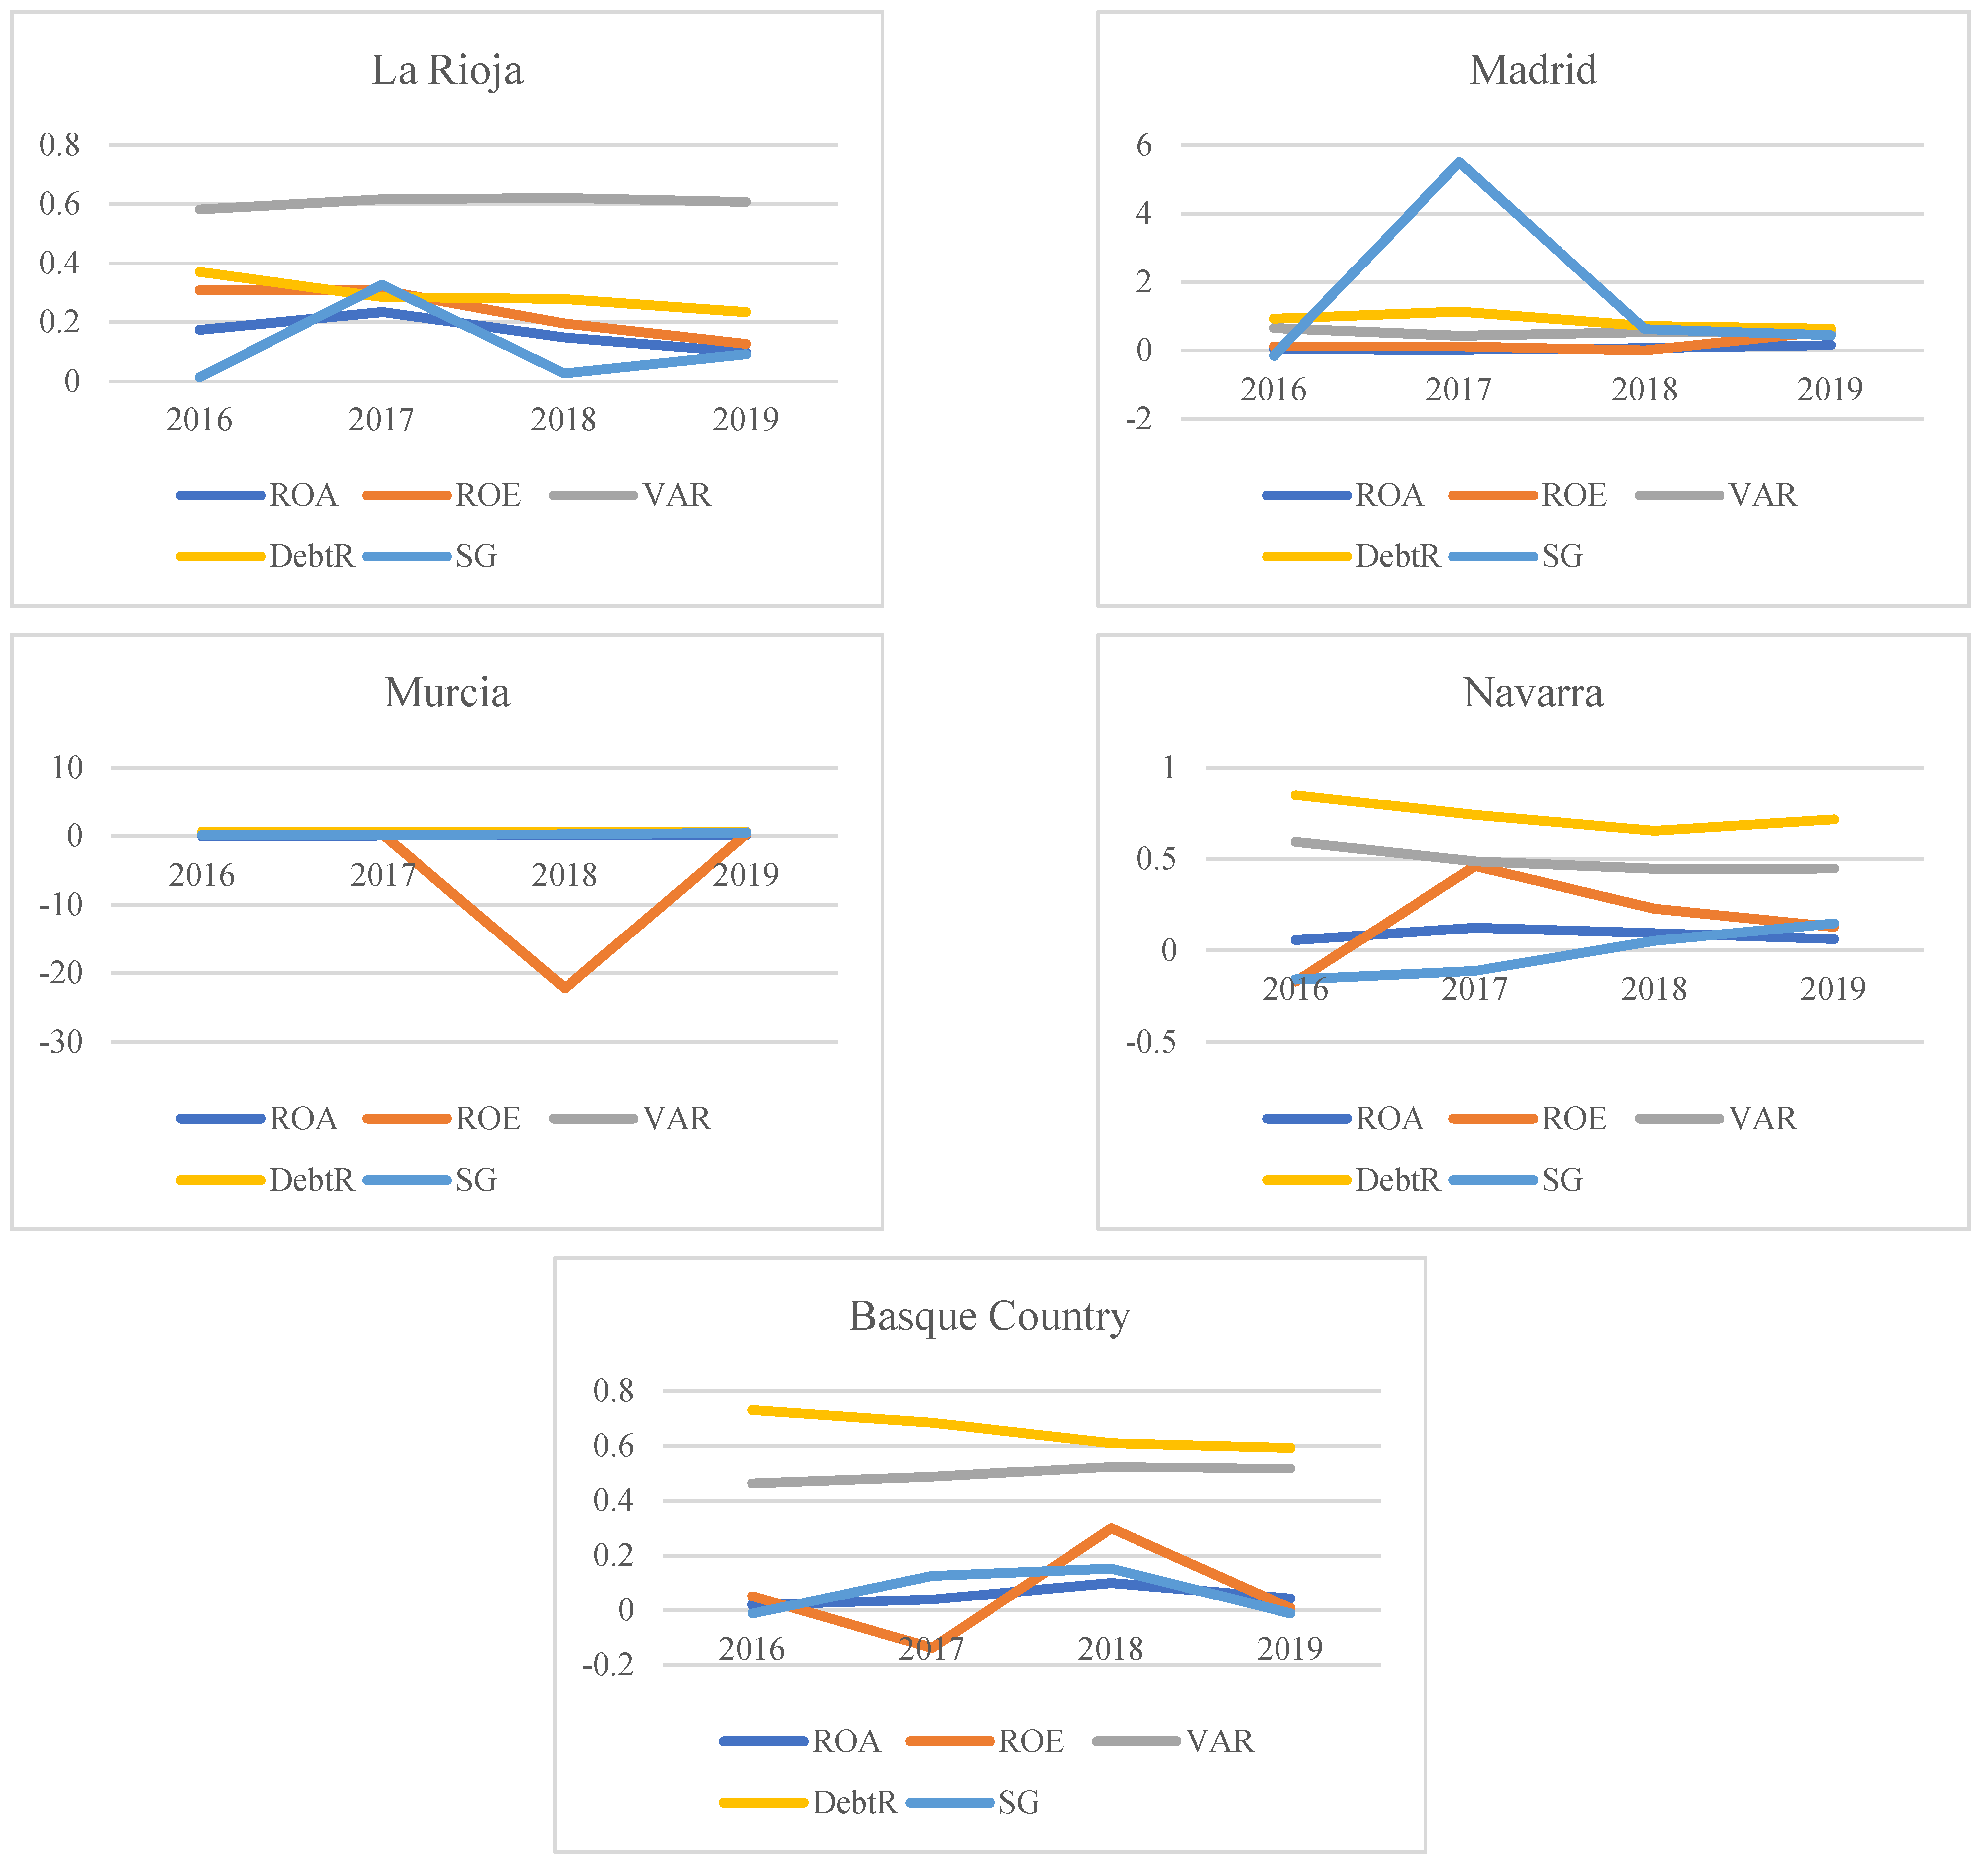
Figure 2.
Evolution of financial and economic performance by Spanish NUTs II regions, 2016–2019. ROA: return on assets; ROE: return on equity; VAR: value-added ratio; DebtR: debt ratio; SG: sales growth.
Analyzing Figure 1, it can be observed that in the north, financial sustainability decreased in 2017 (especially due to a singular company that had huge losses), but in the other years remained stable, except for sales growth, which achieved the highest value in 2018. In the central region, performance, both financial and economic (ROE and ROA), was negative till 2018 but after it increased. Sales growth was around zero, except in the year 2018. The evolution in the Lisbon region was constant till 2018, when the debt ratio increased due to negative ROE. This situation is explained since two companies presented huge losses in that year, with a great impact on total equity (which decreased), and total liabilities were not only to cover total assets but also negative equity. In Alentejo, while financial and economic profitability was more a less constant and near zero, the debt ratio increased, being higher than 1 in 2019. Moreover, sales growth increased in 2017 and decreased in 2018 at the expense of VAR. In the Algarve region, financial and economic profitability decreased by more than half till 2018 and presented a slight recovery in 2019. This may justify the increase in indebtedness, but always less than 40%, which means that firms are 60% financing their assets with their own capital (are financially independent). In Azores, whether profitability is around zero or negative, the debt ratio is always around 60%. N 2017 sales growth decreased as well as the firm’s contribution to GDP (VAR), achieving the highest value in 2018 and then decreased again. Finally, in Madeira, while in 2016, no company that was active in 2019 was operating in the sector, and the existing company presented huge variation regarding financial stability. To sum up, and consistent with the previous idea, the region that performed better on financial and economic grounds was Algarve since profitability was always positive, debt ratio was, in mean, the smallest comparing with other regions, and the contribution to country economic growth was the highest. The second region with better financial sustainability is the northern region.
Figure 2 shows that every Spanish region has a singular financial situation. The Andalusia region has negative profitability or around zero, high indebtedness, and sales growth are too volatile. Aragon region, while makes a great contribution to the economy, firms present high levels of indebtedness. A similar situation is present in the Asturias region, which also presents negative profitability or around zero. In the Balearic Islands, the financial sustainability is similar across the period analyzed, except for sales growth, which is volatile. The Canary Islands also present stable financial sustainability through the period analyzed except for the ratio ROE. In the region of Castilla y León, the firm’s leverage decreased from 2016 to 2019, which justifies the better financial situation. It can be observed that in Castilla-la-Mancha, return is increasing, and debt is decreasing from 2016 to 2019, which leads to a better financial situation. Regarding Catalonia, the firms’ financial sustainability is increasing along the period analyzed, with an increase in profitability and a decrease in debt, even if sales growth is too volatile. In the Valencian community, the financial situation is unstable since ROA and ROE are around zero (except in 2019 but is biased due to the financial situation of a firm), and sales growth is too volatile. Firms in the Extremadura region present high levels of indebtedness, which cause a negative impact on profits. The worst financial situation is presented in the Galicia region since there is no tendency through the period analyzed, the firm’s indebtedness is too high, and returns are negative or around zero. As opposite, we have the La Rioja region, which presents better financial sustainability. Leverage is one of the smallest of the country, and return, even if slightly decreased among the period analyzed, is always positive. In the Madrid region, firms’ equity is around zero or negative, which explains high levels of debt ratio. Moreover, sales growth is too volatile. The Murcia region also has financial problems as mean firms are not profitable.
The region of Navarra has increased its financial sustainability through the period analyzed. Finally, Basque country shows high levels of indebtedness and small profits. As we can observe, not all regions follow the same tendency through the period analyzed, neither present a similar situation. We confirm that La Rioja is the Spanish region with better financial sustainability, while Galicia is on the opposite side, with the worst financial performance. The next table presents the correlation matrix of the variables used in this paper.
Analyzing Table 5, in Portugal, we can observe that the variable region is correlated at a significant level with ROA, current ratio, and VAR, as well as with population density. Moreover, ROA and VAR are correlated, and debt ratio with sales growth and VAR. Therefore, not all firms have the same opportunities to invest neither similar capacity to do it.
Table 5.
Correlation matrix.
In Spain, the variable region is only related to the firms’ age and population density. Moreover, the firms’ age is negatively correlated with sales growth and positively correlated with the region and population density. ROA and ROE are correlated, which is expected since they are both ratios of profitability, and ROA is negatively correlated with debt. VAR is also correlated with debt and sales growth with the number of habitants per km2. These facts suggest that a firm’s financial sustainability depends on the region analyzed, as we have seen before, and it is also influenced by macroeconomic data as the number of people per km.
4. Discussion
In the Iberian Peninsula, the most common sewage sludge treatments are anaerobic digestion, aerobic stabilization, and composting [36]. The focus of this paper is to analyze the financial sustainability of WWTPs in 2016–2019. For this purpose, firms’ financial situation per region is analyzed, calling attention to regional asymmetries. Some firms are highly indebted and have losses every year, making it difficult to invest in alternative ways to reuse water, while others have a suitable financial situation with profits, liquidity, few indebtedness, and great possibilities for growth. Thus, the National Strategic Plan for the Water Supply and Wastewater Sanitation Sector in Portugal and Spain can be biased due to financial problems. Firms with losses and financial constraints can have difficulties in investing in ways to clean and recycle water to help society to be more sustainable. Thus, the government should provide some incentives to firms to promote environmental and social live benefits and more modern cities, contributing not only to achieving the SDG 6, clean water, and sanitation, ensure availability and sustainable management of water and sanitation for all, but also the SDG 11, sustainable cities, and communities, make cities and human settlements inclusive, safe, resilient, and sustainable. The economic effectiveness does not warrant ecologic and social sustainability because the financial indicators do not reflect it. Consequently, the assessment of sustainable development needs an integrated approach, i.e., a set of multi-dimensional indicators, which evaluate both separate parts of the system and their relationships. Studies such as the work of [37,38,39,40] could inspire a more complete analysis where social and environmental performance were analyzed and compared to financial performance. For example, a study [37] confirms that the valuation effect of a company is attributable mainly to greater earnings persistence in firms with higher levels of corporate social performance (CSP). These outcomes are consistent with higher CSP conferring a competitive advantage on firms. In fact, firms often undertake activities that do not necessarily increase cash flows (e.g., costly investments in corporate social responsibility or CSR), and some investors value these non-cash activities. Another study [38] concludes that price reacts to investments in CSR activities as individual social responsibility can lead to corporate social responsibility when managers care about stock price. Other studies statement that their theory and findings contribute to CSR and affect literature in accounting by revealing the contingent nature of how and to what extent CSR performance influences investors’ beliefs about the firm value and the bids these investors are likely to make in equity markets (see, for example, the work of [39]). In fact, a firm’s investment in corporate social responsibility (CSR) builds a positive image of caring for social good and imposes additional costs on executives’ informed trading, which is widely perceived self-serving [40].
Moreover, there is an inconsistency regarding the future development of sustainability assessment tools. In fact, on the one hand, it is required a more specific assessment performance approach, i.e., more case- and site-specific, and on the other hand, there is a demand for broader tools for differing case circumstances. In addition, there is also the need for more standardized tools that provide more transparent results.
Modern society needs to pursue clear goals of sustainability that can be measured by sustainability indicators. Because sustainability indicators are multi-dimensional, multidisciplinary indices, often context-specific, there is no single broad measure of sustainable development. Hence, sustainable indicators’ development involves a methodological compromise among consistency, technical feasibility, and data availability [41]. Following [42] financial sustainability indicators should allow to: identify key elements of sustainable development and show the state of local sustainability; supporting decisions; involving stakeholders; directing to provide feedback on progress; and solving conflict and building consensus by showing the advantages and disadvantages of different alternatives.
This paper has some limitations. First, this research does not shed light on which wastewater treatment plants are equipped with anaerobic digestion facilities to produce biogas based on sewage sludge (electricity and thermal energy through co-generation) or what are sewage sludge treatment options in Spain and Portugal. Second, it is very difficult to conclude that a firm is efficient if we do not know the volume of wastewater treated in every firm. Third, it is very difficult to conclude that a firm is efficient when the volume of wastewater treated in every firm is unknown. Finally, although it could be interesting for the present study, it was not possible to ascertain the water prices in every region due to the lack of response.
5. Conclusions
Being a scarce but renewable resource, water possesses high economic value, and thus, water-related issues, namely its scarcity and reuse, have attracted larger attention in academia worldwide in recent years. Accordingly, the European Commission (EC) makes efforts to stimulate Europe’s transition toward a circular economy. This action is expected to boost firms’ competitiveness, foster economic growth, and generate employment. An important part of the environmental degradation is caused by the discharge of untreated or mistreated wastewater, making the reuse of water a central part of the National Strategic Plan for the Water Supply and Wastewater Sanitation Sector in Portugal and Spain. However, investment in resource management has been utterly neglected.
Wastewater treatment plants mitigate environmental impacts and contribute to the financial savings of other firms. Though, the inefficiency of centralized treatment systems showed that the environmental issues must be tackled at the regional level. Furthermore, the assessment of WWTPs’ financial and economic performance should also be a concern among scholars and stakeholders that study the economic viability of a resource recovery technology. Yet, the literature evaluating WWTPs’ financial performance and economic sustainability does not abound. This paper is an attempt to fill the gap by analyzing the financial sustainability of WWTPs across Portuguese and Spanish NUTS II regions in 2016–2019. Using firms’ financial reports from SABI, results show that several Portuguese and Spanish firms operating in sewerage, especially the SMEs, present high levels of indebtedness, making it difficult to invest in ways to reuse water. In fact, in mean, 90.13% and 65.66% of total assets are financed by liabilities to Portugal and Spain, respectively. The number of firms is concentrated in the northern region in Portugal, which is the third region in terms of population density, while in Spain, most of the firms (17.9%) are concentrated in the region of Catalonia, which is the fifth region regarding population density. This fact suggests that the number of firms operating in this sector is not related to the population existent. Moreover, there are huge differences across regions, being the Algarve region (in Portugal) and La Rioja (in Spain), where firms performed better on financial and economic grounds when compared to the rest of the country. The superior performance of WWTPs in Algarve (since it is the region with higher profitability, less in debt, and more value added) can be explained in part due to a concession contract in 2019 that joined the water supply and wastewater sanitation systems. This allowed for important investments to improve water services and to maintain and rehabilitate the infrastructures, reinforcing the resilience of the system to face climate change. The north of Portugal is the second region with better financial sustainability, and it is also the region with more companies in the sewerage sector in the country.
Regarding Spain, WWTPs in La Rioja are more profitable (ROA = 16.34% and ROE = 23.43%) and less indebted (debt ratio = 29.19%). These firms treat over 14,000 m3/day and have different wastewater treatment systems, such as extended aeration, low-load trickling filter, and subsurface flow wetlands. The sludge generated during the secondary treatment undergoes a centrifugal dewatering process with the use of polyelectrolytes. This sludge is stored in silos for subsequent use in agriculture. Financial analysis shows if a firm can obtain profit from its activity and to draw some conclusions on firms’ ability to generate enough incomes to cover its costs and achieve a reasonable profit, i.e., to be economically and/or financially sustainable. Through the application of this financial performance measurement framework using a benchmarking methodology, it is possible to identify relatively strong and weak firms and regions. The adoption of this framework of analysis can help policymakers to design industrial and regional policies with a view to early identification of those firms and regions more sustainable in financial and economic terms. In addition, these findings can be used to further investigate whether wastewater treatment companies in Algarve and La Rioja are implementing the best practices regarding management and technology. Results can also foster enhancements in the governance of regulated utilities.
Avenues of future research include using other indicators of financial and economic as well as environmental and social performance and analyze the feasibility of the technologies used at the regional level. An analysis of the number and types of municipalities (i.e., large city, urban, peri-urban/metropolitan, rural) covered by each wastewater treatment plant could be welcome to conclude how do these characteristics influence the financial and performance indicators at the regional level. Furthermore, a similar analysis can be made to other European countries to corroborate the results.
Author Contributions
Conceptualization, E.S.; methodology, E.S., I.L. and T.E.; software, I.L.; validation, E.S., I.L. and T.E.; formal analysis, E.S., I.L. and T.E.; investigation, E.S., I.L. and T.E.; resources, E.S., I.L. and T.E.; writing—original draft preparation, E.S., I.L. and T.E.; writing—review and editing, E.S., I.L. and T.E.; supervision, E.S.; project administration E.S.; funding acquisition, E.S., I.L. and T.E.. All authors have read and agreed to the published version of the manuscript.
Funding
This research is financed by National Funds of the FCT—Portuguese Foundation for Science and Technology within the project «UIDB/04928/2020» and, under the Scientific Employment Stimulus - Institutional Call CEECINST/00051/2018.
Institutional Review Board Statement
Not applicable.
Informed Consent Statement
Not applicable.
Conflicts of Interest
The authors declare no conflict of interest.
References
- Decicino, R. Água Potável: Apenas 3% das Águas São Doces. Educação UOL. 2007. Available online: https://educacao.uol.com.br/disciplinas/geografia/agua-potavel-apenas-3-das-aguas-sao-doces.html (accessed on 30 September 2021).
- Garcia, R. Sede Global. Revista Galileu. Edição 187, Fevereiro de 2007. Available online: http://revistagalileu.globo.com/Galileu/0,6993,ECT498426-1719-3,00.html (accessed on 30 September 2021).
- Onubr. A ONU e a Água. 2019. Available online: https://nacoesunidas.org/acao/agua/ (accessed on 30 September 2021).
- Ricart, S.; Rico, A.M. Assessing technical and social driving factors of water reuse in agriculture: A review on risks, regulation and the yuck factor. Agric. Water Manag. 2019, 217, 426–439. [Google Scholar] [CrossRef]
- Chaukura, C.; Marais, S.S.; Moyo, W.; Mbali, N.; Thakalekoala, L.C.; Ingwani, T.; Mamba, B.B.; Jarvis, P.; Nkambule, T.T.I. Contemporary issues on the occurrence and removal of disinfection by-products in drinking water—A review. J. Environ. Chem. Eng. 2020, 8, 103659. [Google Scholar] [CrossRef]
- lvarez-Ruiz, R.; Picó, Y. Analysis of emerging and related pollutants in aquatic biota. Trends Environ. Anal. Chem. 2020, 25, e00082. [Google Scholar] [CrossRef]
- Diaz, R.J.; Rosenberg, R. Spreading Dead Zones and Consequences for Marine Ecosystems. Science 2008, 321, 926–929. [Google Scholar] [CrossRef]
- Fonseca, P.F.; da Silva, J.R.; da Silva Fonseca, E. Análise da viabilidade da separação de água de chuveiros e pias para reúso. Res. Soc. Dev. 2020, 9, e14921938. [Google Scholar] [CrossRef] [Green Version]
- Trimmer, J.T.; Miller, D.C.; Guest, J.S. Resource recovery from sanitation to enhance ecosystem services. Nat. Sustain. 2019, 2, 681–690. [Google Scholar] [CrossRef]
- Patel, H.; Vashi, R. Characterization and Treatment of Textile Wastewater; Elsevier: Oxford, UK, 2015. [Google Scholar]
- Melián, J.A.H. Sustainable Wastewater Treatment Systems (2018–2019). Sustainability 2020, 12, 1940. [Google Scholar] [CrossRef] [Green Version]
- United Nations (UN). Transforming Our World: The 2030 Agenda for Sustainable Development. 2016. Available online: https://stg-wedocs.unep.org/bitstream/handle/20.500.11822/11125/unepswiosm1inf7sdg.pdf?sequence=1 (accessed on 30 September 2021).
- Jodar-Abellan, A.; López-Ortiz, M.I.; Melgarejo-Moreno, J. Wastewater Treatment and Water Reuse in Spain. Current Situation and Perspectives. Water 2019, 11, 1551. [Google Scholar] [CrossRef] [Green Version]
- Fuentes, R.; Torregrosa, T.; Hernandez-Sancho, F. Productivity of wastewater treatment plants in the Valencia Region of Spain. Util. Policy 2017, 46, 58–70. [Google Scholar] [CrossRef]
- Hospido, A.; Moreira, M.; Feijoo, G. A Comparison of Municipal Wastewater Treatment Plants for Big Centres of Population in Galicia (Spain). Int. J. Life Cycle Assess. 2007, 13, 57–64. [Google Scholar] [CrossRef]
- Santos, A.S.P.; Vieira, J.M.P. Reúso de água para o desenvolvimento sustentável: Aspectos de regulamentação no Brasil e em Portugal. Rev. Eletrônica Gestão Tecnol. Ambient. 2020, 8, 50–68. [Google Scholar] [CrossRef]
- Santos, R.M.B.; Fernandes, L.F.S.; Cortes, R.M.V.; Pacheco, F.A.L. Development of a Hydrologic and Water Allocation Model to Assess Water Availability in the Sabor River Basin (Portugal). Int. J. Environ. Res. Public Health 2019, 16, 2419. [Google Scholar] [CrossRef] [PubMed] [Green Version]
- Frade, J.V. PENSAAR (2020)—Uma nova Estratégia para o Setor de Abastecimento de Água e Saneamento de Águas Residuais—Volume II; Ministério do Ambiente, Ordenamento do Território e Energia: Lisbon, Portugal, 2015.
- Ramprasad, C.; Rangabhashiyam, S. The role of sustainable decentralized technologies in wastewater treatment and reuse in subtropical Indian conditions. In BRICS Nations; Elsevier: Amsterdam, The Netherlands, 2020; pp. 253–268. [Google Scholar] [CrossRef]
- Seifert, C.; Krannich, T.; Guenther, E. Gearing up sustainability thinking and reducing the bystander effect—A case study of wastewater treatment plants. J. Environ. Manag. 2018, 231, 155–165. [Google Scholar] [CrossRef] [PubMed]
- O’Dwyer, E.; Chen, K.; Wang, H.; Wang, A.; Shah, N.; Guo, M. Optimisation of wastewater treatment strategies in eco-industrial parks: Technology, location, and transport. Chem. Eng. J. 2020, 381, 122643. [Google Scholar] [CrossRef]
- Tahir, S.; Steichen, T.; Shouler, M. Water and Circular Economy: A White Paper; Ellen MacArthur Foundation, Arup, Antea Group: Cowes, UK, 2018. [Google Scholar]
- Abu-Ghunmi, D.; Abu-Ghunmi, L.; Kayal, B.; Bino, A. Circular economy and the opportunity cost of not ‘closing the loop’of water industry: The case of Jordan. J. Clean. Prod. 2016, 131, 228–236. [Google Scholar] [CrossRef]
- Plano de Ação para a Economia Circular (PAEC) de Portugal—Aprovado pela Resolução do Conselho de Ministros n.° 190-A/2017. Available online: https://dre.pt/application/file/a/114336872 (accessed on 30 September 2021).
- Lieder, M.; Rashid, A. Towards circular economy implementation: A comprehensive review in context of manufacturing industry. J. Clean. Prod. 2016, 115, 36–51. [Google Scholar] [CrossRef]
- Molinos-Senante, M.; Hernández-Sancho, F.; Sala-Garrido, R. Cost modeling for sludge and waste management from wastewater treatment plants: An empirical approach for Spain. Desalination Water Treat. 2013, 51, 5414–5420. [Google Scholar] [CrossRef]
- Ampe, K.; Paredis, E.; Asveld, L.; Osseweijer, P.; Block, T. Power struggles in policy feedback processes: Incremental steps towards a circular economy within Dutch wastewater policy. Policy Sci. 2021, 54, 579–607. [Google Scholar] [CrossRef]
- Fuenfschilling, L.; Binz, C. Global socio-technical regimes. Res. Policy 2018, 47, 735–749. [Google Scholar] [CrossRef] [Green Version]
- Millar, N.; McLaughlin, E.; Börger, T. The Circular Economy: Swings and Roundabouts? Ecol. Econ. 2018, 158, 11–19. [Google Scholar] [CrossRef] [Green Version]
- Fidélis, T.; Cardoso, A.S.; Riazi, F.; Miranda, A.C.; Abrantes, J.; Teles, F.; Roebeling, P.C. Policy narratives of circular economy in the EU—Assessing the embeddedness of water and land in national action plans. J. Clean. Prod. 2020, 288, 125685. [Google Scholar] [CrossRef]
- Carmeli, A. A Conceptual and Practical Framework of Measuring Performance of Local Authorities in Financial Terms: Analysing the Case of Israel. Local Gov. Stud. 2002, 28, 21–36. [Google Scholar] [CrossRef]
- Wu, Y.; Gaunt, C.; Gray, S. A comparison of alternative bankruptcy prediction models. J. Contemp. Account. Econ. 2010, 6, 34–45. [Google Scholar] [CrossRef]
- Steurer, R.; Langer, M.E.; Konrad, A.; Martinuzzi, A. Corporations, stakeholders, and sustainable development: A theoretical exploration of business society relations. J. Bus. Ethics Netherlands 2005, 61, 263–281. [Google Scholar] [CrossRef]
- Bartolacci, F.; Paolini, A.; Quaranta, A.G.; Soverchia, M. Assessing factors that influence waste management financial sustainability. Waste Manag. 2018, 79, 571–579. [Google Scholar] [CrossRef]
- Jeong, H.; Shin, K.; Kim, E.; Kim, S. Does Open Innovation Enhance a Large Firm’s Financial Sustainability? A Case of the Korean Food Industry. J. Open Innov. Technol. Mark. Complex. 2020, 6, 101. [Google Scholar] [CrossRef]
- Silva, C.; Matos, J.S.; Rosa, M. Performance indicators and indices of sludge management in urban wastewater treatment plants. J. Environ. Manag. 2016, 184, 307–317. [Google Scholar] [CrossRef]
- Gregory, A.; Whittaker, J.; Yan, X. Corporate Social Performance, Competitive Advantage, Earnings Persistence and Firm Value. J. Bus. Financ. Account. 2016, 43, 3–30. [Google Scholar] [CrossRef]
- Friedman, H.L.; Heinle, M.S. Taste, information, and asset prices: Implications forthe valuation of CSR. Rev. Account. Stud. 2015, 21, 740–767. [Google Scholar] [CrossRef] [Green Version]
- Elliott, W.B.; Jackson, K.E.; Peecher, M.E.; White, B.J. The Unintended Effect of Corporate Social Responsibility Performance on Investors’ Estimates of Fundamental Value. Account. Rev. 2013, 89, 275–302. [Google Scholar] [CrossRef] [Green Version]
- Gao, F.; Lisic, L.L.; Zhang, I.X. Commitment to social good and insider trading. J. Account. Econ. 2014, 57, 149–175. [Google Scholar] [CrossRef]
- Ness, B.; Urbel-Piirsalu, E.; Anderberg, S.; Olsson, L. Categorising tools for sustainability assessment. Ecol. Econ. 2007, 60, 498–508. [Google Scholar] [CrossRef]
- PASTILLE Consortium. Indicators into Action: Local Sustainability Indicator Sets in Their Context; Final Report; London School of Economics: London, UK, 2002. [Google Scholar]

Publisher’s Note: MDPI stays neutral with regard to jurisdictional claims in published maps and institutional affiliations. |
© 2021 by the authors. Licensee MDPI, Basel, Switzerland. This article is an open access article distributed under the terms and conditions of the Creative Commons Attribution (CC BY) license (https://creativecommons.org/licenses/by/4.0/).