
Experimental Study of a Piezoelectric De-Icing System Implemented to Rotorcraft Blades


Abstract
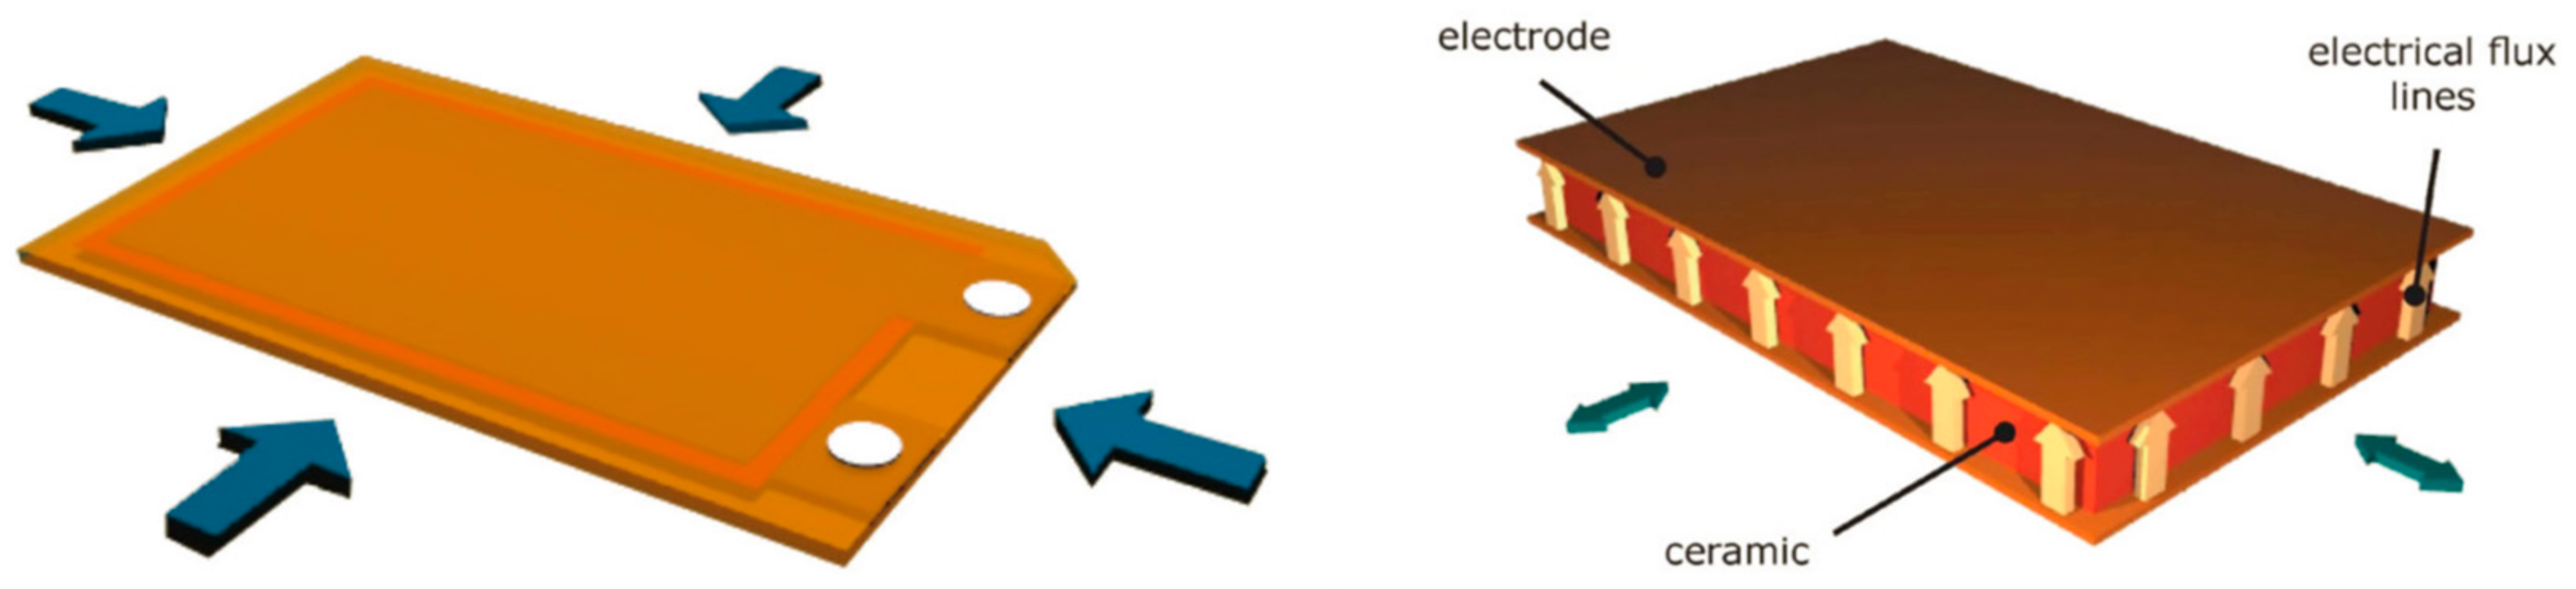
:1. Introduction
2. Materials and Methods
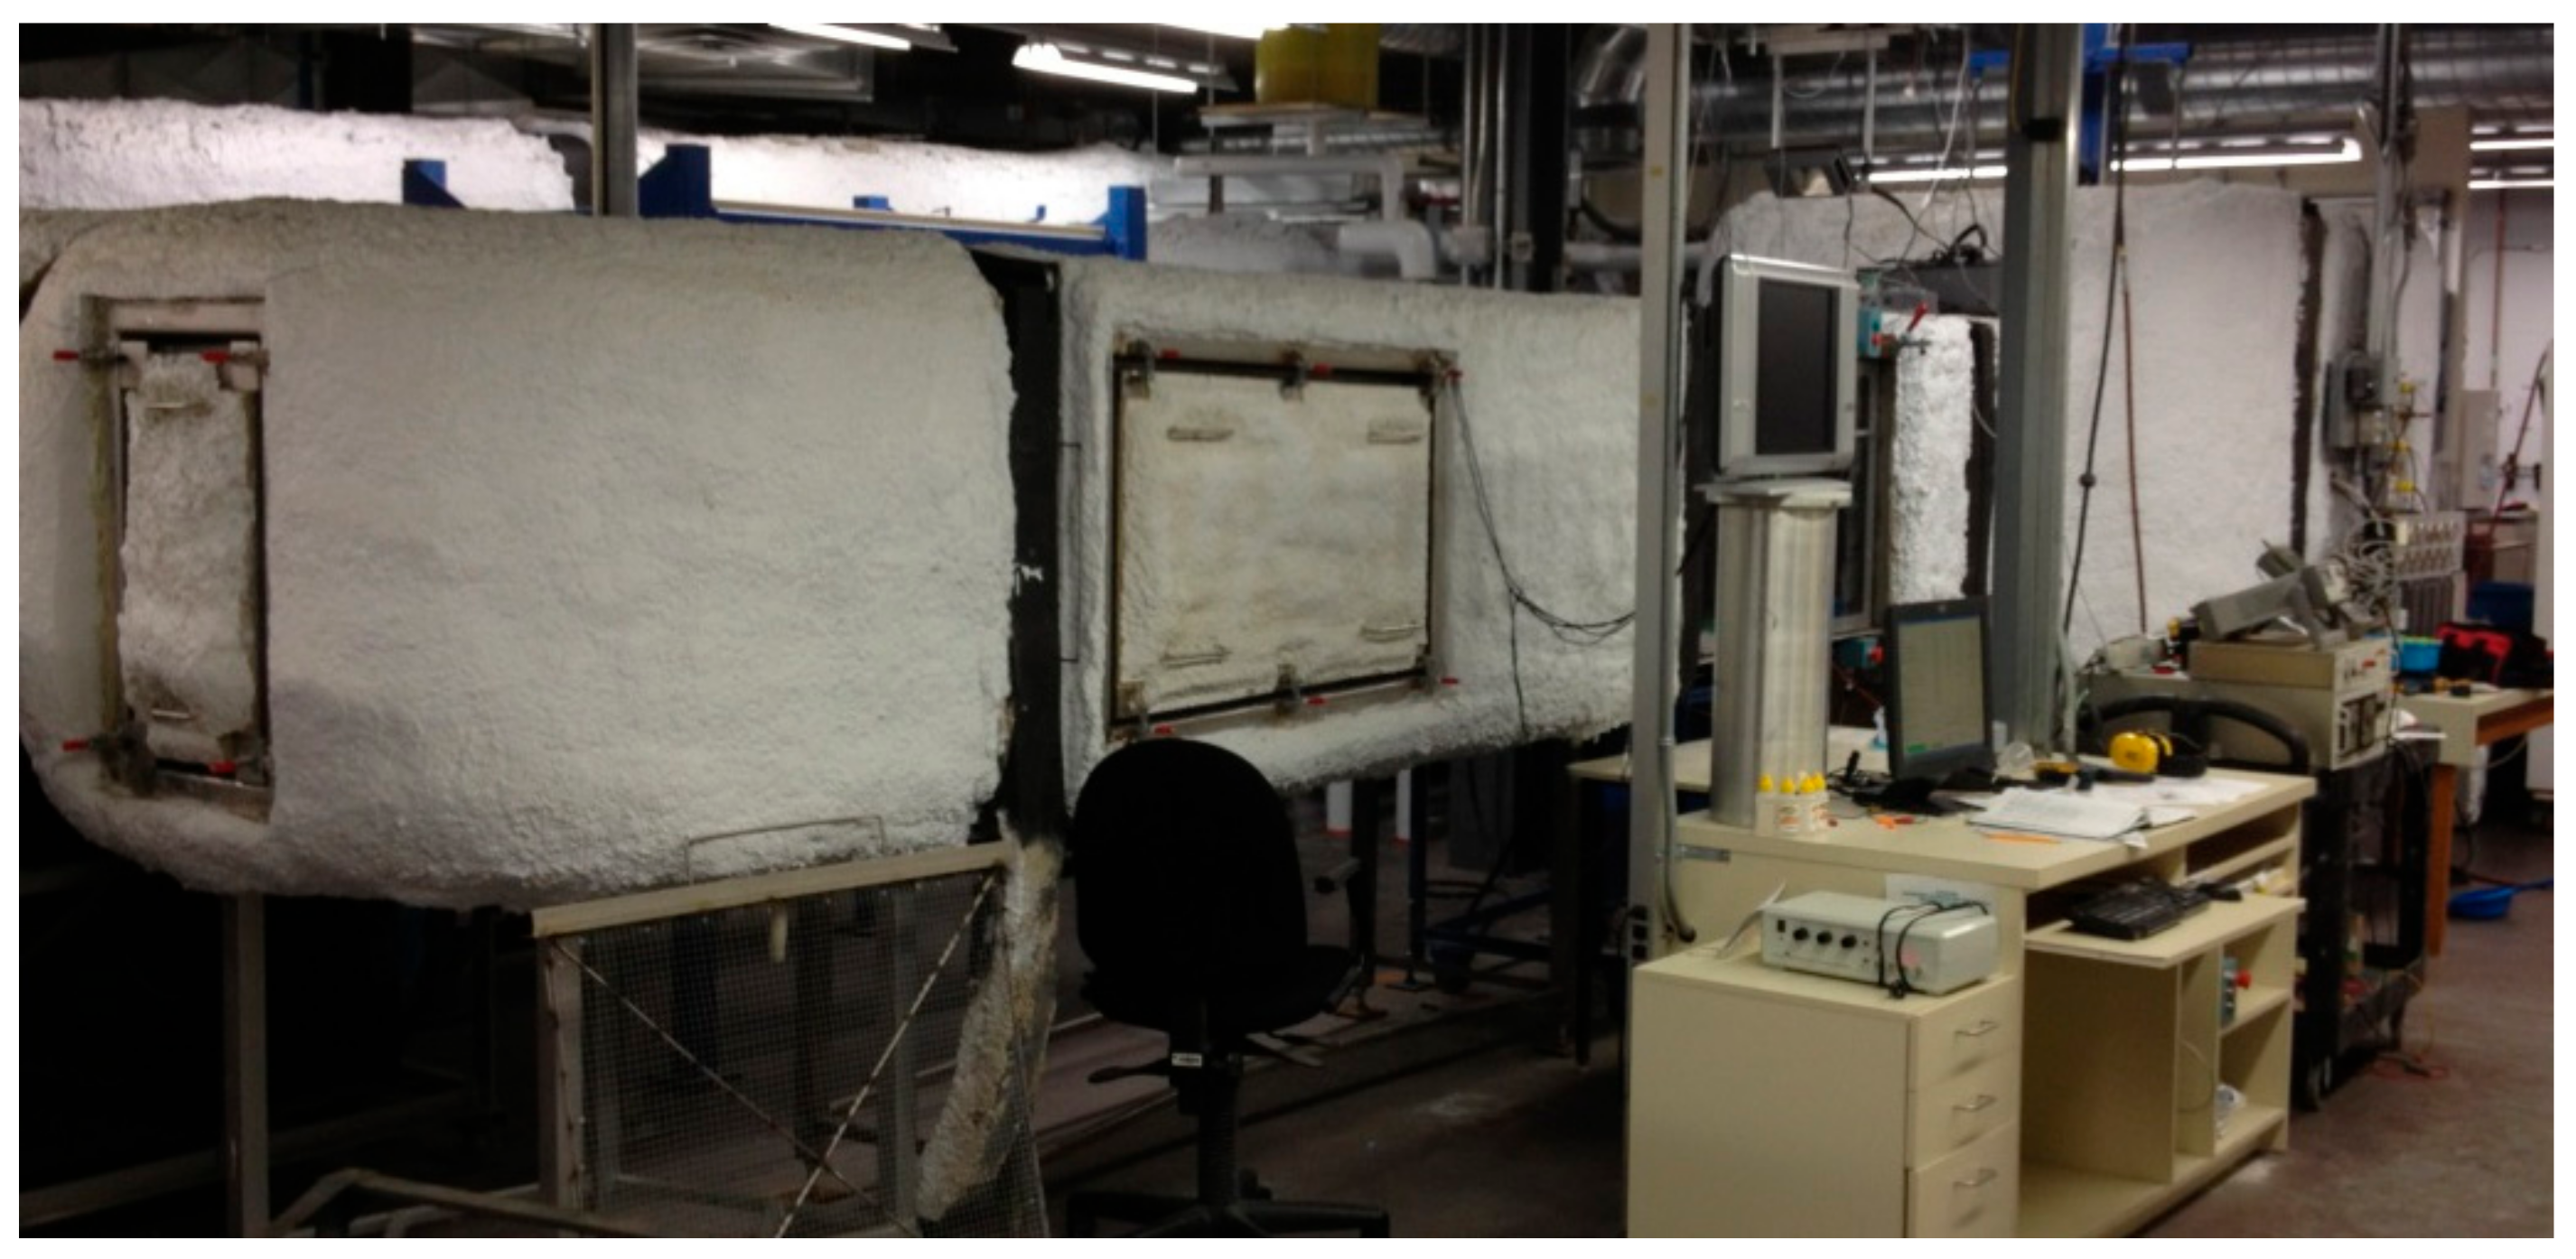
2.1. Refrigerated Wind Tunnel
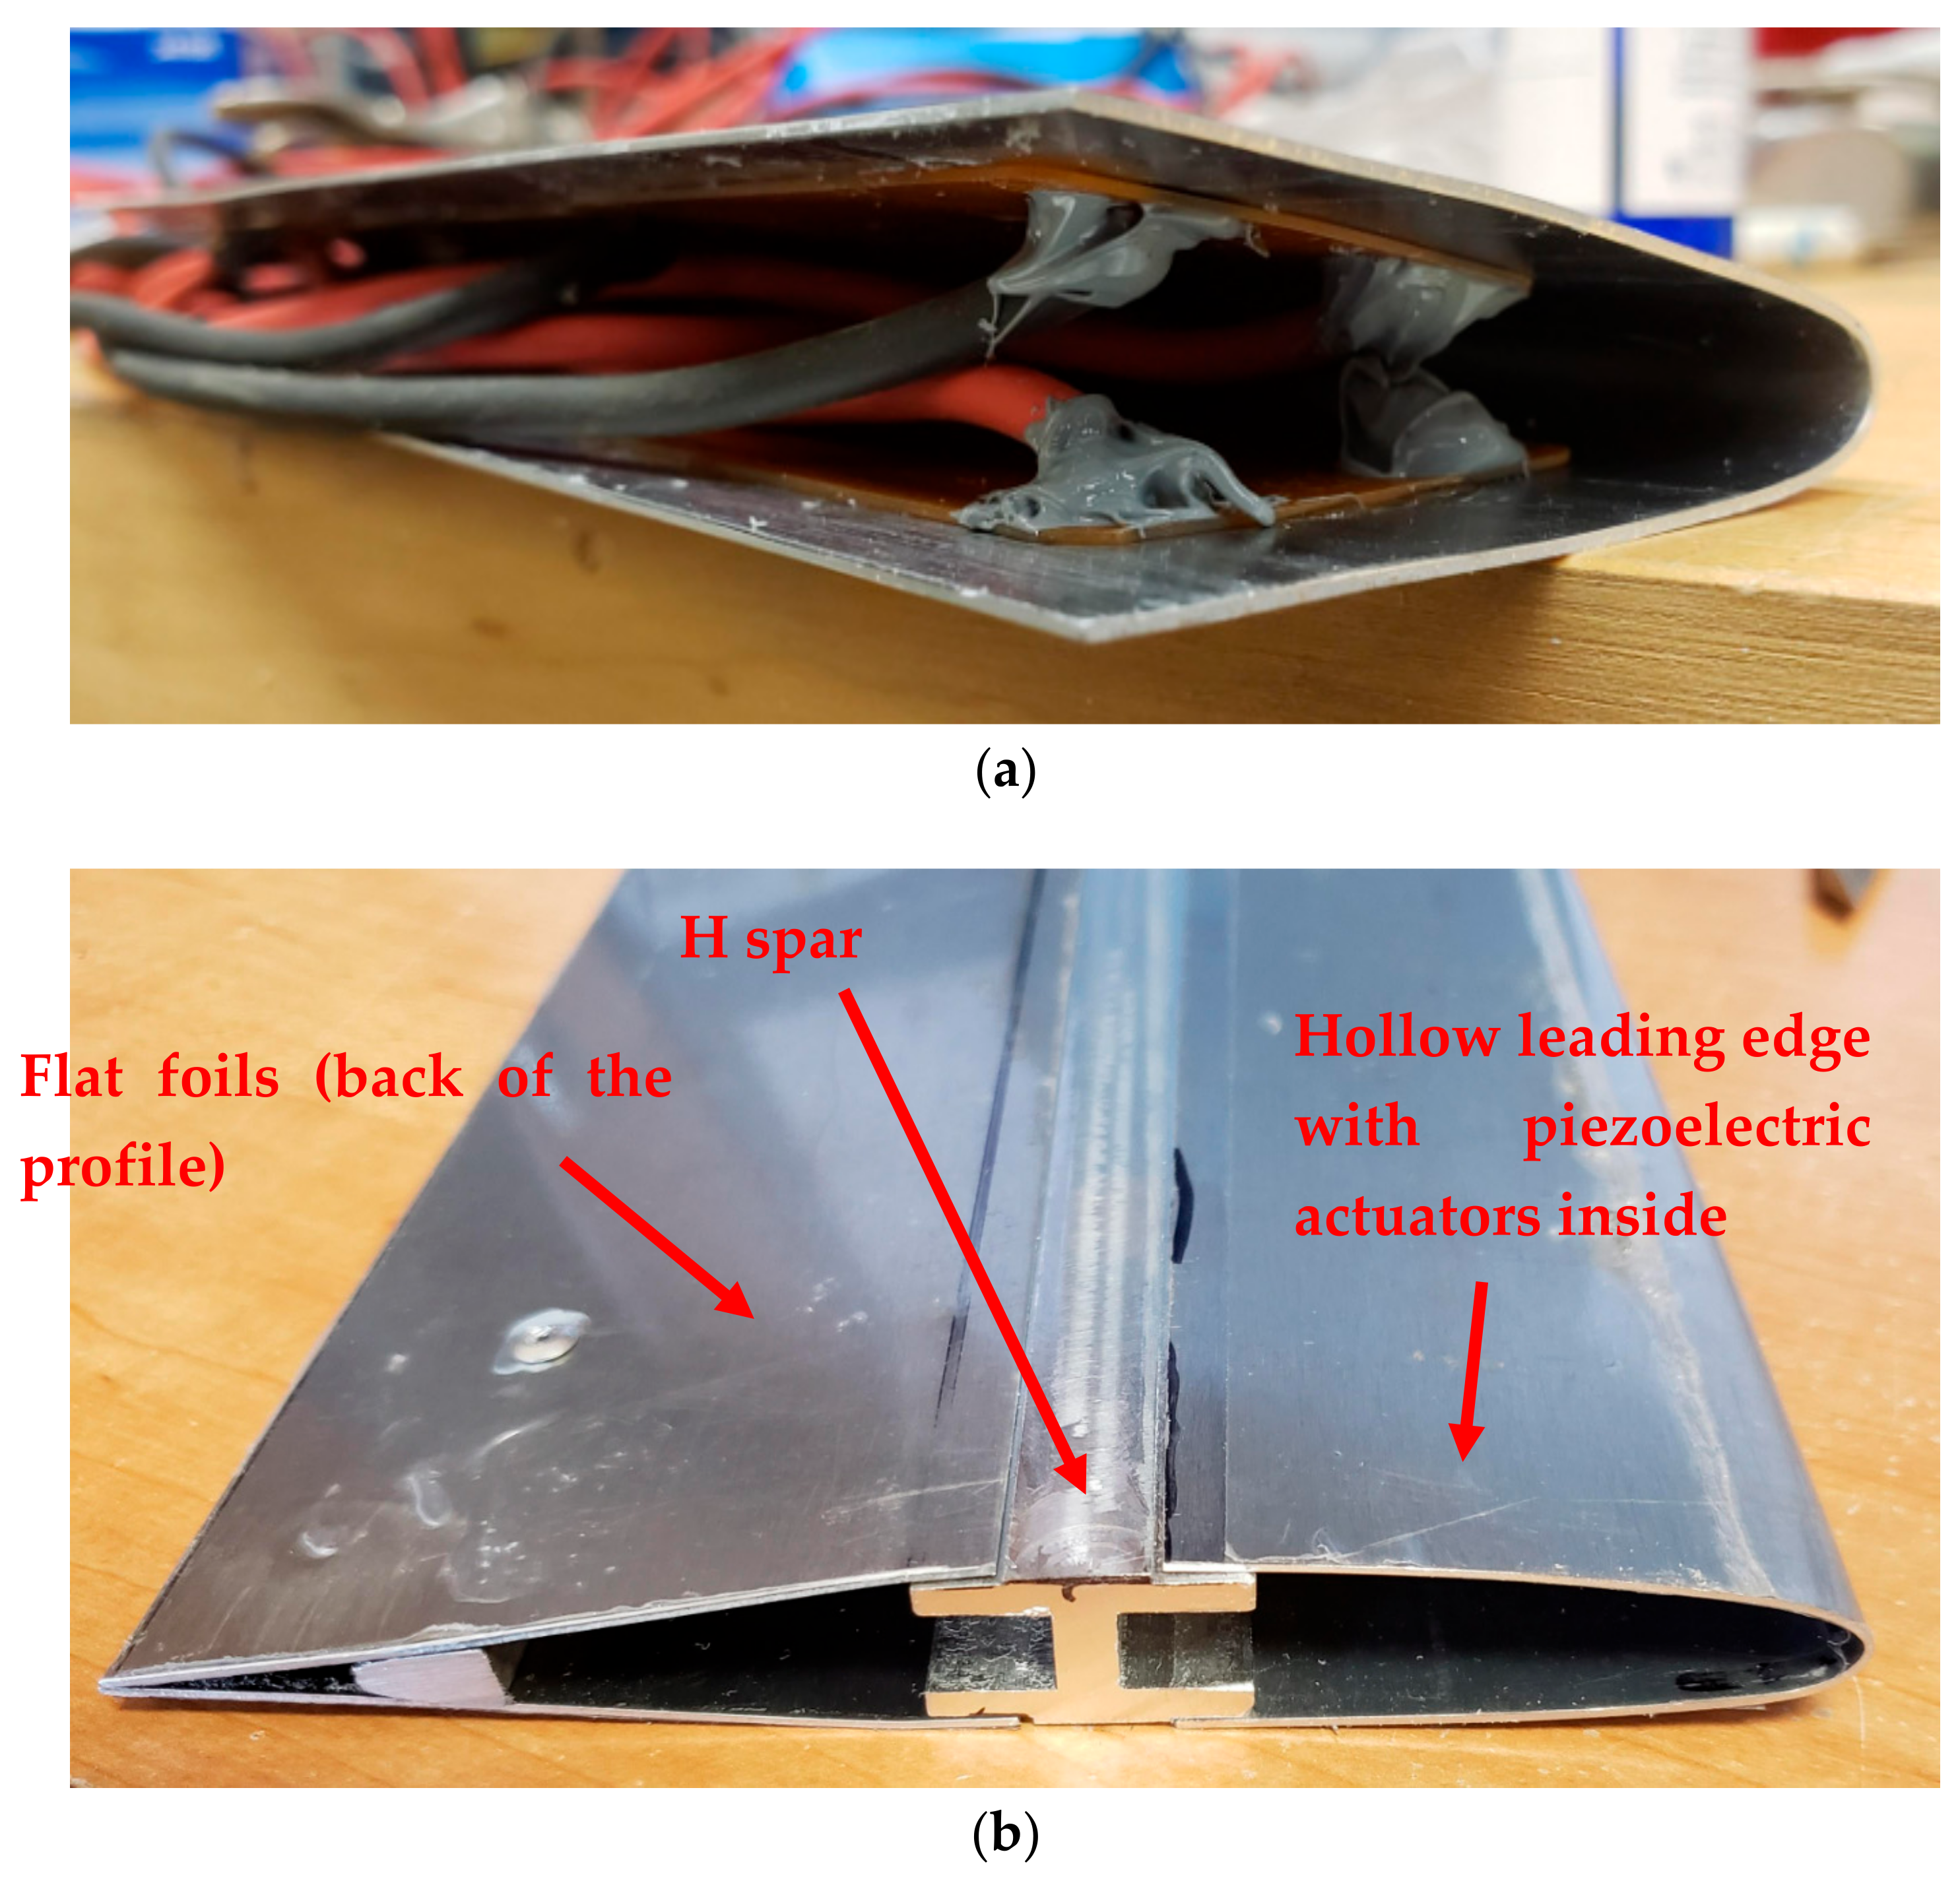
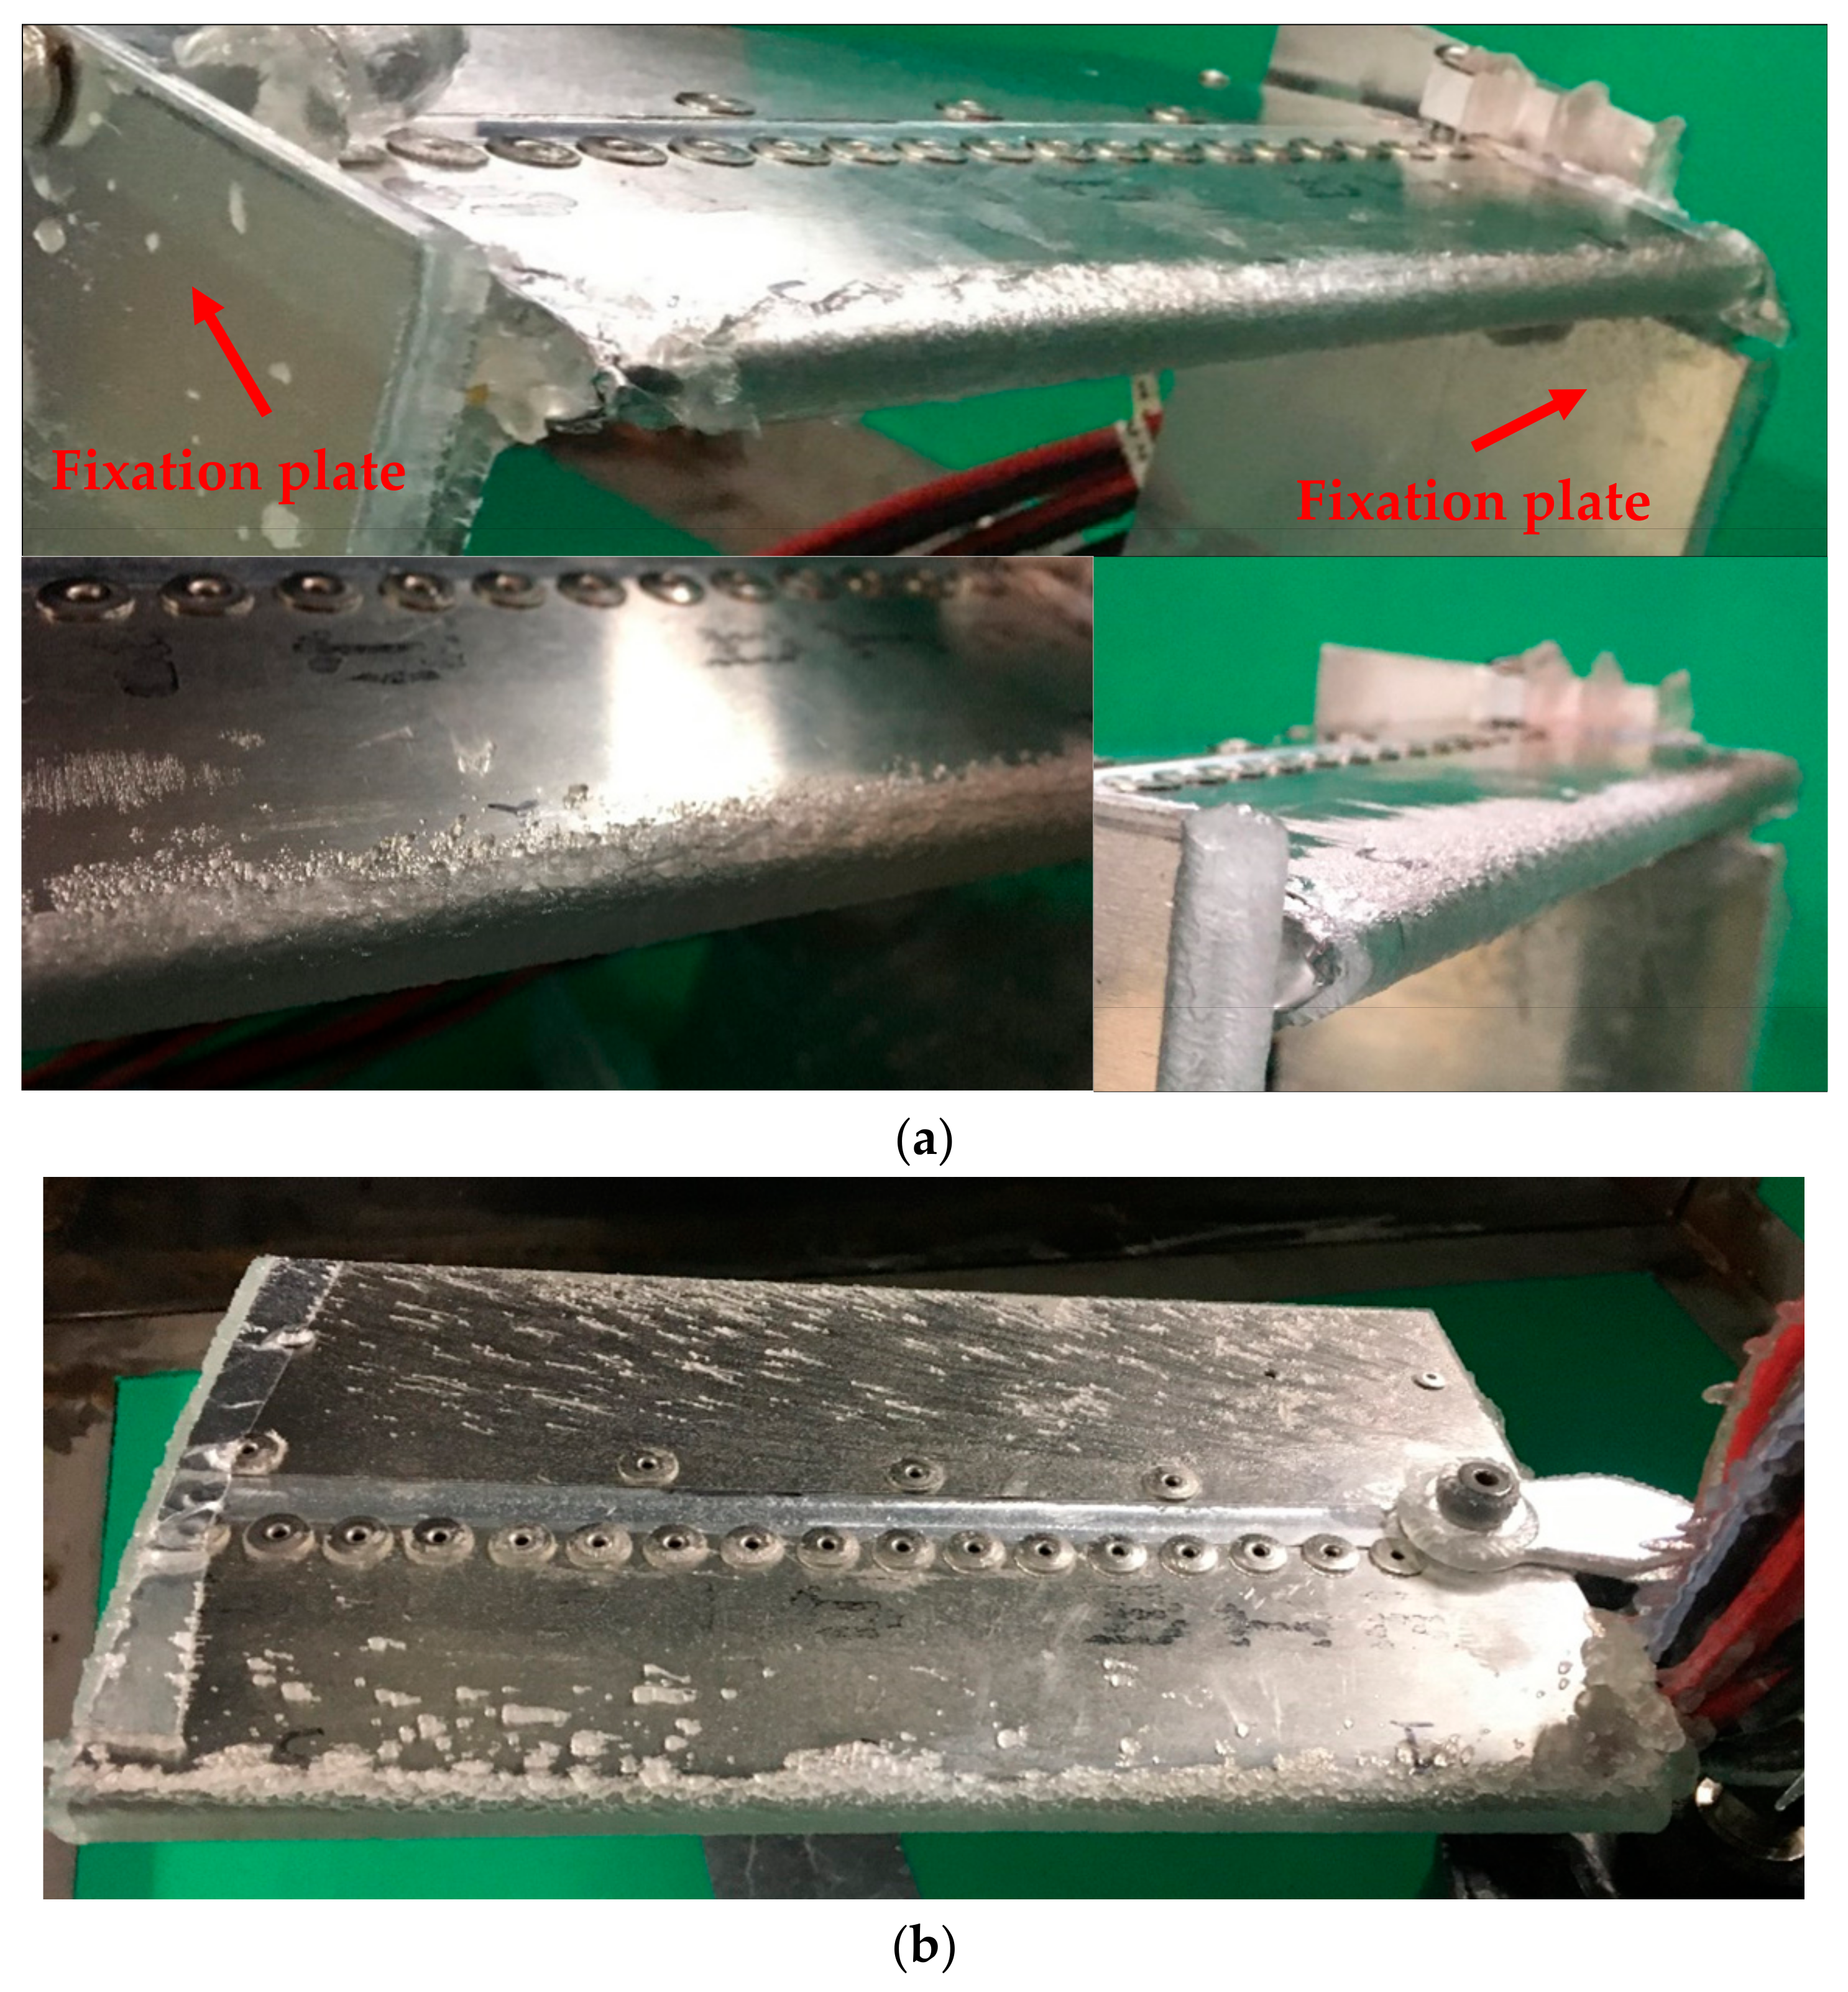
2.2. Static Small-Scale Blade
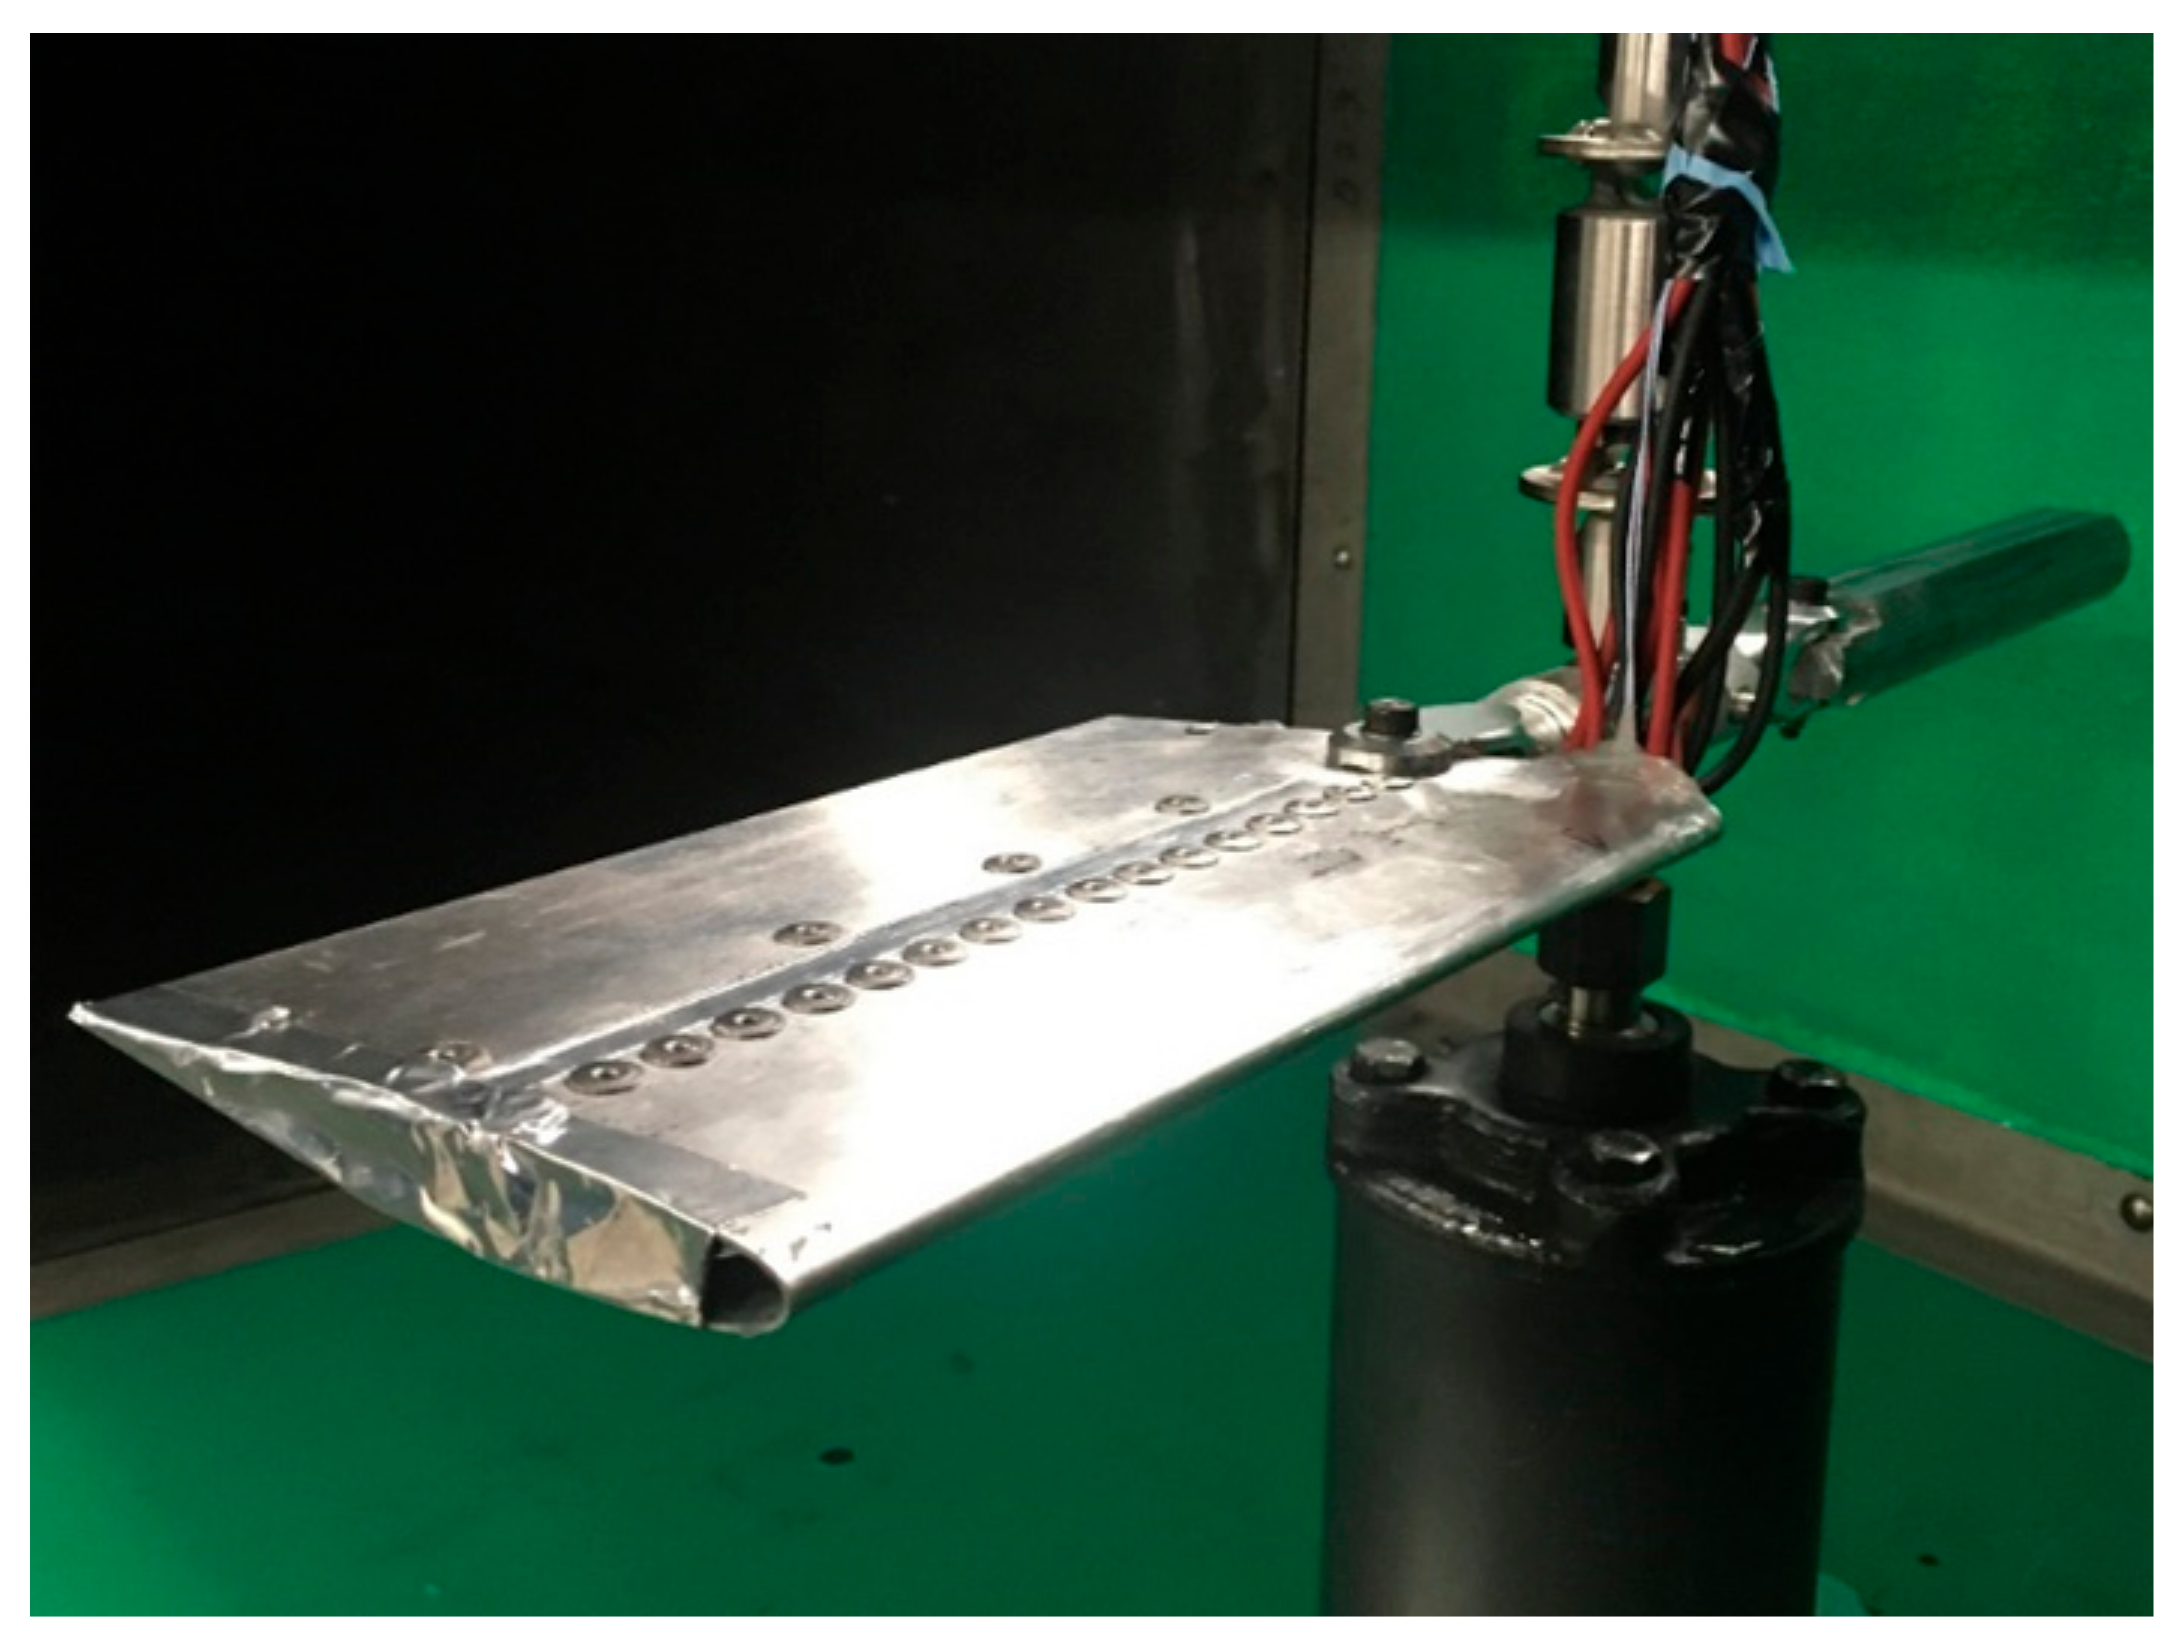
2.3. Rotating Small-Scale Blade
2.4. Test Conditions
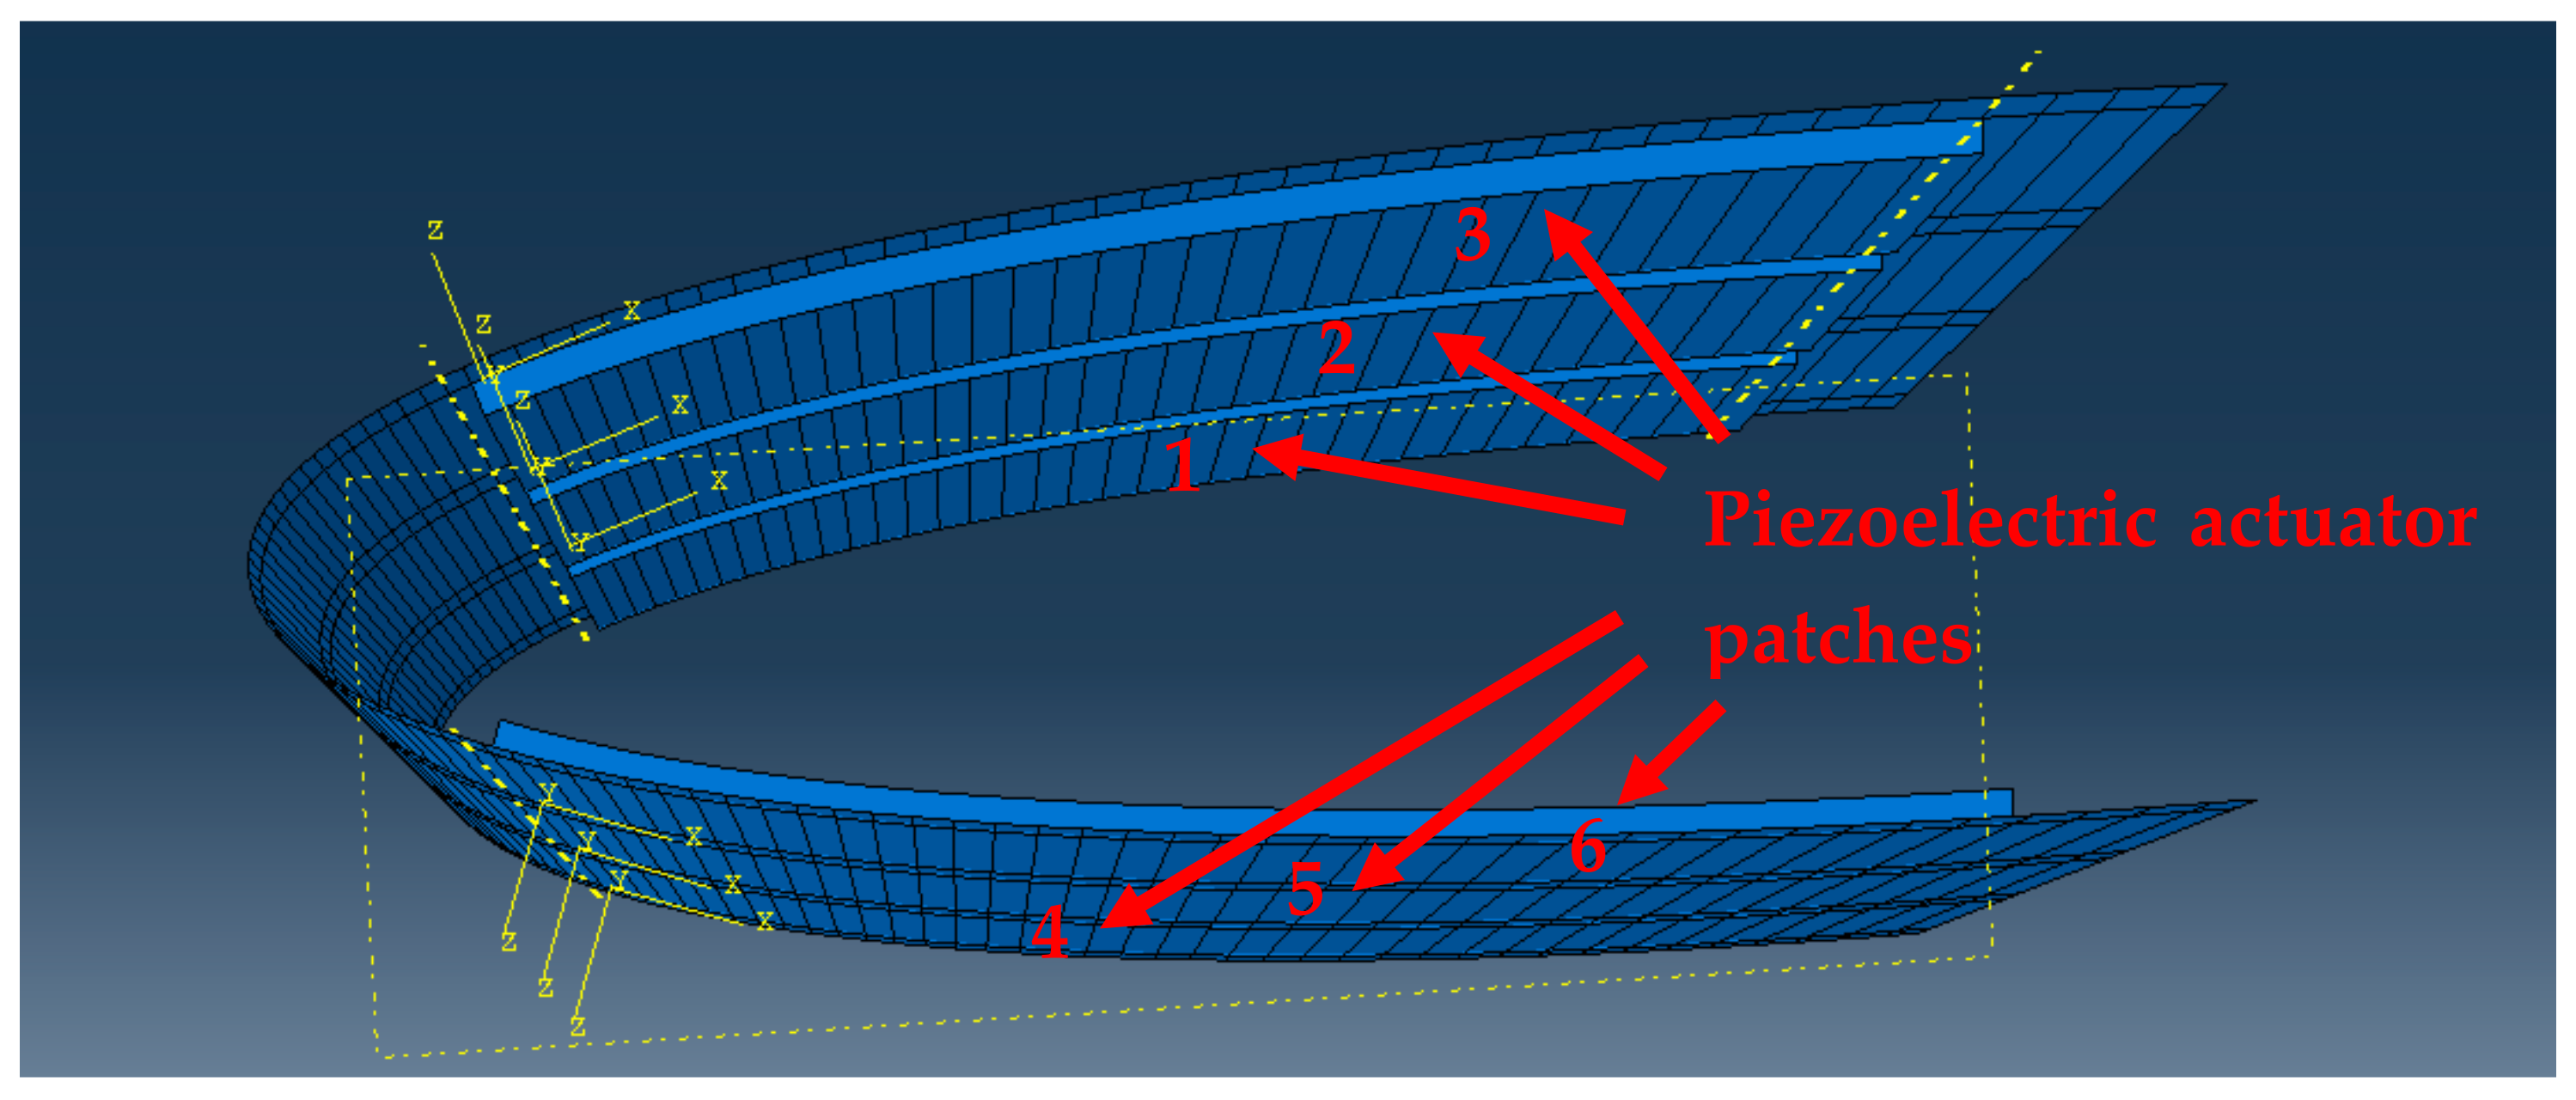
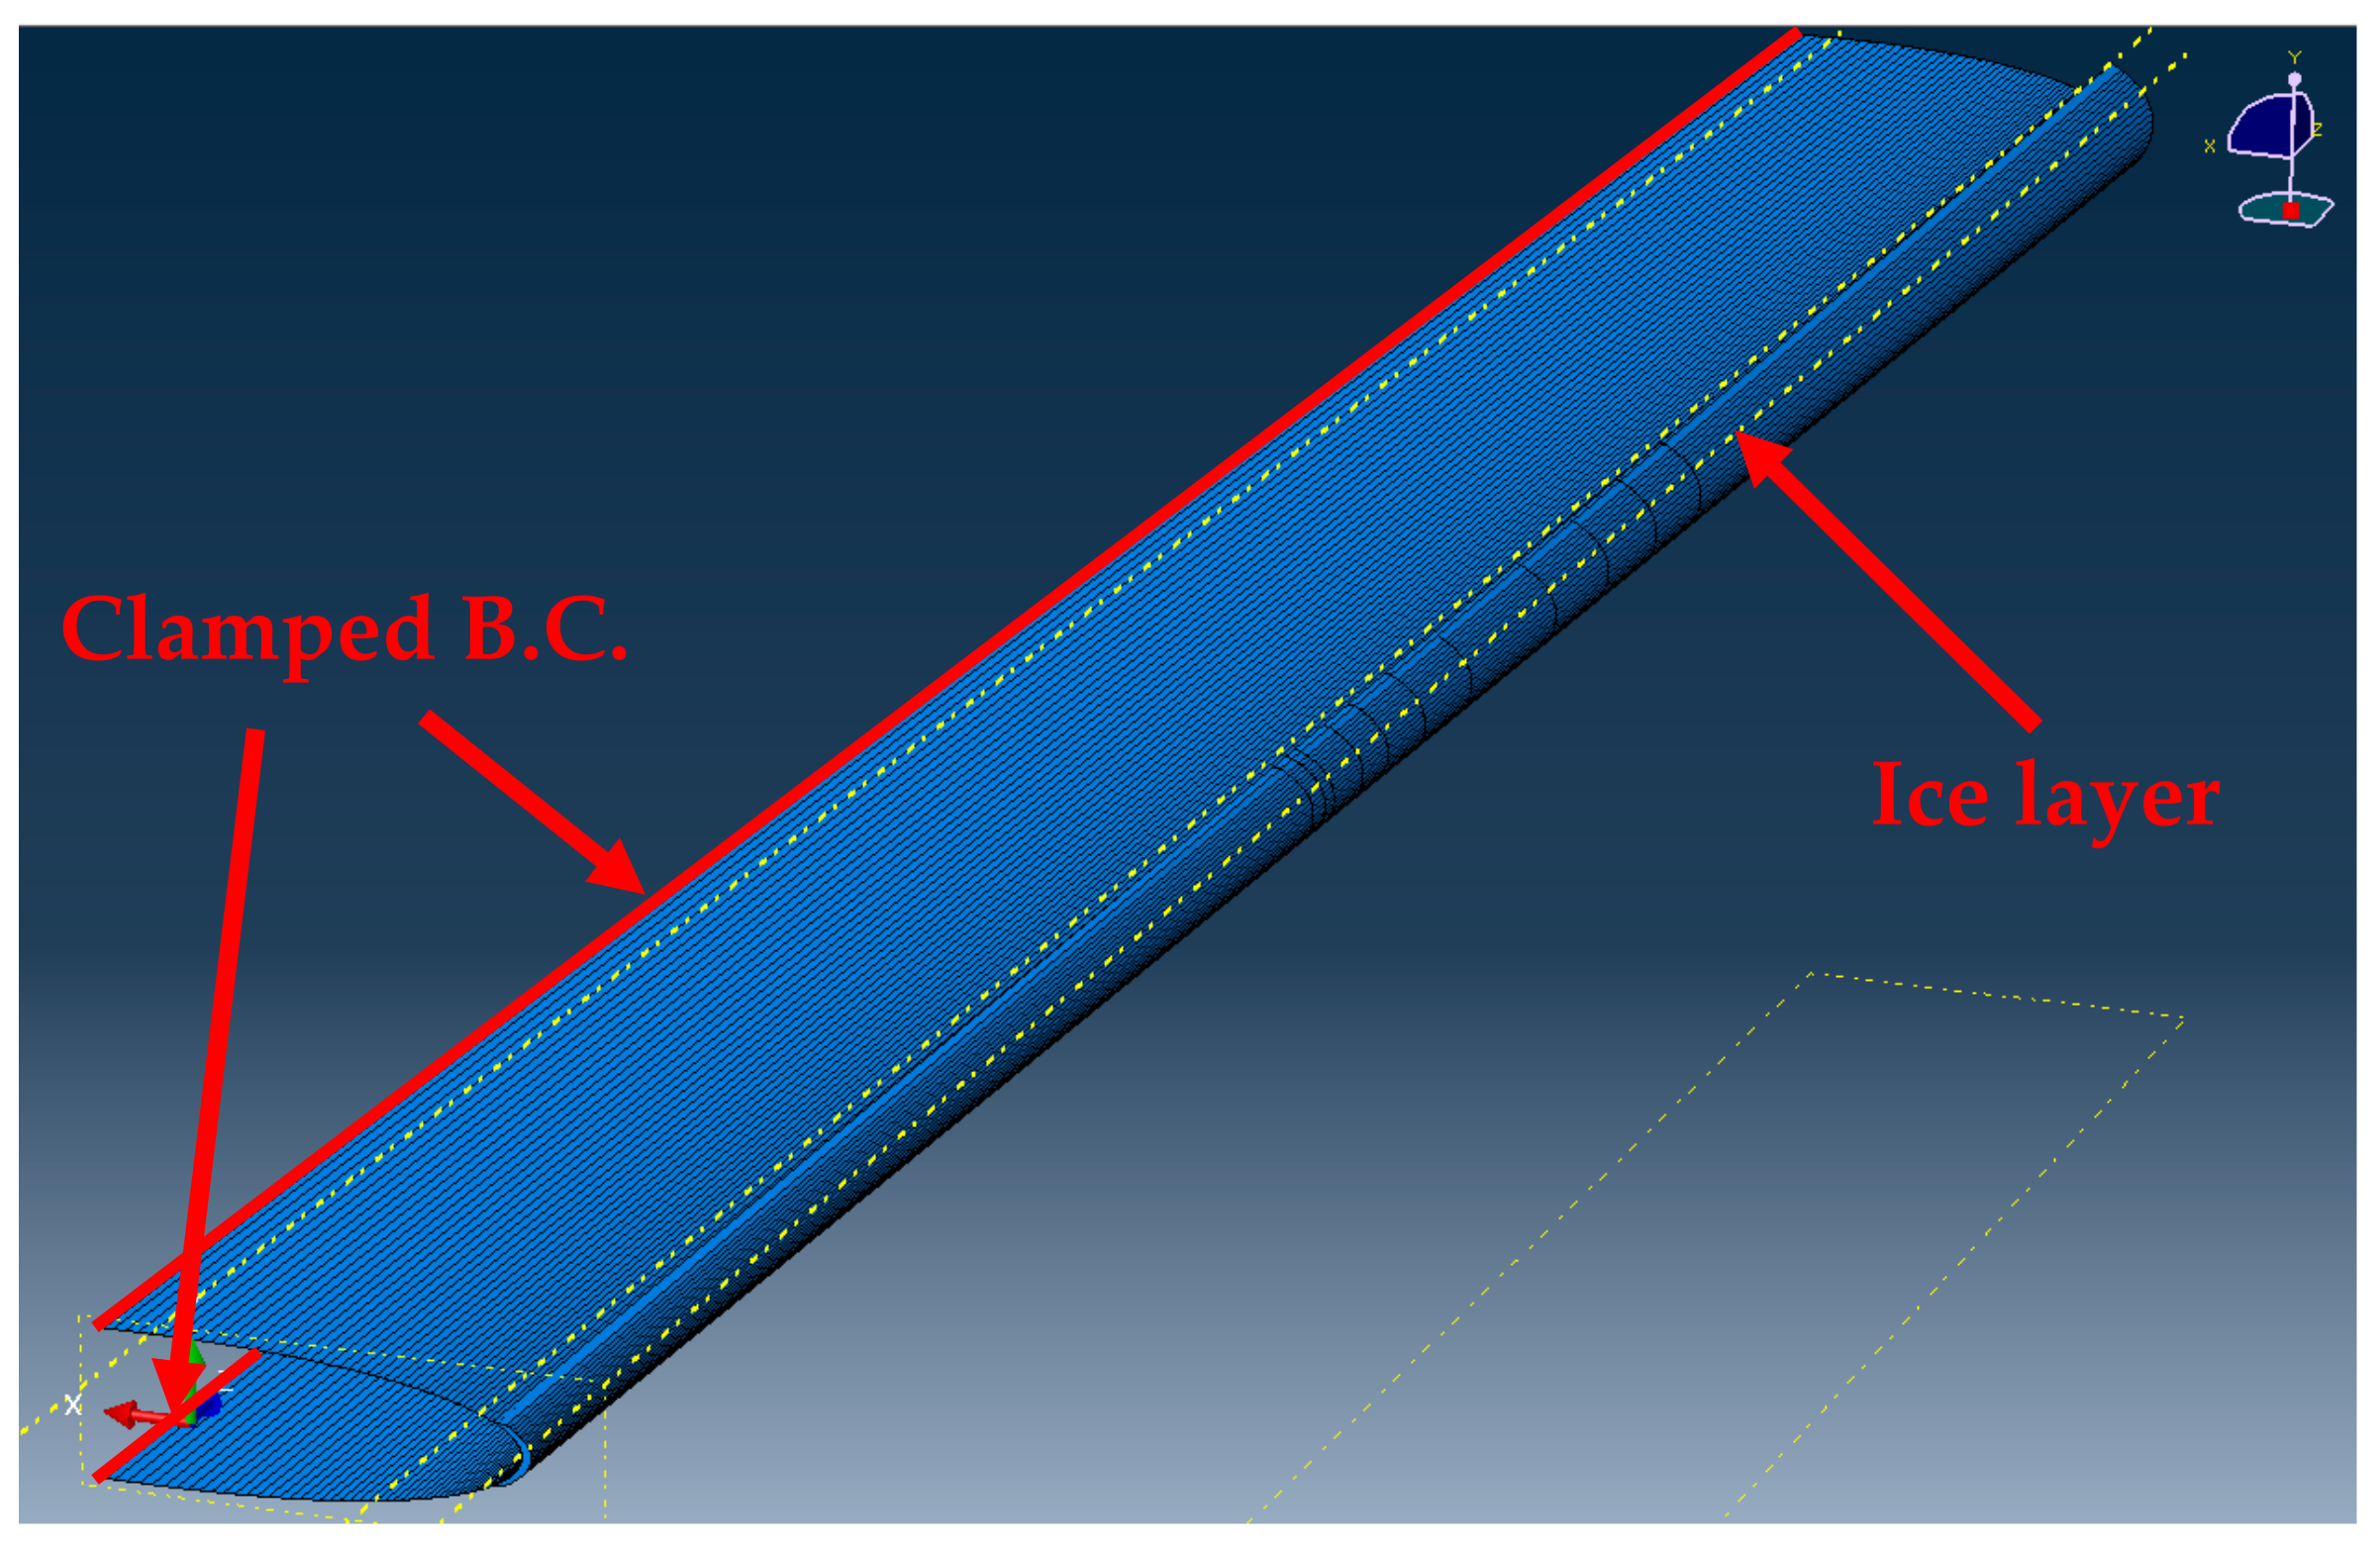
3. Numerical Model
4. Results
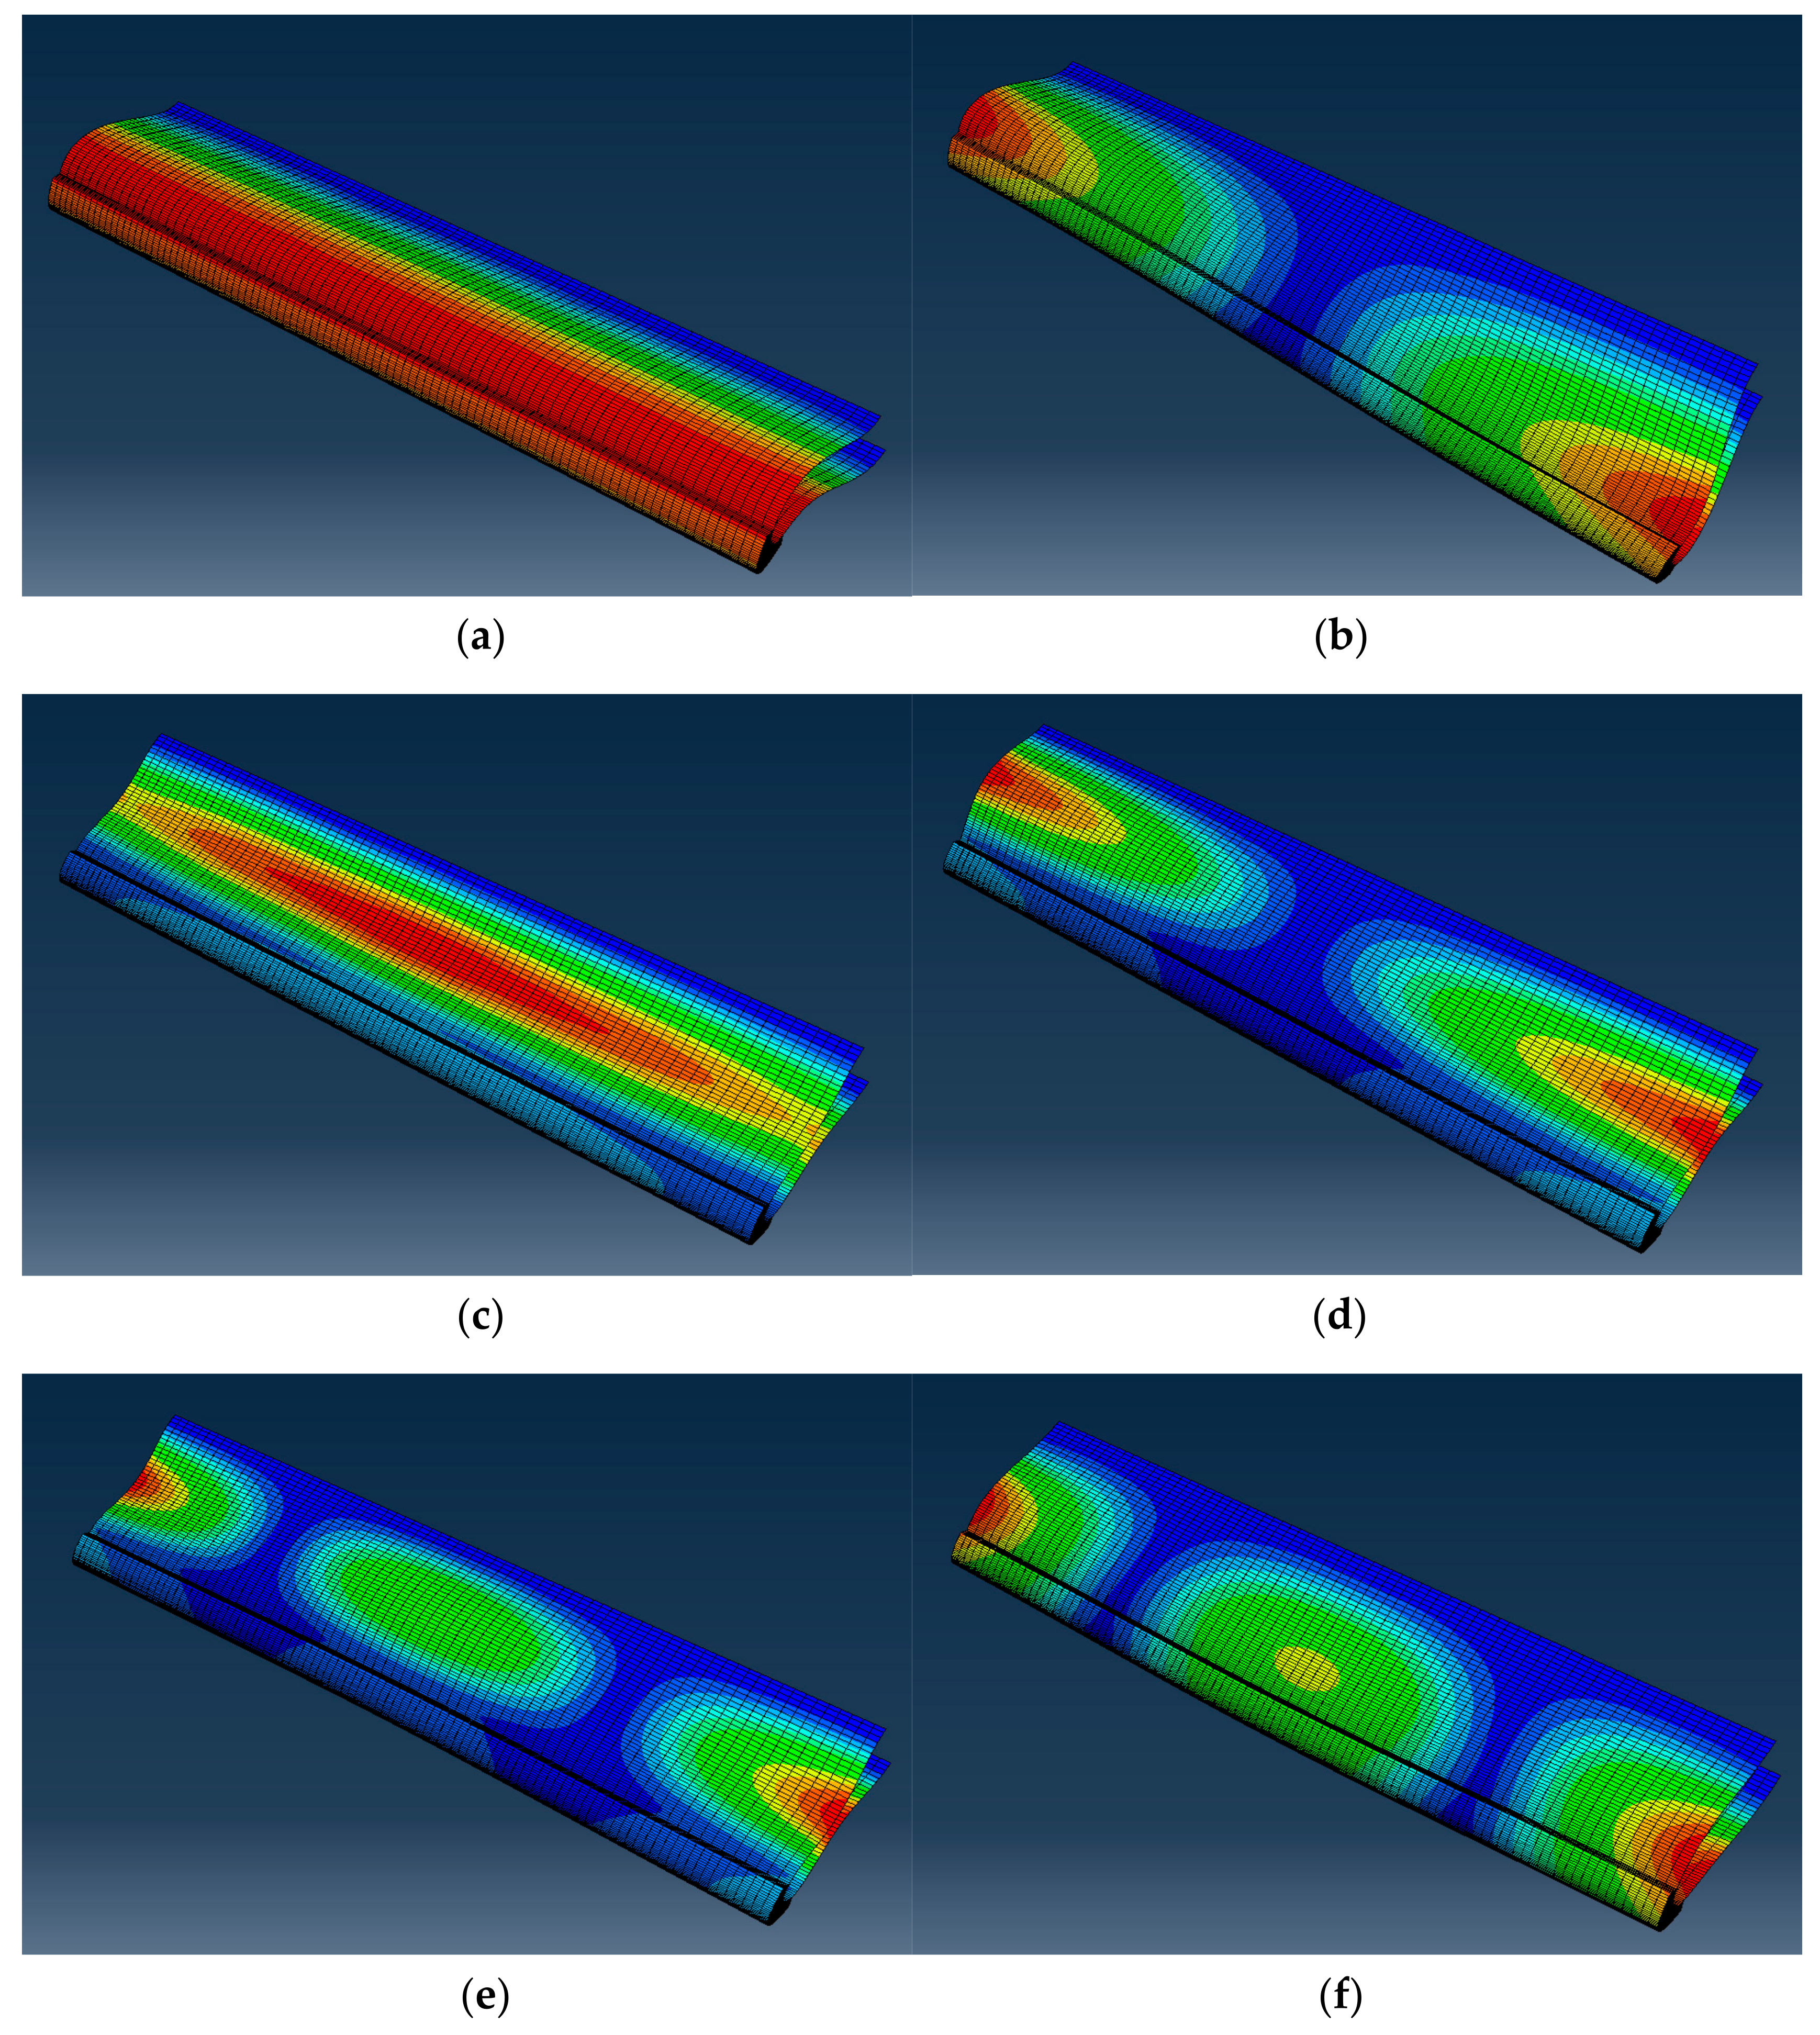
4.1. Frequency Analysis
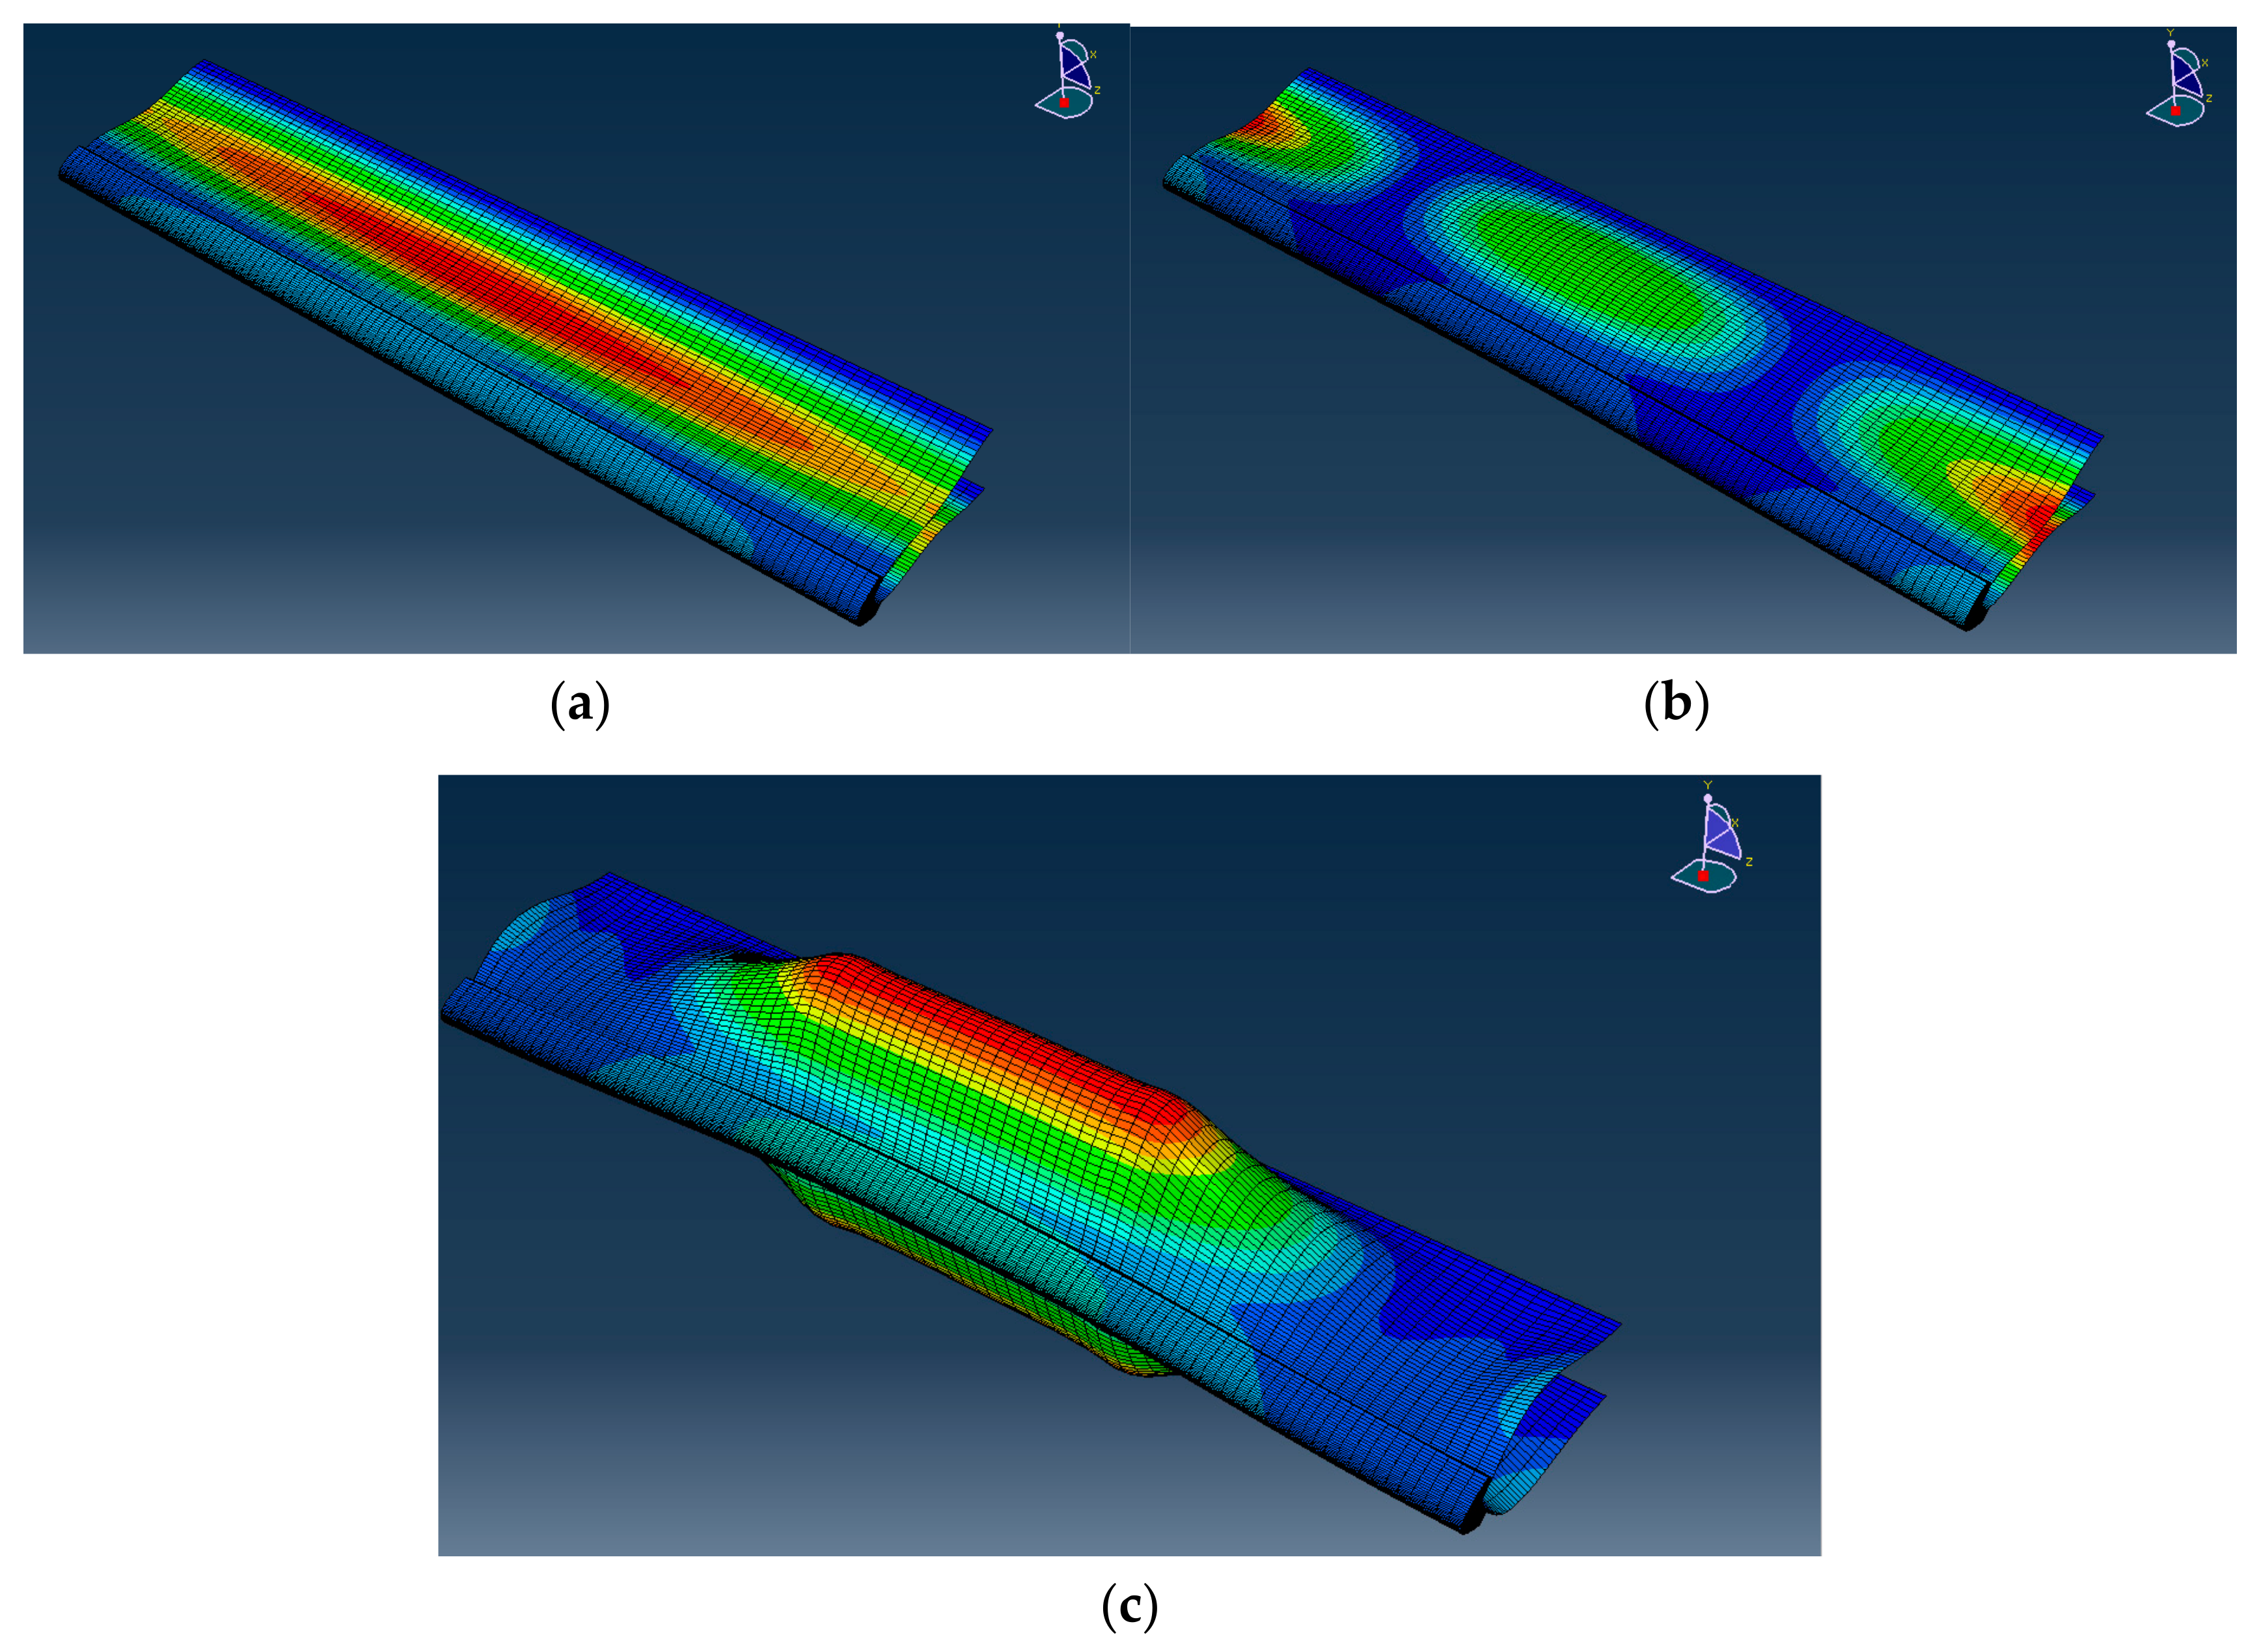
4.2. Static Direct Steady-Stade Dynamic Analysis
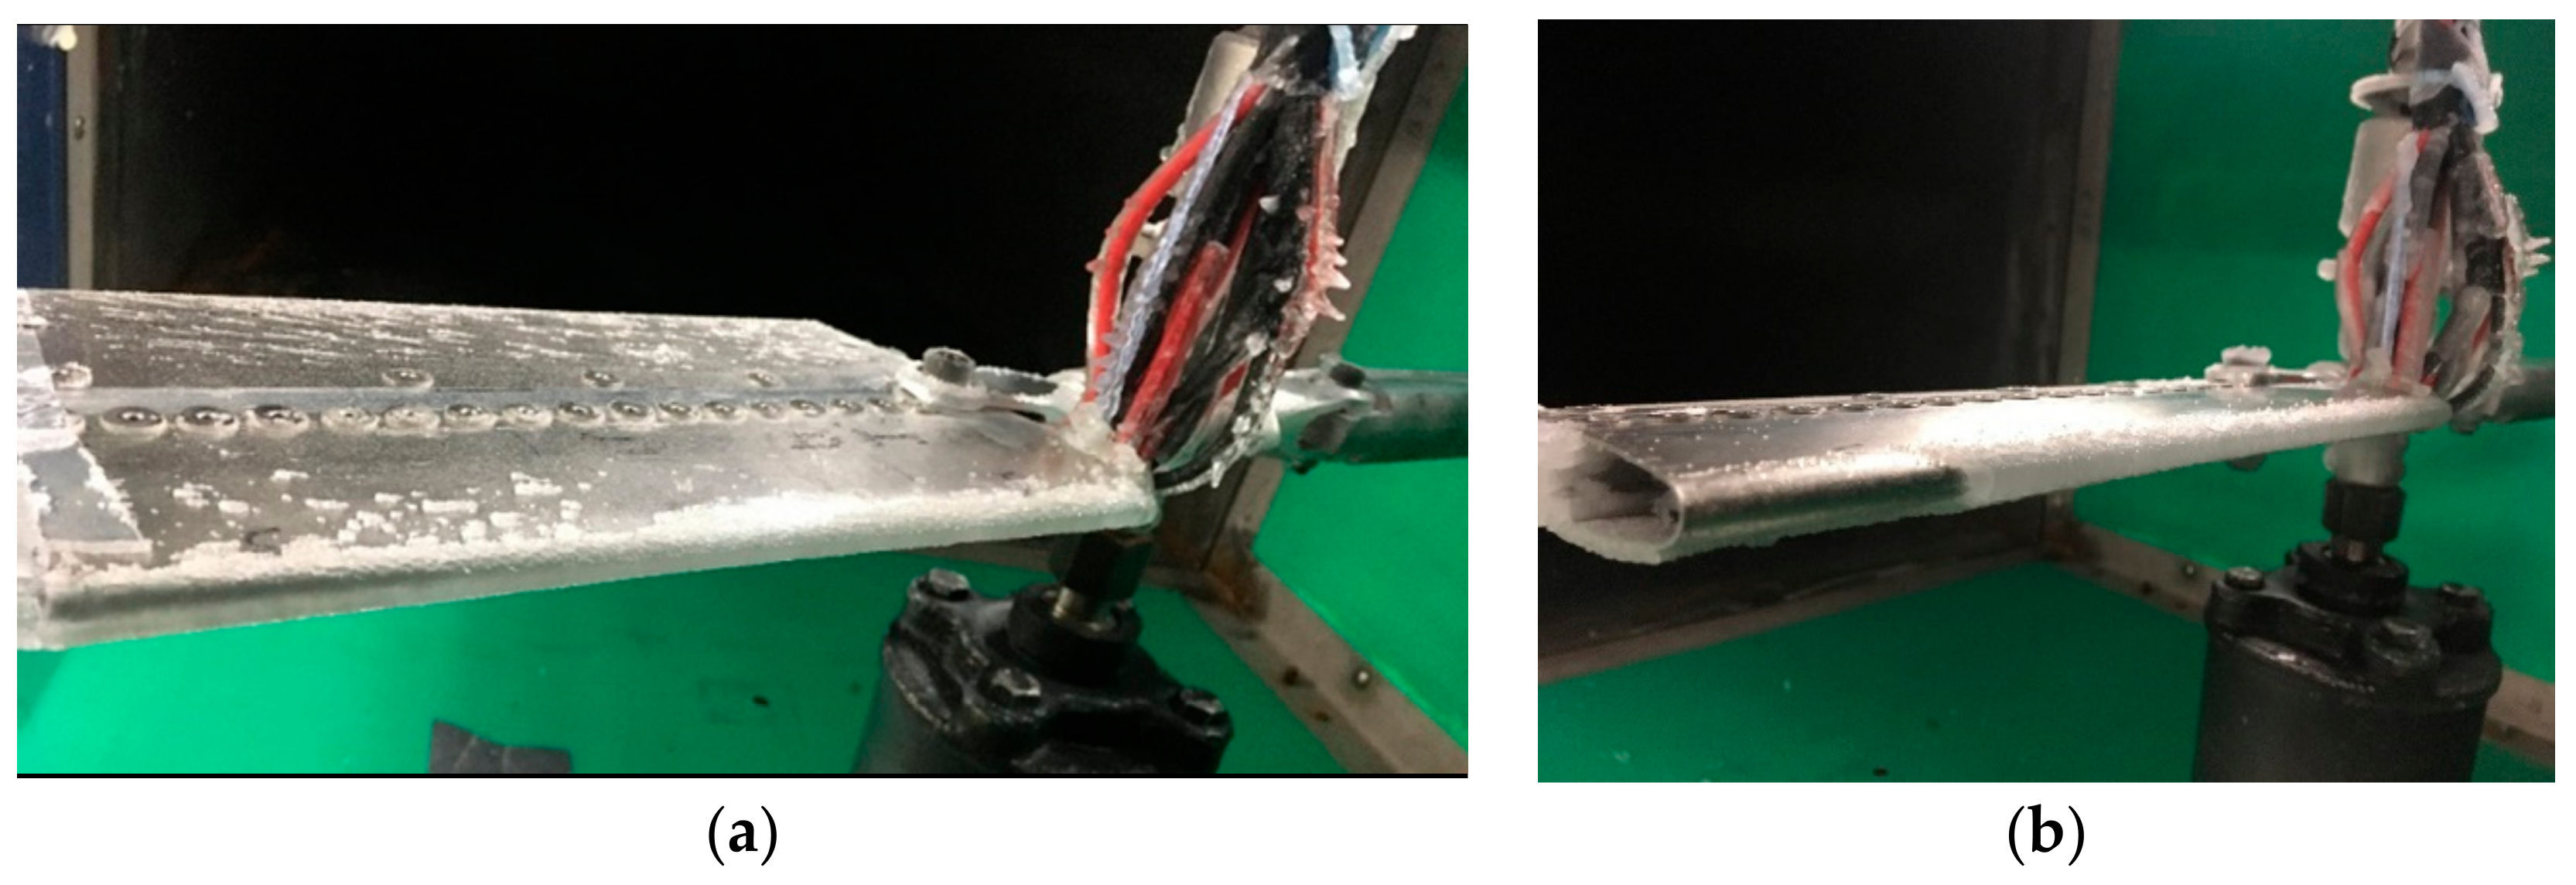
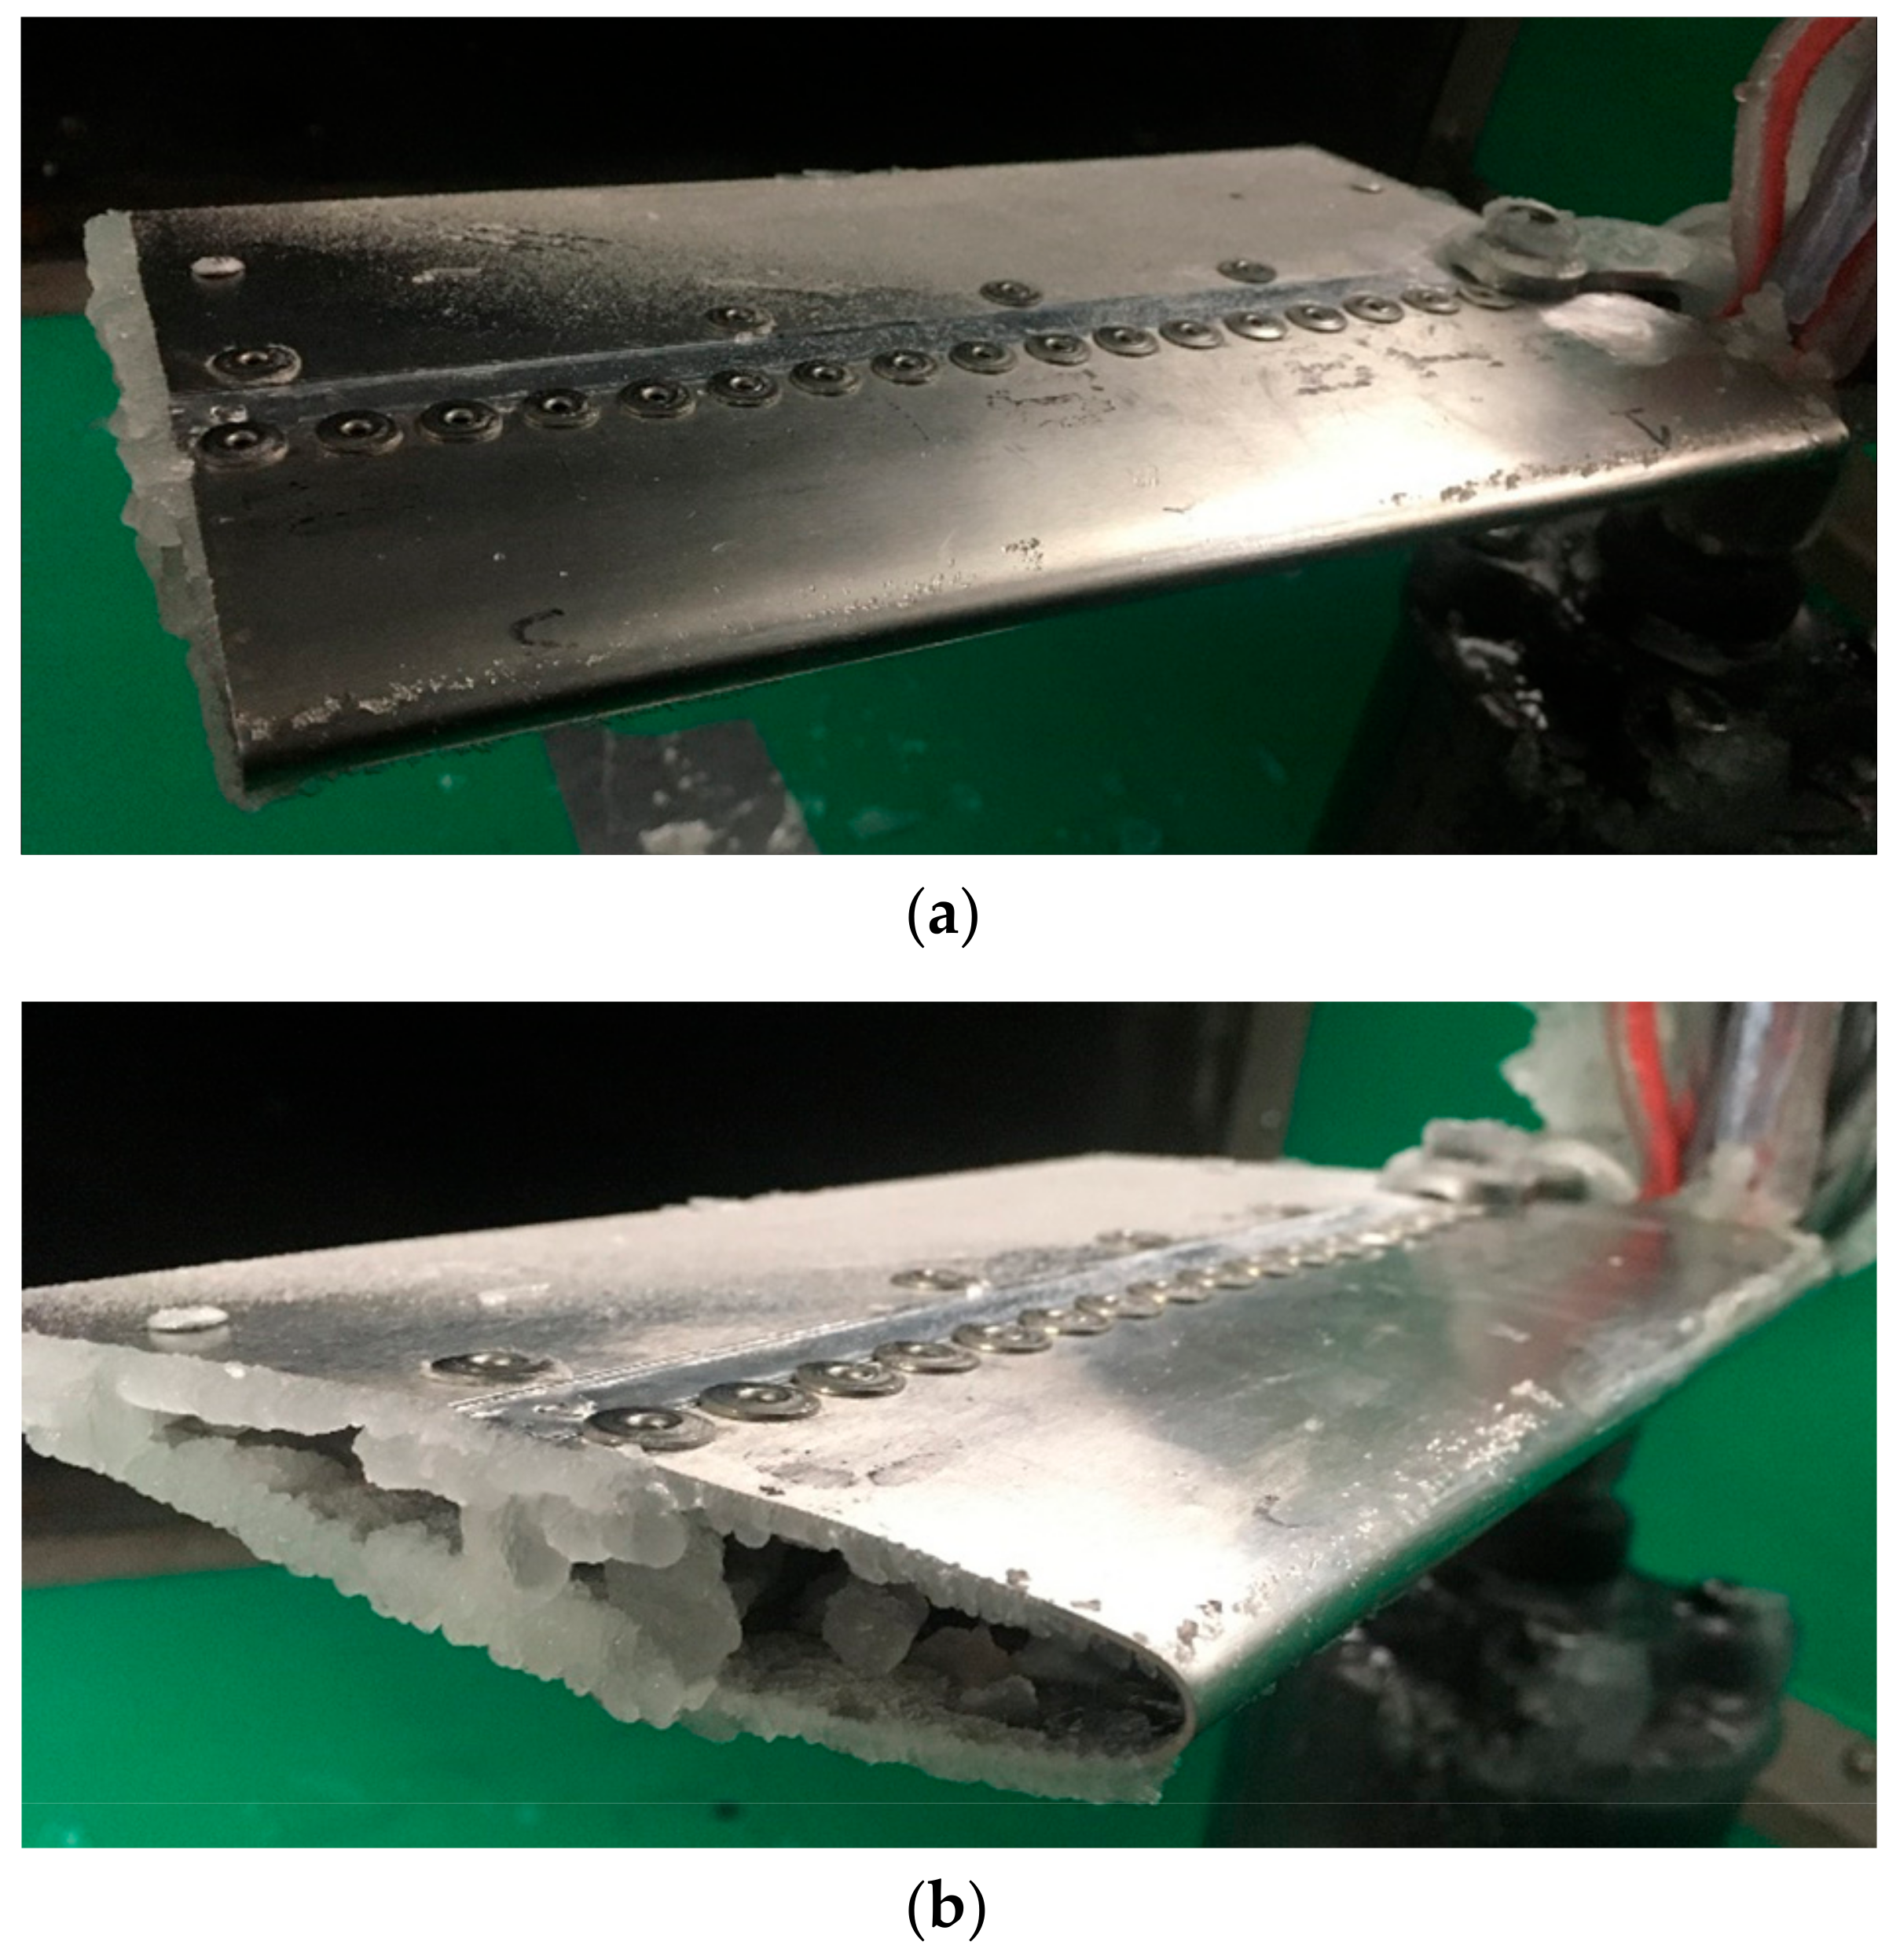
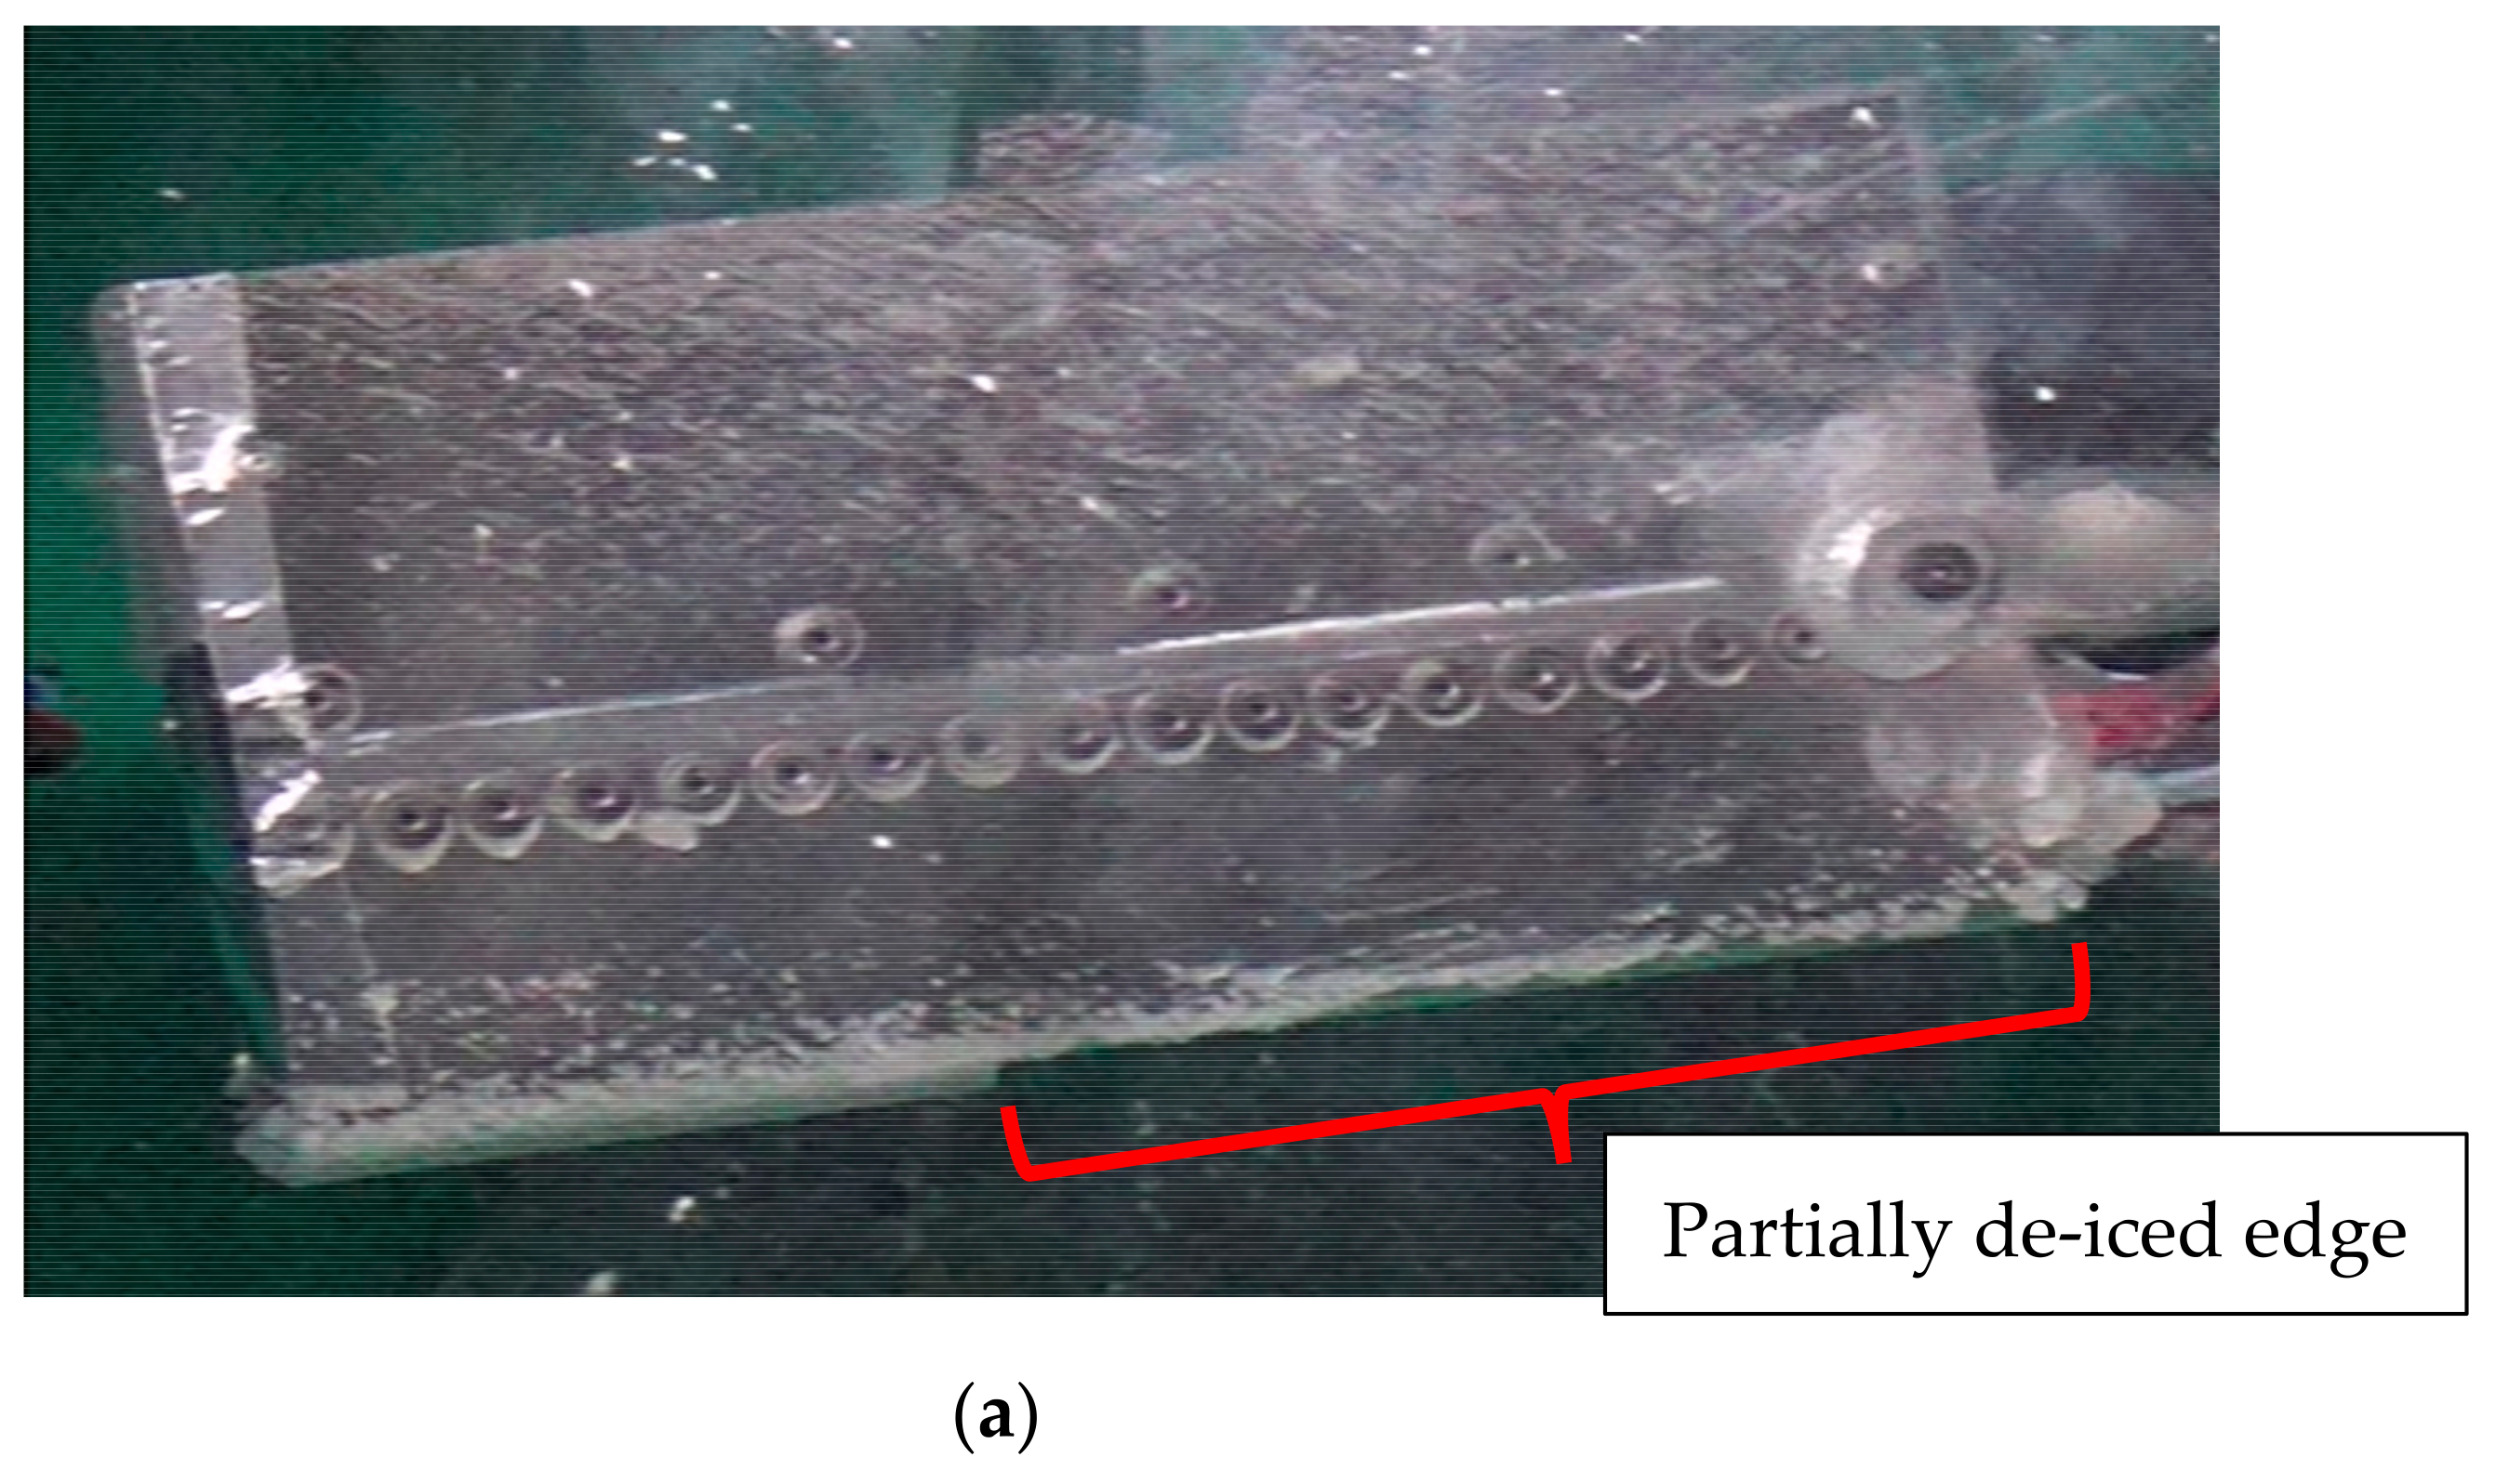
4.3. Rotating Blade
5. Discussion on the Small-Scale Blade Results
5.1. Experimental Variability
5.2. Numerical Model Stress Prediction
5.3. Power Consumption
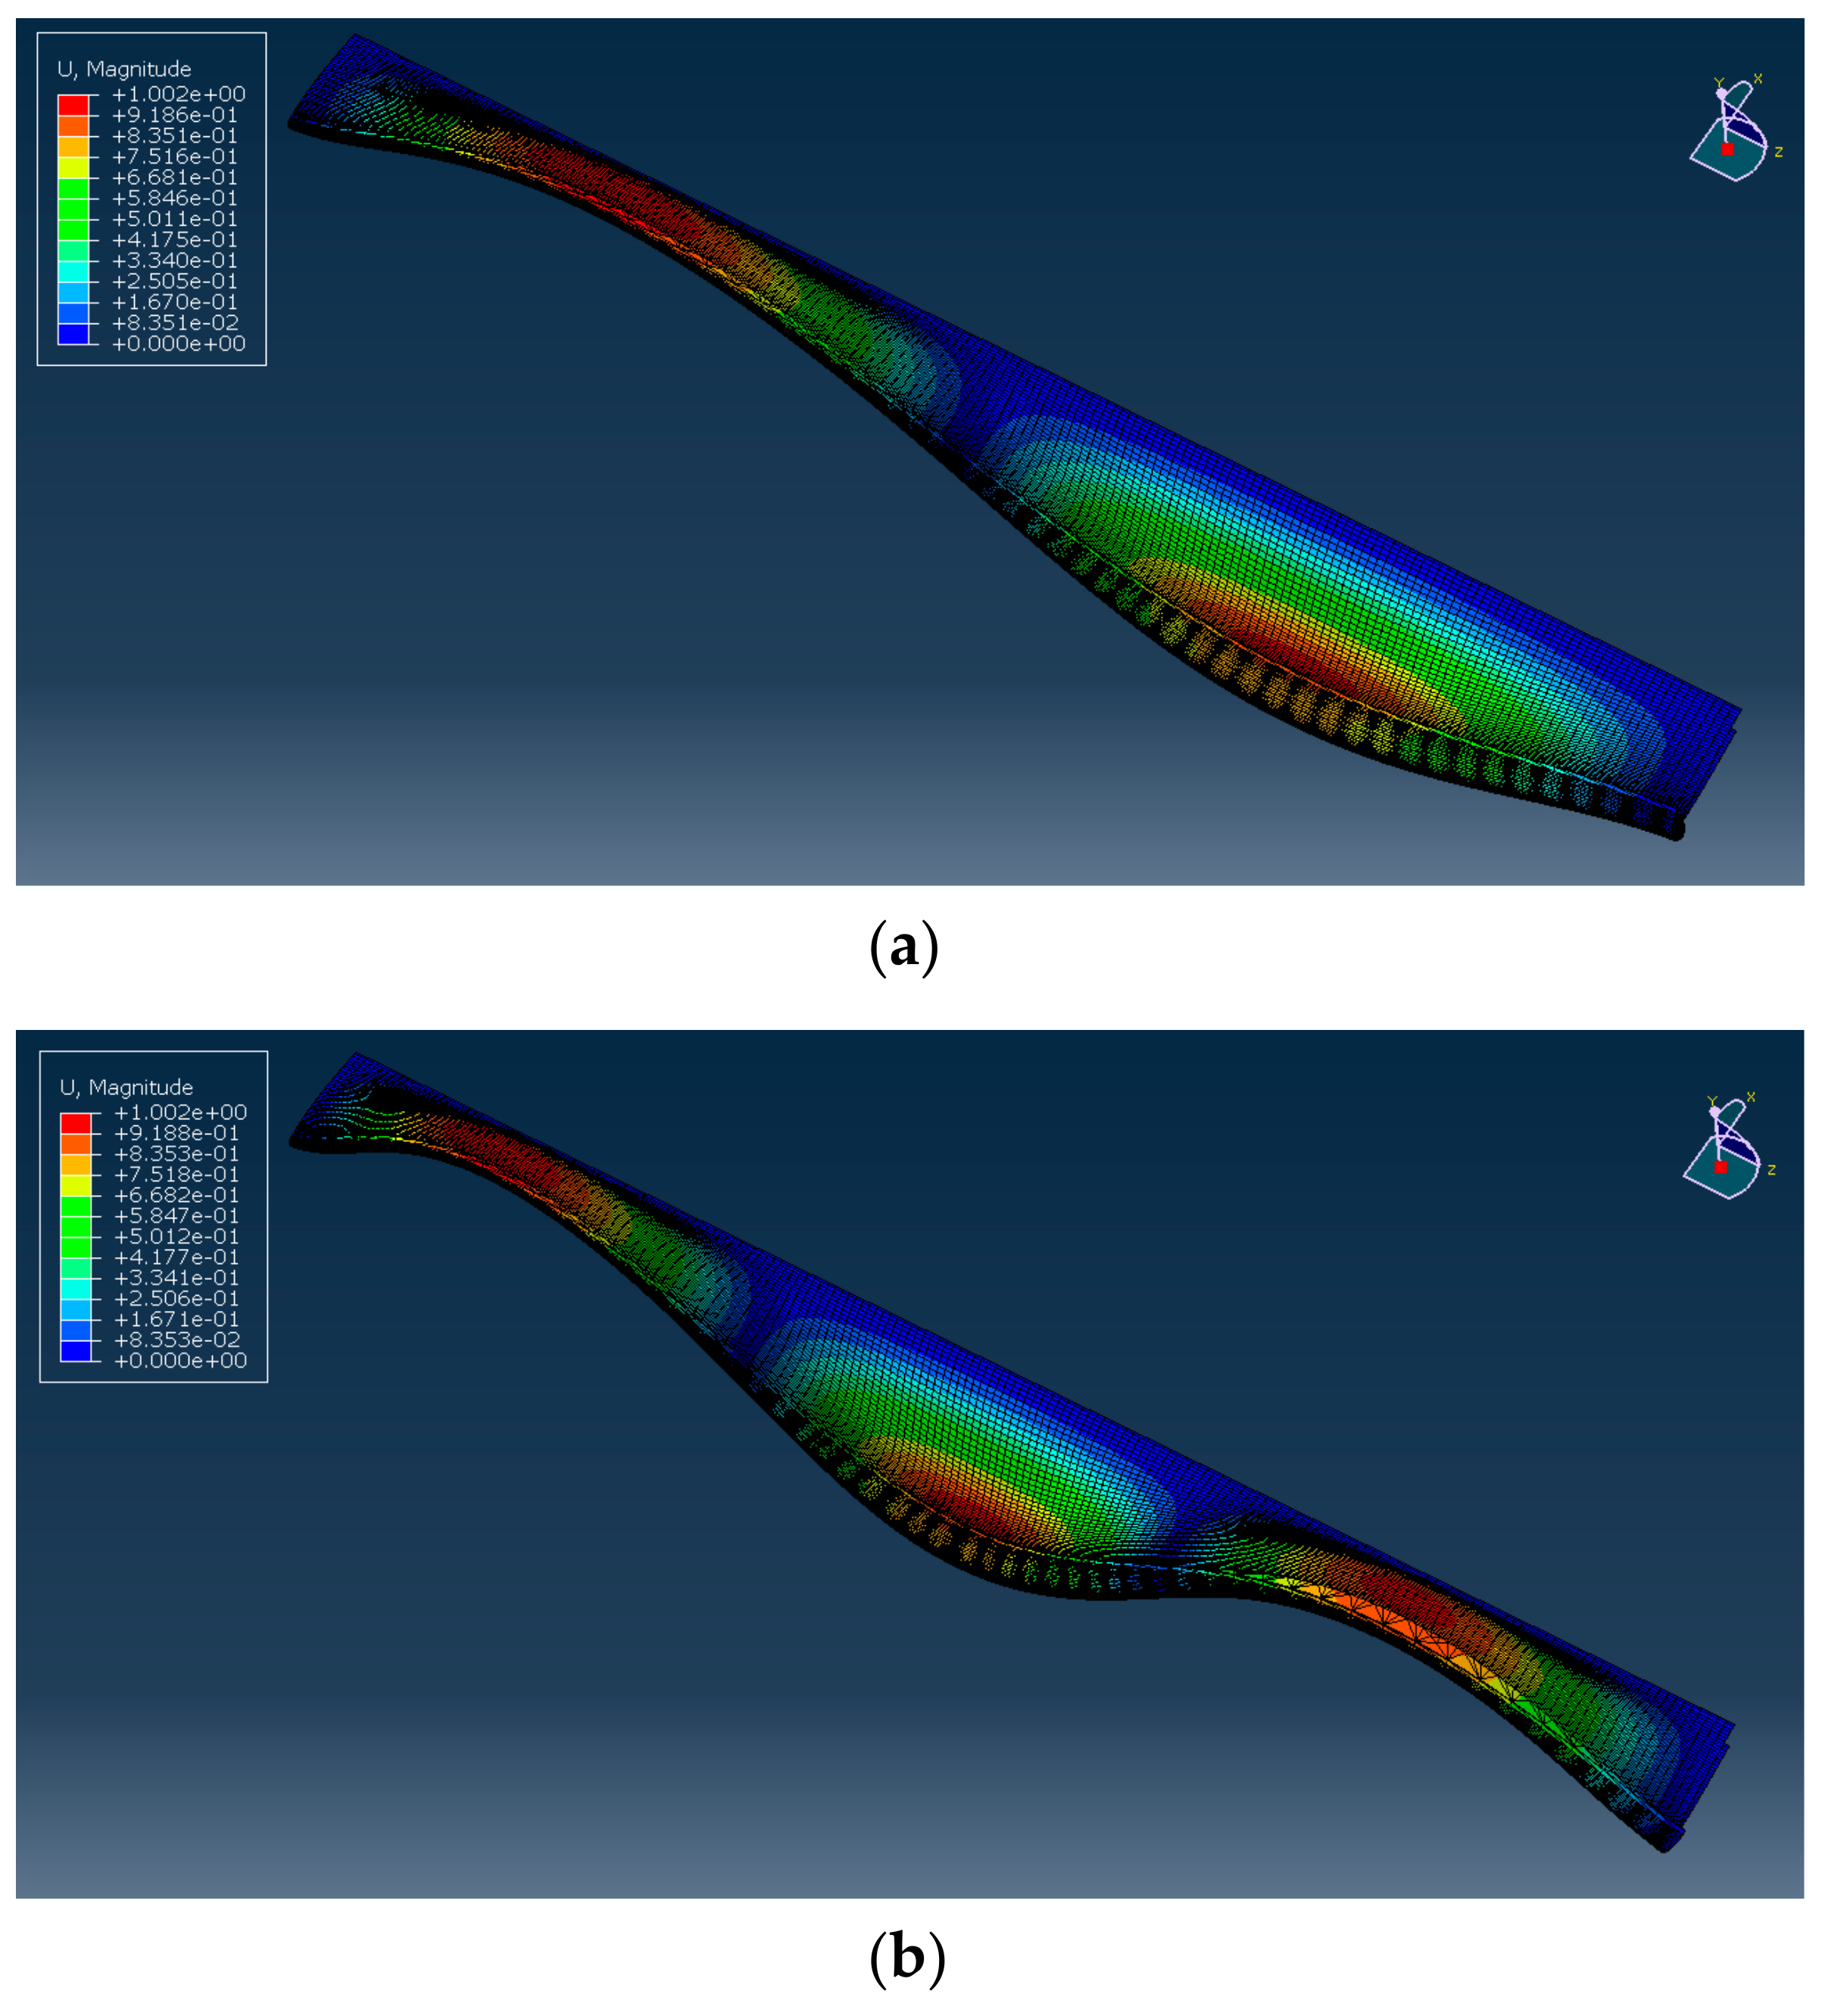
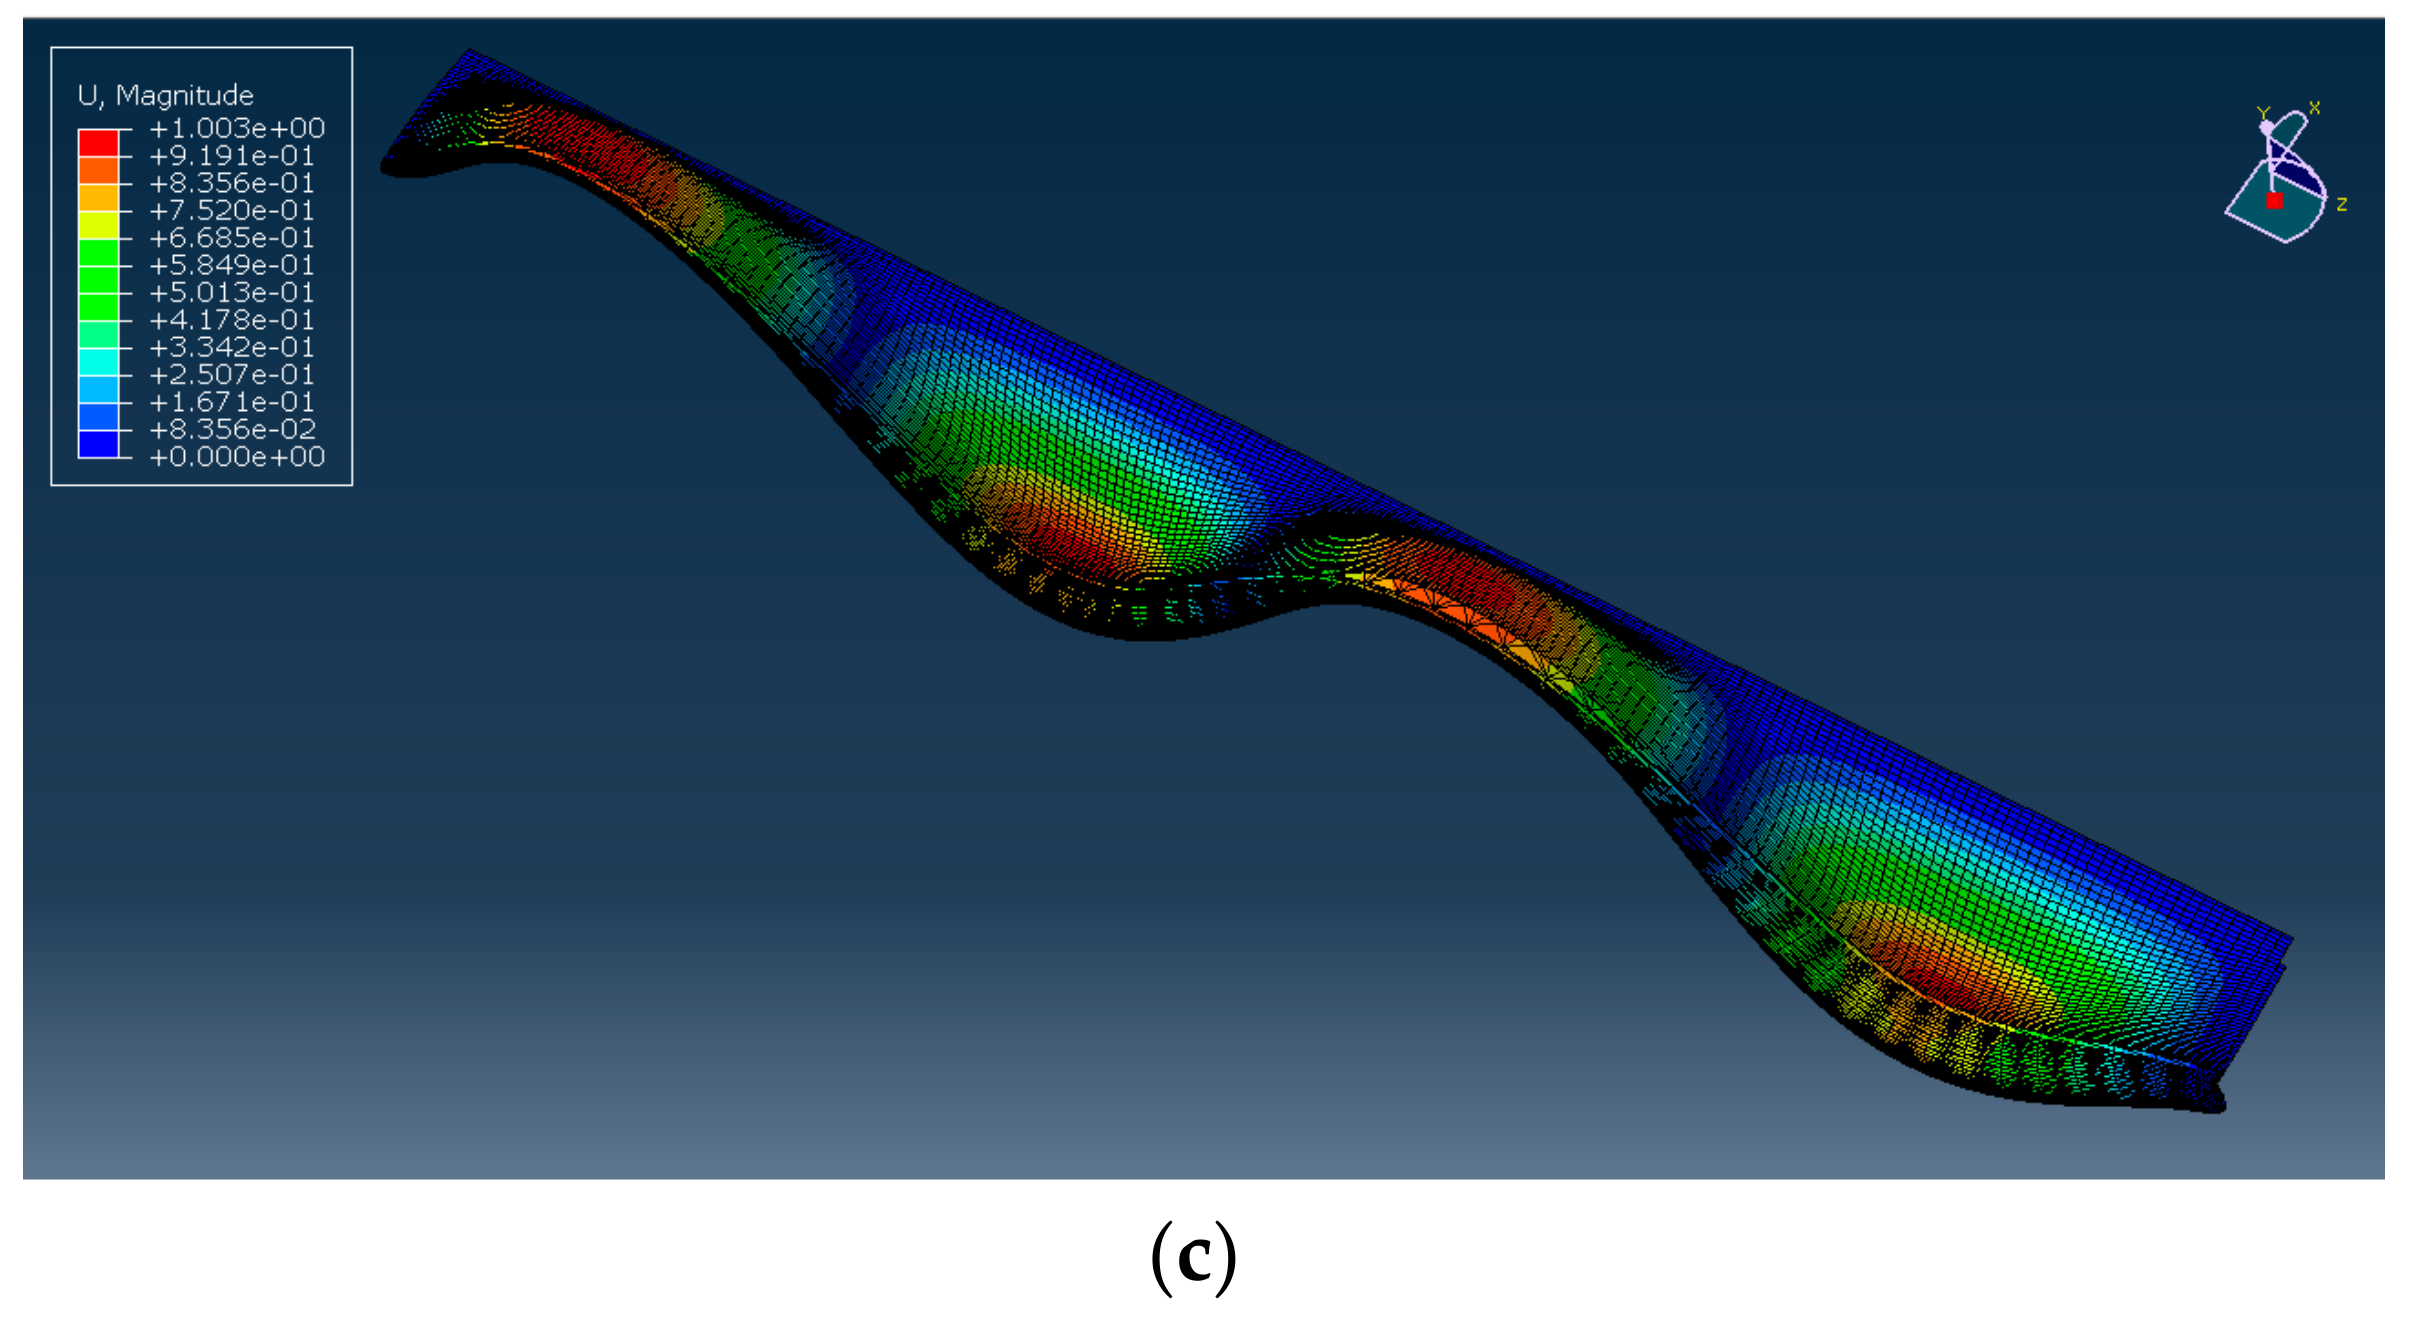
6. Full-Length Tail Rotor Leading Edge Numerical Case
6.1. Frequency and Direct Steady-State Dynamical Analysis
6.2. De-Icing Scenarios and Power Estimation
7. Conclusions
Author Contributions
Funding
Institutional Review Board Statement
Informed Consent Statement
Data Availability Statement
Conflicts of Interest
References
- Flight Safety Foundation. Inflight Icing and the Helicopter—Results of a U.S. Army investigation into the unique hazards facing rotary wing operations in the winter environment offers timely tips for all helicopter flight crews. Helicopter Saf. 1990, 16, 4. [Google Scholar]
- Coffman, H.J., Jr. Helicopter Rotor Icing Protection Methods. J. Am. Helicopter. Soc. 1987, 32, 34–39. [Google Scholar] [CrossRef]
- Liu, Y.; Li, L.; Ning, Z.; Tian, W.; Hu, H. Experimental investigation on the dynamic icing process over a rotating propeller model. J. Propuls. Power 2018, 34, 933–946. [Google Scholar] [CrossRef] [Green Version]
- Liu, Y.; Li, L.; Chen, W.; Tian, W.; Hu, H. An experimental study on the aerodynamic performance degradation of a UAS propeller model induced by ice accretion process. Exp. Therm. Fluid Sci. 2019, 102, 101–112. [Google Scholar] [CrossRef]
- Han, Y.; Palacios, J.; Schmitz, S. Scaled ice accretion experiments on a rotating wind turbine blade. J. Wind Eng. Ind. Aerodyn. 2012, 109, 55–67. [Google Scholar] [CrossRef]
- Hann, R.; Hearst, R.J.; Sætran, L.R.; Bracchi, T. Experimental and numerical icing penalties of an S826 airfoil at low reynolds numbers. Aerospace 2020, 7, 46. [Google Scholar] [CrossRef]
- Wang, Y.; Jiang, X. Design Research and Experimental Verification of the Electro-Impulse De-Icing System for Wind Turbine Blades in the Xuefeng Mountain Natural Icing Station. IEEE Access 2020, 8, 28915–28924. [Google Scholar] [CrossRef]
- Overmeyer, A.; Palacios, J.; Smith, E. Ultrasonic De-Icing Bondline Design and Rotor Ice Testing. AIAA J. 2013, 51, 2965–2976. [Google Scholar] [CrossRef]
- Palacios, J.L.; Smith, E.C.; Rose, J.L. Investigation of an Ultrasonic Ice Protection System for Helicopter Rotor Blades. In Proceedings of the 64th Annual Forum Proceedings—AHS International, Montreal, QC, Canada, 29 April–1 May 2018; pp. 609–618. [Google Scholar]
- Zhu, Y.; Palacios, J.L.; Rose, J.L.; Smith, E.C. Numerical Simulation and Experimental Validation of Tailored Wave Guides for Ultrasonic De-Icing on Aluminum Plates. In Proceedings of the 51st AIAA/ASME/ASCE/AHS/ASC Structures, Structural Dynamics and Materials Conference [2010–3043] (Collection of Technical Papers—AIAA/ASME/ASCE/AHS/ASC Structures, Structural Dynamics and Materials Conference), Orlando, FL, USA, 12–15 April 2010. [Google Scholar]
- Daniliuk, V.; Xu, Y.; Liu, R.; He, T.; Wang, X. Ultrasonic de-icing of wind turbine blades: Performance comparison of perspective transducers. Renew. Energy 2020, 145, 2005–2018. [Google Scholar] [CrossRef]
- Budinger, M.; Pommier-Budinger, V.; Bennani, L.; Rouset, P.; Bonaccurso, E.; Dezitter, F. Electro-mechanical Resonant Ice Protection Systems: Analysis of Fracture Propagation Mechanisms. AIAA J. 2018, 56, 4412–4422. [Google Scholar] [CrossRef]
- Pommier-Budinger, V.; Budinger, M.; Rouset, P.; Dezitter, F.; Huet, F.; Wetterwald, M.; Bonaccurso, E. Electro-mechanical Resonant Ice Protection Systems: Initiation of Fractures with Piezoelectric Actuators. AIAA J. 2018, 56, 4400–4411. [Google Scholar] [CrossRef]
- Bai, T.; Zhu, C.; Miao, B.; Li, K.; Zhu, C. Vibration de-icing method with piezoelectric actuators. J. Vibroeng. 2015, 17, 61–73. [Google Scholar]
- Harvey, D. Modélisation Numérique d’un Système de Protection Contre le Givre par Éléments Piézoélectriques Avec Validation Expérimentale; Département des Sciences Appliquée; Université du Québec à Chicoutimi: Chicoutimi, QC, Canada, 2012; p. 297. [Google Scholar]
- Villeneuve, E.; Harvey, D.; Zimcik, D.; Aubert, R.; Perron, J. Piezoelectric De-Icing System for Rotorcraft. J. Am. Helicopter Soc. 2015, 60, 12. [Google Scholar] [CrossRef]
- Villeneuve, E.; Volat, C.; Ghinet, S. Numerical and experimental investigation of the design of a piezoelectric de-icing system for small rotorcraft part 1/3: Development of a flat plate numerical model with experimental validation. Aerospace 2020, 7, 62. [Google Scholar] [CrossRef]
- Villeneuve, E.; Volat, C.; Ghinet, S. Numerical and experimental investigation of the design of a piezoelectric de-icing system for small rotorcraft part 2/3: Investigation of transient vibration during frequency sweeps and optimal piezoelectric actuator excitation. Aerospace 2020, 7, 49. [Google Scholar] [CrossRef]
- Villeneuve, E.; Volat, C.; Ghinet, S. Numerical and Experimental investigation of the design of a piezoelectric de-icing system for small rotorcraft part 3/3: Numerical model and experimental validation of vibration based de-icing of a flat plate structure. Aerospace 2020, 7, 54. [Google Scholar] [CrossRef]
- Samad, A.; Villeneuve, E.; Morency, F.; Volat, C. A numerical and experimental investigation of the convective heat transfer on a small helicopter rotor test setup. Aerospace 2021, 8, 52. [Google Scholar]
- Villeneuve, E.; Blackburn, C.; Volat, C. Design and Development of an Experimental Setup of Electrically Powered Spinning Rotor Blades in Icing Wind Tunnel and Preliminary Testing with Surface Coatings as Hybrid Protection Solution. Aerospace 2021, 8, 98. [Google Scholar] [CrossRef]
- Villeneuve, E.; Perron, J. Icing Wind Tunnel Certification Tests in Accordance with SAE ARP5905 and AIR4906; AMIL: Chicoutimi, QC, Canada, 2012; p. 80. [Google Scholar]
- Calibration and Acceptance of Icing Wind Tunnels; SAE International: Warrendale, PA, USA, 2003.
- Droplet Size Instrumentation Used in Icing Facilities; SAE International: Warrendale, PA, USA, 1995.
- Hayashi, R.; Yamamoto, M. Numerical Simulation on Ice Shedding Phenomena in Turbomachinery. J. Energy Power Eng. 2015, 9, 8. [Google Scholar]
- DuraAct Patch Transducer Datasheet; Physik Instrumente: Karlsruhe, Germany, 2012.
- Goraj, Z. An Overview of the Deicing and Antiicing. In Proceedings of the 24th International Congress of the Aeronautical Sciences, Yokohama, Japan, 29 August–3 September 2004. [Google Scholar]


| Test | Wind Speed (m/s) | Air Temperature (°C) | LWC (g/m3) | MVD (µm) | Rotation Speed (RPM) |
|---|---|---|---|---|---|
| Static | 20 | −7 | 0.8 | 20–30 | 0 |
| Rotating | 20 | −7 | 0.8 | 20–30 | 600 |
| Mode (#) | Numerical Frequency (Hz) |
|---|---|
| 1 | 559 |
| 2 | 1136 |
| 3 | 1828 |
| 4 | 1865 |
| 5 | 2038 |
| 6 | 2149 |
| Mode (#) | Optimal Actuator Phasing | Predicted Voltage for Delamination (Vpp) | Delamination Obtained at 500 Vpp and Below |
|---|---|---|---|
| 1 | 1–2–3/4–5–6 | >800 | No |
| 2 | 1–6/3–4 | >700 | No |
| 3 | 1–2–3–4–5–6 | >500 | No |
| 4 | 1–4/3–6 | 425 to 1950 | No |
| 5 | 1–3–4–6/2–5 | 250 to 1100 | Yes |
| 6 | 1–3–5/2–4–6 | 540 to 2500 | Yes |
| Mode (Repetition) | Actuator Phasing | Vpp (V) |
|---|---|---|
| 5 (1) | 1–3–4–6/2–5 | 336 |
| 5 (2) | 352 | |
| 5 (1) | 1–2–3–4–5–6 | 370 |
| 5 (2) | 352 | |
| 6 (1) | 1–3–5/2–4–6 | 385 |
| 6 (2) | 400 | |
| 6 (3) | 385 | |
| 6 (1) | 1–2–3/4–5–6 | 450 |
| AOA (Repetition) | Vpp (V) |
|---|---|
| 0 (1) | 660 |
| 0 (2) | 650 |
| 6 (1) | 680 |
| 6 (2) | 680 |
| 6 (3) | 660 |
| 6 (4) | 680 |
| Mode | Excitation | Frequency | Vpp |
|---|---|---|---|
| 5 | 1–3–4–6/2–5 | 8% | 2% |
| 1–2–3–4–5–6 | 2% | ||
| 1–2–3–4–5–6 in rotation | 10% | 3% | |
| 6 | 1–3–5/2–4–6 | 2% | 3% |
| 1–2–3/4–5–6 | N/A |
| Mode (Repetition) | S12 (MPa) |
|---|---|
| 5 p * (1) | 0.27 |
| 5 p * (2) | 0.30 |
| 5 (1) | 0.26 |
| 5 (2) | 0.35 |
| 6 p * (1) | 0.33 |
| 6 p * (2) | 0.32 |
| 6 p * (3) | 0.22 |
| 6 (1) | 0.20 |
| AOA (Repetition) | S12 (MPa) |
|---|---|
| 0 (1) | 2.65 |
| 0 (2) | 2.60 |
| 6 (1) | 2.84 |
| 6 (2) | 2.66 |
| 6 (3) | 2.82 |
| 6 (4) | 2.69 |
| Mode | Frequency (Hz) | Voltage for Shear Stress = 2.72 MPa (Vpp) | Voltage for Shear Stress = 2.72 MPa in Rotation (Vpp) |
|---|---|---|---|
| 2 | 1015 | 3510 | 2500 |
| 3 | 1373 | 453 | 323 |
| 4 | 1798 | 286 | 205 |
| Mode | Number of Actuators | Power without Rotation (W) | Power in Rotation (W) | Power Density in Rotation (W/in2) | Reduction from Thermal System (%) |
|---|---|---|---|---|---|
| 2 | 4 | 2250 | 1140 | 30 | −8 |
| 3 | 6 | 76 | 39 | 1.03 | 96 |
| 4 | 8 | 53 | 27 | 0.72 | 97 |
Publisher’s Note: MDPI stays neutral with regard to jurisdictional claims in published maps and institutional affiliations. |
© 2021 by the authors. Licensee MDPI, Basel, Switzerland. This article is an open access article distributed under the terms and conditions of the Creative Commons Attribution (CC BY) license (https://creativecommons.org/licenses/by/4.0/).
Share and Cite
Villeneuve, E.; Ghinet, S.; Volat, C. Experimental Study of a Piezoelectric De-Icing System Implemented to Rotorcraft Blades. Appl. Sci. 2021, 11, 9869. https://doi.org/10.3390/app11219869
Villeneuve E, Ghinet S, Volat C. Experimental Study of a Piezoelectric De-Icing System Implemented to Rotorcraft Blades. Applied Sciences. 2021; 11(21):9869. https://doi.org/10.3390/app11219869
Chicago/Turabian StyleVilleneuve, Eric, Sebastian Ghinet, and Christophe Volat. 2021. "Experimental Study of a Piezoelectric De-Icing System Implemented to Rotorcraft Blades" Applied Sciences 11, no. 21: 9869. https://doi.org/10.3390/app11219869
APA StyleVilleneuve, E., Ghinet, S., & Volat, C. (2021). Experimental Study of a Piezoelectric De-Icing System Implemented to Rotorcraft Blades. Applied Sciences, 11(21), 9869. https://doi.org/10.3390/app11219869