Abstract
People living in local communities have become more worried about infection due to the extended pandemic situation and the global resurgence of COVID-19. In this study, the author (1) selected features to be included in the nomogram using AdaBoost, which had an advantage in increasing the classification accuracy of single learners and (2) developed a nomogram for predicting high-risk groups of coronavirus anxiety while considering both prediction performance and interpretability based on this. Among 210,606 adults (95,287 males and 115,319 females) in South Korea, 39,768 people (18.9%) experienced anxiety due to COVID-19. The AdaBoost model confirmed that education level, awareness of neighbors/colleagues’ COVID-19 response, age, gender, and subjective stress were five key variables with high weight in predicting anxiety induced by COVID-19 for adults living in South Korean communities. The developed logistic regression nomogram predicted that the risk of anxiety due to COVID-19 would be 63% for a female older adult who felt a lot of subjective stress, did not attend a middle school, was 70.6 years old, and thought that neighbors and colleagues responded to COVID-19 appropriately (classification accuracy = 0.812, precision = 0.761, recall = 0.812, AUC = 0.688, and F-1 score = 0.740). Prospective or retrospective cohort studies are required to causally identify the characteristics of anxiety disorders targeting high-risk COVID-19 anxiety groups identified in this study.
1. Introduction
Coronavirus disease 2019 (COVID-19) is a new infectious disease that has been prevalent worldwide since December 2019. The number of confirmed cases has been on the rise worldwide even in 2021. As of 23 July 2021, the cumulative number of confirmed cases was 190 million and the cumulative number of deaths was 4.09 million in the world [1]. In particular, as of August 2021, the number of confirmed cases increased again even in countries with more than 50% immunization rates such as the United States, United Kingdom, and Israel [1] due to the COVID-19 delta variant [2]. The statistics (WHO) of the 28th week of 2021 (12–18 July) showed that the number of new patients worldwide was estimated to be 3.43 million, which corresponded to 430,000 patients more than the number of new patients in the 27th week of 2021 (5–11 July) [1]. In Israel, new confirmed cases of COVID-19 were 220 people in the 24th week of 2021 (13–20 June), but the number of new confirmed cases was 5537 people, a 25-fold increase in the 28th week of 2021 (12–18 July) [1]. Moreover, new confirmed cases increased 4-fold in South Korea as well, from 2341 to 10,057 [1]. People living in local communities have become more worried about infection due to the extended pandemic situation and the global resurgence of COVID-19.
COVID-19 is a respiratory syndrome accompanied by fever, chills, muscle pain, dry cough, runny nose, sore throat, poor appetite, and diarrhea after a latent period of 1 to 14 days on average [3]. Although the symptoms of most patients are usually improved before progressing to pneumonia, some patients are exposed to the risk of developing severe pneumonia. In March 2020, the World Health Organization (WHO) declared a global pandemic due to COVID-19, the highest alert level for an infectious disease [4].
Although the fatality rate (mortality rate) of COVID-19 is lower than that of severe acute respiratory syndrome coronavirus (SARS-CoV) and that of Middle East respiratory syndrome coronavirus (MERS-CoV), the infectivity of COVID-19 is higher than that of SARS-CoV and MERS-CoV [5,6]. As a result, globally, the influence of COVID-19 on the nonclinical population was relatively greater than SARS-CoV or MERS-CoV [5,6]. Consequently, the emergence of COVID-19 has greatly threatened the overall social system, including health services and the economy. Moreover, the public has been exposed to constant fear and anxiety due to the news related to COVID-19 reported in the media every day. Social change has adversely and gravely affected individuals’ mental health. In particular, the public has experienced social disconnection and isolation such as social distancing, telecommuting, and non-face-to-face classes at educational institutions due to the rapid spread of COVID-19, which can lead to various psychological problems such as personal anxiety [7,8,9]. It has been reported that social anxiety induced by COVID-19 is known to adversely affect individual mental health worldwide [10,11,12,13,14,15]. Recent studies [16,17] have revealed that those who experienced quarantine due to COVID-19 suffered from considerable anxiety, anger, confusion, and post-traumatic stress symptoms. Particularly, the fear of people over a disease that has an unknown nature or has no cure after an outbreak, like COVID-19, is likely to lead to anxiety [18,19].
Nevertheless, the previous studies [20,21] that evaluated the pandemic and infection anxiety related to COVID-19 analyzed a small number of samples from some regions. Moreover, most of them identified the status of psychological problems using descriptive statistics or examined individual risk factors for anxiety using regression analysis. Regression analysis needs to satisfy the assumptions such as normality and homoscedasticity and is effective in exploring independent risk factors. However, some diseases may violate the assumption of this regression model. Moreover, since risk factors for diseases are complex, risk factors are likely to cluster with each other, and the effects of risk factors on the health level are synergistic rather than additive [22], it is challenging to identify multiple risk factors for anxiety using the regression model alone.
As the COVID-19 pandemic has been ongoing for more than 20 months, it is critical for public health to understand the characteristics of anxiety regarding COVID-19 infection using big data representing the population [23]. If it is possible to predict the high-risk groups of anxiety due to the COVID-19 pandemic as soon as possible based on multiple risk factors and provide the groups with professional emotional support through in-person and contactless means, this will help reduce psychological anxiety caused by COVID-19.
As the performance of computers has been advanced in recent years, machine learning has been widely used in disease prediction research. Machine learning refers to a technology that allows the computer to learn data and generate rules on its own. The decision tree is commonly used for a disease prediction model based on binary classification; a decision tree is used. The decision tree is an analysis method that classifies the entire data into several subgroups and presents the prediction process in a tree form. Medical personnel can intuitively understand it, because it visualizes the path until the results are derived. However, it suffers from a possibility of overfitting depending on the size or depth of the tree model. Ensemble algorithms (e.g., AdaBoost) have been used to overcome the shortcomings of the decision tree, because these ensemble models can generate models with higher precision and improved generalization performance by using multiple weak learners [24]. However, AdaBoost sacrifices interpretability and intelligibility, because it is a black box model. Accordingly, it is necessary for the medical field to develop a predictive model with high accuracy and explanatory power, so that the medical personnel can easily understand the process of deriving results [25].
The nomogram is used as a method of visually presenting the risk probability of a disease in an easy-to-understand manner for the medical personnel. A nomogram refers to a graph that expresses the prediction probability for multiple risk factors by analyzing clinical information about a disease. Selecting the right features is very important for developing a nomogram with excellent accuracy [26]. Therefore, this study (1) selected features to be included in the nomogram using AdaBoost, which had an advantage in increasing the classification accuracy of single learners and (2) developed a nomogram for predicting high-risk groups of coronavirus anxiety while considering both prediction performance and interpretability based on this.
2. Materials and Methods
2.1. Data Source
This was a secondary data analysis study to understand factors influencing anxiety caused by COVID-19 by using anonymized raw data from which personally identifiable information was removed from the Community Health Survey 2020 (CHS 2020) conducted by the Korea Centers for Disease Control and Prevention. CHS, the data source of this study, is a nationwide sampling survey conducted under the supervision of the Korea Centers for Disease Control and Prevention to produce comparable regional health statistics based on Article 4 of the Regional Public Health Act. Please refer to Kim et al. (2012) [27] for a detailed description of CHS sampling. Briefly, CHS 2020 used the adult population, ≥19 years of age or older (those born on or after 31 July 2001), based on the resident registration population data of the Ministry of Public Administration and Security. This study used the probability proportion to size systematic sampling method. This study divided dong/eup/myeon in the jurisdiction of 255 public health centers located in 17 cities in the first layer and housing types into the second layer. The survey was conducted from 16 August 2020 to 31 October 2020, after obtaining the confidentiality of the survey and consent to participate from the survey targets. Afterward, a trained surveyor visited the sample household and conducted a 1:1 survey based on a computer assisted personal interview. CHS 2020 consists of 18 domains including health behavior, medical use, dietary habits, and physical examination. This study excluded 17,590 respondents who did not respond to one or more items about anxiety due to COVID-19 among 228,196 adults (≥19 years) who had never been quarantined or hospitalized due to COVID-19. Finally, this study analyzed the data from 210,606 respondents (95,287 males and 115,319 females).
2.2. Measurement and Definition of Variables
Anxiety due to COVID-19, the target variable, was composed of five items: 1. I am worried about being infected with COVID-19; 2. I am anxious because I might die if I am infected with COVID-19; 3. I am worried of being accused or damaged by neighbors if I am infected with COVID-19; 4. I am worried that a family member with poor health (e.g., older adults, infants, baby, and patients) will be infected with COVID-19; and 5. I am concerned that I and my family will suffer from economic damage (including job loss or difficulties in finding a job) due to the COVID-19 pandemic. Each item is measured on a 5-point scale (1. Strongly agree; 2. Agree; 3. Not agree or disagree; 4. Disagree; 5. Strongly disagree). The score ranges from 5 to 25, and a lower score indicates higher anxiety due to COVID-19. This study defined a high-risk group for anxiety as 7 points or less, corresponding to -1SD of Goebel & Mehdorn (2011) [28].
The explanatory variables were 111 variables among 185 variables investigated in CHS, after excluding 11 identification variables (e.g., subject number, area code, administrative agency code), 5 target variables (anxiety due to COVID-19), and 58 duplicate items (e.g., mean moderate-intensity physical activity hours per day (hour) and mean moderate-intensity physical activity hours per day (min)). The composition of explanatory variables is presented in Table 1.

Table 1.
Description of explanatory variables.
2.3. AdaBoost
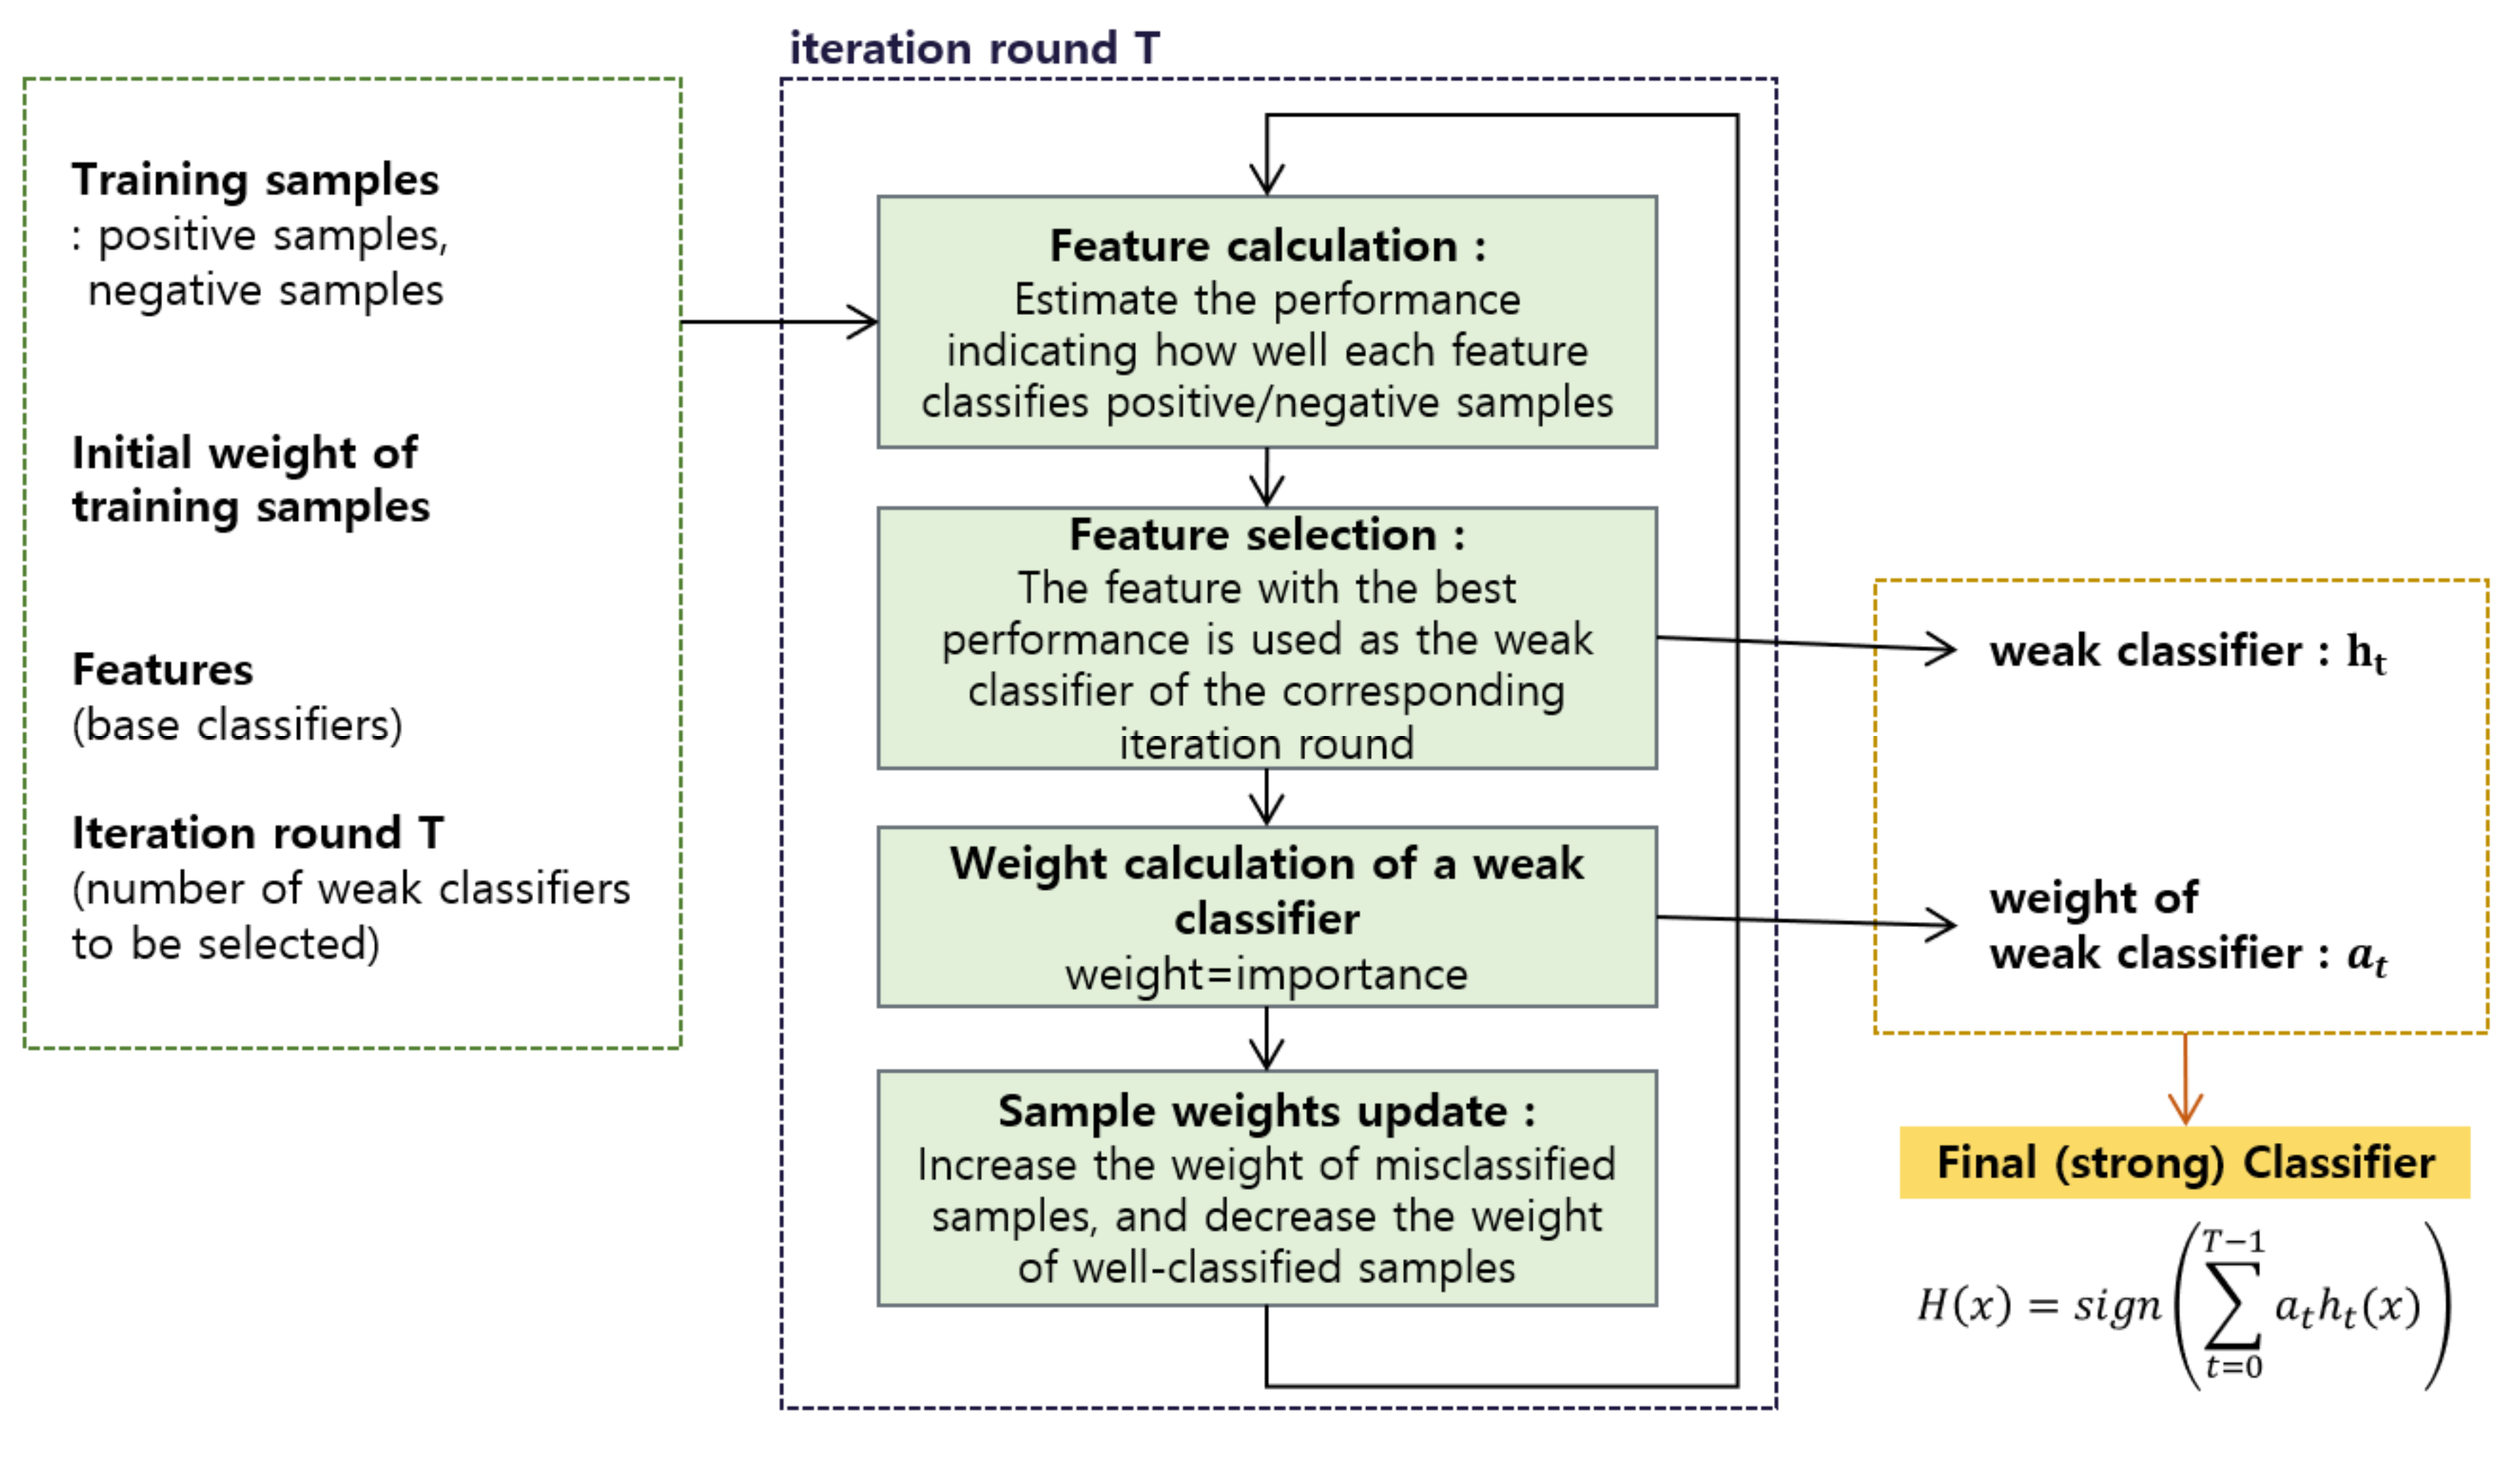
The AdaBoost algorithm is used to create a strong classifier with improved performance by selecting classifiers with weak classification power. The AdaBoost algorithm is a process of creating a strong classifier by finding the best combination of week classifiers that can best distinguish an image of an object to be detected (positive sample) from other images (negative sample). It reduces the weight of samples that were correctly recognized by a weak classifier and increases the weight of samples that were incorrectly recognized to apply it to the next weak classifiers. The final strong classifier consists of a combination of weak classifiers, and the error rate decreases as the number of weak classifiers with small weighted errors increases.
A weak classifier () is expressed as in Equation (1) by using a feature for a sample x, (), threshold (), and indicating parity. The classification result is expressed as 1 (positive sample) or 0 (negative sample).
The threshold value () is set to a value that maximizes the classification performance of weak classifiers. Moreover, if the feature values corresponding to the positive sample have a smaller value on average than those corresponding to the negative sample, (indicating the direction of a sign of inequality) equals to 1. In the opposite case, it is −1.
The following explains the process of the AdaBoost algorithm that selects weak classifiers with good classification performance, measures the importance of each, assigns weights, and combines them to create a strong classifier.
Step 1 is to compose the sample data to learn. The number of sample data to learn is N, where xi represents the value of each sample data. yi is 1 for a positive sample and 0 for a negative sample according to class information corresponding to each sample. The equation is presented in Equation (2).
Step 2 is to initialize all samples by giving the same weight. The initial weight for the i-th sample is calculated by Equation (3).
where m and n are the total number of 0 (negative samples) and that of 1 (positive samples), respectively. The weight is a scale of how much each training sample affects the classification performance of a weak classifier. It selects the weak classifier that has the smallest sum of weights of misclassified training samples.
Step 3 is the most important part of the AdaBoost algorithm. To select T weak classifiers, steps 1 and 2 are repeated T times.
(1) is the step of determining weak classifiers. The error () is estimated for each weak classifier (), where, the weak classifier () with the smallest error () becomes a weak classifier () in the step.
(2) is the process of updating and normalizing weights. A weight is normalized () after calculating a coefficient () and updating a weight ().
Step 4. The strong classifier H is constructed by combining T weak classifiers (ht), obtained by repeating the (1) and (2) of Step 2 T times, and αt. αt is the weight for the weak classifier selected at each step. In other words, since the weight of the t-th weak classifier (ht) is inversely proportional to the error (εt), it improved the performance of the final strong classifier that is made by combining weak classifiers by giving a larger weight to a weak classifier with better classification performance. The formula for estimating the strong classifier is as illustrated in Equation (4).
The process of AdaBoost in this study is presented in Figure 1.

Figure 1.
The process of AdaBoost.
In this study, the learning rate for each AdaBoost = 0.3, subsample ratio of columns = 0.8, regularization term on weights = 0.1, and subsample ratio of the training instances = 0.8 were used as hyperparameters of AdaBoost.
2.4. Development and Validation of Logistic Regression Nomogram
A logistic regression nomogram for predicting high-risk groups for anxiety due to COVID-19 was developed using the five main variables (top 5 variables) derived from the feature importance of AdaBoost. A nomogram is a diagram presenting the relationship of several variables using graphs to calculate the probability of a disease occurrence simply and efficiently. When the number of variables (or risks) entered into the nomogram increases, the number of cases for calculating the predicted probability increases. Two methods are generally used to choose the variable input to the nomogram. First, variables can be selected based on the clinical knowledge of the researcher based on individual risk factors found in previous studies. Second, variables showing a significant difference between groups can be selected using the chi-square test (univariate analysis). However, it is challenging to use these two approaches in handling medical big data because (1) it is difficult to base on clinical knowledge when evaluating a disease that is not well characterized, such as emotional disorder caused by COVID-19 and (2) it is highly likely that most variables are significantly different when analyzing a large amount of data even if there is no clinical difference. To overcome these limitations, this study chose five major variables used for the nomogram using AdaBoost.
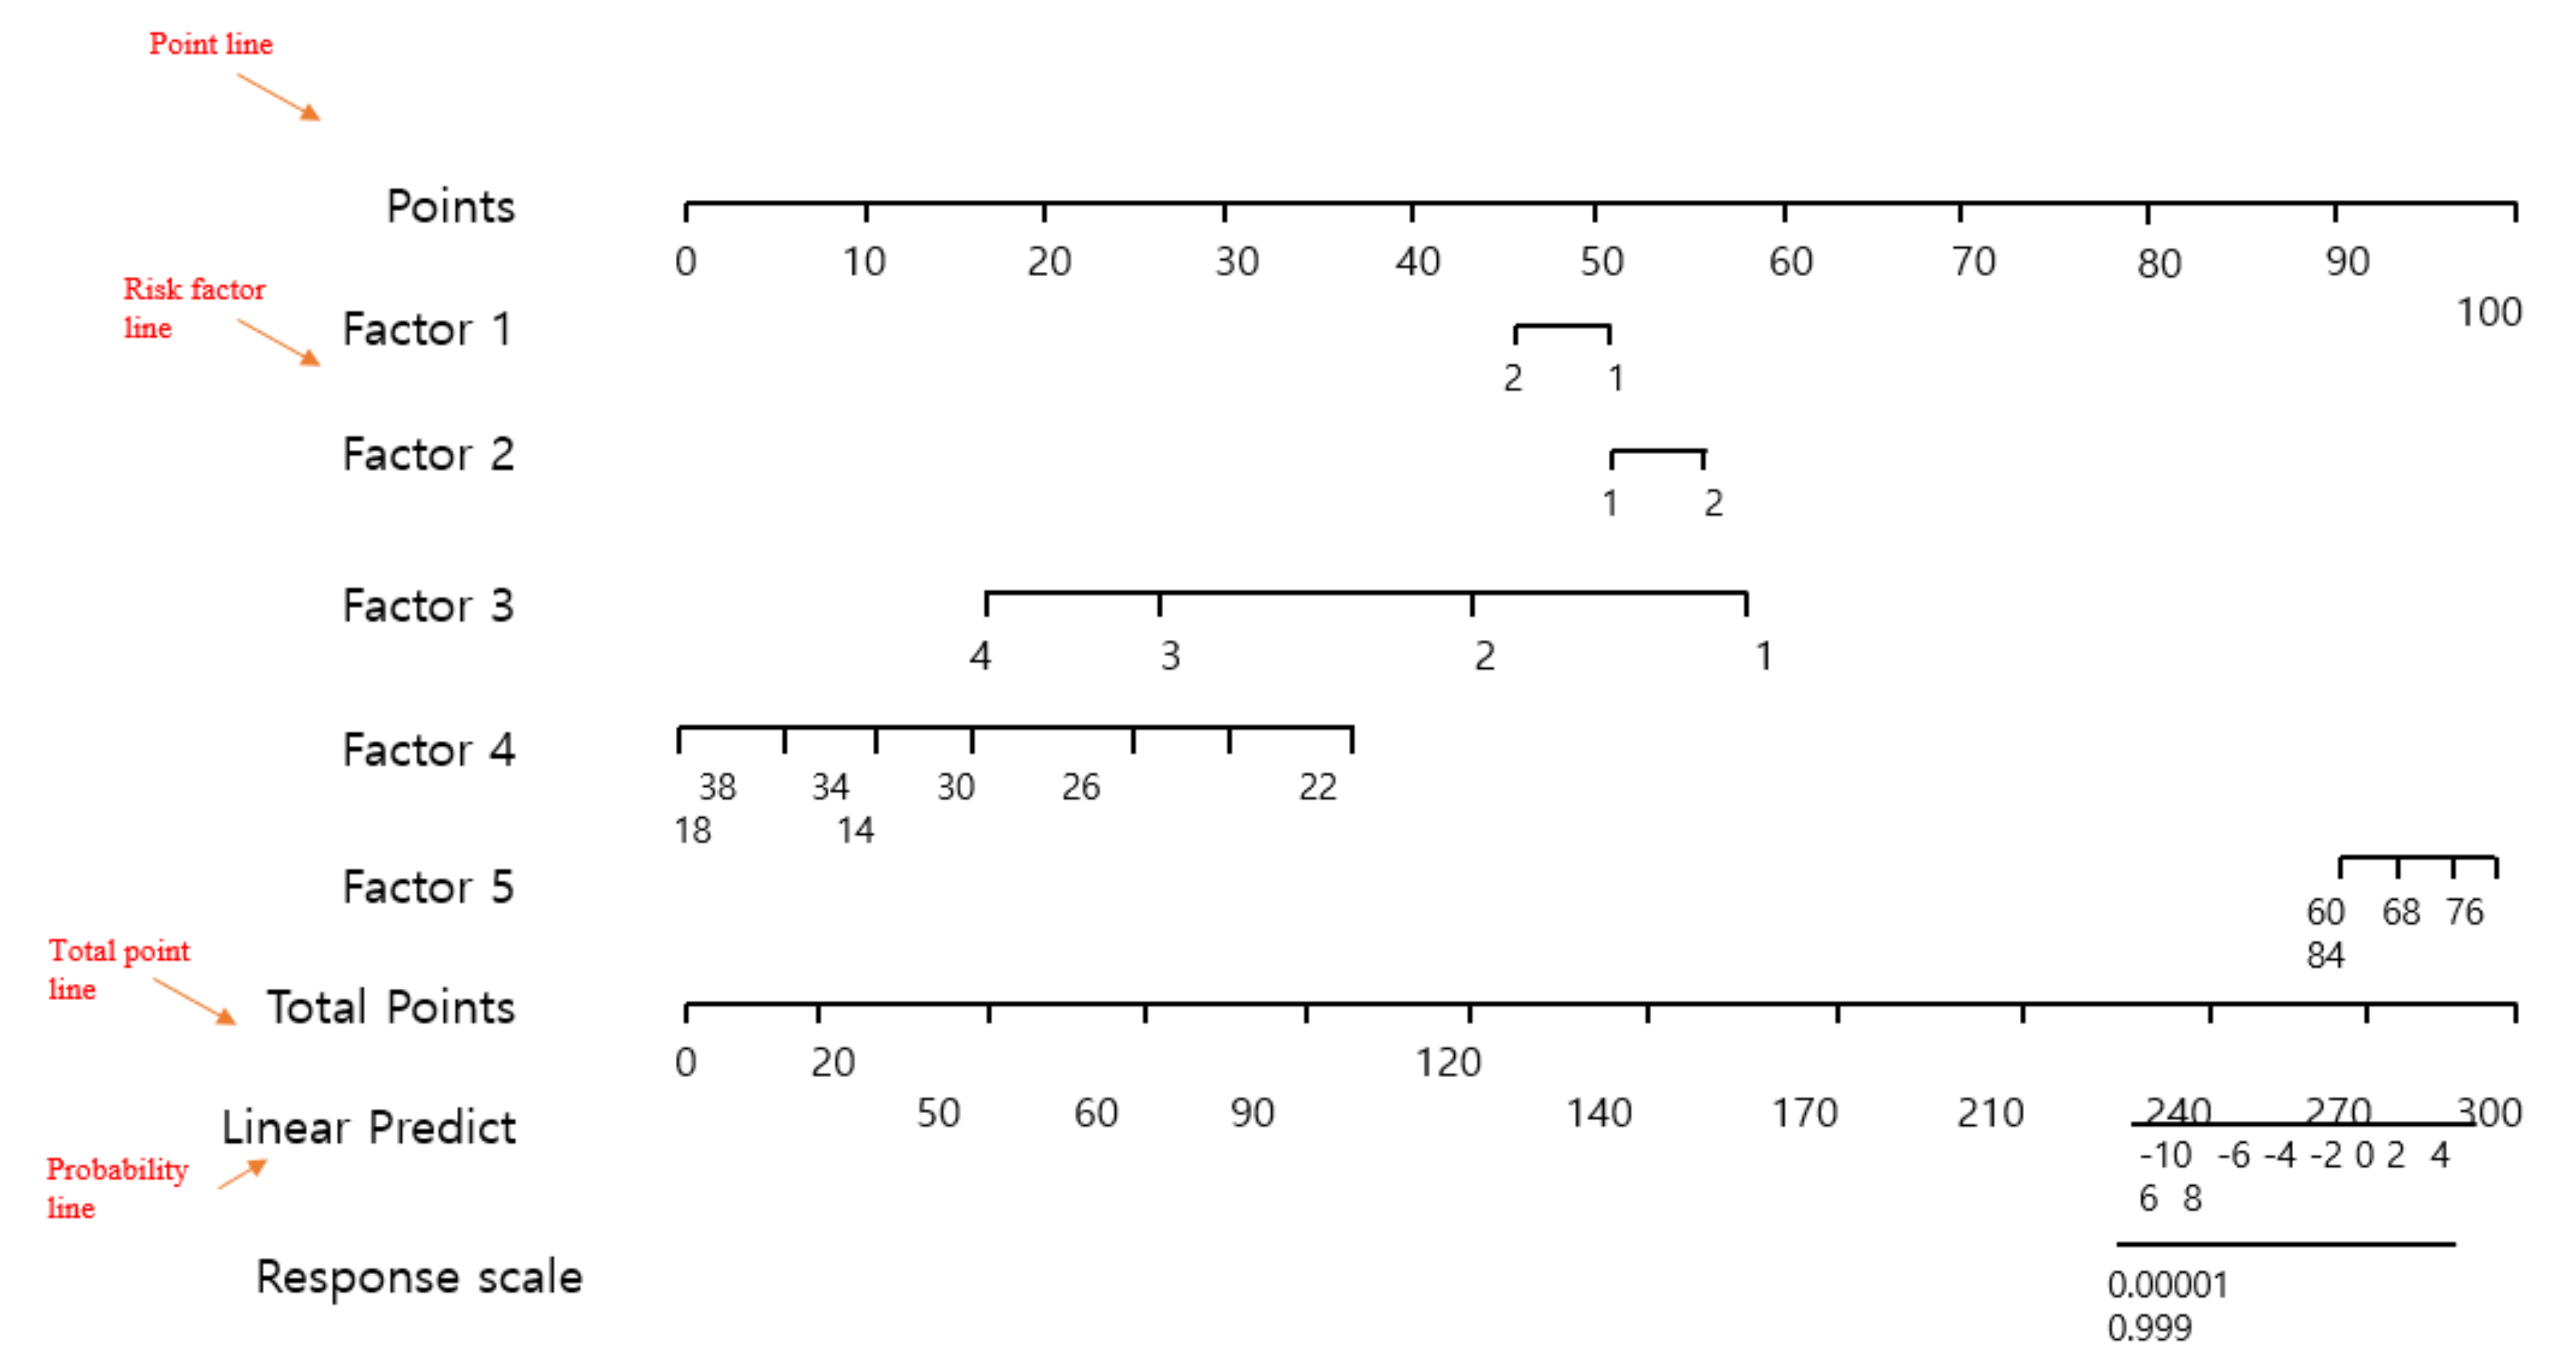
Logistic regression nomograms are generally composed of four types of lines [26]. First, a point line is provided. The point line is placed at the top of the nomogram to derive a score corresponding to the class of individual risk factors. Second, a risk factor line is provided. The number of risk factor lines means the number of risk factors affecting anxiety due to COVID-19. This study had five regression risk factor lines. Third, the total point line means the sum of the points of individual risk factors. Fourth, a probability line is presented. The probability line is the final sum of the nomogram points calculated by adding up multiple risk factors and is located at the most bottom of the nomogram. Figure 2 shows an example of a logistic regression nomogram.

Figure 2.
The concept of a logistic regression nomogram.
The prediction performance (general accuracy, F-1 score, recall, precision, the area under the curve (AUC), and calibration plot) of the finally developed nomogram was validated using 5-fold cross-validation. All analyses were conducted using Python version 3.9.6 (https://www.python.org/downloads (accessed on 30 June 2021).
3. Results
3.1. General Characteristics of Subjects According to Anxiety Due to COVID-19
Table 2 shows the differences (chi-square test results) by the general characteristics of adults who experienced anxiety due to COVID-19 and adults who did not experience it. Among 210,606 adults in South Korea, 39,768 people (18.9%) experienced anxiety due to COVID-19.
Table 2.
The general characteristics of adults who experienced anxiety due to COVID-19: univariate analysis.
3.2. Exploring the Major Features for Predicting Anxiety Due to COVID-19 by Using Adaboost
Figure 3 shows the results of calculating the feature importance of variables to confirm the key features of anxiety caused by COVID-19 using AdaBoost. The model confirmed that education level, awareness of neighbors/colleagues’ COVID-19 response, age, gender, and subjective stress were five key variables with high weight in predicting anxiety induced by COVID-19 for adults living in South Korean communities. The predictive performance of the model to predict anxiety due to COVID-19 using AdaBoost included accuracy = 0.815 (Figure 4), AUC = 0.718, precision = 0.774, recall = 0.815, and F1-score = 0.767.
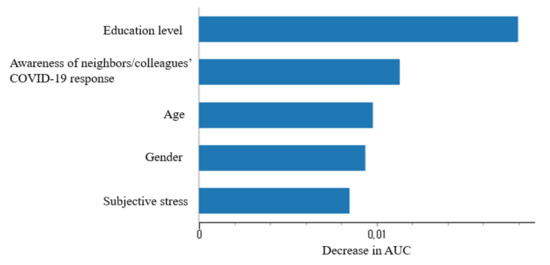
Figure 3.
Variable Importance of AdaBoost model for predicting COVID-19-induced anxiety in Korean adults (top 5 only).
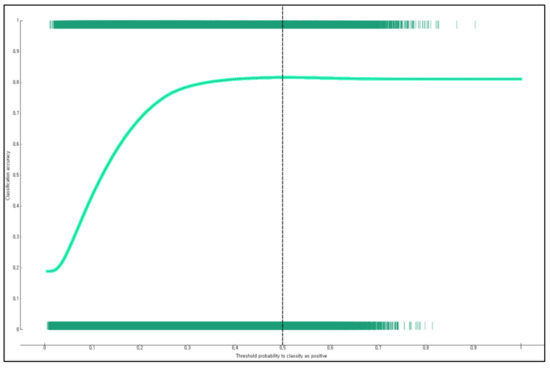
Figure 4.
General accuracy of the AdaBoost-based model for predicting anxiety due to COVID-19.
3.3. Developing a Nomogram for Predicting Anxiety Due to COVID-19 for Adults Living in South Korean Communities
Figure 5 presents the nomogram for predicting anxiety due to COVID-19 for adults living in South Korean communities. Education level had the largest influence among factors related to anxiety due to COVID-19. When the education level was elementary school graduation, the risk of anxiety due to COVID-19 was the highest. For example, the developed logistic regression nomogram predicted that the risk of anxiety due to COVID-19 would be 63% for a female older adult who felt a lot of subjective stress, did not attend a middle school, was 70.6 years old, and thought that neighbors and colleagues responded to COVID-19 appropriately (Figure 5).
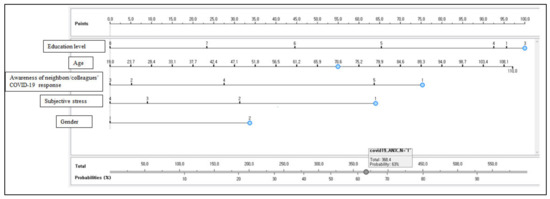
Figure 5.
Anxiety prediction nomogram due to COVID-19 for South Korean adults (n = 210,606).
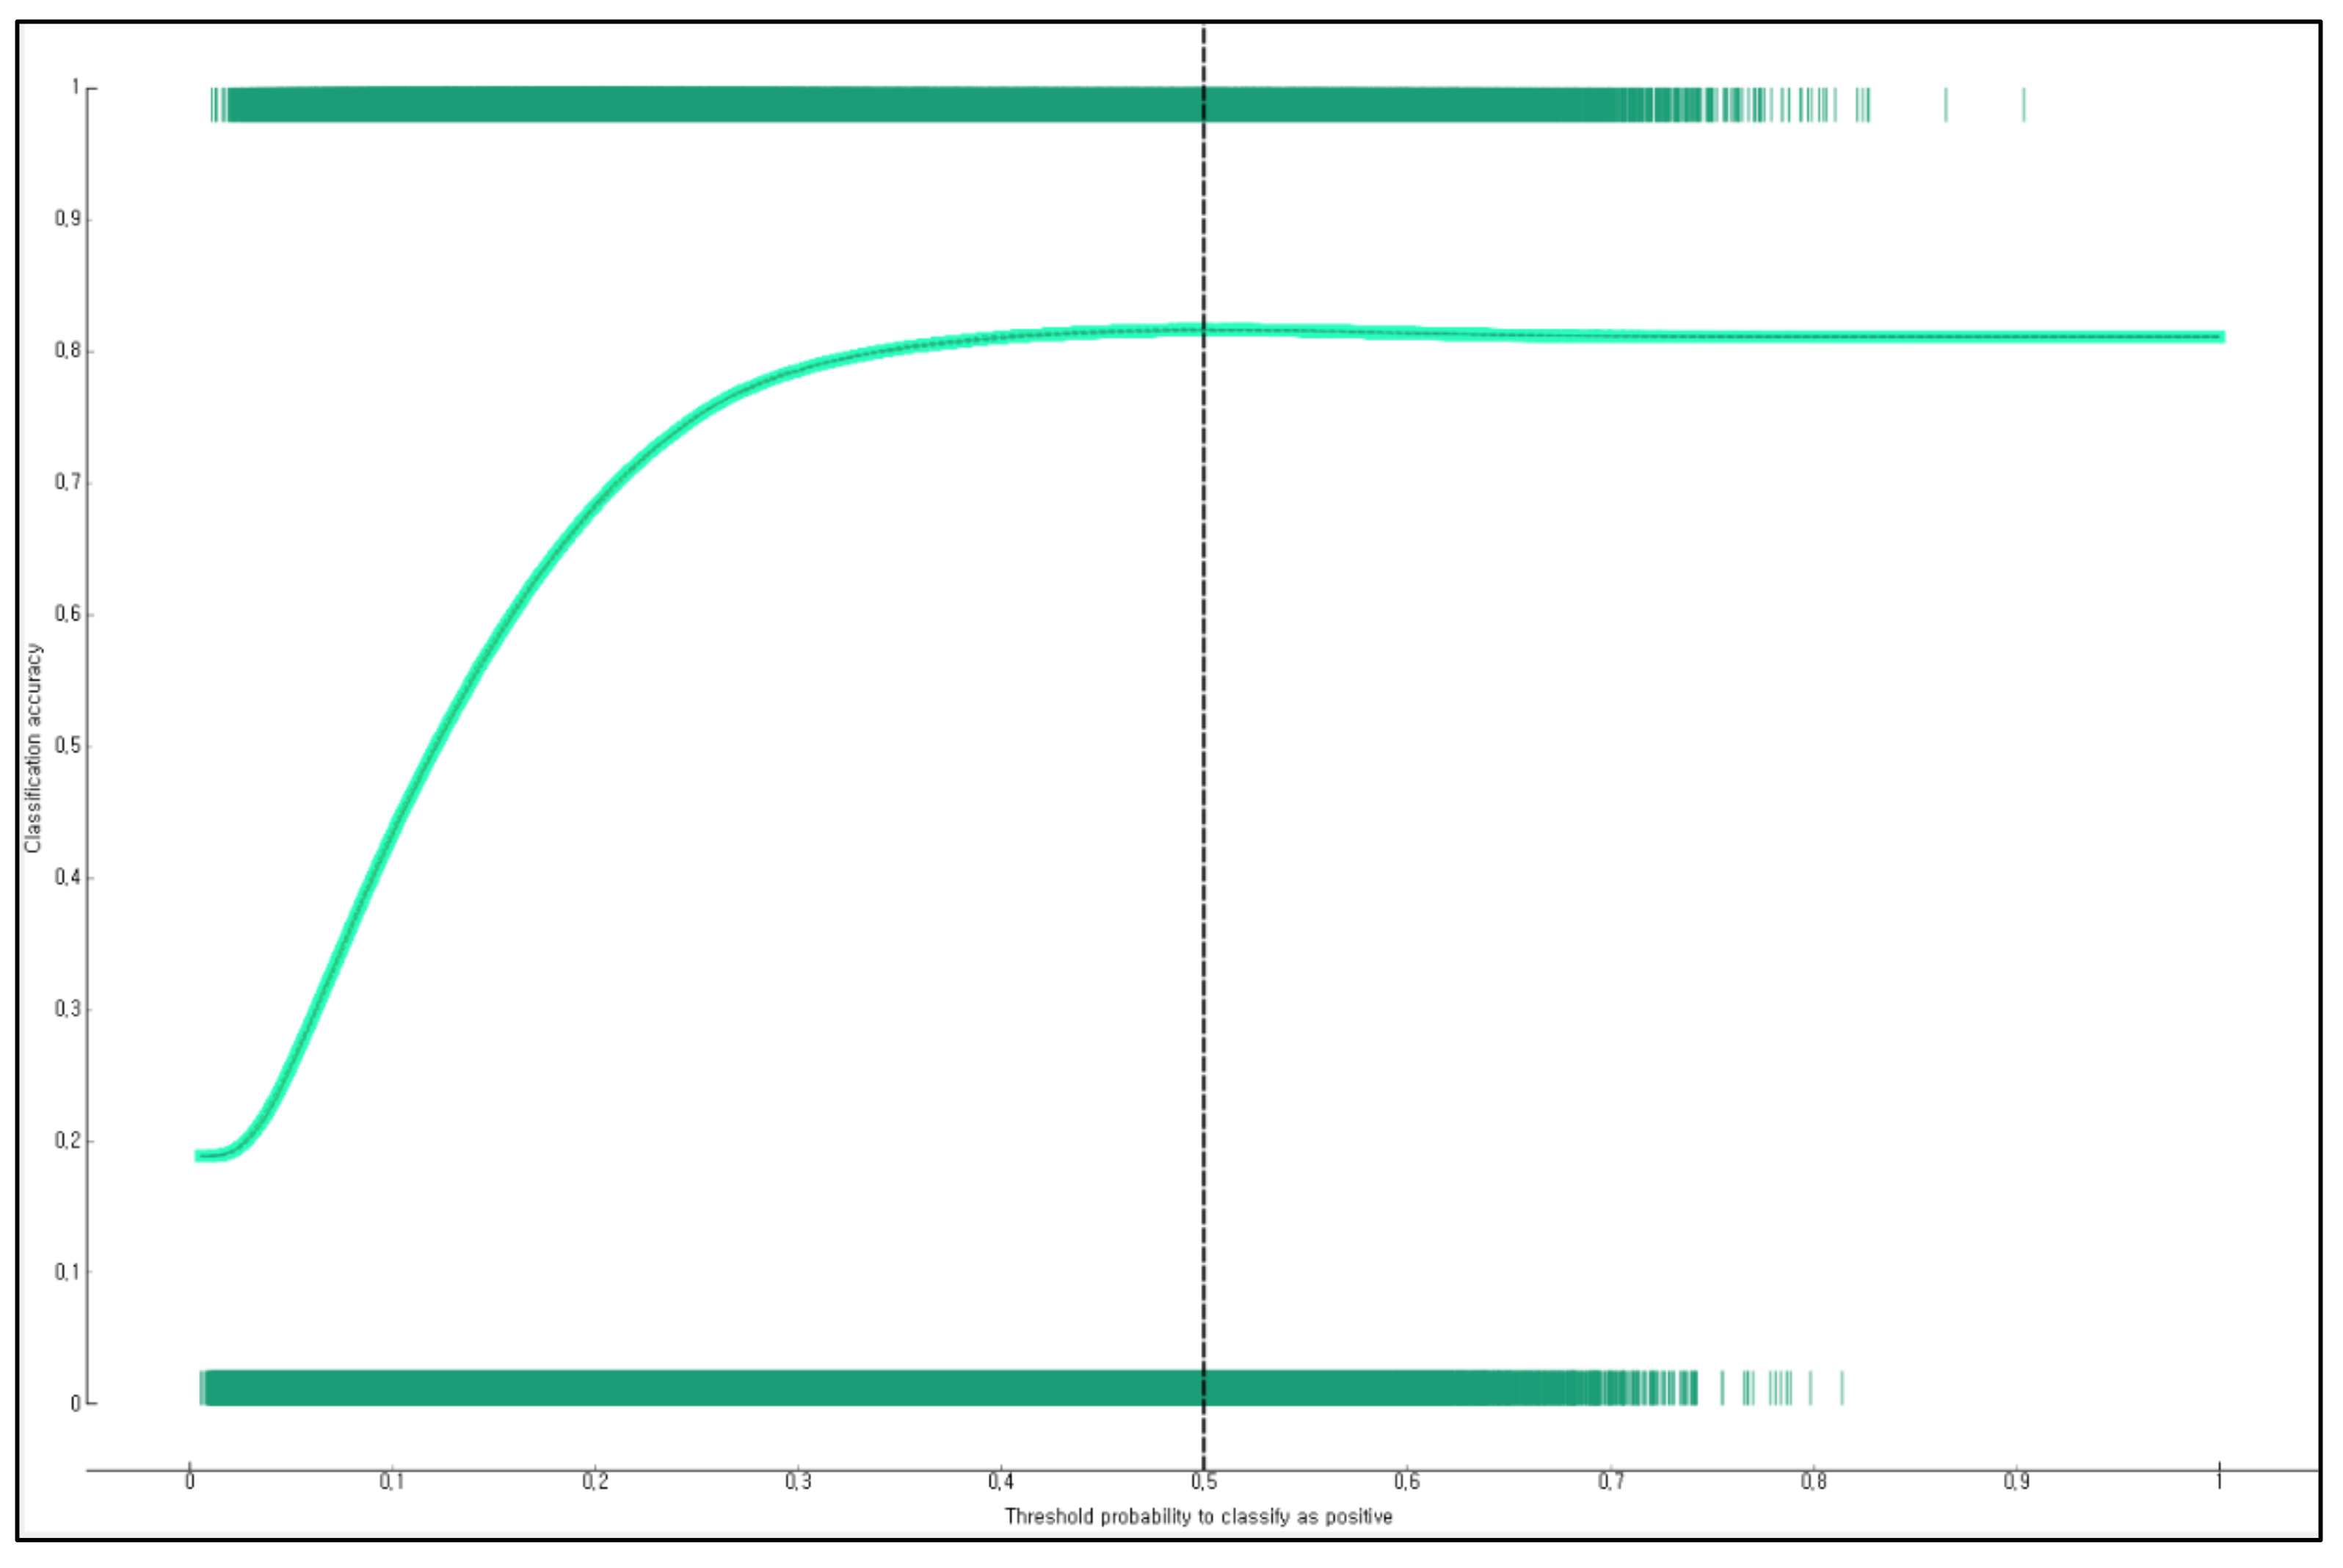
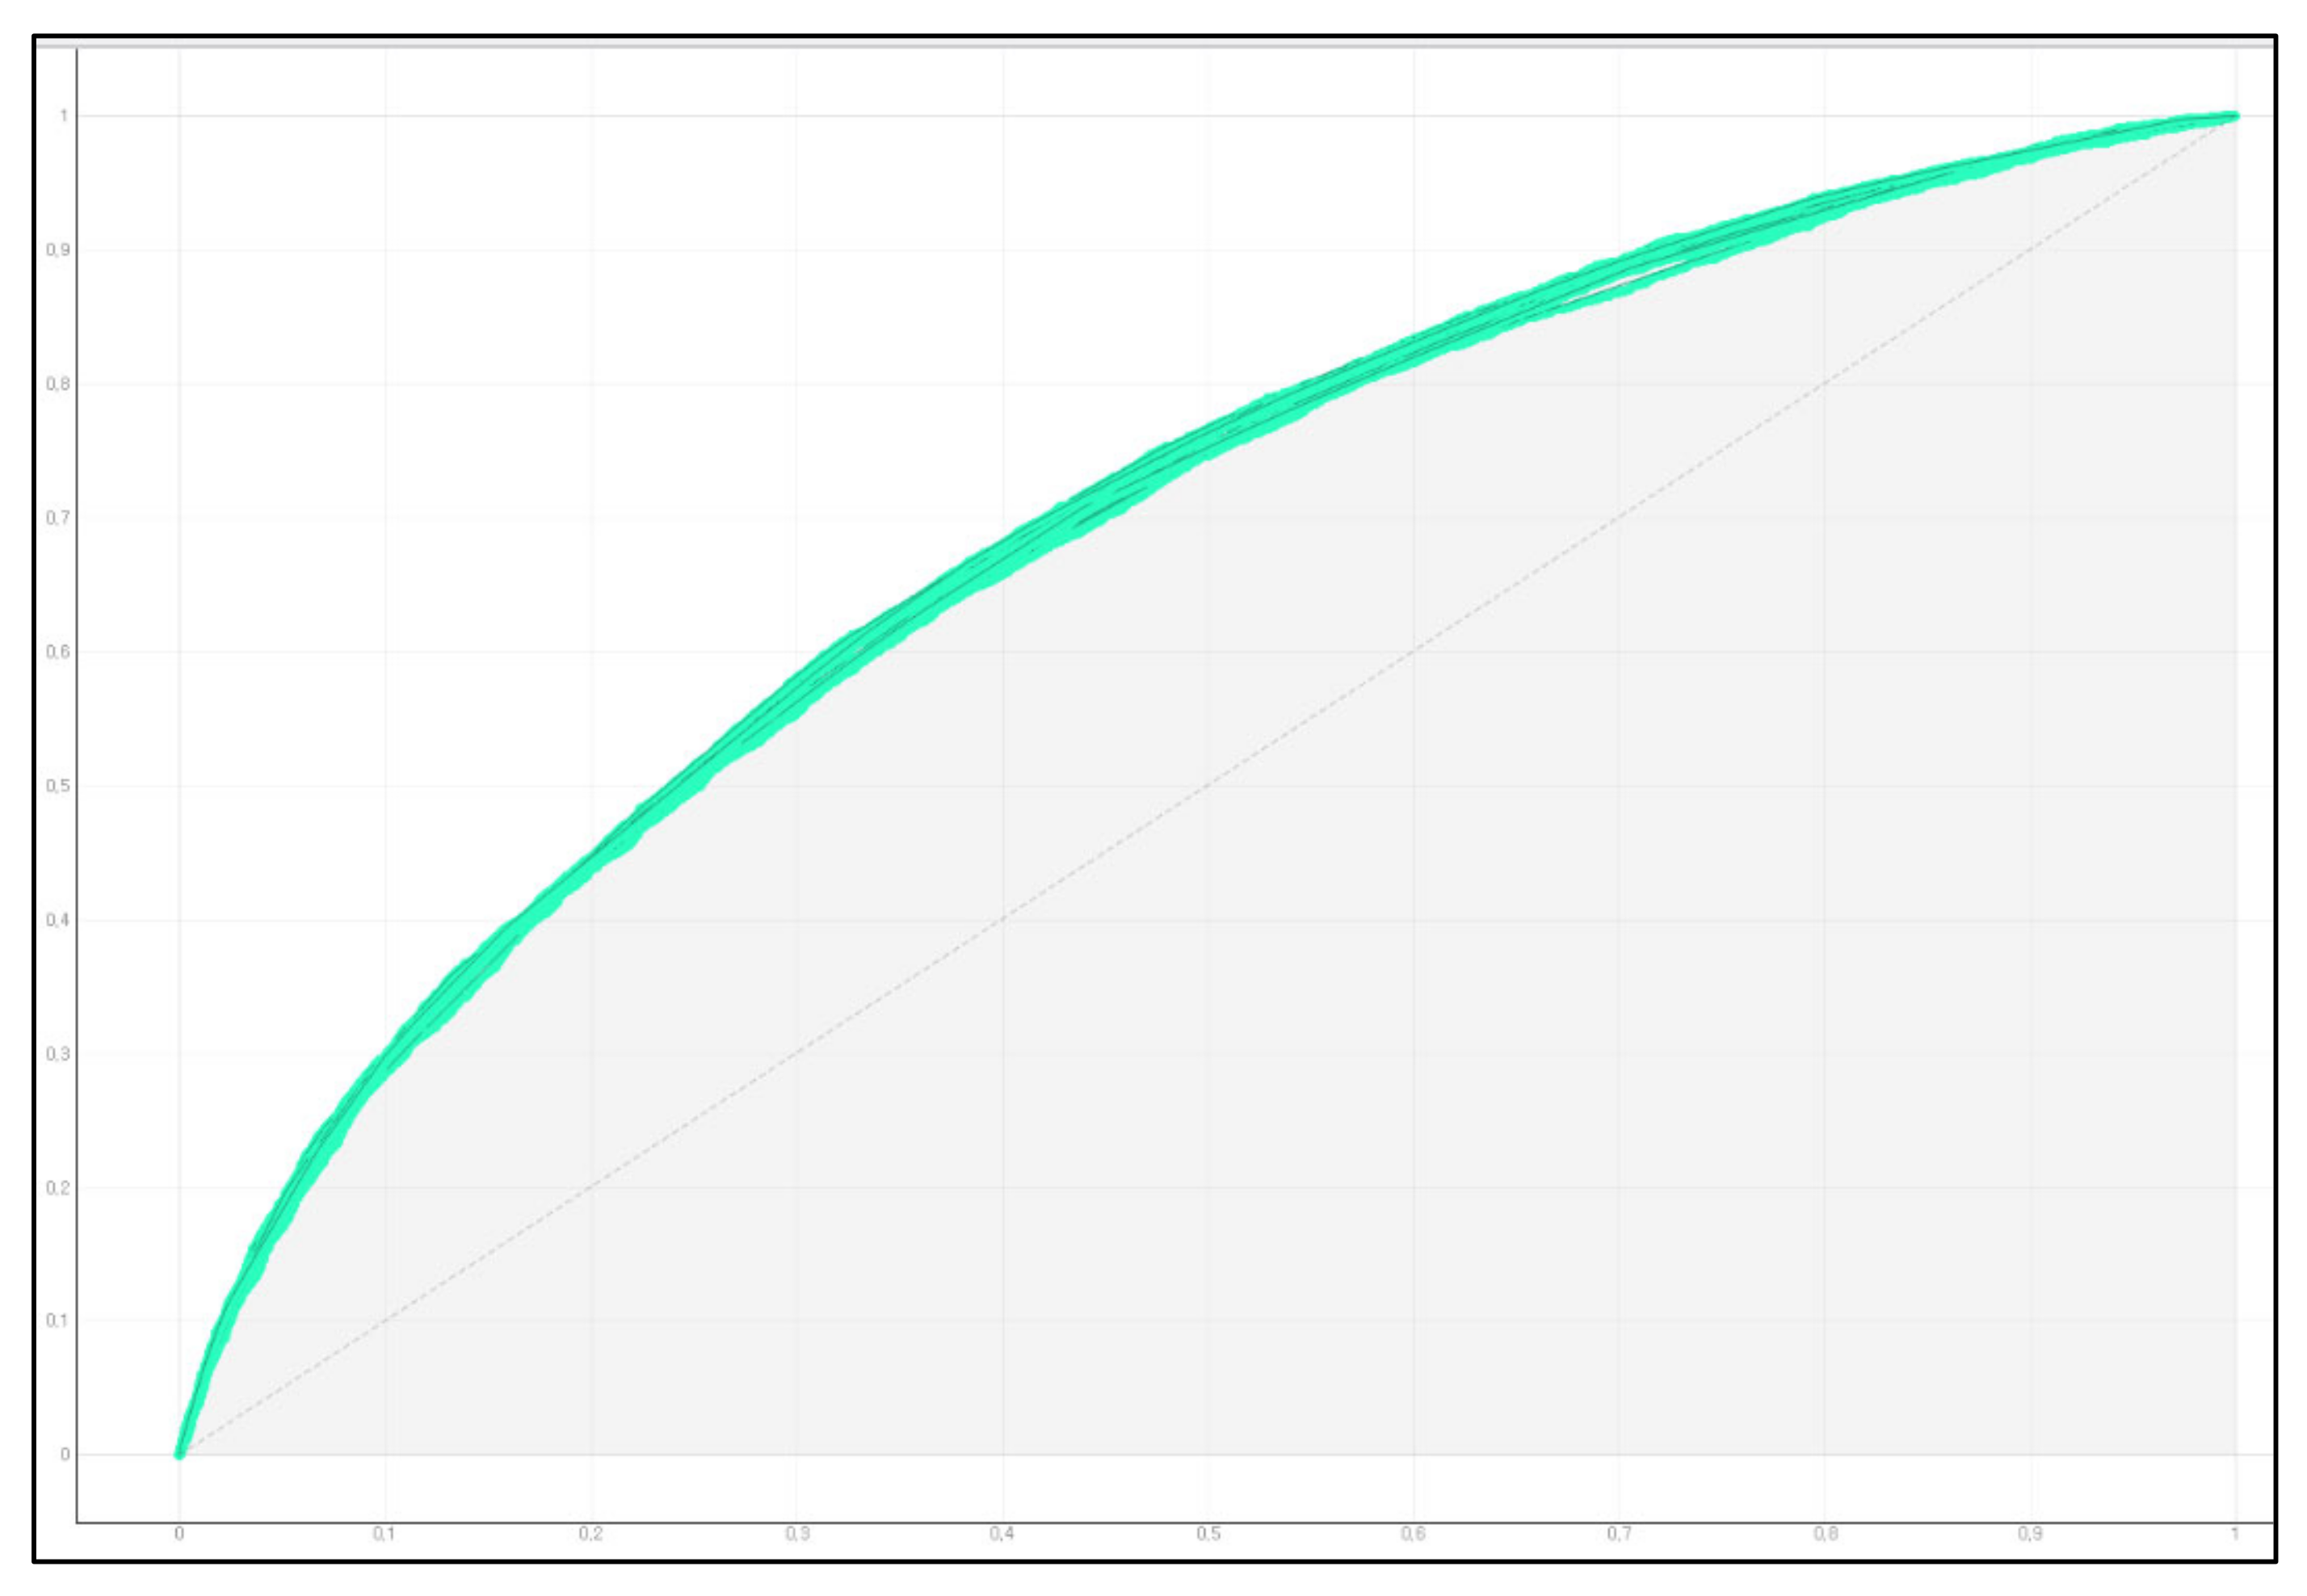
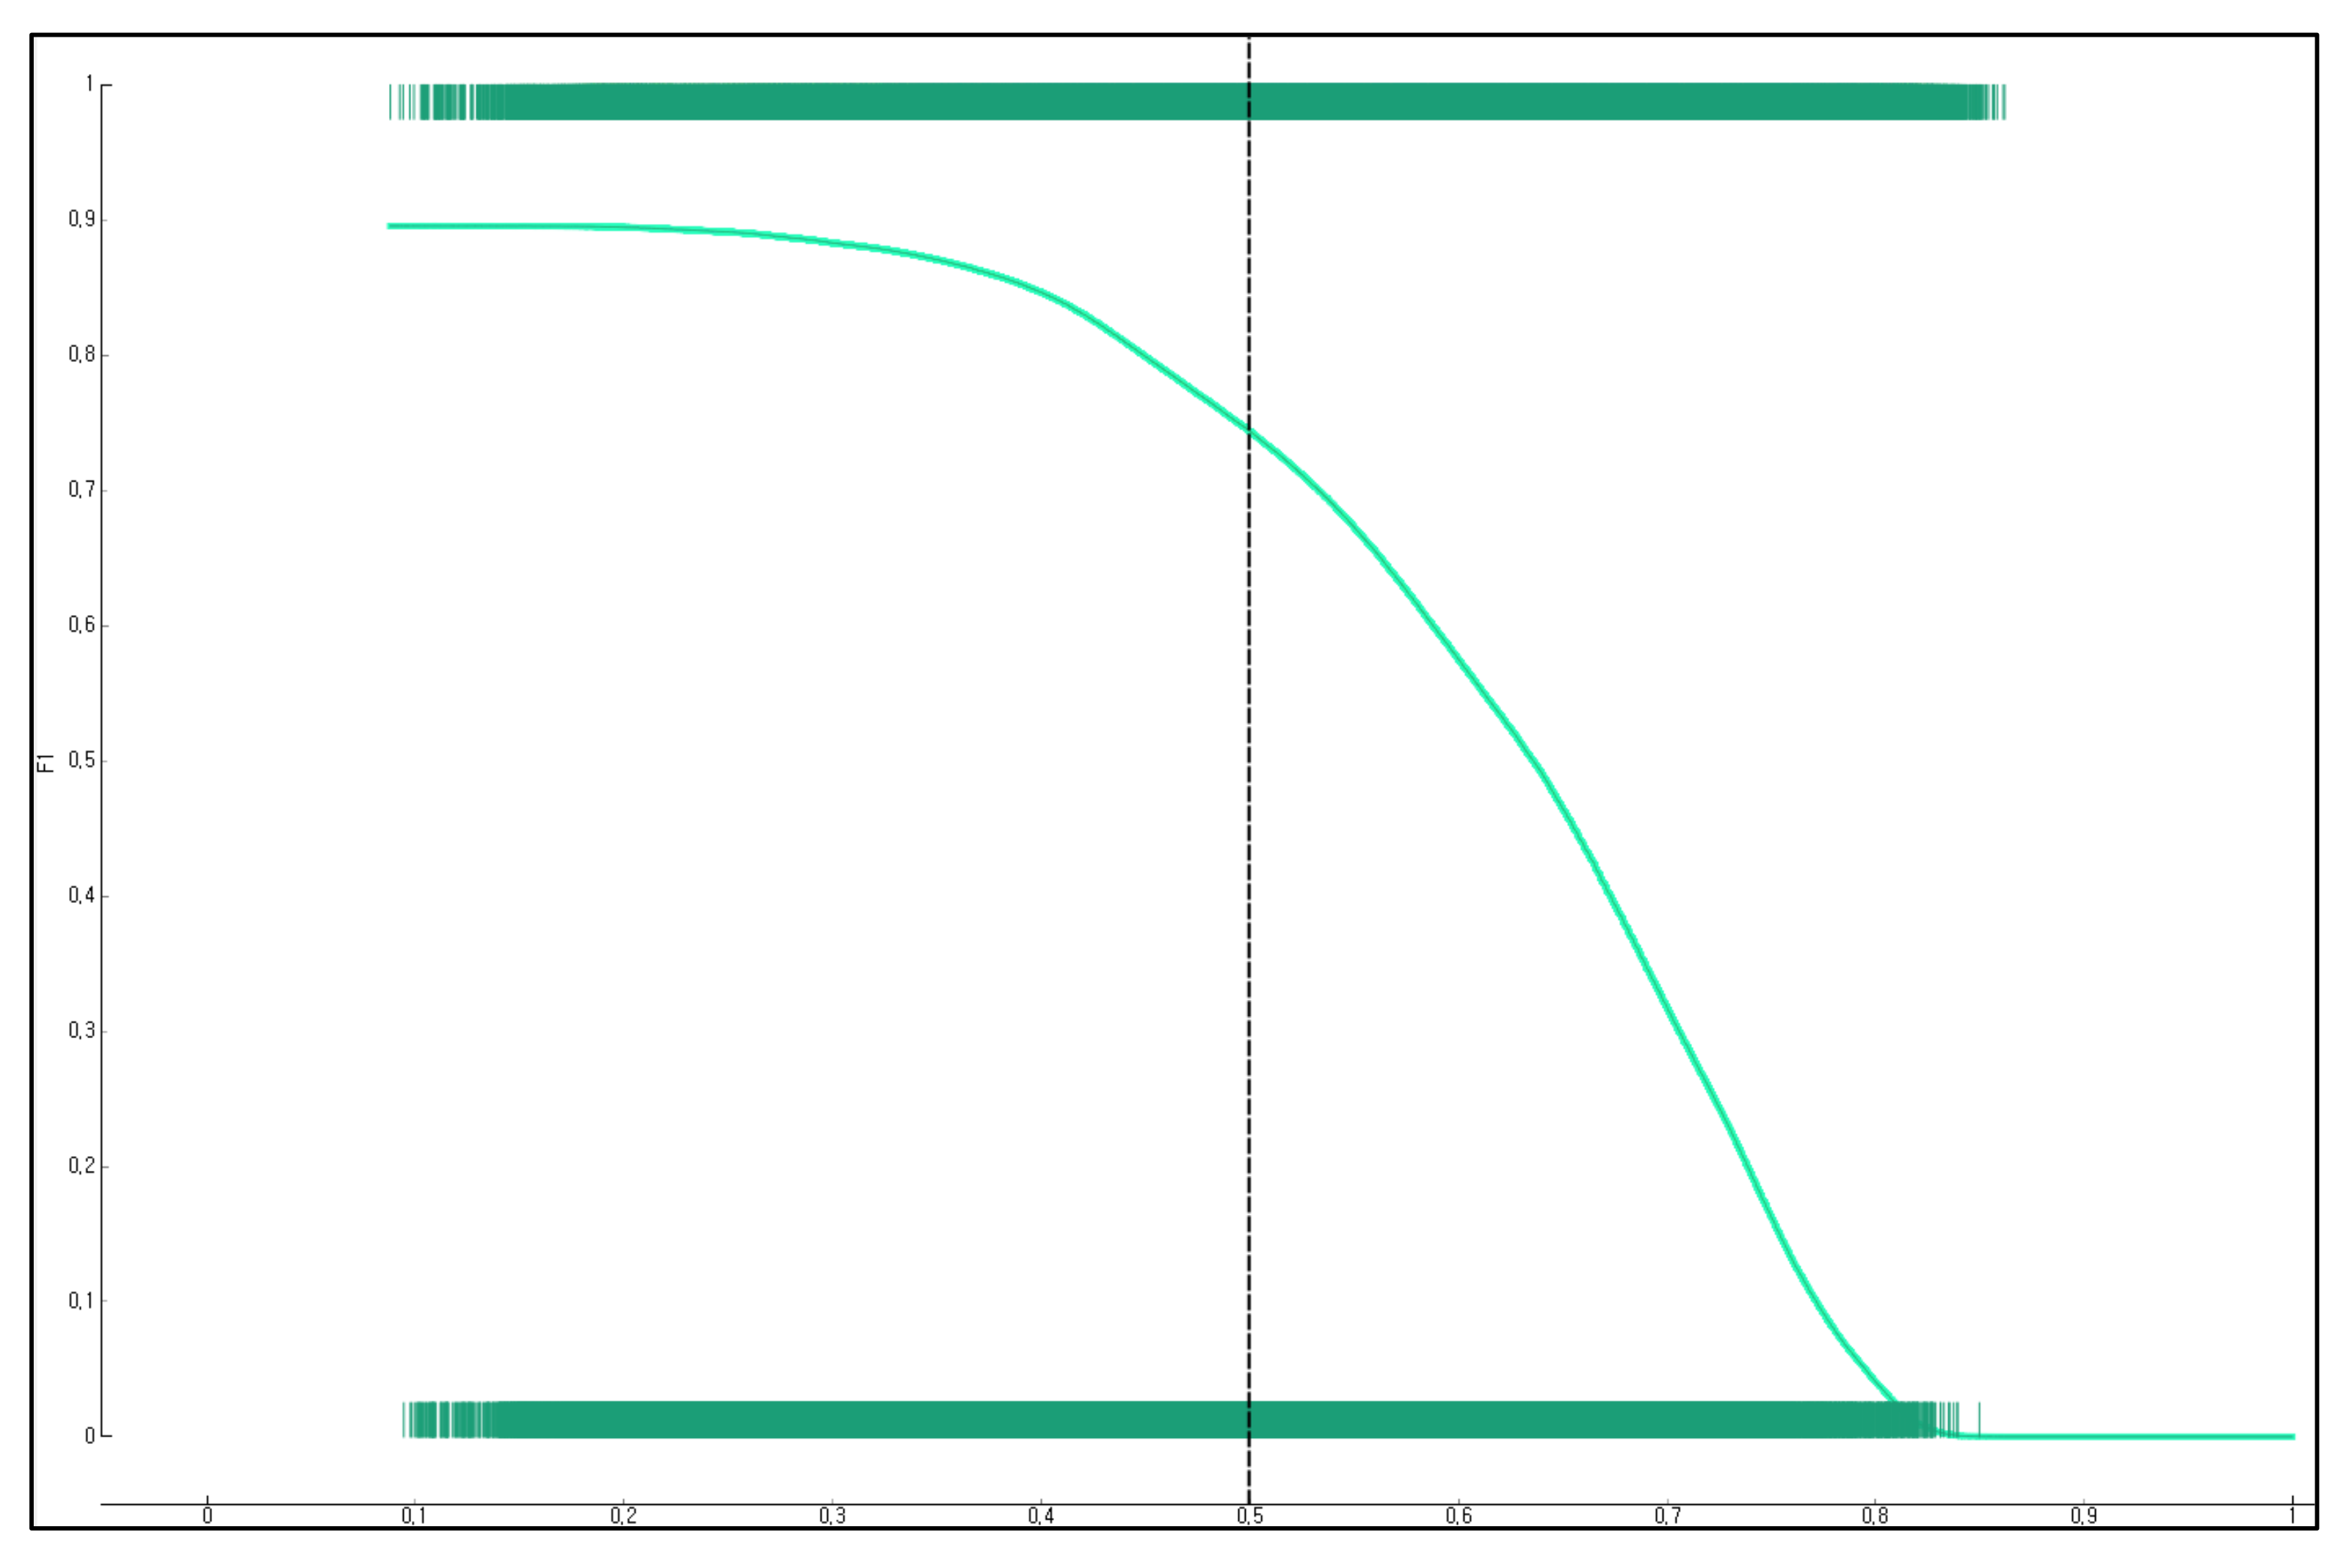
This study presents the precision, recall, classification accuracy, F-1 score, AUC, and calibration plot to validate the prediction performance of the developed logistic regression nomogram (Figure 6, Figure 7 and Figure 8). The result of the 5-fold cross validation showed that the classification accuracy of the nomogram for predicting anxiety due to COVID-19 included classification accuracy = 0.812 (Figure 6), precision = 0.761, recall = 0.812, AUC = 0.688 (Figure 7), and F-1 score = 0.740 (Figure 8). This study compared the difference between the observed probability and the predicted probability using a calibration plot and chi-square test for a group with anxiety due to COVID-19 and a group without anxiety due to COVID-19 (Figure 9). The result showed that the observed probability and the predicted probability were not significantly different (p = 0.150).
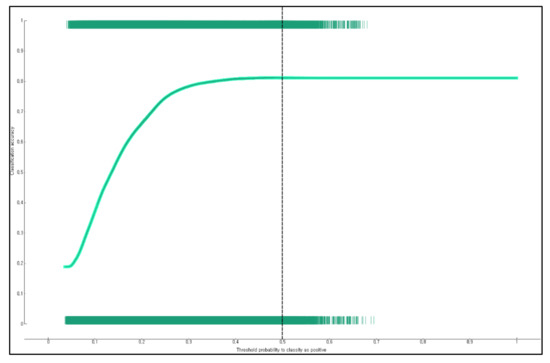
Figure 6.
Classification accuracy of the nomogram for predicting anxiety due to COVID-19 for adults living in South Korean communities.

Figure 7.
AUC of the nomogram for predicting anxiety due to COVID-19 for adults living in South Korean communities.
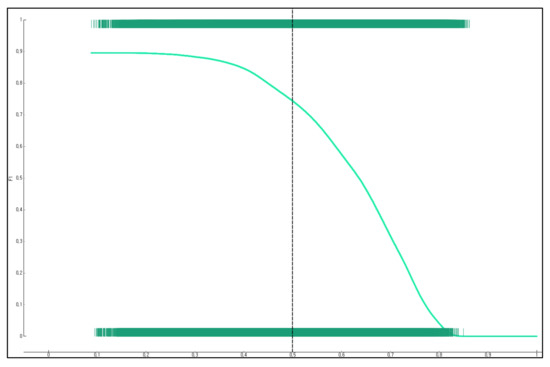
Figure 8.
F-1 score of the nomogram for predicting anxiety due to COVID-19 for adults living in South Korean communities.
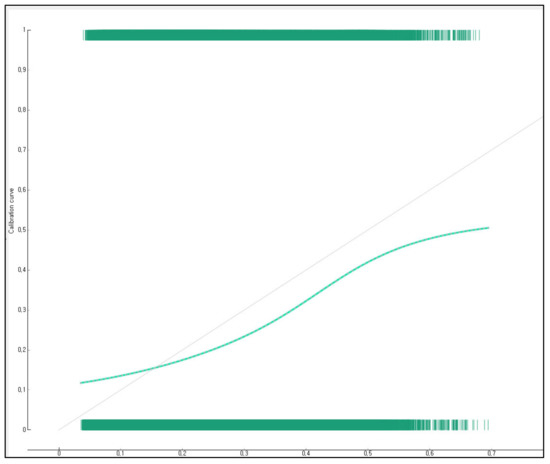
Figure 9.
Calibration plot of the nomogram for predicting anxiety due to COVID-19 for adults living in South Korean communities: dashed line, an ideal nomogram; solid line, performance of the present nomogram.
4. Discussion
This study identified factors related to anxiety induced by COVID-19 for adults in local communities using the stacking ensemble technique. The results revealed that education level, awareness of neighbors/colleagues’ COVID-19 response, age, gender, and subjective stress were major features with high weight in predicting anxiety due to COVID-19 in adults living in communities. Echoing the results of this study, Özdin et al. (2020) [20] identified the influencing factors of anxiety and depression for 343 adults living in the local community in Turkey, and female gender was the main risk factor of anxiety. An online survey was conducted to identify the anxiety level of the Iranian general population during the COVID-19 pandemic using 10,754 general populations living in 31 regions of Iran from 1 March to 9 March 2020 [10]. The results of this survey showed that the anxiety level of females was significantly higher than that of males [10]. Hyland et al. [11] also evaluated 1,041 general population in the Irish during the COVID-19 pandemic and reported that older adults aged 65 years and older had higher levels of COVID-19-related anxiety compared to young adults aged between 18 and 34 years. Those results agreed with the results of this study. It has been reported that anxiety disorders are generally caused by multiple factors, not by a single factor [29].
It is known that the prevalence of anxiety disorders is higher in women than in men [29], in the young and the prime-aged than the elderly [30], in the people with a lower education level than those with a higher education level [22,31,32], and in those with depressive disorders [33]. However, this study found that older adults felt more anxious than those in their prime age. It could be because the direct cause of anxiety was COVID-19, a new infectious disease inducing a high mortality rate among older adults with weakened immunity. Zhou et al. (2020) [23] showed that old age was the most important risk factor for death due to COVID-19 and confirmed that older adults accounted for the largest proportion of deaths due to COVID-19. It is believed that, due to the nature of COVID-19, which is highly contagious, and consequently is associated with high mortality, and has no cure, older adults who are less knowledgeable about the disease or have a lot of health concerns were more likely to experience anxiety than other age groups.
Although it is difficult to directly compare to the results of this study, Zhong et al. (2021) [34] identified the anxiety level and risk factors for anxiety during the COVID-19 crisis using the Self-Rating Anxiety Scale on 19,802 Chinese individuals living in local communities and reported that those with a history of SARS-CoV-2 infection or contact had an increased risk of anxiety and those with knowledge of personal protective measures or wearing a mask had a reduced risk of anxiety. The results imply that older adults who do not have enough knowledge about disease prevention or quarantine are more likely to suffer from anxiety.
Anxiety is known to be influenced by the notion or culture of the society to which an individual belongs [35]. However, there are still not enough studies on the predictive factors for anxiety for those living in communities after the COVID-19 pandemic. Therefore, additional epidemiological studies are required for various countries and races in the future.
Another finding regarding multiple risk factors of anxiety due to COVID-19 revealed that female older adults who felt a lot of subjective stress and with a highest level of education of elementary school graduation were predicted as a class vulnerable to anxiety induced by COVID-19, although they thought that neighbors and colleagues responded to COVID-19 appropriately. Interestingly, the risk of COVID-19-induced anxiety was predicted to be high in the group who felt a lot of subjective stress, even though they thought that neighbors and colleagues responded to COVID-19 appropriately. The mechanism of this result is not known. One possible explanation is that people in the Eastern culture, to which Korea belongs, emphasize group harmony instead of expressing individual desires and they are highly interested in how they appear to others even in social relationships [21]. Since Koreans particularly perceive themselves as beings affected by social groups and have others-oriented ways of thinking [36], they may feel anxious in a passive situation of following the opinion of the group, unlike those in the West. Consequently, even if a group of individuals actively participates in COVID-19 prevention measures such as social distancing, wearing a mask, and cohort blockade, the individuals are highly likely to suffer from a high level of internal stress or feel anxious. Therefore, emotional support for them is necessary.
Anxiety is a phenomenon that appears distinctively in situations where a disaster or an accident occurs [37]. In particular, a disaster for an extended period due to an infectious disease such as COVID-19 has a higher negative impact on the general public, because it has a higher morbidity and mortality rate than natural disasters or terrorism. Furthermore, since the pandemic of new infectious diseases brings intensive infectious disease management policies such as isolation, quarantine, social distancing, and cohort blockade at the national level, the magnitude of social and economic anxiety on the local community may be greater than that of natural disasters [34]. Nevertheless, there are only a few large-scale epidemiological studies on the anxiety and mental health of people residing in communities after the onset of the COVID-19 pandemic. In order for the government to successfully implement public health measures against COVID-19, such as quarantine, it is necessary to minimize their negative impacts on the mental health of the community population, such as anxiety [12]. Given the global pandemic of COVID-19, which has lasted more than 20 months since the coronavirus disease outbreak in December 2019, it is required to conduct more evidence-based epidemiological studies to help policymakers develop guidelines for enhancing the mental health of the community population. Prospective or retrospective cohort studies are required to causally identify the characteristics of anxiety disorders targeting high-risk COVID-19 anxiety groups identified in this study.
The importance of this study was that it identified multiple risk factors for anxiety induced by COVID-19 using large-scale epidemiological data that could represent South Korean adults living in local communities and developed a nomogram that could predict high-risk groups of anxiety based on the results. The limitations of this study are as follows. Firstly, since this study did not define anxiety based on a medical diagnosis, the results should be interpreted with caution. Additional studies using standardized tests such as the Liebowitz Social Anxiety Scale [38] are needed to predict high-risk groups of anxiety disorder and social anxiety disorder in the future. Secondly, anxiety can be affected by social networks such as family relationships, friendships, and relationships with colleagues, but this study did not investigate the characteristics of social networks. It is required to develop a model for predicting COVID-19-induced anxiety while considering the characteristics of social networks. Thirdly, this study did not investigate the past medical history of individuals with anxiety disorders. Fourthly, since this was a cross-sectional study, the results of this study could not be interpreted as a causal relationship. Additional longitudinal studies are required to prove causality due to COVID-19.
5. Conclusions
In South Korea, the mental health, such as anxiety, of people living in local communities has been seriously exacerbated. Therefore, the South Korean government is identifying the impact of COVID-19 through a nationwide survey on mental health, distributing psychological support guidelines, and providing support such as the operation of psychological support groups for each local government. In order for these policy-level supports to be more effective, it is needed to more specifically select and support those suffering from COVID-19-induced anxiety and stress.
It is required to screen anxiety disorders in high-risk groups for COVID-19-induced anxiety, which has multiple risk factors such as education level, awareness of neighbors/colleagues’ COVID-19 response, age, gender, and subjective stress at the same time among female older adults living in local communities based on the results of this study. Moreover, continuous community-centered monitoring is needed to maintain mental health. Further anxiety prediction studies considering the characteristics of the community are needed to effectively predict the high-risk group of anxiety due to COVID-19.
Funding
This research was supported by Basic Science Research Program through the National Research Foundation of Korea (NRF) funded by the Ministry of Education (NRF-2018R1D1A1B07041091, NRF-2021S1A5A8062526).
Institutional Review Board Statement
The study was conducted according to the guidelines of the Declaration of Helsinki, and approved by the Institutional Review Board (or Ethics Committee) of Korea Centers for Disease Control and Prevention.
Informed Consent Statement
All subjects gave their informed consent for inclusion before they participated in the study. The study was conducted in accordance with the Declaration of Helsinki, and the protocol was approved by the Ethics Committee of Korea Centers for Disease Control and Prevention.
Data Availability Statement
Restrictions apply to the availability of these data. Data were obtained from Korea Centers for Disease Control and Prevention and are available [from the Korea Centers for Disease Control and Prevention/https://chs.kdca.go.kr/chs/recsRoom/dataBaseMain.do (accessed on 30 June 2021)] with the permission of Korea Centers for Disease Control and Prevention.
Conflicts of Interest
The author declares no conflict of interest.
References
- Coronavirus Disease (COVID-19) Weekly Epidemiological Update and Weekly Operational Update. Available online: https://www.who.int/emergencies/diseases/novel-coronavirus-2019/situation-reports (accessed on 30 August 2021).
- Alexandar, S.; Ravisankar, M.; Kumar, R.S.; Jakkan, K. A comprehensive review on Covid-19 Delta variant. Int. J. Clin. Pharmacol. Res. 2021, 5, 83–85. [Google Scholar]
- Pascarella, G.; Strumia, A.; Piliego, C.; Bruno, F.; Del Buono, R.; Costa, F.; Scarlata, S.; Agrò, F.E. COVID-19 diagnosis and management: A comprehensive review. J. Intern. Med. 2020, 288, 192–206. [Google Scholar] [CrossRef] [PubMed]
- Ciotti, M.; Ciccozzi, M.; Terrinoni, A.; Jiang, W.C.; Wang, C.B.; Bernardini, S. The COVID-19 pandemic. Crit. Rev. Clin. Lab. Sci. 2020, 57, 365–388. [Google Scholar] [CrossRef] [PubMed]
- Petrosillo, N.; Viceconte, G.; Ergonul, O.; Ippolito, G.; Petersen, E. COVID-19, SARS and MERS: Are they closely related? Clin. Microbiol. Infect. 2020, 26, 729–734. [Google Scholar] [CrossRef] [PubMed]
- Zhao, S.; Lin, Q.; Ran, J.; Musa, S.S.; Yang, G.; Wang, W.; Lou, Y.; Gao, D.; Yang, L.; He, D.; et al. Preliminary estimation of the basic reproduction number of novel coronavirus (2019-nCoV) in China, from 2019 to 2020: A data-driven analysis in the early phase of the outbreak. Int. J. Infect. Dis. 2020, 92, 214–217. [Google Scholar] [CrossRef] [Green Version]
- Serafini, G.; Parmigiani, B.; Amerio, A.; Aguglia, A.; Sher, L.; Amore, M. The psychological impact of COVID-19 on the mental health in the general population. QJM 2020, 113, 531–537. [Google Scholar] [CrossRef]
- Torales, J.; O’Higgins, M.; Castaldelli-Maia, J.M.; Ventriglio, A. The outbreak of COVID-19 coronavirus and its impact on global mental health. Int. J. Soc. Psychiatry 2020, 66, 317–320. [Google Scholar] [CrossRef] [Green Version]
- Wang, X.; Gao, L.; Zhang, H.; Zhao, C.; Shen, Y.; Shinfuku, N. Post earthquake quality of life and psychological well being: Longitudinal evaluation in a rural community sample in northern China. Psychiatry Clin. Neurosci. 2000, 54, 427–433. [Google Scholar] [CrossRef]
- Moghanibashi-Mansourieh, A. Assessing the anxiety level of Iranian general population during COVID-19 outbreak. Asian J. Psychiatr. 2020, 51, 102076. [Google Scholar] [CrossRef]
- Hyland, P.; Shevlin, M.; McBride, O.; Murphy, J.; Karatzias, T.; Bentall, R.P.; Martinez, A.; Vallières, F. Anxiety and depression in the Republic of Ireland during the COVID-19 pandemic. Acta Psychiatr. Scand. 2020, 142, 249–256. [Google Scholar] [CrossRef]
- Ferraro, F.; Calafiore, D.; Dambruoso, F.; Guidarini, S.; de Sire, A. COVID-19 related fatigue: Which role for rehabilitation in post-COVID-19 patients? A case series. J. Med. Virol. 2021, 93, 1896–1899. [Google Scholar] [CrossRef]
- De Sire, A.; Marotta, N.; Raimo, S.; Lippi, L.; Inzitari, M.T.; Tasselli, A.; Gimigliano, A.; Palermo, L.; Invernizzi, M.; Ammendolia, A. Psychological Distress and Work Environment Perception by Physical Therapists from Southern Italy during COVID-19 Pandemic: The C.A.L.A.B.R.I.A Study. Int. J. Environ. Res. Public Health 2021, 14, 9676. [Google Scholar] [CrossRef]
- Farì, G.; de Sire, A.; Giorgio, V.; Rizzo, L.; Bruni, A.; Bianchi, F.P.; Zonno, A.; Pierucci, P.; Ranieri, M.; Megna, M. Impact of COVID-19 on the mental health in a cohort of Italian rehabilitation healthcare workers. J. Med. Virol. 2021, 13, 1–9. [Google Scholar] [CrossRef]
- Negrini, F.; Ferrario, I.; Mazziotti, D.; Berchicci, M.; Bonazzi, M.; de Sire, A.; Negrini, S.; Zapparoli, L. Neuropsychological Features of Severe Hospitalized Coronavirus Disease 2019 Patients at Clinical Stability and Clues for Postacute Rehabilitation. Arch. Phys. Med. Rehabil. 2021, 102, 155–158. [Google Scholar] [CrossRef]
- Brooks, S.K.; Webster, R.K.; Smith, L.E.; Woodland, L.; Wessely, S.; Greenberg, N.; Rubin, G.J. The psychological impact of quarantine and how to reduce it: Rapid review of the evidence. Lancet 2020, 395, 912–920. [Google Scholar] [CrossRef] [Green Version]
- Roy, D.; Tripathy, S.; Kar, S.K.; Sharma, N.; Verma, S.K.; Kaushal, V. Study of knowledge, attitude, anxiety & perceived mental healthcare need in Indian population during COVID-19 pandemic. Asian J. Psychiatr. 2020, 51, 102083. [Google Scholar] [CrossRef]
- Shigemura, J.; Ursano, R.J.; Morganstein, J.C.; Kurosawa, M.; Benedek, D.M. Public responses to the novel 2019 coronavirus (2019-nCoV) in Japan: Mental health consequences and target populations. Psychiatry Clin. Neurosci. 2020, 74, 281–282. [Google Scholar] [CrossRef] [PubMed]
- Salari, N.; Hosseinian-Far, A.; Jalali, R.; Vaisi-Raygani, A.; Rasoulpoor, S.; Mohammadi, M.; Rasoulpoor, S.; Khaledi-Paveh, B. Prevalence of stress, anxiety, depression among the general population during the COVID-19 pandemic: A systematic review and meta-analysis. Glob. Health 2020, 16, 1–11. [Google Scholar] [CrossRef] [PubMed]
- Özdin, S.; Özdin, Ş.B. Levels and predictors of anxiety, depression and health anxiety during COVID-19 pandemic in Turkish society: The importance of gender. Int. J. Soc. Psychiatry 2020, 66, 504–511. [Google Scholar] [CrossRef] [PubMed]
- Lee, D.H.; Kim, Y.J.; Lee, D.H.; Hwang, H.H.; Nam, S.K.; Kim, J.H. The influence of public fear, and psycho-social experiences during the coronavirus disease 2019 (COVID-19) pandemic on depression and anxiety in South Korea. Korean J. Counsel. Psychother. 2020, 32, 2119–2156. [Google Scholar] [CrossRef]
- Byeon, H. A laryngeal disorders prediction model based on cluster analysis and regression analysis. Medicine 2019, 98, e16686. [Google Scholar] [CrossRef]
- Jia, Q.; Guo, Y.; Wang, G.; Barnes, S.J. Big data analytics in the fight against major public health incidents (including COVID-19): A conceptual framework. Int. J. Environ. Res. Public Health 2020, 17, 6161. [Google Scholar] [CrossRef]
- Wang, F.; Li, Z.; He, F.; Wang, R.; Yu, W.; Nie, F. Feature learning viewpoint of AdaBoost and a new algorithm. IEEE Access 2019, 7, 149890–149899. [Google Scholar] [CrossRef]
- Byeon, H. Exploring factors for predicting anxiety disorders of the elderly living alone in South Korea using interpretable machine learning: A population-based study. Int. J. Environ. Res. Public Health 2021, 18, 7625. [Google Scholar] [CrossRef]
- Byeon, H. Development of a nomogram for predicting depression in the elderly using Patient Health Questionnaire-9 among a nationwide sample of Korean elderly. J. Pers. Med. 2021, 11, 645. [Google Scholar] [CrossRef]
- Kim, Y.T.; Choi, B.Y.; Lee, K.O.; Kim, H.; Chun, J.H.; Kim, S.Y.; Lee, S.H.; Ghim, Y.A.; Lim, D.S.; Kang, Y.W.; et al. Overview of Korean community health survey. J. Korean Med. Assoc. 2012, 55, 74–83. [Google Scholar] [CrossRef] [Green Version]
- Goebel, S.; Mehdorn, H.M. Measurement of psychological distress in patients with intracranial tumours: The NCCN distress thermometer. J. Neuro Oncol. 2011, 104, 357–364. [Google Scholar] [CrossRef]
- Kampman, O.; Viikki, M.; Leinonen, E. Anxiety disorders and temperament—an update review. Curr. Psychiatry Rep. 2017, 19, 27. [Google Scholar] [CrossRef]
- Gum, A.M.; King-Kallimanis, B.; Kohn, R. Prevalence of mood, anxiety, and substance-abuse disorders for older Americans in the national comorbidity survey-replication. Am. J. Geriatr. Psychiatry 2009, 17, 769–781. [Google Scholar] [CrossRef] [PubMed]
- Bekker, M.H.; van Mens-Verhulst, J. Anxiety disorders: Sex differences in prevalence, degree, and background, but gender-neutral treatment. Gend. Med. 2007, 4, S178–S193. [Google Scholar] [CrossRef]
- Furmark, T.; Tillfors, M.; Everz, P.; Marteinsdottir, I.; Gefvert, O.; Fredrikson, M. Social phobia in the general population: Prevalence and sociodemographic profile. Soc. Psychiatry Psychiatr. Epidemiol. 1999, 34, 416–424. [Google Scholar] [CrossRef]
- Zhou, F.; Yu, T.; Du, R.; Fan, G.; Liu, Y.; Liu, Z.; Xiang, J.; Wang, Y.; Song, B.; Gu, X.; et al. Clinical course and risk factors for mortality of adult inpatients with COVID-19 in Wuhan, China: A retrospective cohort study. Lancet 2020, 395, 1054–1062. [Google Scholar] [CrossRef]
- Zhong, J.; Zhong, C.; Qiu, L.; Li, J.; Lai, J.; Lu, W.; Wang, S.; Zhong, J.; Zhao, J.; Zhou, Y. Risk and protective factors for anxiety during COVID-19 pandemic. BMC Public Health 2021, 21, 1063. [Google Scholar] [CrossRef]
- Heinrichs, N.; Rapee, R.M.; Alden, L.A.; Bogels, S.; Hofmann, S.G.; Oh, K.J.; Sakano, Y. Cultural differences in perceived social norms and social anxiety. Behav. Res. Ther. 2006, 44, 1187–1197. [Google Scholar] [CrossRef]
- Choy, Y.; Schneier, F.R.; Heimberg, R.G.; Oh, K.S.; Liebowitz, M.R. Features of the offensive subtype of Taijin-Kyofu-Sho in US and Korean patients with DSM-IV social anxiety disorder. Depress. Anxiety 2008, 25, 230–240. [Google Scholar] [CrossRef] [PubMed]
- Fergusson, D.M.; Horwood, L.J.; Boden, J.M.; Mulder, R.T. Impact of a major disaster on the mental health of a well-studied cohort. JAMA Psychiatry 2014, 71, 1025–1031. [Google Scholar] [CrossRef] [PubMed] [Green Version]
- Heimberg, R.G.; Horner, K.J.; Juster, H.R.; Safren, S.A.; Brown, E.J.; Schneier, F.R.; Liebowitz, M.R. Psychometric properties of the Liebowitz Social Anxiety Scale. Psychol. Med. 1999, 29, 199–212. [Google Scholar] [CrossRef] [PubMed]


Publisher’s Note: MDPI stays neutral with regard to jurisdictional claims in published maps and institutional affiliations. |
© 2021 by the author. Licensee MDPI, Basel, Switzerland. This article is an open access article distributed under the terms and conditions of the Creative Commons Attribution (CC BY) license (https://creativecommons.org/licenses/by/4.0/).