1. Introductory Comments
The article [
1] describes the theoretical basis for infrared radiation and gives some computational examples of radiant heat transfer. The present article, which is like a second part of that article [
1], describes in detail how and by whom infrared radiation was discovered. In addition, it details the conclusions that were reached by F. W. Herschel studying the properties of infrared radiation. The motivation for writing this article is the fact that the details and mainly the extent of this discovery are not widely known, and different descriptions of this story are found in the literature, e.g., in [
2,
3,
4,
5].
In general, the history of the discovery of infrared radiation is treated marginally in the literature. This is not fair, even taking into account the fact that infrared radiation is of fundamental importance for modern man.
Additionally, yet, apart from metrology, this radiation is also used, for example, in medicine, e.g., for irradiating inflamed tissues (it accelerates the absorption of secretions), treating wounds where the healing process is prolonged, treating neuralgia and muscular pains or treating frostbite. Nowadays, thermal imaging systems play a fundamental role in the screening diagnosis of COVID-19 patients. Infrared radiation is also used, for example, for heating rooms’ infrared radiators. In other words, it is difficult to imagine the functioning of modern man without the use of infrared radiation.
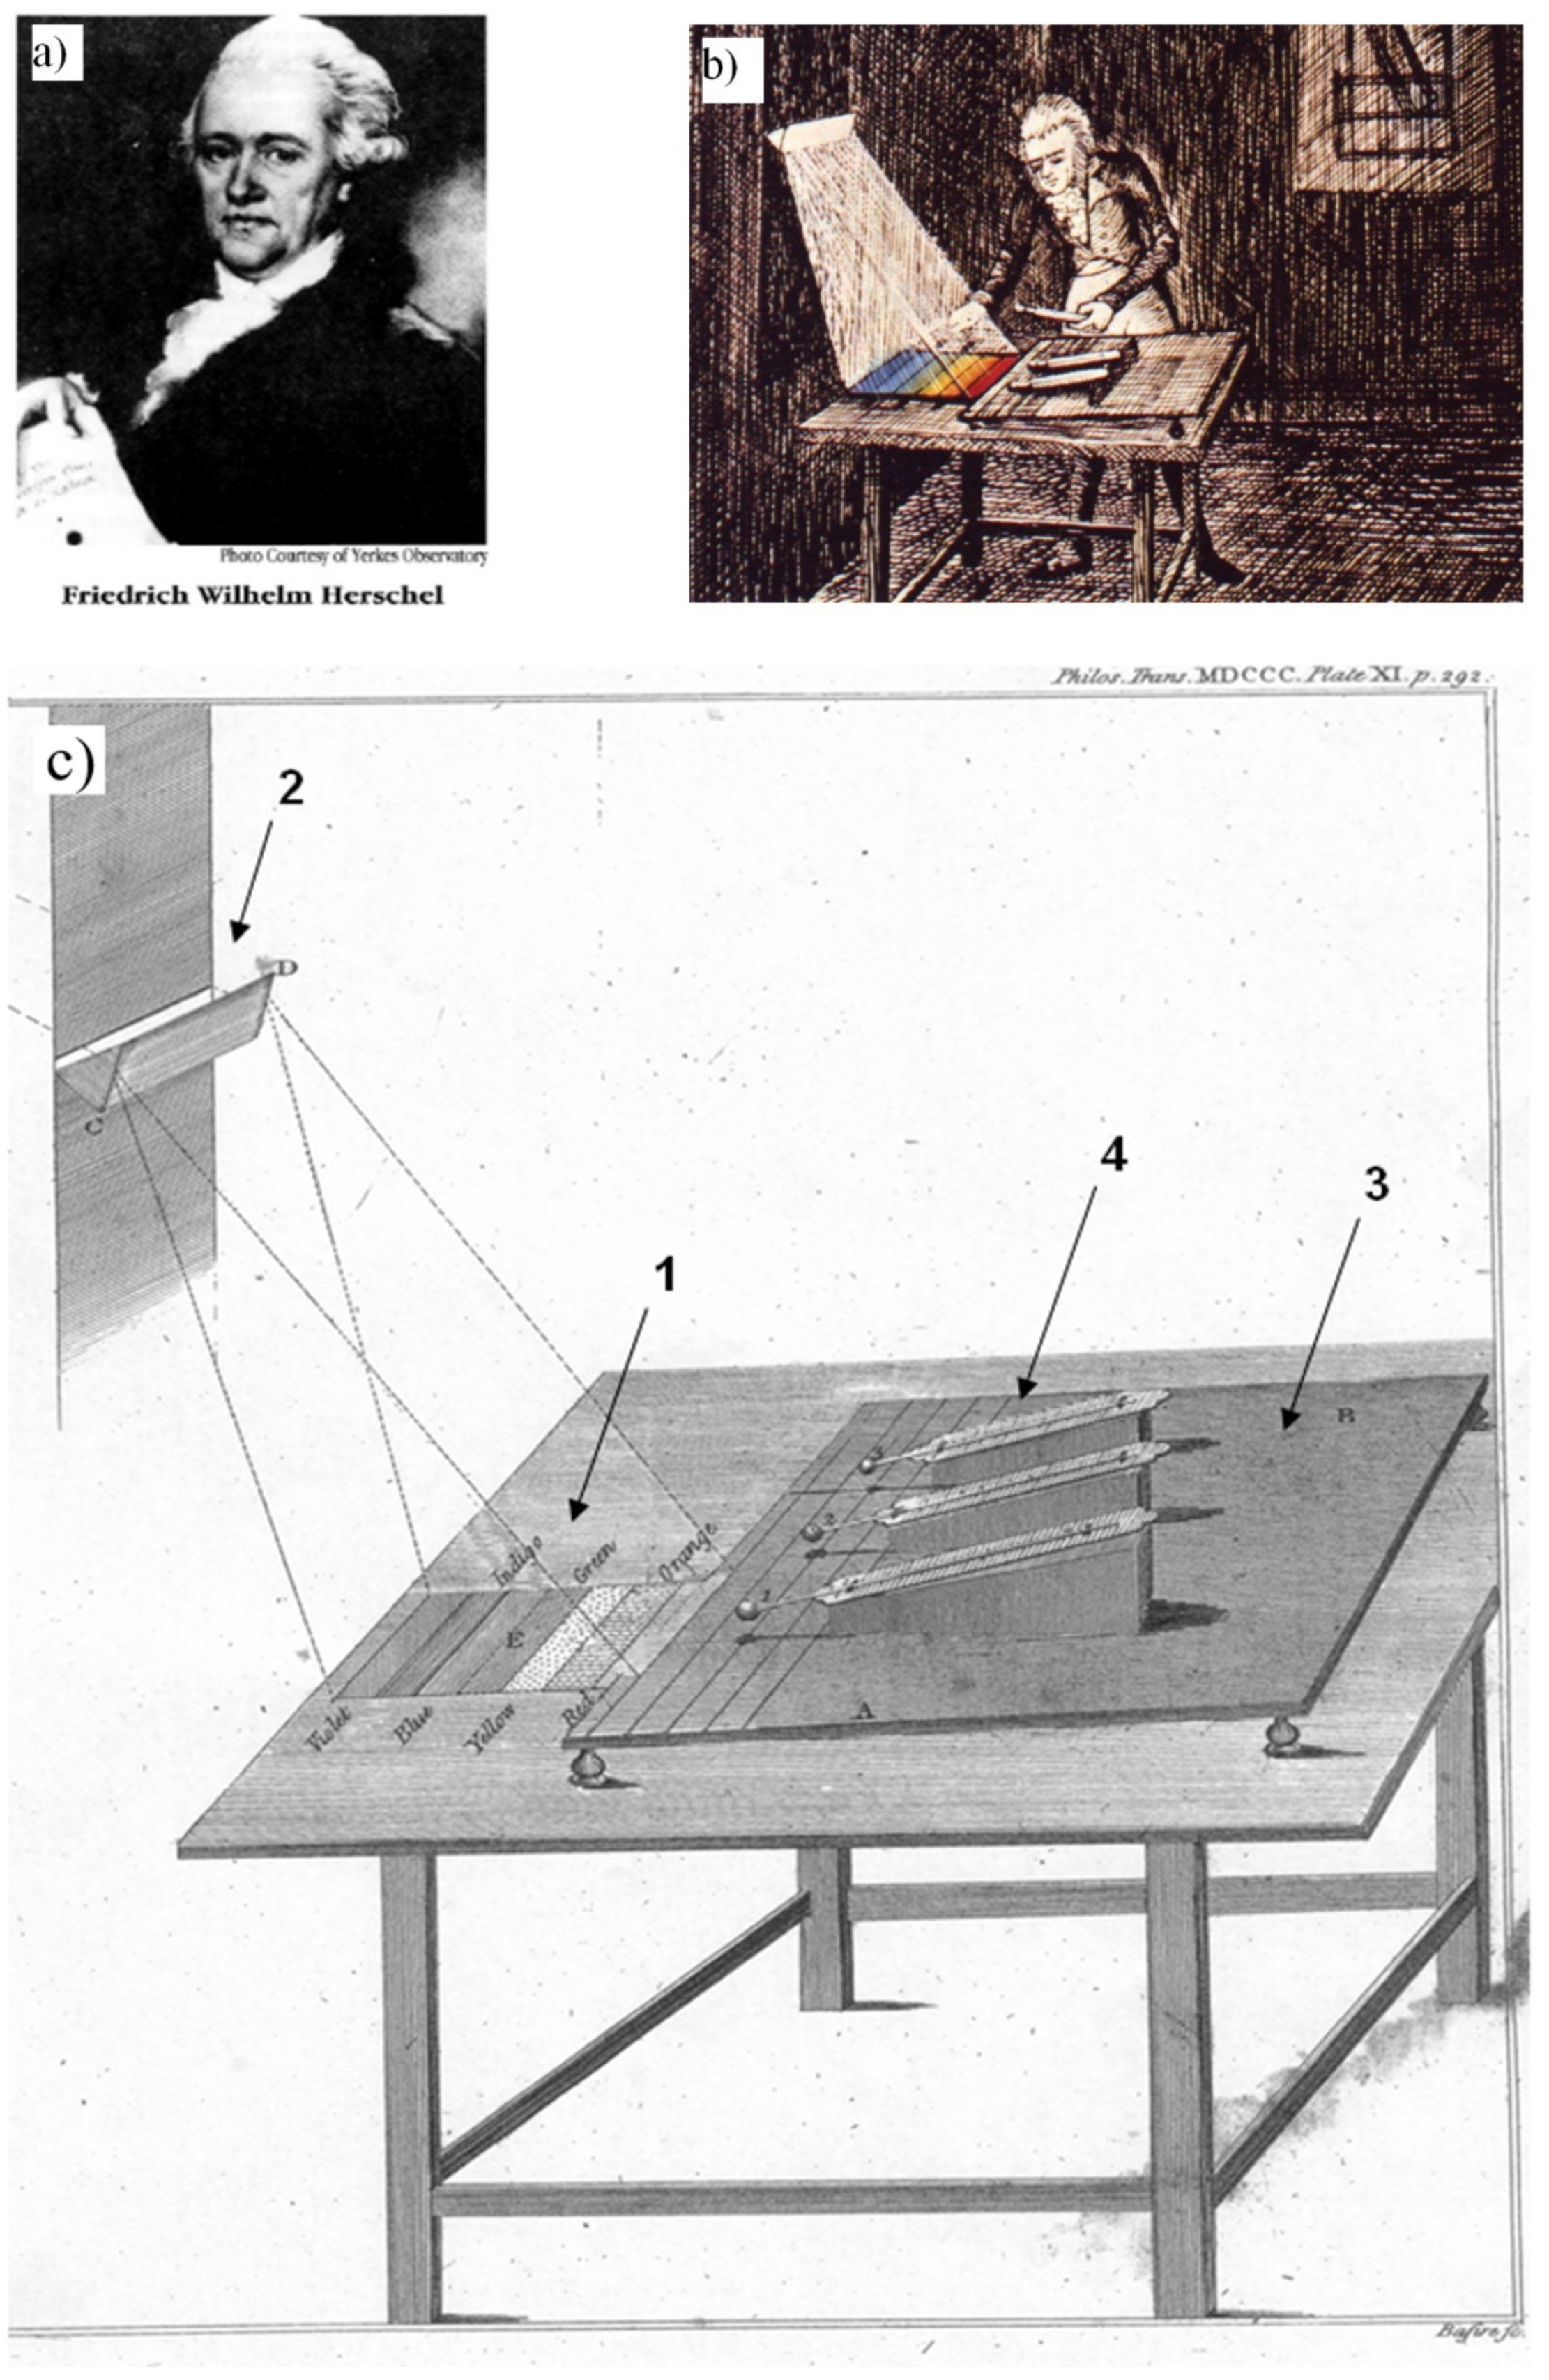
Frederick William Herschel is considered to be the discoverer of infrared radiation. The scientific achievements of the Herschel family are known in the world of science mainly in astronomy, but less known in the metrology environment. Therefore, it seems appropriate to give some information on this family, the more so that the discovery of F.W. Herschel was of fundamental importance for the development of infrared measurement technology. This information was described by F.W. Herschel’s only son, John Frederick William [
6].
2. Biography of Frederick William Herschel (Born 15 November 1738, Died 25 August 1822)
Frederick William Herschel’s great-grandfather, Hans Herschel, left his native Moravia in the early 17th century to become a brewer in Saxony. His grandfather, Abraham worked in the gardens of the Elector of Saxony in Dresden. His father, Isaac, was an oboist in a regiment of the Hanoverian Guard and in time was promoted to bandmaster. In 1732, he married Anna Ilse Moritzen and had ten children with her. The youngest of four sons, Frederick Wilhelm (Wilhelm is the German equivalent of the English William), born in Hanover in 1738, was initially, similar to his father and brothers, a musician—an oboist and violinist. At the age of 14, he joined the band of the Hanoverian guard. After the occupation of Hanover by French troops, he left for England at the age of 21. Here, he worked as an organist and music teacher, first in Halifax, then in Bath. At the same time, he studied books on music theory, mathematics, optics and astronomy at night [
6,
7].
Having no money to buy a telescope, he started to grind and polish mirrors himself, with the help of his brother Alexander and sister Caroline, and to build telescopes of bigger and bigger sizes from them. Aiming to reduce the loss of light and to increase the sharpness of images, Herschel simplified the construction of a mirror telescope. Namely, he inclined the main, concave mirror in relation to the longitudinal axis of the telescope, which allowed him to do without a supplementary, small flat mirror.
For a number of years, Herschel supported himself by making and selling telescopes. He devoted every spare moment of the night to observing the sky. Only the annual salary of 200 pounds sterling appointed to him by King George III, and in 1788, his marriage to the widow of a rich London merchant allowed him to devote himself entirely to astronomy.
In 1786, F.W. Herschel moved to Slough near Windsor. Here, in 1789, he installed a telescope—a giant with a length of almost 12 m and a mirror with a diameter of 1.22 m. With the help of his telescopes, which were increasingly larger in size, he made a number of important discoveries. In 1781, he discovered a new planet, Uranus, the first large planet unknown to the ancients, in 1787, two moons of Uranus-Oberon and Titania, and in 1789, two previously unknown moons of Saturn-Mimas and Enceladus.
Herschel’s research into the Sun, stars, star clusters and nebulae was even more momentous. In 1783, he detected the movement of the Sun and together with it the whole solar system towards the constellation Hercules. The research on “double stars” conducted by Herschel over the next quarter of a century was also of a pioneering nature. They showed that among the stars, which we can see close to each other in the firmament, there are pairs of stars that are really close to each other in space and circling on elliptical tracks around a common centre of gravity. This was at the same time the first observation-based proof that the law of gravitation is also valid beyond the boundaries of the solar system.
With the help of his powerful telescopes, Herschel also discovered an enormous, almost unknown before him, world of star clusters and nebulae. Before him, about 100 nebulae and star clusters were known. He discovered about 2500 of them, determined their developmental phases and guessed the laws of their distribution. Herschel was the first to study the distribution of stars in space. He determined the number of stars in different, selected sections of the sky and treated the visible concentration of stars in a certain section as a measure of the depth to which a stellar system extends in that direction. These works initiated the statistics of stars and research into the structure of the universe.
Frederick William’s faithful companion and collaborator in his astronomical research was his sister Caroline Lucretia (born 1750, died 1848, resided in England from 1772 to 1822). She independently discovered eight comets and compiled a new catalogue of stars. After the death of her brother, she returned to Hanover, where she died at the age of 98. On 7 March 1792, Frederick William was born his only son, John Frederick William who died in 1871. He was later a mathematician, physicist, chemist, translator of poetry and, above all, an astronomer, who among other things wrote down his father’s story and continued his work.
Sir Frederick William Herschel for his scientific merits received the title of nobility. He died on 25 August 1822 in Slough near Windsor, in the county of Buckinghamshire.
In temperature metrology, for thermal measurements and their application in technology, the most important is of course Frederick William’s experience, described below, with the discovery of infrared radiation. The importance of this discovery for modern science can be confirmed by the fact that in Slough near Windsor, where Herschel lived and worked, to mark the 200th anniversary of the discovery of infrared radiation, an International Symposium was held in 2000, combined with a presentation of the latest thermal imaging systems with the participation of scientists and manufacturers from around the world. A number of regular conferences on infrared measurement are also held around the world.
3. Fredericks William Herschel Experiment (Discovery of Infrared Radiation)
The discovery of the existence of infrared radiation by Herschel was related to his research on modernising the construction of his telescopes. He was looking for a filtering material with which, during solar observations, he could reduce the brightness of the Sun’s image in his telescope. While testing a number of samples of coloured glass that gave a similar reduction in brightness, he was intrigued by the fact that some of the samples transmitted little solar heat, while others transmitted so much heat that he risked damaging his eye within a few seconds of observation.
Figure 1c shows a view of F.W. Herschel’s research stand. This figure was scanned directly from his original article [
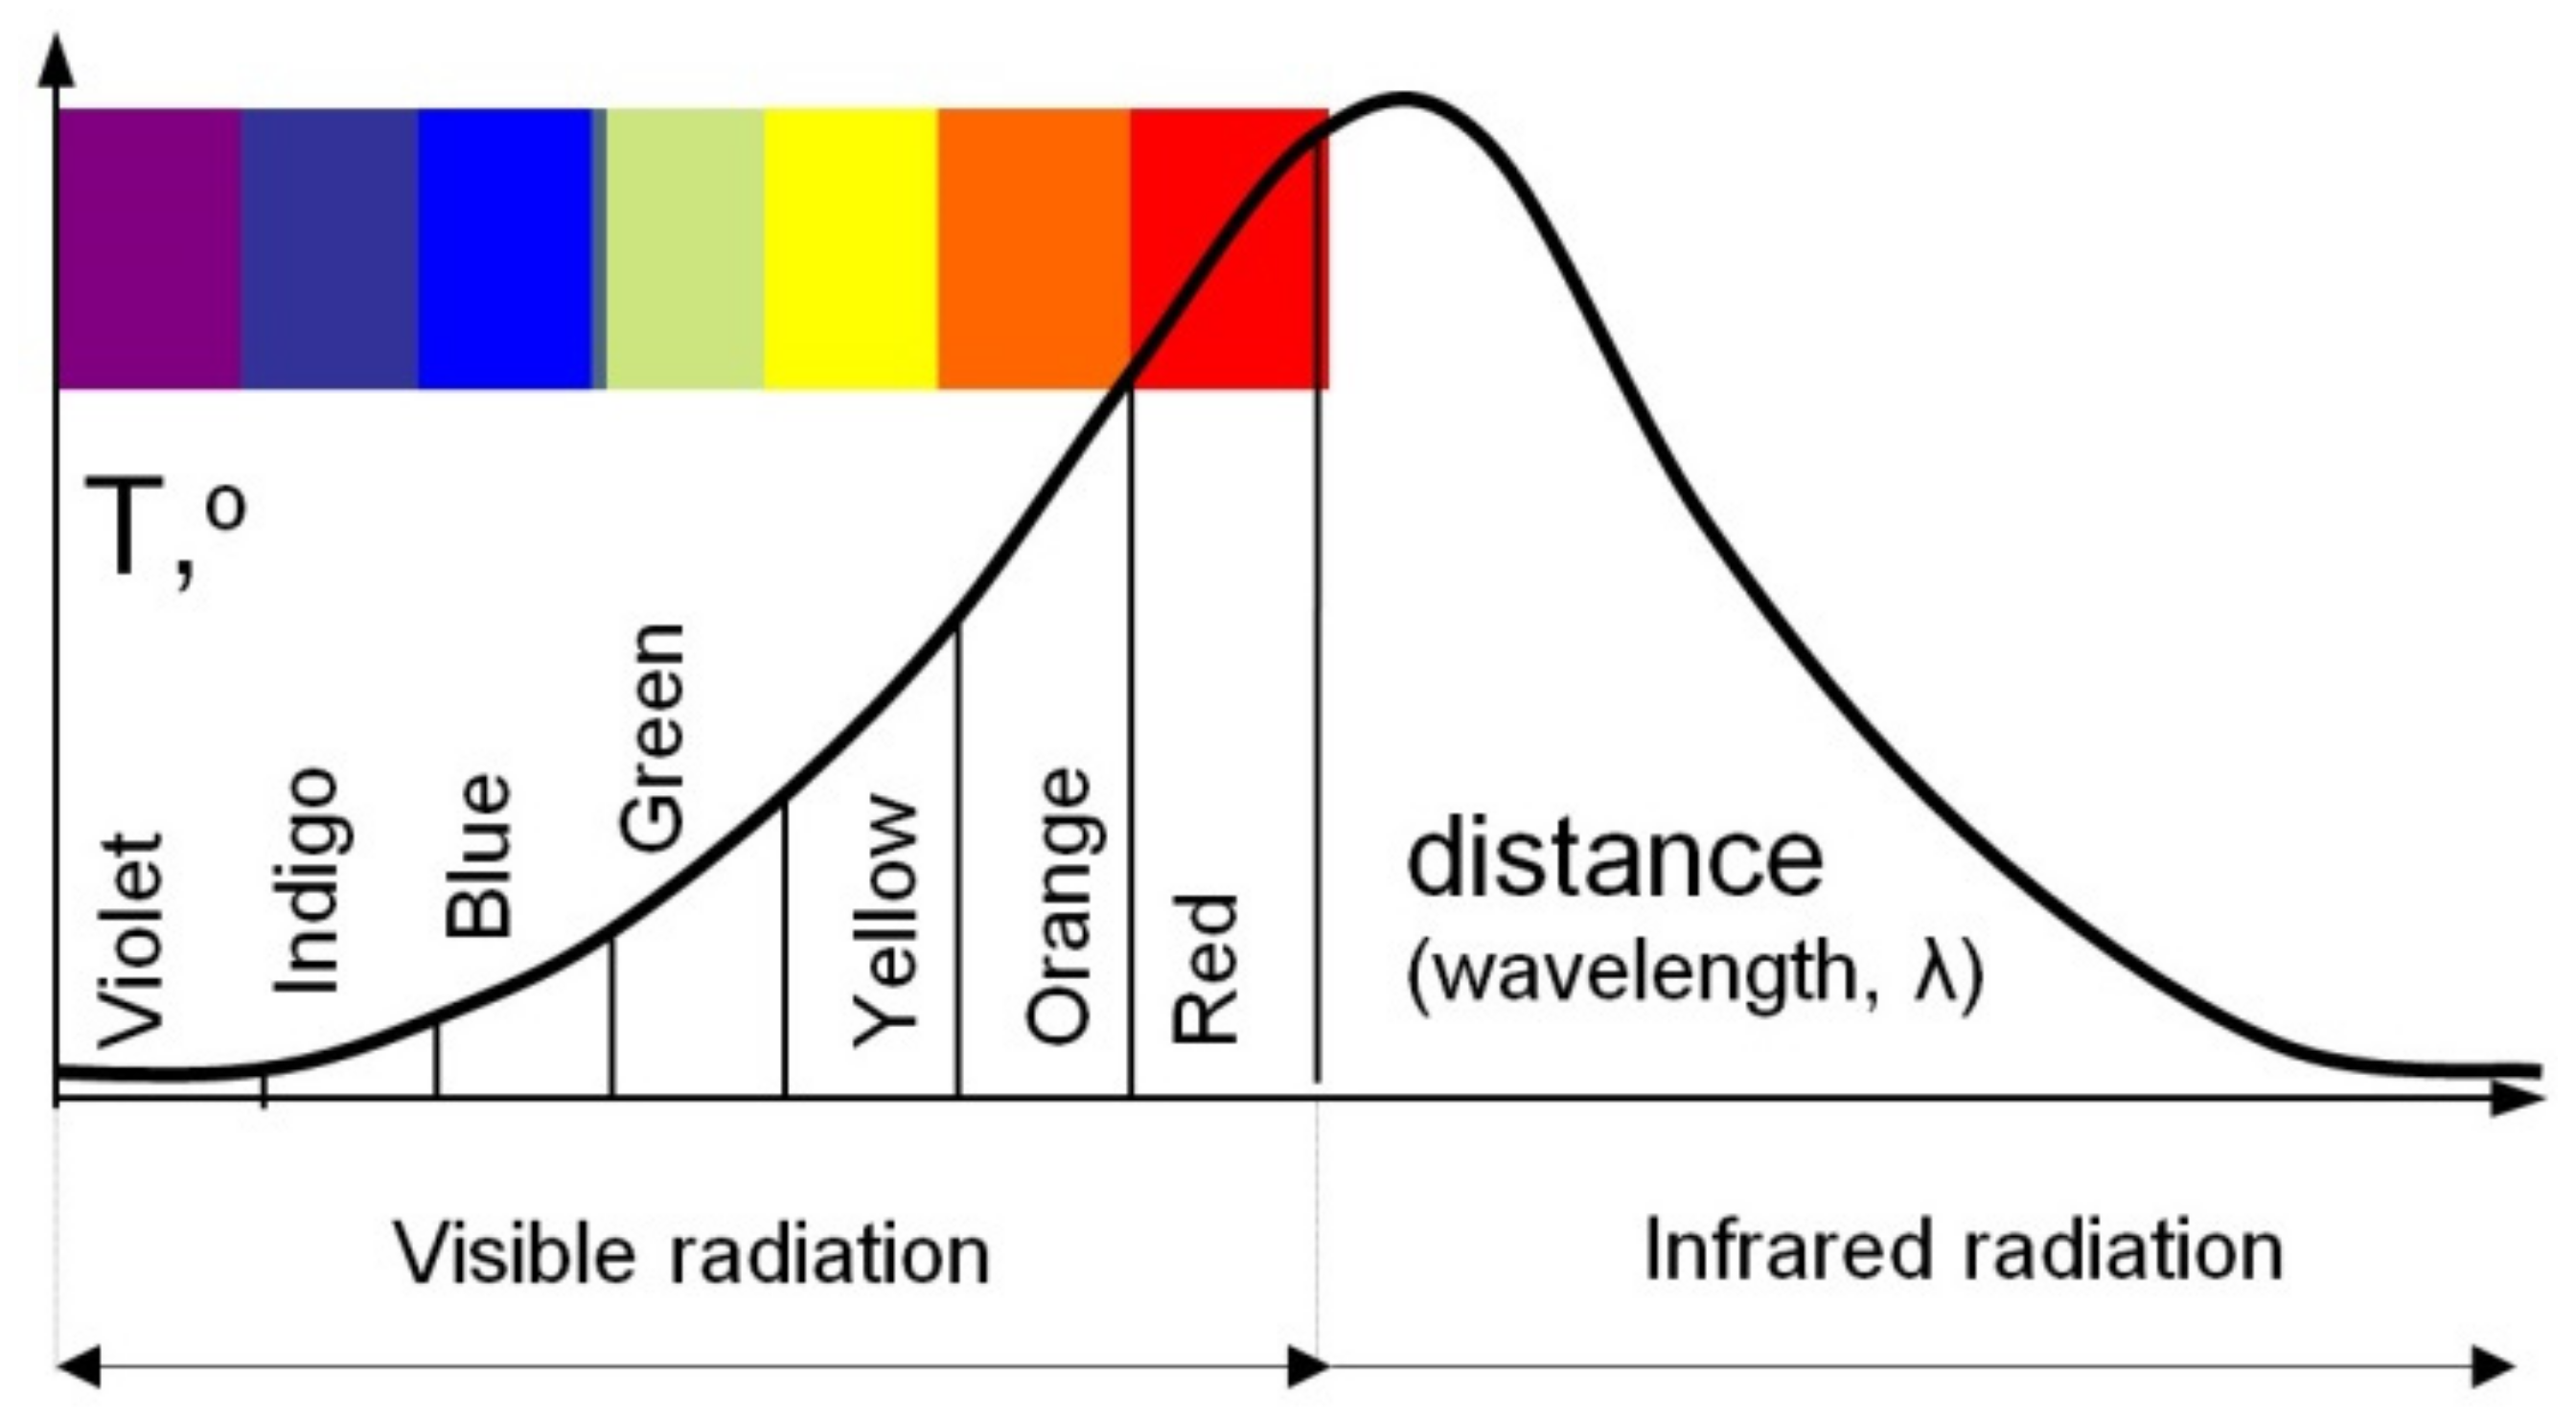
8]. He observed the thermal effects of radiation falling into particular ranges of the solar spectrum. Along the spectrum (1), obtained by splitting solar radiation through a glass prism (2), he placed on a sliding table (3) blackened receptacles of sensitive mercury thermometers (4), which were radiation detectors. The energy of the incident radiation was absorbed by the blackened containers, and therefore, the thermometers placed in the spectrum indicated a temperature higher than the ambient temperature. The results of measurements of the temperature distribution along the spectrum of solar radiation (1) obtained from the experiment are presented in
Figure 2. Herschel noticed that the thermometers placed outside the red border of the visible spectrum indicated a greater increase in temperature than the thermometers placed in particular visible ranges of the spectrum. The experiment showed that the limits of the solar spectrum do not coincide with the visible limits and that the red region is directly connected with the region of radiation invisible to the naked eye, which undergoes less refraction in the prism. He used the name “invisible rays of the Sun”, “dark heat” or “invisible thermometrical spectrum” to describe this newly discovered radiation. A little later, it was called infrared radiation because its spectrum lay outside the red limit of the visible spectrum.
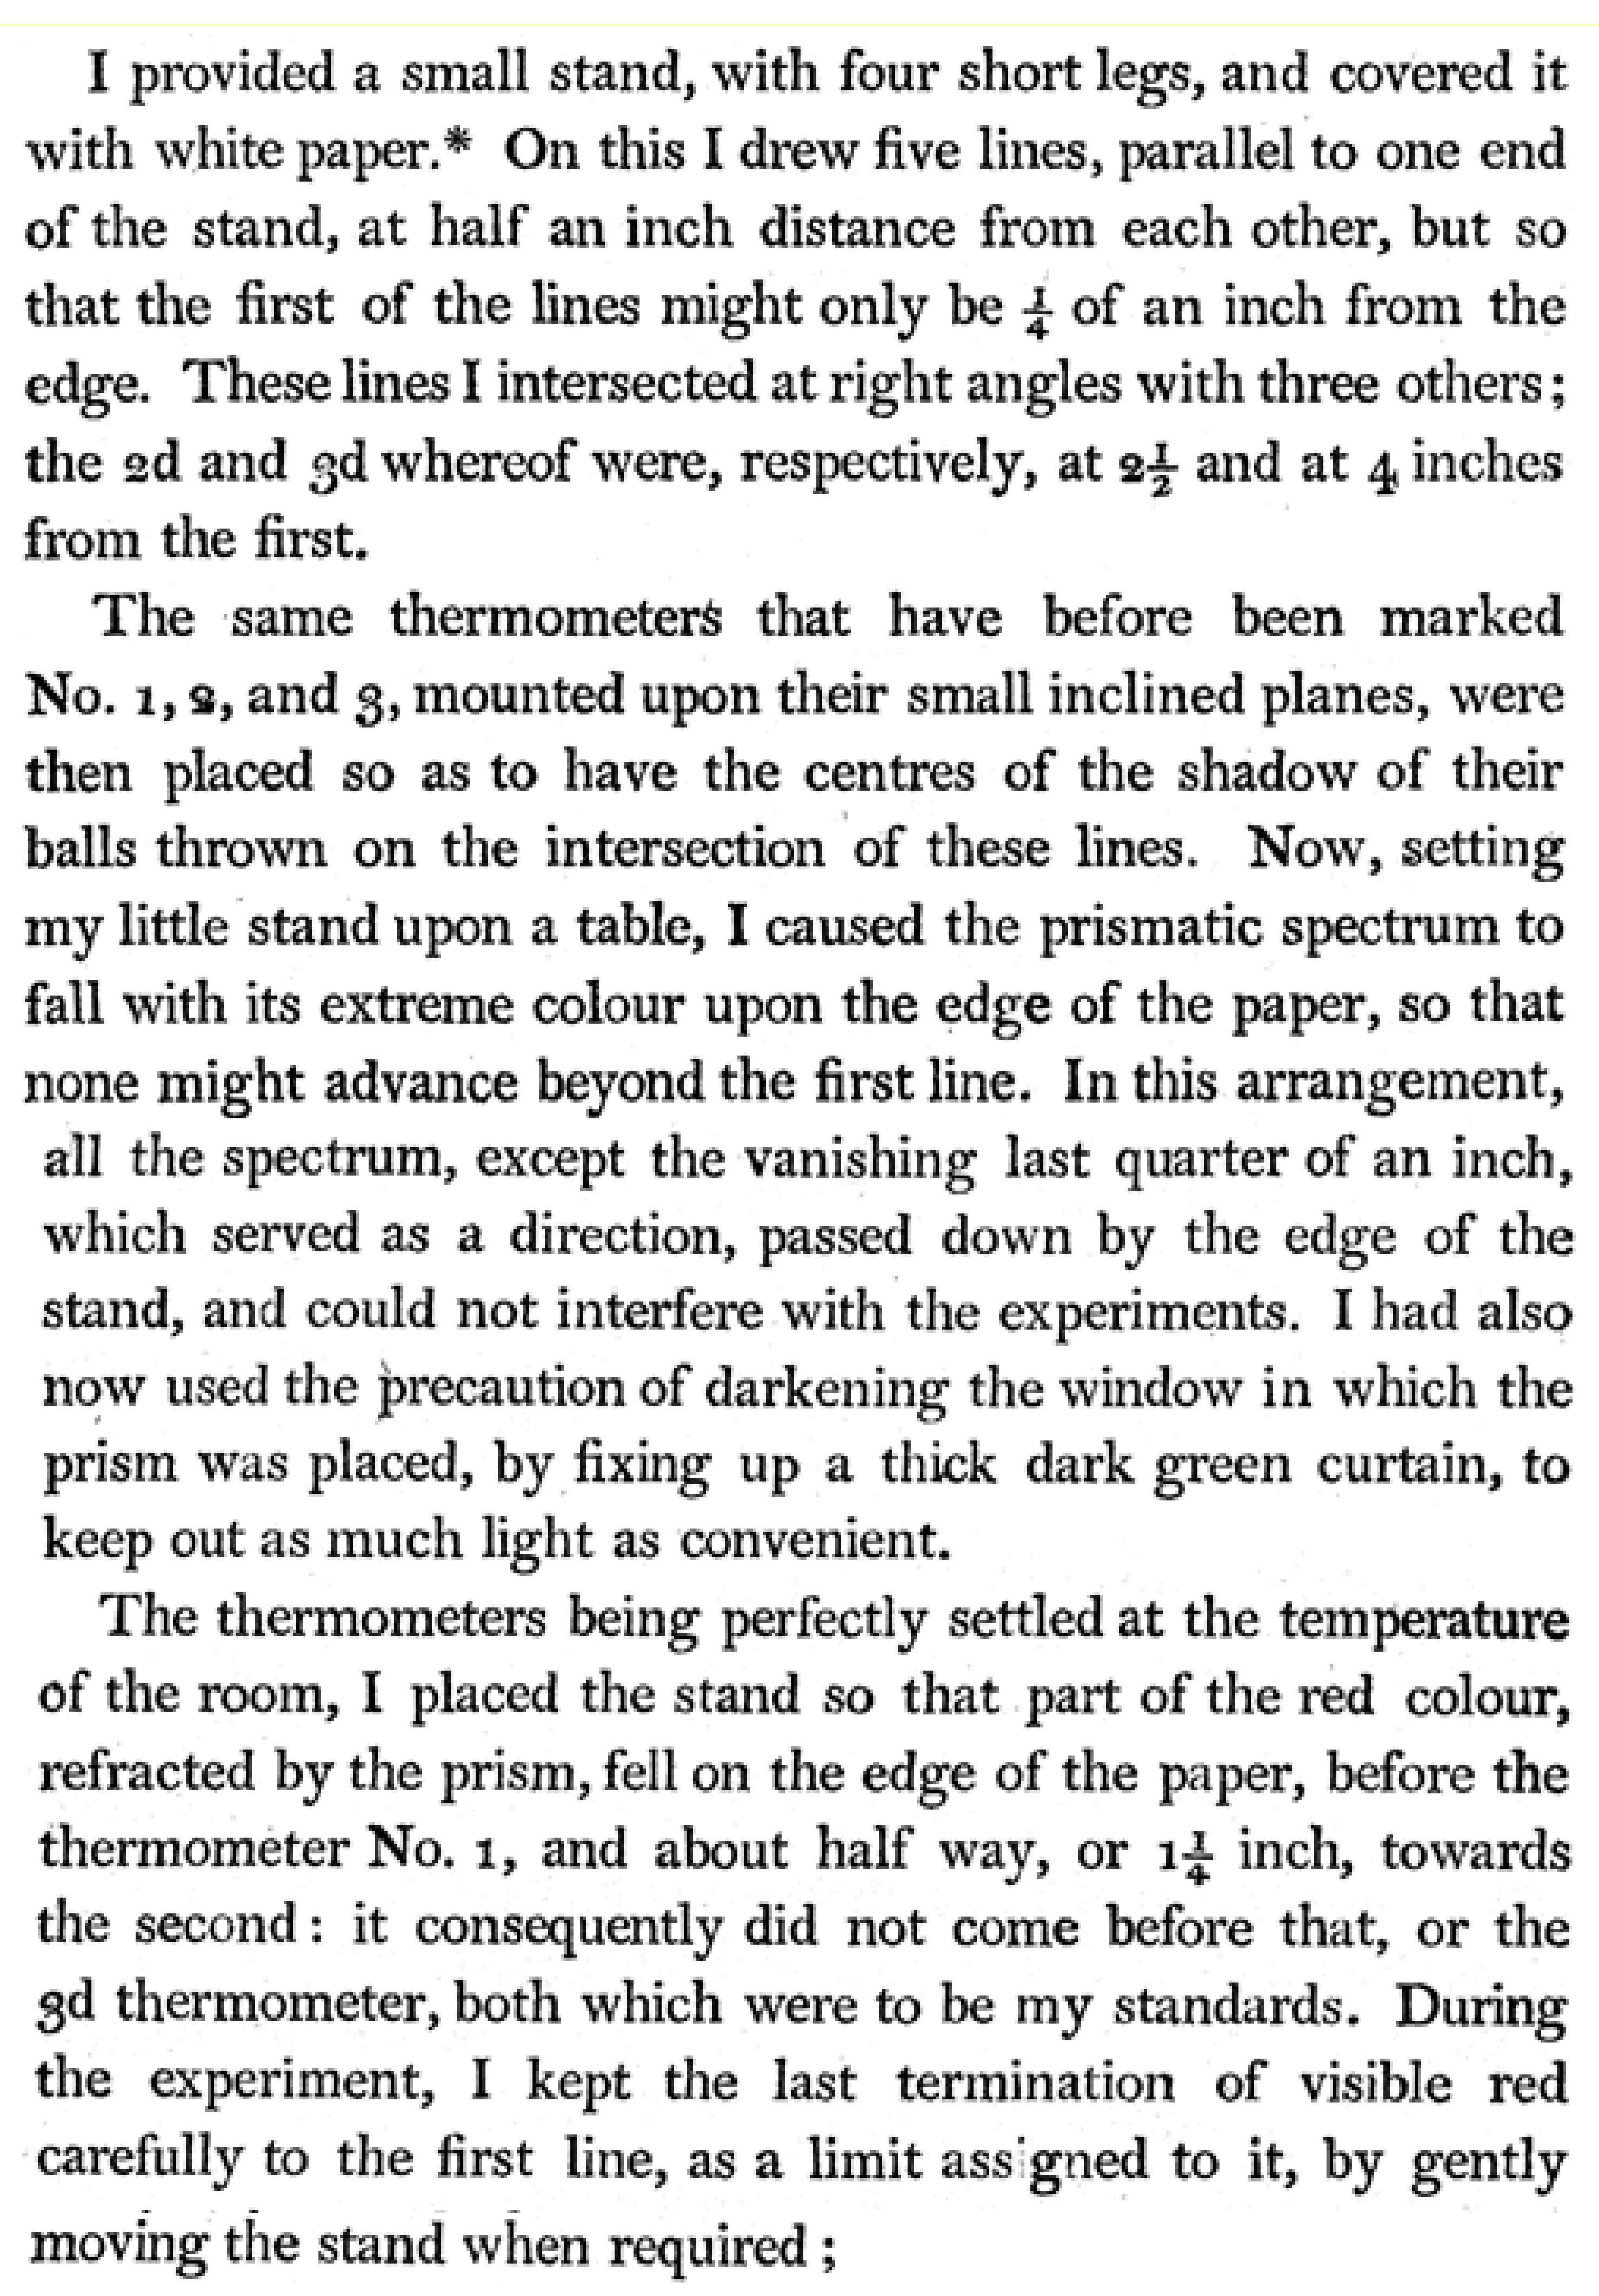
On 17 March 1800, Dr Herschel sent an article describing this phenomenon to the editors of the journal “Philosophical Transactions of the Royal Society of London” [
8]. It should be emphasised that Herschel was a metrologist who was the first to describe his experience concerning the discovery of infrared radiation with truly metrological care. On
Figure 3 are some original sentences, as Herschel described his experience, taken from his publication [
8]:
4. Other Experiments of F. W. Herschel Related to Infrared Radiation
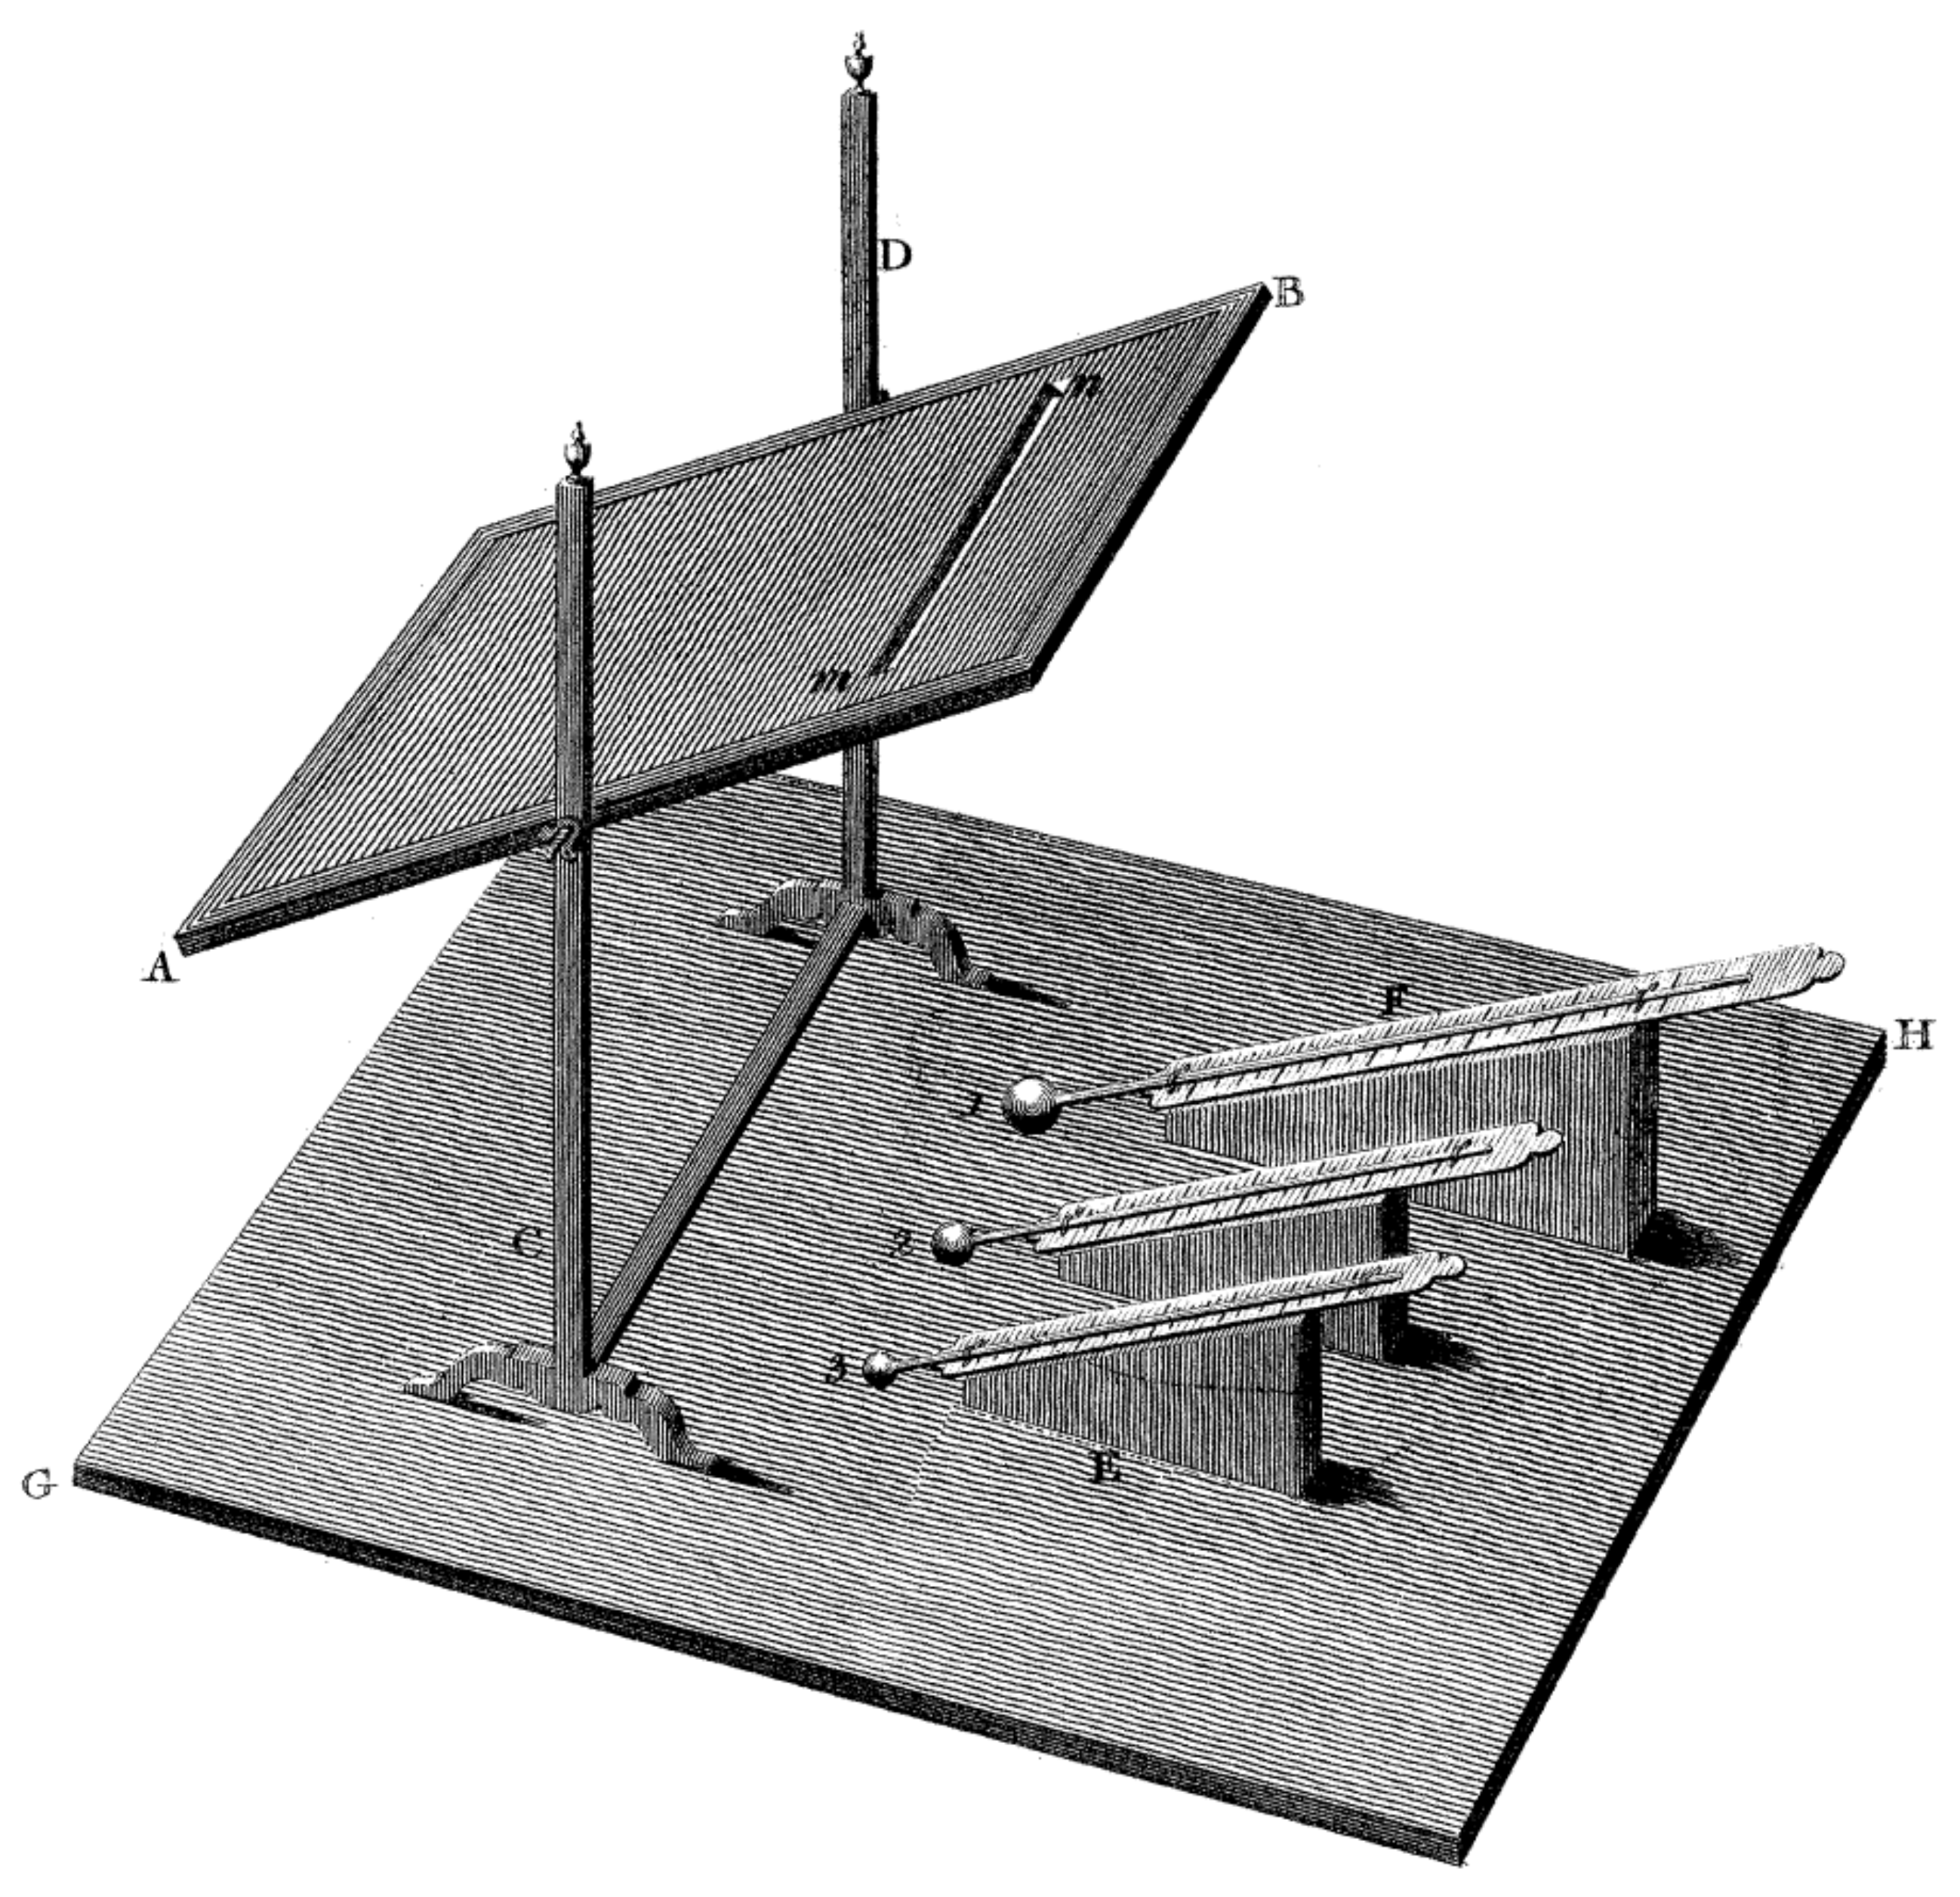
4.1. Investigation of the Value of Influence of Individual Colours of Split Sunlight on the Heating of Objects
Another problem that William Herschel addressed was the effect of different colours of the rays of the light spectrum on the ability to heat and illuminate objects. To this end, he carried out a number of experiments with different coloured dimming glasses mounted in telescopes [
9]. He noticed that the use of some of them caused, apart from the different coloured image of the Sun seen through the optics of the telescope, a distinct feeling of heat, while others did not cause such an effect, transmitting only large amounts of light. This led him to theorise that the illumination and heat produced could be influenced by the colour of the Sun’s rays.
In order to dissipate his doubts concerning the nature of the observed phenomenon, William Herschel constructed the following measurement stand (
Figure 4). It consisted of a cardboard plate with an oblong hole cut out of a small width, placed on a tripod, three mercury thermometers with round tips (sensitive parts) painted black, placed on slanting stands. The whole was placed on a smooth board, for easier manoeuvring of the whole stand without moving the individual elements. Next, he placed a prism in the window and directed the resulting spectrum onto the table with the research apparatus, so that only one dispersed colour of the rays would pass through the hole cut in the cardboard plate, falling then on the sensitive parts of the thermometers.
The research confirmed the above thesis by saying that coloured rays created as a result of splitting by means of a prism differ in the heating power of the objects investigated, which were sensitive parts of mercury thermometers.
On the pages of his next, two-part article [
10,
11], he focused on confirming the existence of invisible heat rays, this time investigating their reflectivity, focusing, refraction and permeability.
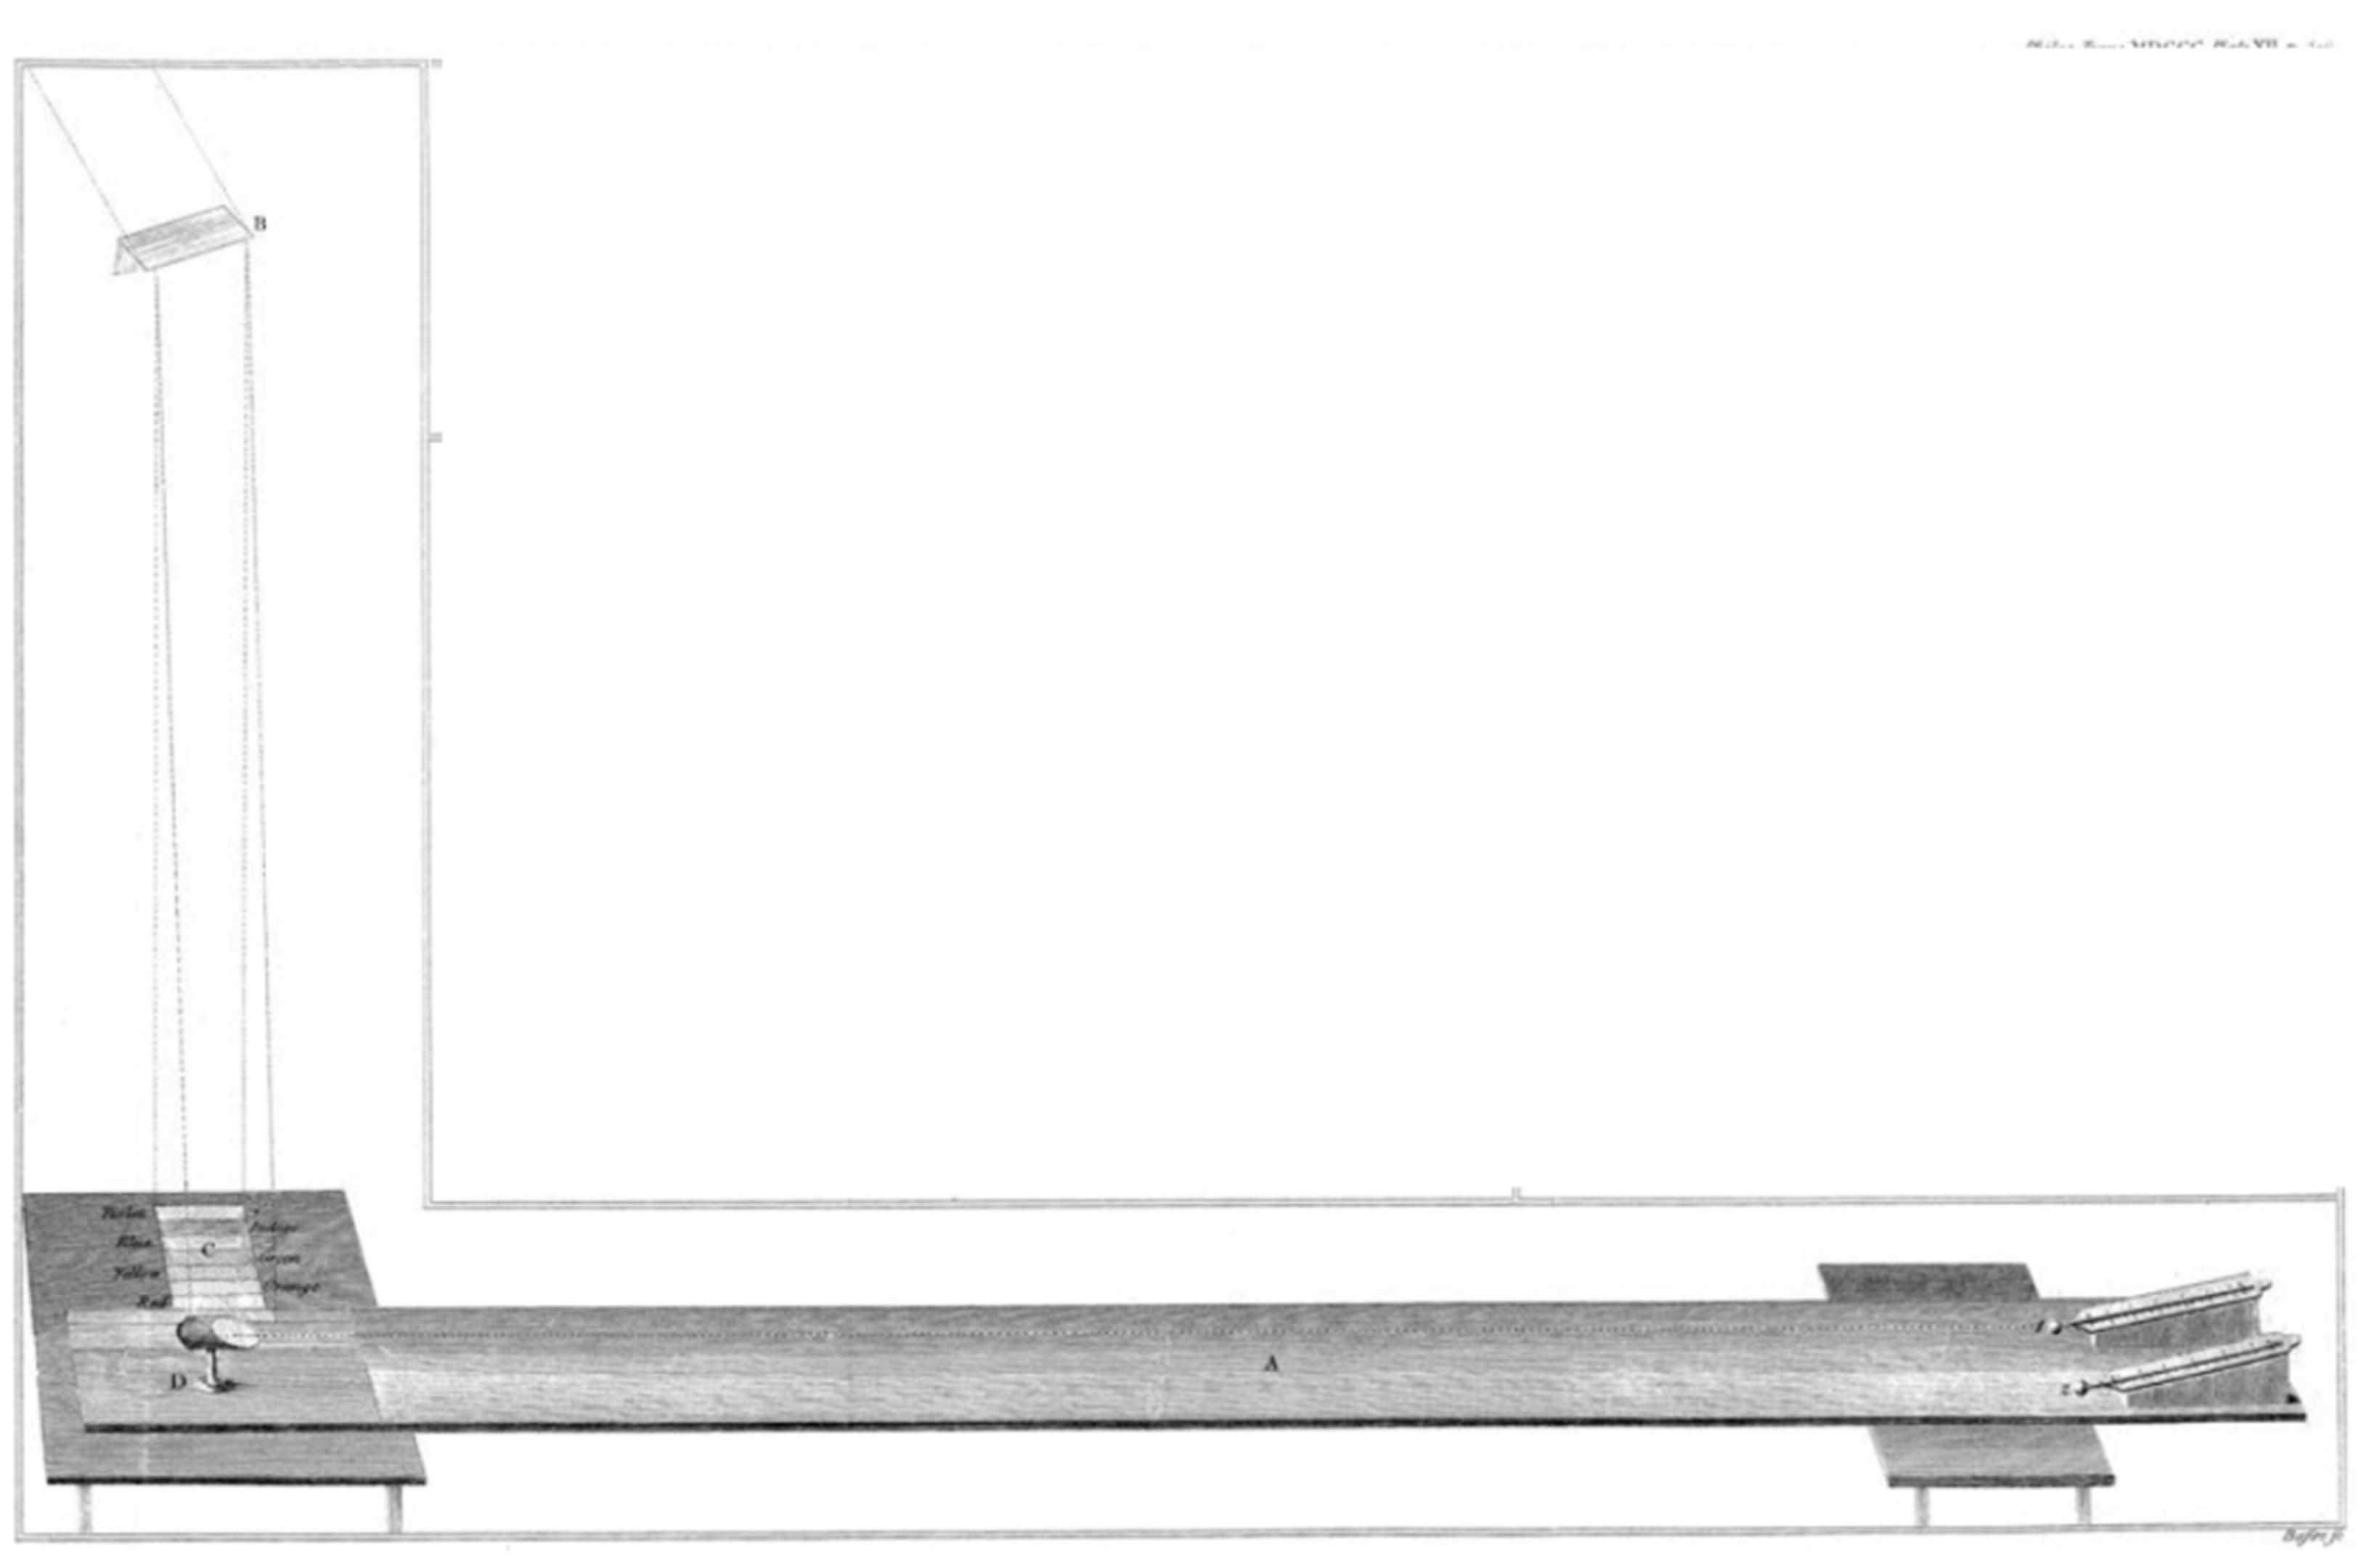
4.2. Investigation of the Phenomenon of Reflection of Infrared Radiation
In order to carry out an experiment showing the phenomenon of reflection of infrared radiation, William Herschel used a Table 4 feet 6 inches long, i.e., about 1.4 metres (
Figure 5). On this table, he marked the colours of the split solar radiation. At one end of it, he placed two thermometers, while at the other end, he placed a flat mirror, used in telescopes. The distance between the thermometers and the mirror was 3 feet and 9.75 inches (1 metre), except that the sunlight reflected from the mirror fell only on the first thermometer, while the second was moved aside, outside the area of the reflected rays. The solar spectrum split by the prism fell directly on a white sheet of paper over which the mirror was placed.
In this experiment, Herschel proved the existence of invisible heat-producing rays (infrared rays) and their susceptibility to the effect of reflection.
4.3. Investigation of the Phenomenon of Focusing of Infrared Radiation
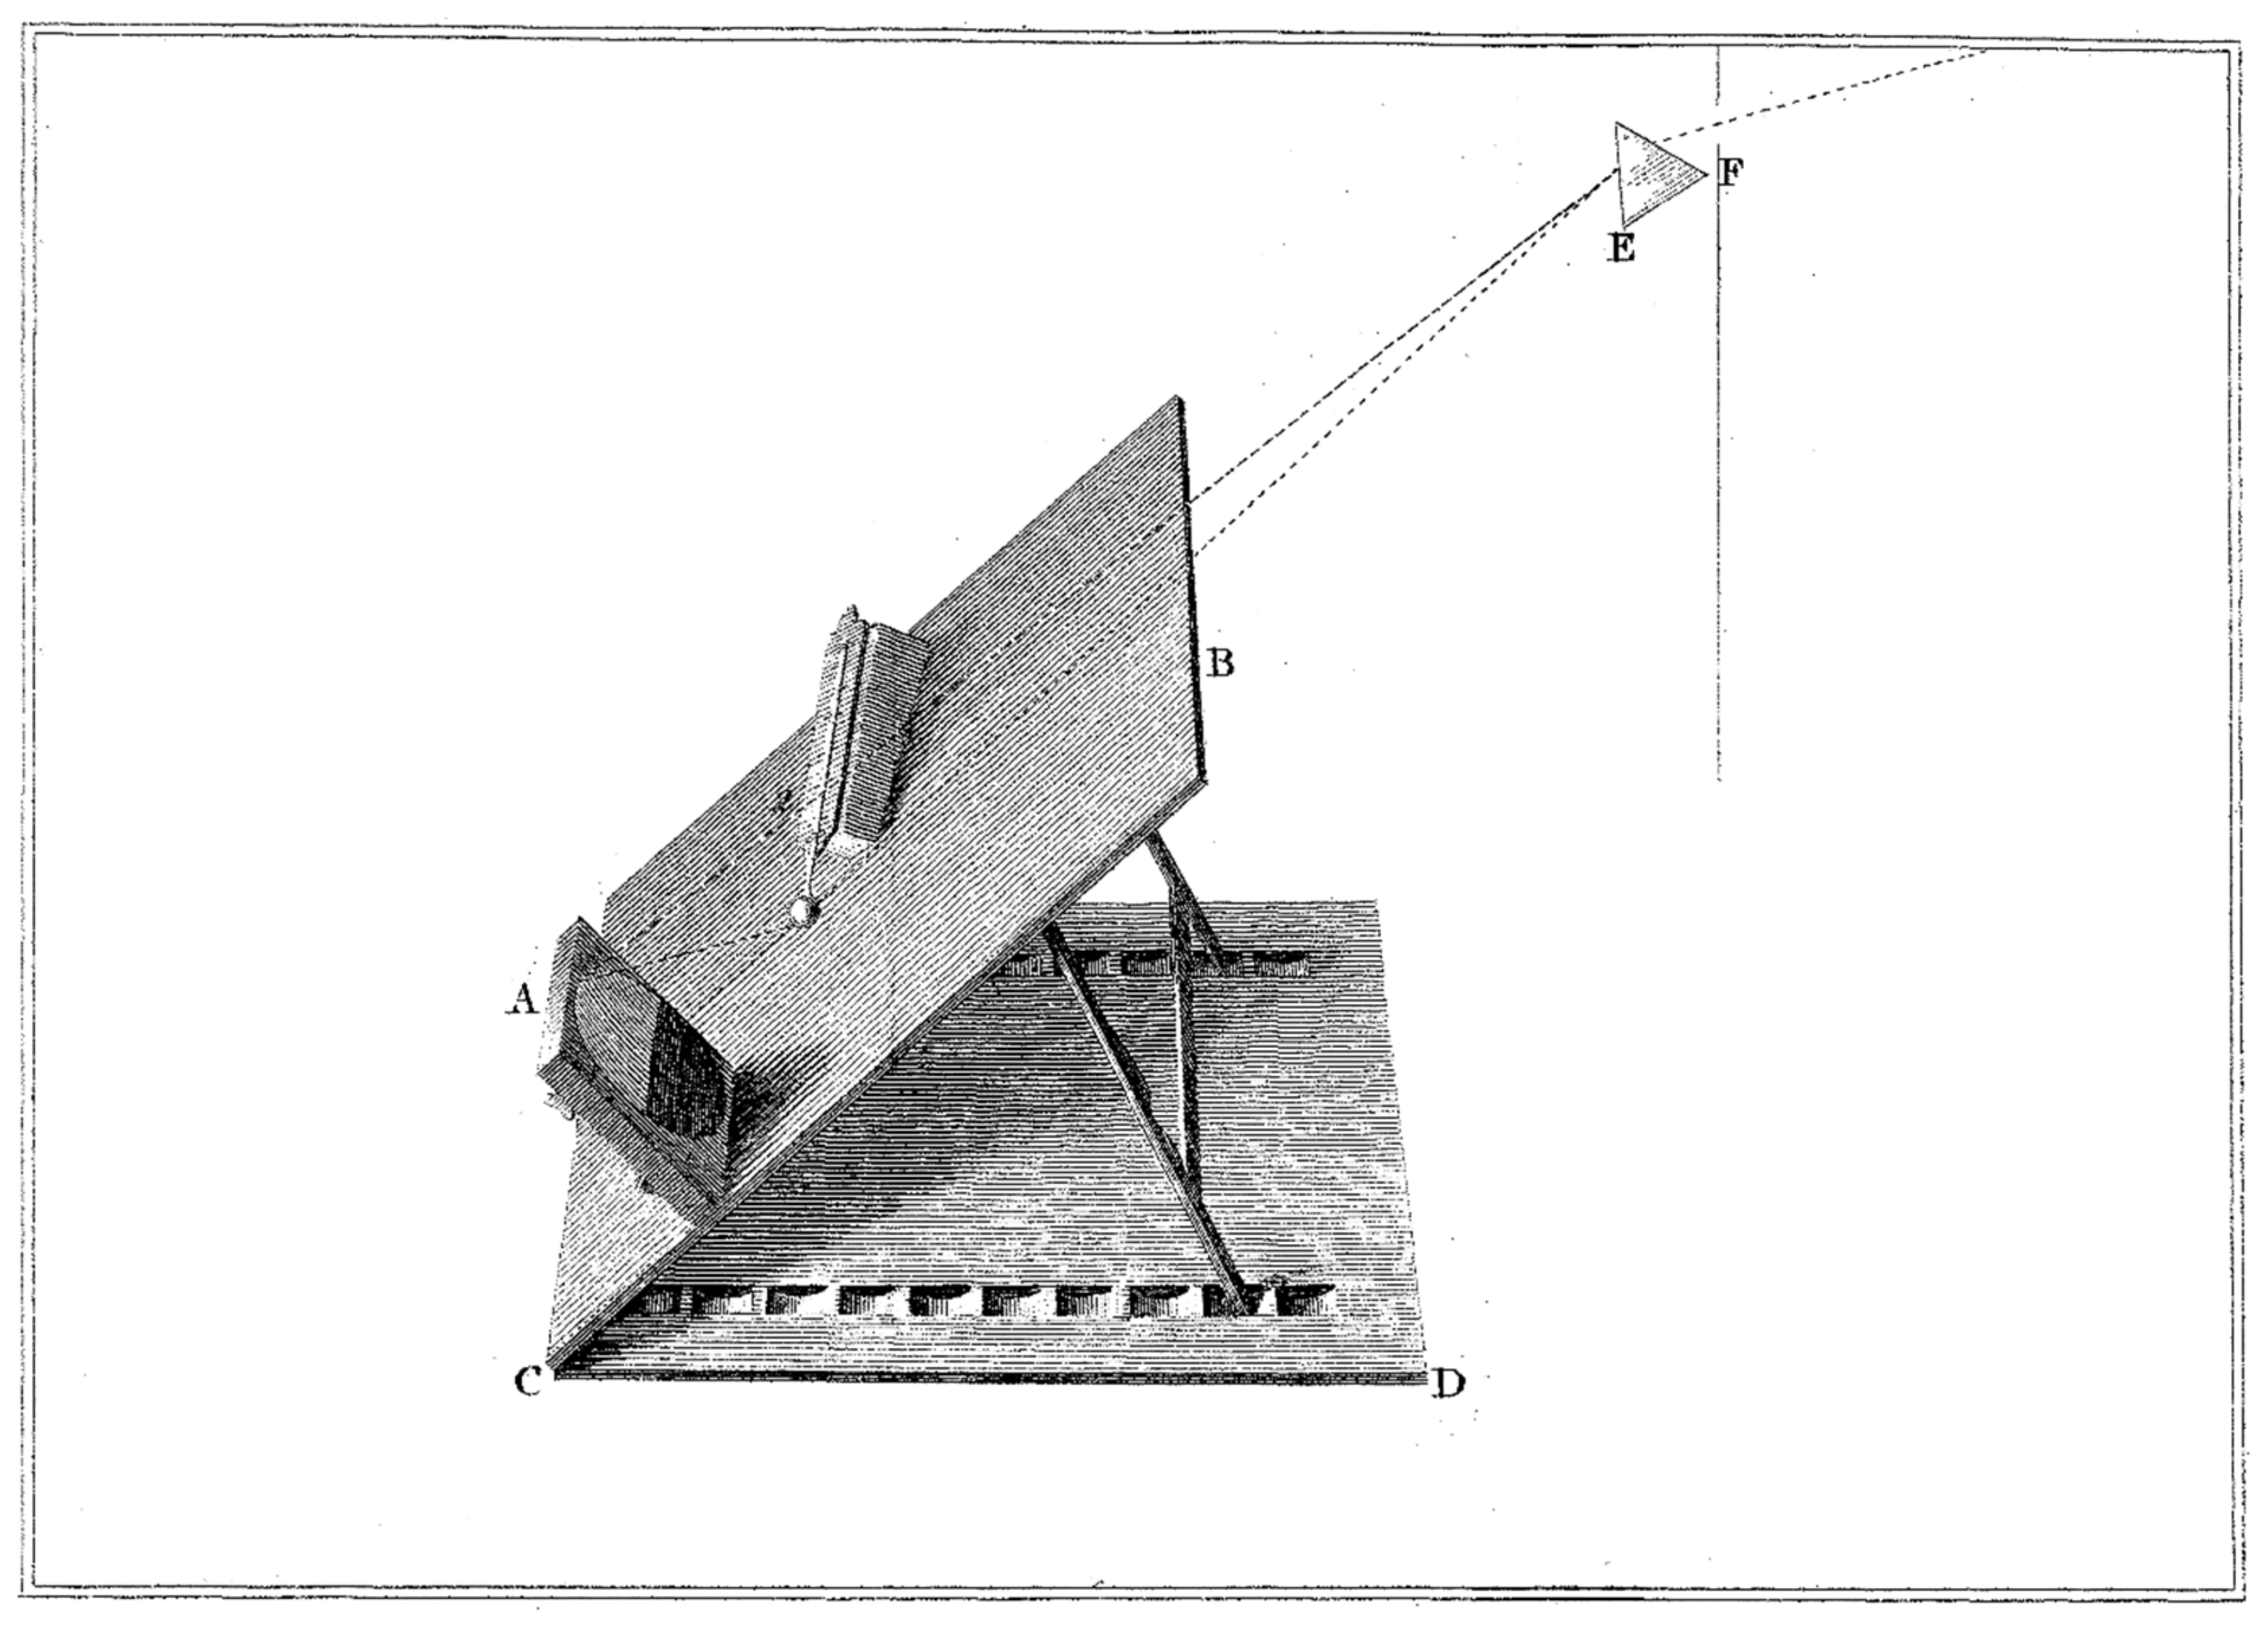
After proving his own conjectures on the possibility of the occurrence of reflection of infrared radiation, William Herschel in his next experiment decided to carry out an experiment confirming the possibility of focusing of invisible solar rays (infrared radiation). For this purpose, he made the following measuring stand (
Figure 6).
The measurement stand contains of an angle-adjustable stand, a small steel mirror positioned perpendicular to the incident sunlight split by a prism, half covered by cardboard limiting all visible sunlight feeding into it, and a thermometer, which was to receive the focused infrared rays reflected from the mirror. Lines perpendicular to the diameter were drawn on the cardboard covering the mirror, allowing the infrared rays to be accurately separated from the boundary-visible red rays of the split sunlight. After the thermometer reading had settled to the ambient temperature, Herschel exposed the half of the mirror used in the experiment to the scattered rays in such a way that the red rays were visible on the cardboard covering the other half of the mirror, 1/10 of an inch from its border.
By this experiment, Herschel confirmed the existence of invisible solar rays. He also proved the possibility of the reflection of these rays and, what was the subject of the experiment presented, their susceptibility to the phenomenon of focusing, which, in a short time, proportionately increases the heat energy created only by means of the invisible solar rays, i.e., infrared rays. In his experiment, he observed a temperature increase of 24° on the thermometer after two minutes of measurement.
4.4. Investigation of the Phenomenon of Refraction of Infrared Radiation
In the same article [
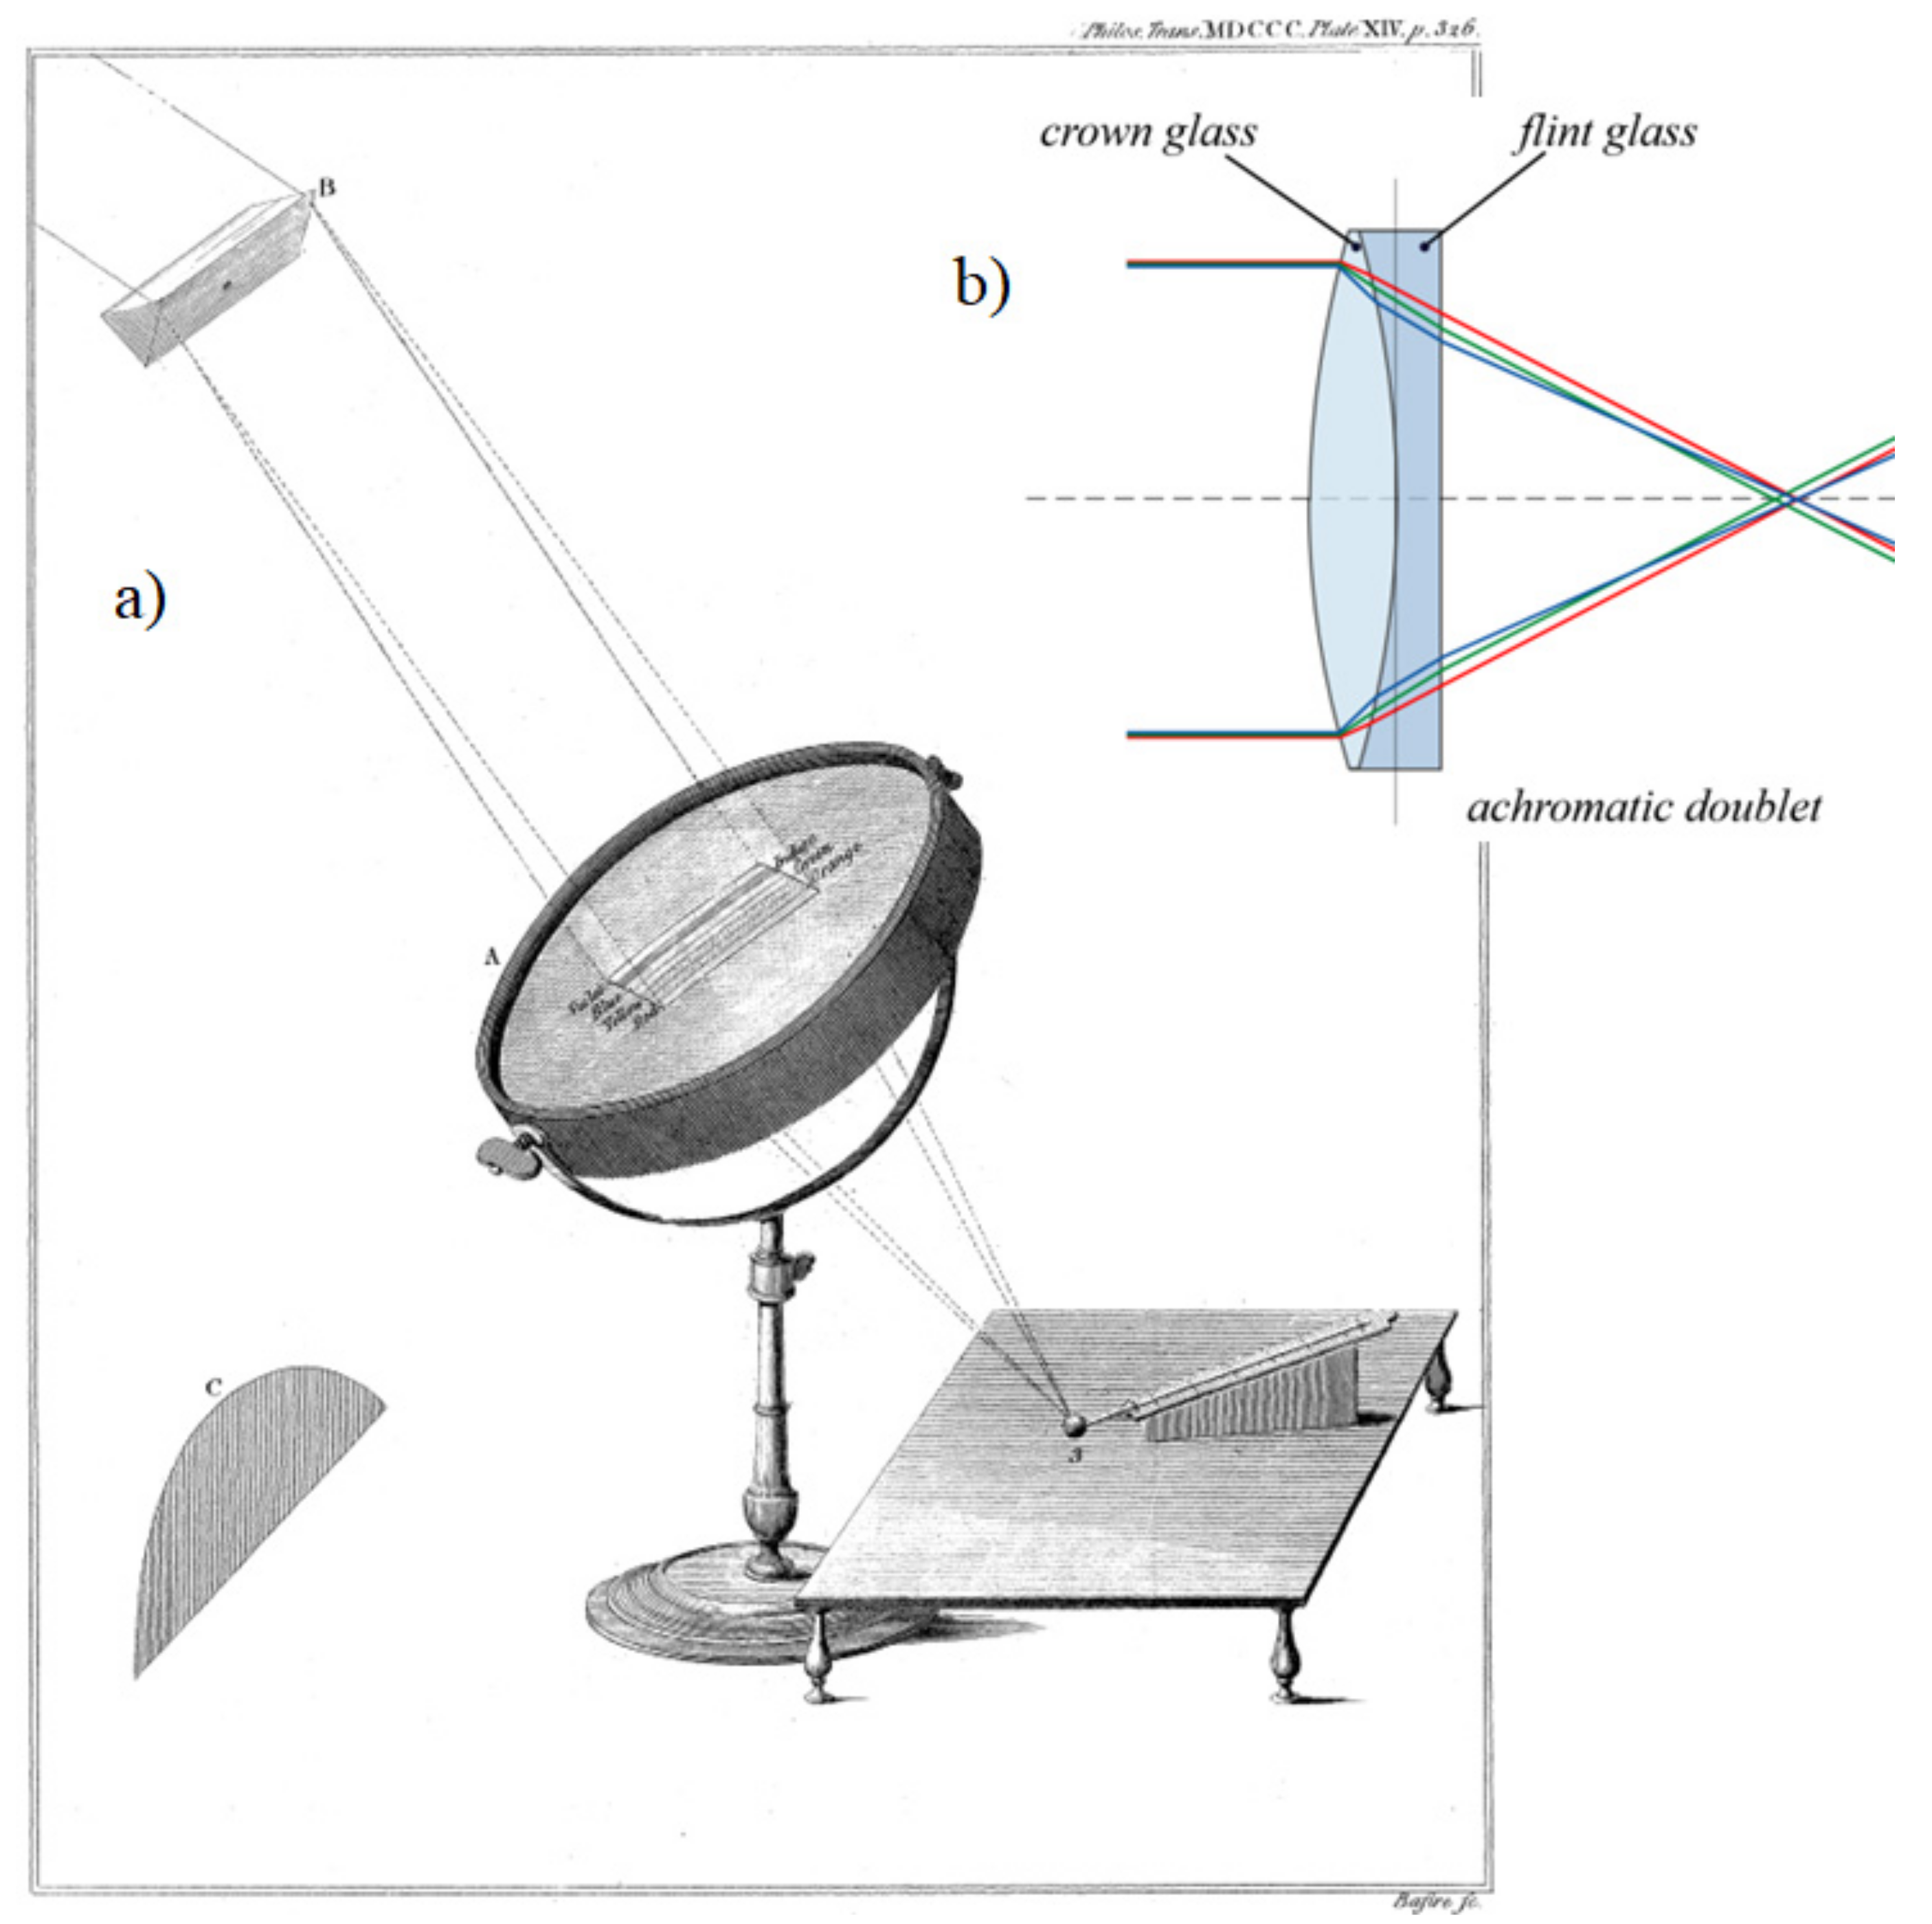
10], Herschel described his experiment proving the possibility of the phenomenon of infrared rays refraction. The measurement stand (
Figure 7a) this time was based mainly on the lens invented by the English optician John Dollond, called achromat (
Figure 7b). This is an optical system consisting of two lenses joined together, a focusing and a diffracting lens, made of glass species with different dispersion, such as krona and flint glass. An achromat is used to correct chromatic aberration (dispersion) for the light of two specific wavelengths.
Herschel marked the different colours of split sunlight on the lens (
Figure 7a). The experiment consisted in the fact that Herschel half covered the lens of the achromat with a cardboard aperture (in
Figure 7a, he marked it with the letter C) in the shape of a semicircle, on which the sunlight scattered by the prism fell. The last red rays were seen 1/10 inch from the border of the cardboard aperture. He temporarily used the focused red rays to determine the location of the measuring thermometer on the other side of the lens. He additionally placed reference thermometer No. 2, not marked in
Figure 7a, near measuring thermometer No. 1.
The reference thermometer placed near the focus of the rays did not record any temperature variation, while the measuring thermometer increased its readings by 45°. The measurement results confirmed the possibility of focusing and refraction of infrared rays.
4.5. Investigation of the Phenomenon of Transmission of Infrared Radiation
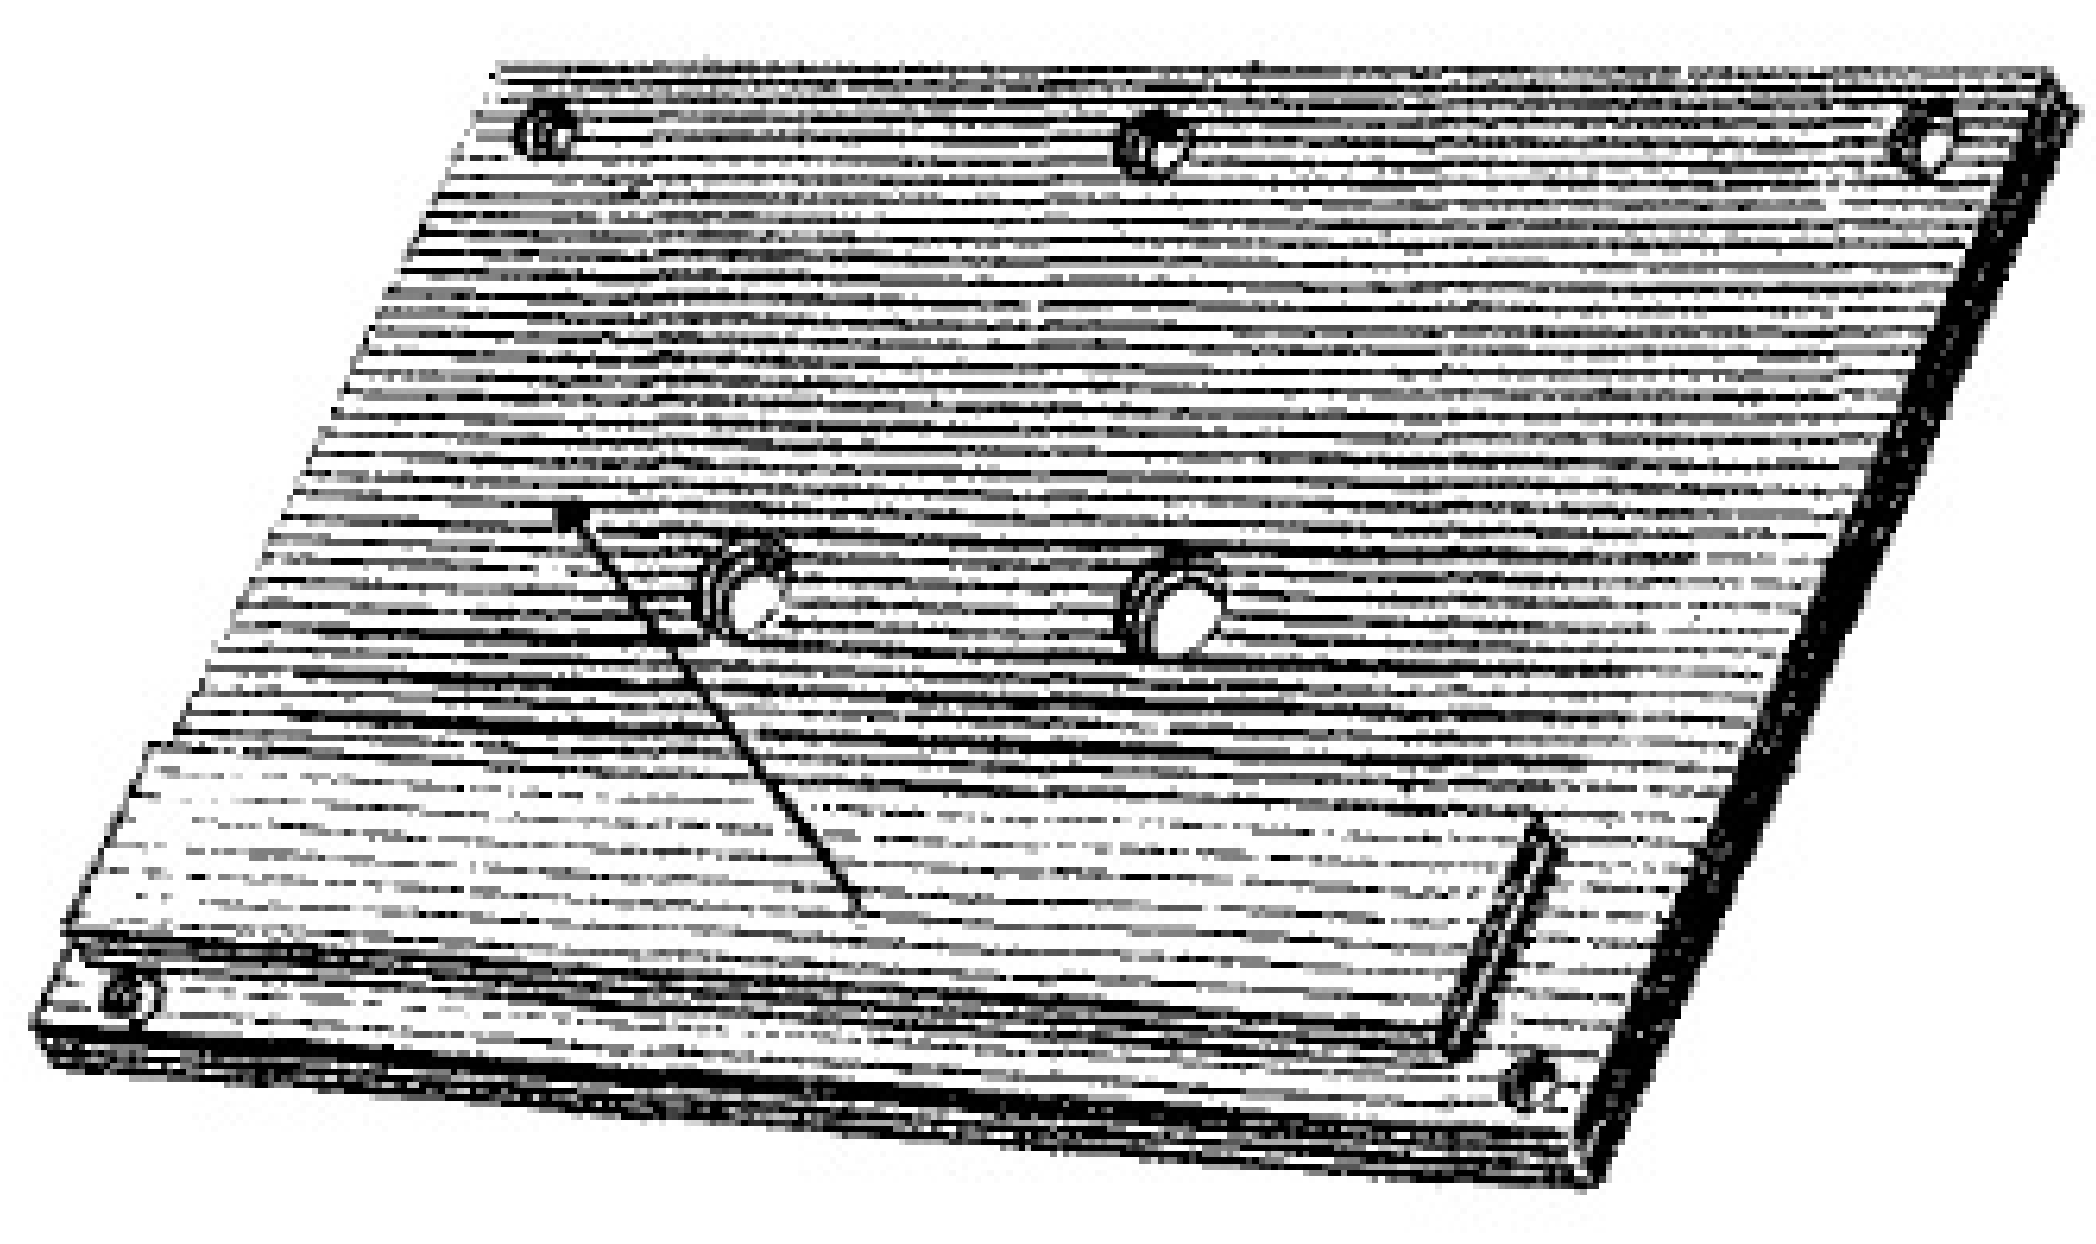
In the article [
12], which was the second part of the article [
10], Herschel, in turn, investigated the possibility of transmission of infrared rays through various types of materials. For this purpose, he made a plate with holes through which infrared rays fell on substituted thermometers, either directly or after passing through the tested material (
Figure 8).
In this experiment, Herschel confirmed transmission of infrared rays through the following materials, which were available to him at that time. These were different coloured glass: white, silicon, dark red, orange, yellow, light green, dark green, blue-green, light blue, dark blue, purple, violet, indigo, light indigo, corona and calcined talc [
12,
13].
5. Interesting Facts
The whole of his works, Herschel with truly metrological care and diligence published on over 500 pages in the journal “Philosophical Transactions of The Royal Society of London for the Year MDCCC”, published in 1800 in three volumes. The journal was, then, a publication of the then British Academy of Sciences and was of a quatrain. In these publications, he described about 50 different measurement stands he built to study the properties of infrared radiation. This article contains only a small part of the description of his very carefully conducted experiments.
It is interesting to note that in his articles he did not name the temperature scale he used. At that time there were 6 different types of thermometric scales in use. The most commonly used were the Fahrenheit scale (invented in 1724, °F) and the Celsius scale (invented in 1742, °C). There were also the Newtonian (invented in 1700, °N), Rømer (invented in 1701, °Rø), Réaumur (invented in 1731, °Ré) and Delisle (invented in 1732, °D) scales. The relationships that exist between these scales, together with the Kelvin (invented in 1848, K) and Rankine (invented in 1859, °R) scales created at a later date, are shown in
Figure 9 [
14].
The Celsius scale is part of the metric system of measurement established as an international standard of measurement in 1875 and became the official form of standardised measurement for most European countries and their colonies in the late 19th century. Because the Celsius scale was the primary temperature scale of the metric system, it became the official temperature scale for most of the world. The only countries that abstained from adopting it were English-speaking countries such as Britain, India and South Africa. In these countries, the Fahrenheit scale was used. It was not until the middle of the 20th century that English-speaking countries began to adopt the metric scale expressed in degrees Celsius. Currently, only three countries use the Fahrenheit scale. These are the United States, Liberia and Burma.
Considering the above, it can be assumed with high probability that William Herschel used the Fahrenheit scale in his measurements. Additionally, the analysis of the shape of the curve, prepared by him, containing the distribution of the spectrum of visible light and thermal radiation (
Figure 10), indicates that the experiments were conducted at the end of February or the beginning of March. Therefore, the ambient temperatures measured by Herschel at about 50° may indicate that he used the Fahrenheit scale in which the equivalent of 50 °F is about 10 °C (
Figure 9) [
14].
It should be noted, however, that it is not essential here what temperature scale Herschel used, since in all his experiments, he operated with temperature increments rather than absolute values of the temperature.
Planck’s law makes it possible to calculate the radiant intensity of blackbody
M(
λ,
T) for a given temperature
T and wavelength
λ:
where:
c1 = 2·π·h·c2 = (3.741832 ± 0.000020)∙10−16 W∙m2—the so-called first radiation constant,
c2 = h·c/k = (1.438786 ± 0.000045)·10−2 m∙K—the so-called second radiation constant.
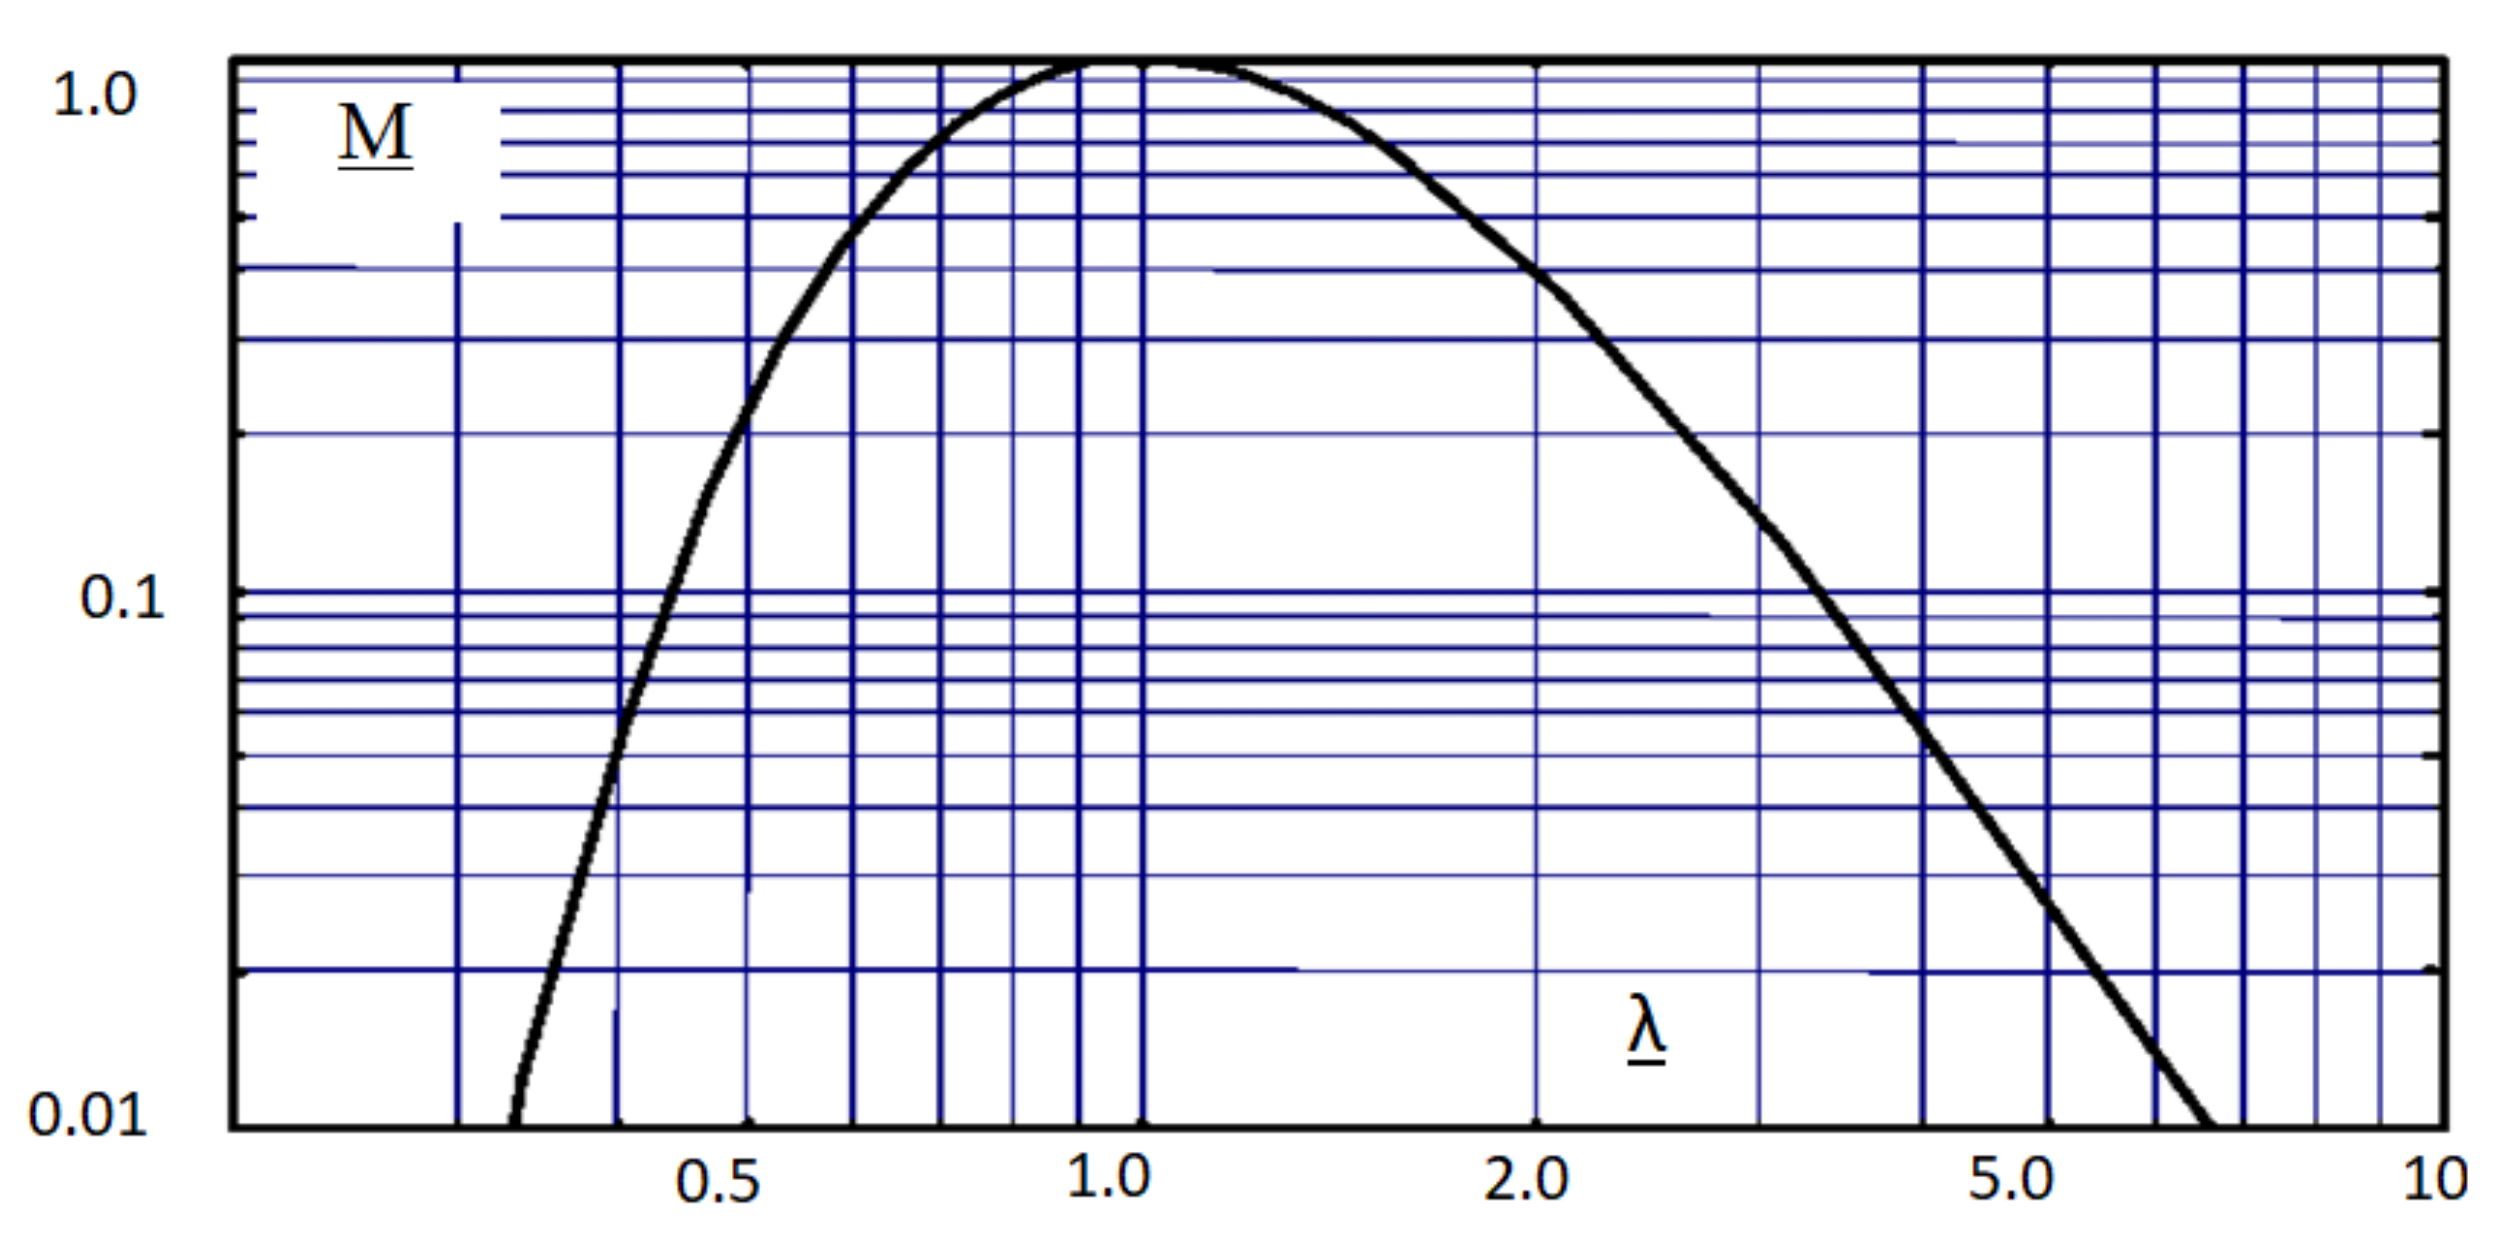
Sometimes, [
1,
15] another generalized graphical interpretation of Planck’s law is found (
Figure 11), given in relative units:
M = f(λ), where:
M =
M(
λ,
T)/
Mmax and
λ =
λ/
λmax. This interpretation is universal and independent on the blackbody temperature
T value.
It can be seen that the shape of the characteristic in
Figure 10 (
Figure 2 too) is similar to the shape of the characteristic obtained from the transformed form of Planck’s law given in
Figure 11. In
Figure 10, Herschel plotted temperature
T on the ordinate axis and the colour of the split solar radiation on the abscissa axis. On the other hand, in
Figure 11, the ordinate axis shows the intensity of the radiation
M (which is a function of temperature
T), while the abscissa axis shows the wavelength of this radiation
λ, which is a function of the colour of the split solar radiation.
Such a statement could suggest that the shape of the Planck curve was first illustrated by Herschel. Differences in the shape of both these curves, among others, result from the fact that the Herschel characteristic (
Figure 10) was obtained in a real experiment with the use of real materials available at that time, whereas the characteristic illustrating Planck’s law (
Figure 11) is a theoretical characteristic resulting from a simulation analysis of Equation (1).
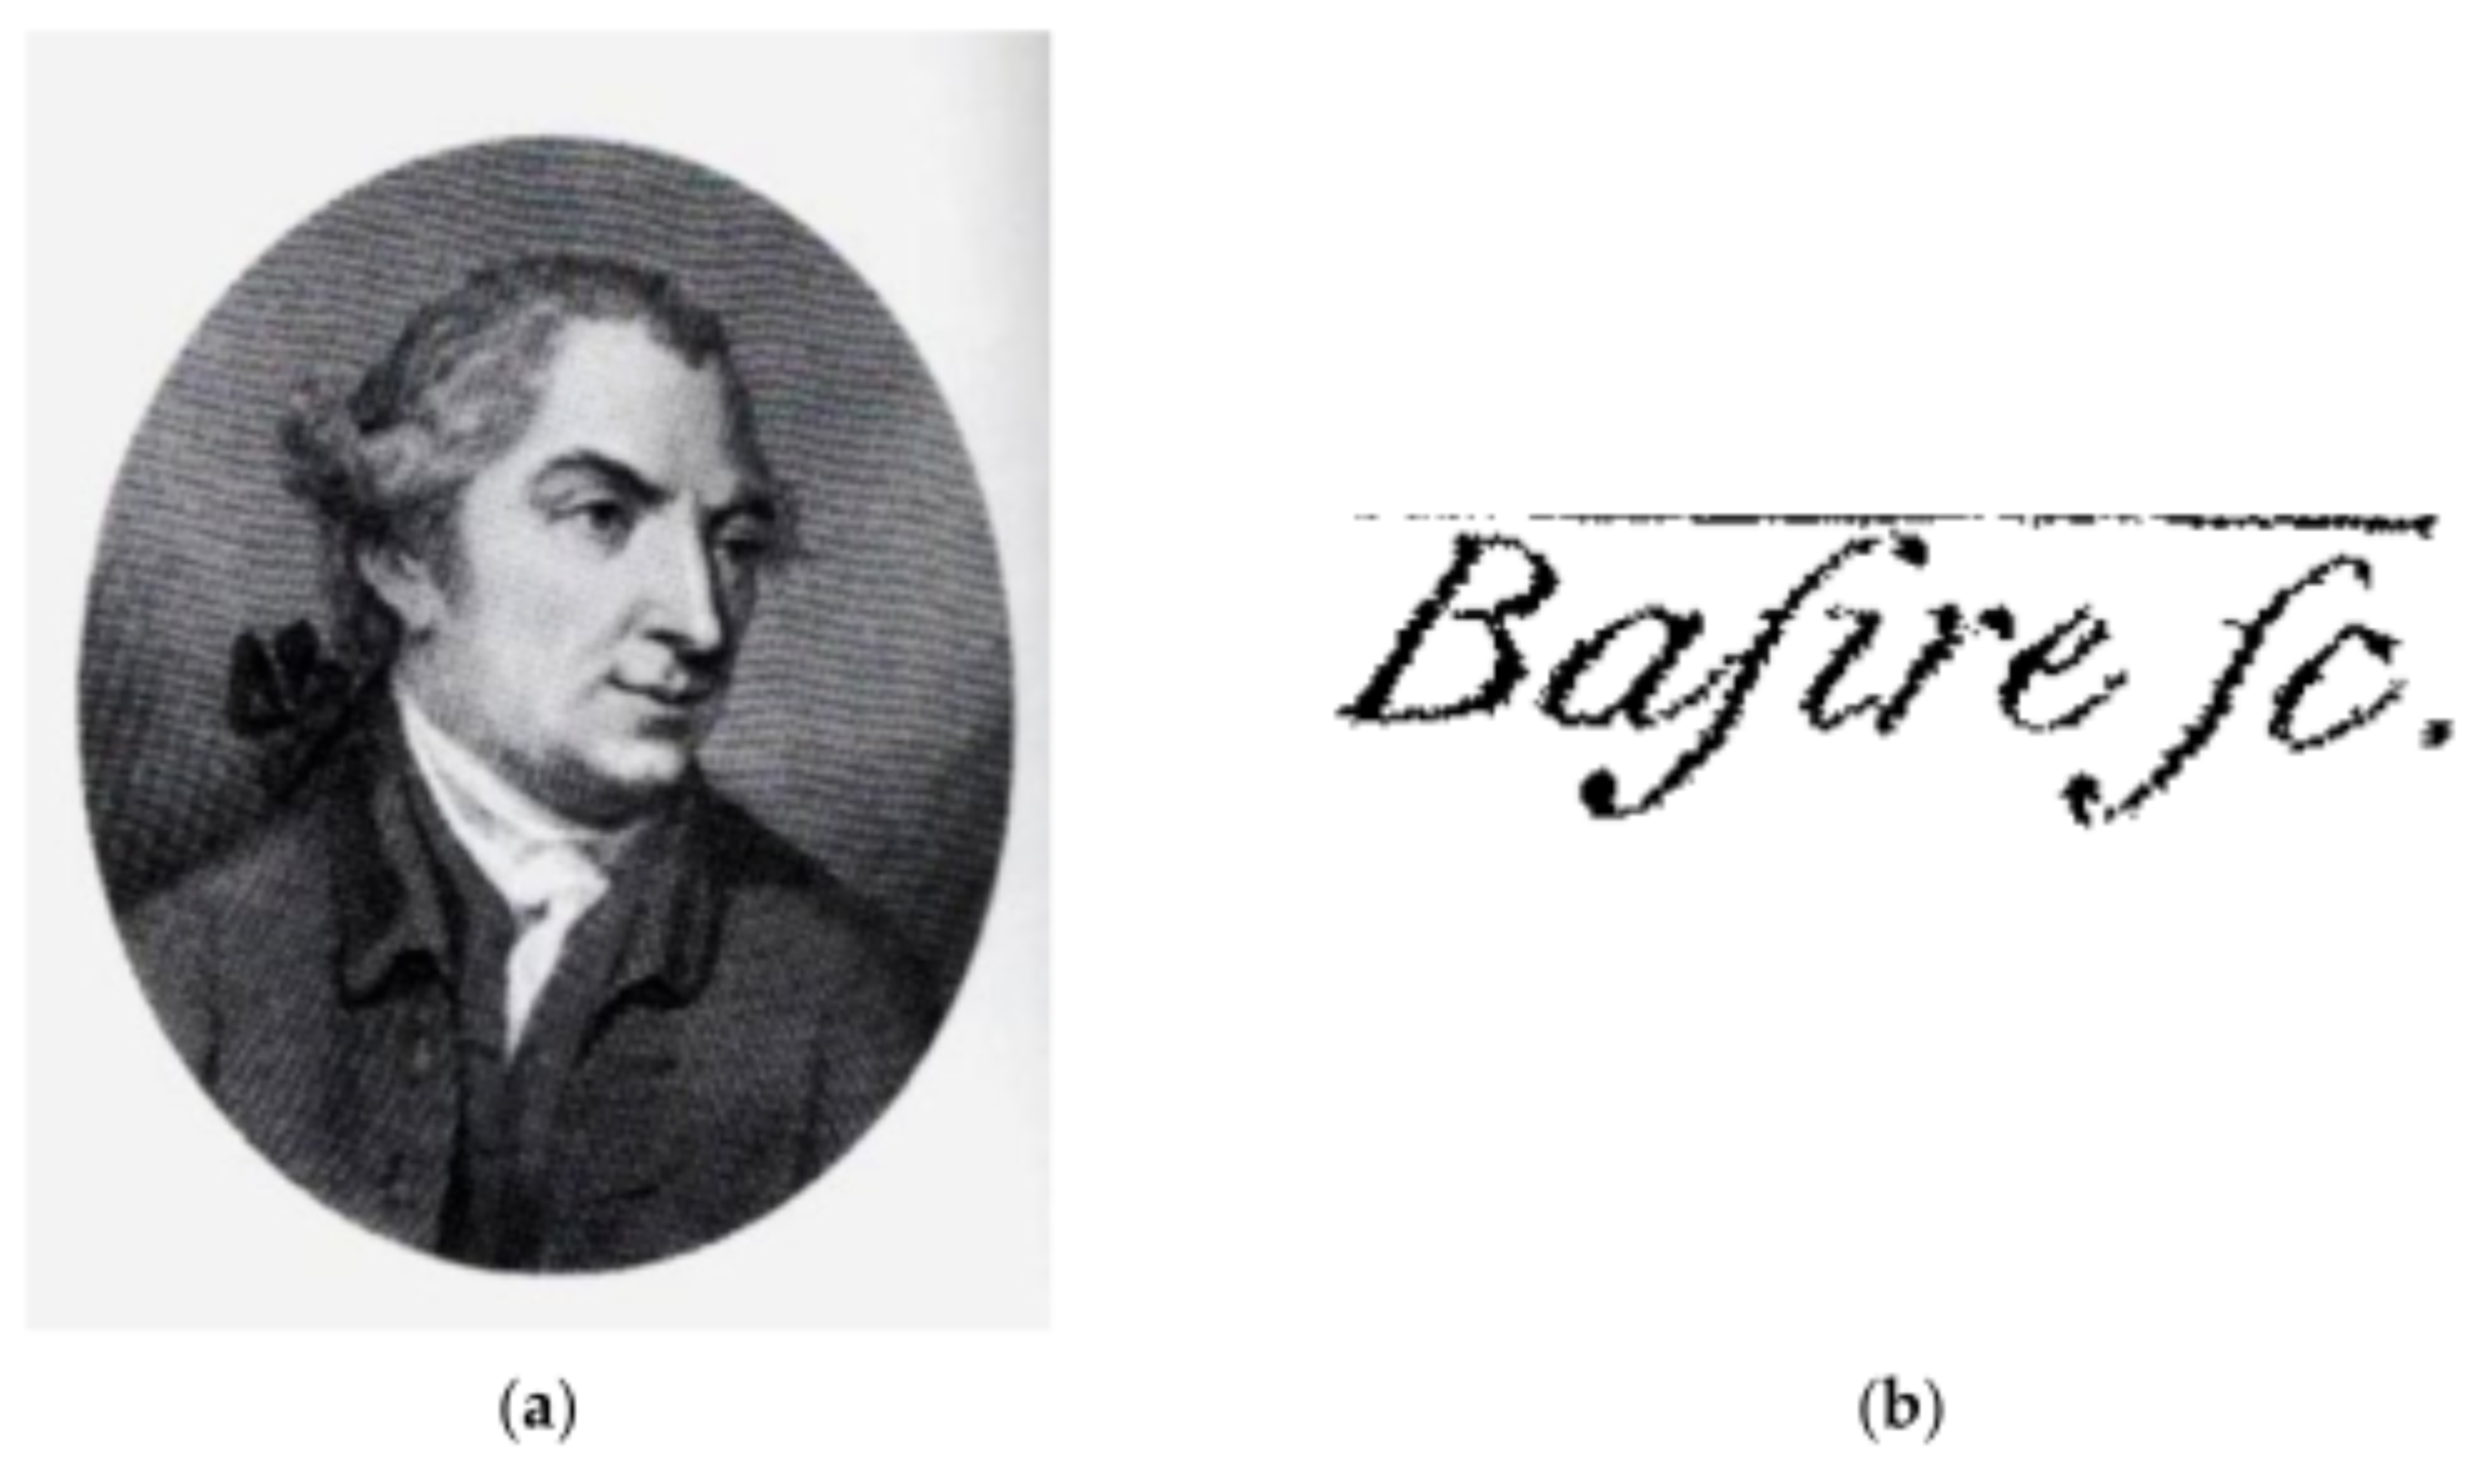
As a curiosity, it should also be said that in all these experiments of Herschel’s, his silent collaborator was the British engraver James Basire [b. 1730, d. 1802 in London] (
Figure 12), who made all the drawings, or rather engraved them, for his publications. He was also known as James Basire Sr. He was one of the most prominent engravers in the world at the time. As an interesting note, also engravers were his father Isaac, son James and grandson also James [
16].
6. Conclusions
Further experiments carried out by other researchers only confirmed that infrared radiation, just like visible radiation, is subject to the laws of reflection, refraction and absorption. Additionally, from the experiments on interference and polarisation of infrared radiation, it was clear that it has the same nature as visible radiation. Herschel investigated only a narrow range of the spectrum of infrared radiation, lying immediately beyond the red limit of visible radiation. The radiation in the further range of the spectrum was strongly absorbed by the glass prism used in the experiment, and therefore, the energy (relatively very weak) falling into this range could not be detected by such an imperfect radiation detector (mercury thermometer) as he used.
For a long time, infrared radiation was called thermal radiation because it was thought to have only a thermal effect. However, this is not correct, because the energy of visible radiation, ultraviolet radiation, X-rays or radio waves absorbed by a body is also converted into heat. Therefore, these types of radiation can also be called thermal.
An experiment similar to Herschel’s was conducted earlier, in 1777, by an Italian physicist Landriani [
3]. However, it was Herschel who first determined the point in which the thermal effect reaches its maximum and stated that measurements limited only to the visible range of the spectrum of radiation would not allow the location of this point. The well-known laws—the years in which they were promulgated are given in brackets—underlying modern pyrometry and infrared thermography were subsequently formulated by Gustav Robert Kirchhoff (1860), Josef Stefan (1879), Ludwig Eduard Boltzmann (1884), Heinrich Rudolf Hertz (1887), Wilhelm Karl Werner Wien (1896), Max Karl Ernst Ludwig Planck (1900) and Lord John William Strutt Rayleigh and Sir James Hopwood Jeans (1905).
The first so-called “heat-picture” became possible in 1840, the result of work by Sir John Herschel, son of the discoverer of the infrared and a famous astronomer in his own right. Based upon the differential evaporation of a thin film of oil when exposed to a heat pattern focused upon it, the thermal image could be seen by reflected light where the interference effects of the oil film made the image visible to the eye. Sir John also managed to obtain a primitive record of the thermal image on paper, which he called a “thermograph” [
3].


