
Analysis of Thermomechanical Stresses of a Photovoltaic Panel Using a Passive System of Cooling

 ,
, 
Abstract
:1. Introduction
2. Materials and Methods
3. Results
4. Conclusions
Author Contributions
Funding
Institutional Review Board Statement
Informed Consent Statement
Data Availability Statement
Conflicts of Interest
Symbology
| IEC | International Electrotechnical Commission |
| PVS | Photovoltaic System |
| PV | Photovoltaic |
| EVA | Ethylene Vinyl Acetate |
| FEM | Finite Element Analysis |
References
- Schiro, F.; Benato, A.; Stoppato, A.; Destro, N. Improving photovoltaics efficiency by water cooling: Modelling and experimental approach. Energy 2017, 137, 798–810. [Google Scholar] [CrossRef]
- OECD. Evaluaciones de la OCDE sobre el desempeño ambiental: México 2013. Energ. Renov. 2014, 2014, 9188. [Google Scholar] [CrossRef]
- Huacuz, J.M. Sistemas Fotovoltaicos Conectados a Red en México: Situación Actual y Perspectivas. In Proceedings of the Taller Internacional sobre Generación Distribuida con Sistemas Fotovoltaicos Conectados a la Red. Cusco, Cusco, Peru, 2 November 2010; p. 30. [Google Scholar]
- Nižetić, S.; Grubišić-Čabo, F.; Marinić-Kragić, I.; Papadopoulos, A.M. Experimental and numerical investigation of a backside convective cooling mechanism on photovoltaic panels. Energy 2016, 111, 211–225. [Google Scholar] [CrossRef]
- Raúl, H.; Grajales, J.; Díaz, J.A.; González, R.; Munguía, G. Impacto de un sistema fotovoltaico interconectado a red en la demanda eléctrica de un usuario DAC en BCS. In Proceedings of the Congreso Internacional Sobre Innovacion y Desarrollo Tecnologico (CIINDET 2010), Cuernavaca, Mexico, 24–26 November 2010; pp. 82–88. [Google Scholar]
- Alemán-Nava, G.S.; Casiano-Flores, V.H.; Cárdenas-Chávez, D.L.; Díaz-Chavez, R.; Scarlat, N.; Mahlknecht, J.; Dallemand, J.F.; Parra, R. Renewable energy research progress in Mexico: A review. Renew. Sustain. Energy Rev. 2014, 32, 140–153. [Google Scholar] [CrossRef]
- Sathe, T.M.; Dhoble, A.S. A review on recent advancements in photovoltaic thermal techniques. Renew. Sustain. Energy Rev. 2017, 76, 645–672. [Google Scholar] [CrossRef]
- Agyekum, E.B.; PraveenKumar, S.; Alwan, N.T.; Velkin, V.I.; Shcheklein, S.E. Effect of dual surface cooling of solar photovoltaic panel on the efficiency of the module: Experimental investigation. Heliyon 2021, 7, e07920. [Google Scholar] [CrossRef]
- Kant, K.; Shukla, A.; Sharma, A.; Biwole, P.H. Heat transfer studies of photovoltaic panel coupled with phase change material. Sol. Energy 2016, 140, 151–161. [Google Scholar] [CrossRef]
- Teo, H.G.; Lee, P.S.; Hawlader, M.N.A. An active cooling system for photovoltaic modules. Appl. Energy 2012, 90, 309–315. [Google Scholar] [CrossRef]
- Hernandez-Perez, J.G.; Carrillo, J.G.; Bassam, A.; Flota-Banuelos, M.; Patino-Lopez, L.D. Thermal performance of a discontinuous finned heatsink profile for PV passive cooling. Appl. Therm. Eng. 2020, 184, 116238. [Google Scholar] [CrossRef]
- Siddiqui, M.U.; Siddiqui, O.K.; Al-Sarkhi, A.; Arif, A.F.M.; Zubair, S.M. A novel heat exchanger design procedure for photovoltaic panel cooling application: An analytical and experimental evaluation. Appl. Energy 2019, 239, 41–56. [Google Scholar] [CrossRef]
- Popovici, C.G.; Hudişteanu, S.V.; Mateescu, T.D.; Cherecheş, N.C. Efficiency Improvement of Photovoltaic Panels by Using Air Cooled Heat Sinks. Energy Procedia 2016, 85, 425–432. [Google Scholar] [CrossRef] [Green Version]
- Augspurger, M.; Choi, K.K.; Udaykumar, H.S. Optimizing fin design for a PCM-based thermal storage device using dynamic Kriging. Int. J. Heat Mass Transf. 2018, 121, 290–308. [Google Scholar] [CrossRef]
- Lee, Y.; Tay, A.A.O. Finite element thermal analysis of a solar photovoltaic module. Energy Procedia 2012, 15, 413–420. [Google Scholar] [CrossRef] [Green Version]
- Zarmai, M.T.; Ekere, N.N.; Oduoza, C.F.; Amalu, E.H. Evaluation of thermo-mechanical damage and fatigue life of solar cell solder interconnections. Robot. Comput. Integr. Manuf. 2017, 47, 37–43. [Google Scholar] [CrossRef]
- Tippabhotla, S.K.; Song, W.J.R.; Tay, A.A.O.; Budiman, A.S. Effect of encapsulants on the thermomechanical residual stress in the back-contact silicon solar cells of photovoltaic modules—A constrained local curvature model. Sol. Energy 2019, 182, 134–147. [Google Scholar] [CrossRef]
- Dong, J.; Yang, H.; Lu, X.; Zhang, H.; Peng, J. Comparative Study on Static and Dynamic Analyses of an Ultra-thin Double-Glazing PV Module Based on FEM. Energy Procedia 2015, 75, 343–348. [Google Scholar] [CrossRef] [Green Version]
- Lee, Y.; Tay, A.A.O. Stress analysis of silicon wafer-based photovoltaic modules under IEC 61215 mechanical load test. Energy Procedia 2013, 33, 265–271. [Google Scholar] [CrossRef] [Green Version]
- Nasef, H.A.; Nada, S.A.; Hassan, H. Integrative passive and active cooling system using PCM and nanofluid for thermal regulation of concentrated photovoltaic solar cells. Energy Convers. Manag. 2019, 199, 112065. [Google Scholar] [CrossRef]
- Hernandez-Perez, J.G.; Carrillo, J.G.; Bassam, A.; Flota-Banuelos, M.; Patino-Lopez, L.D. A new passive PV heatsink design to reduce efficiency losses: A computational and experimental evaluation. Renew. Energy 2020, 147, 1209–1220. [Google Scholar] [CrossRef]
- Harb, A.E.M.A.; Radwan, A.; Elsayed, K.; Sedrak, M.; Ahmed, M. Influence of varying the Ethylene-Vinyl Acetate layer thicknesses on the performance of a polycrystalline silicon solar cell integrated with a microchannel heat sink. Sol. Energy 2020, 195, 592–609. [Google Scholar] [CrossRef]
- Ali, A.H.; Ibrahim, S.I.; Jawad, Q.A.; Jawad, R.S.; Chaichan, M.T. Effect of nanomaterial addition on the thermophysical properties of Iraqi paraffin wax. Case Stud. Therm. Eng. 2019, 15, 100537. [Google Scholar] [CrossRef]


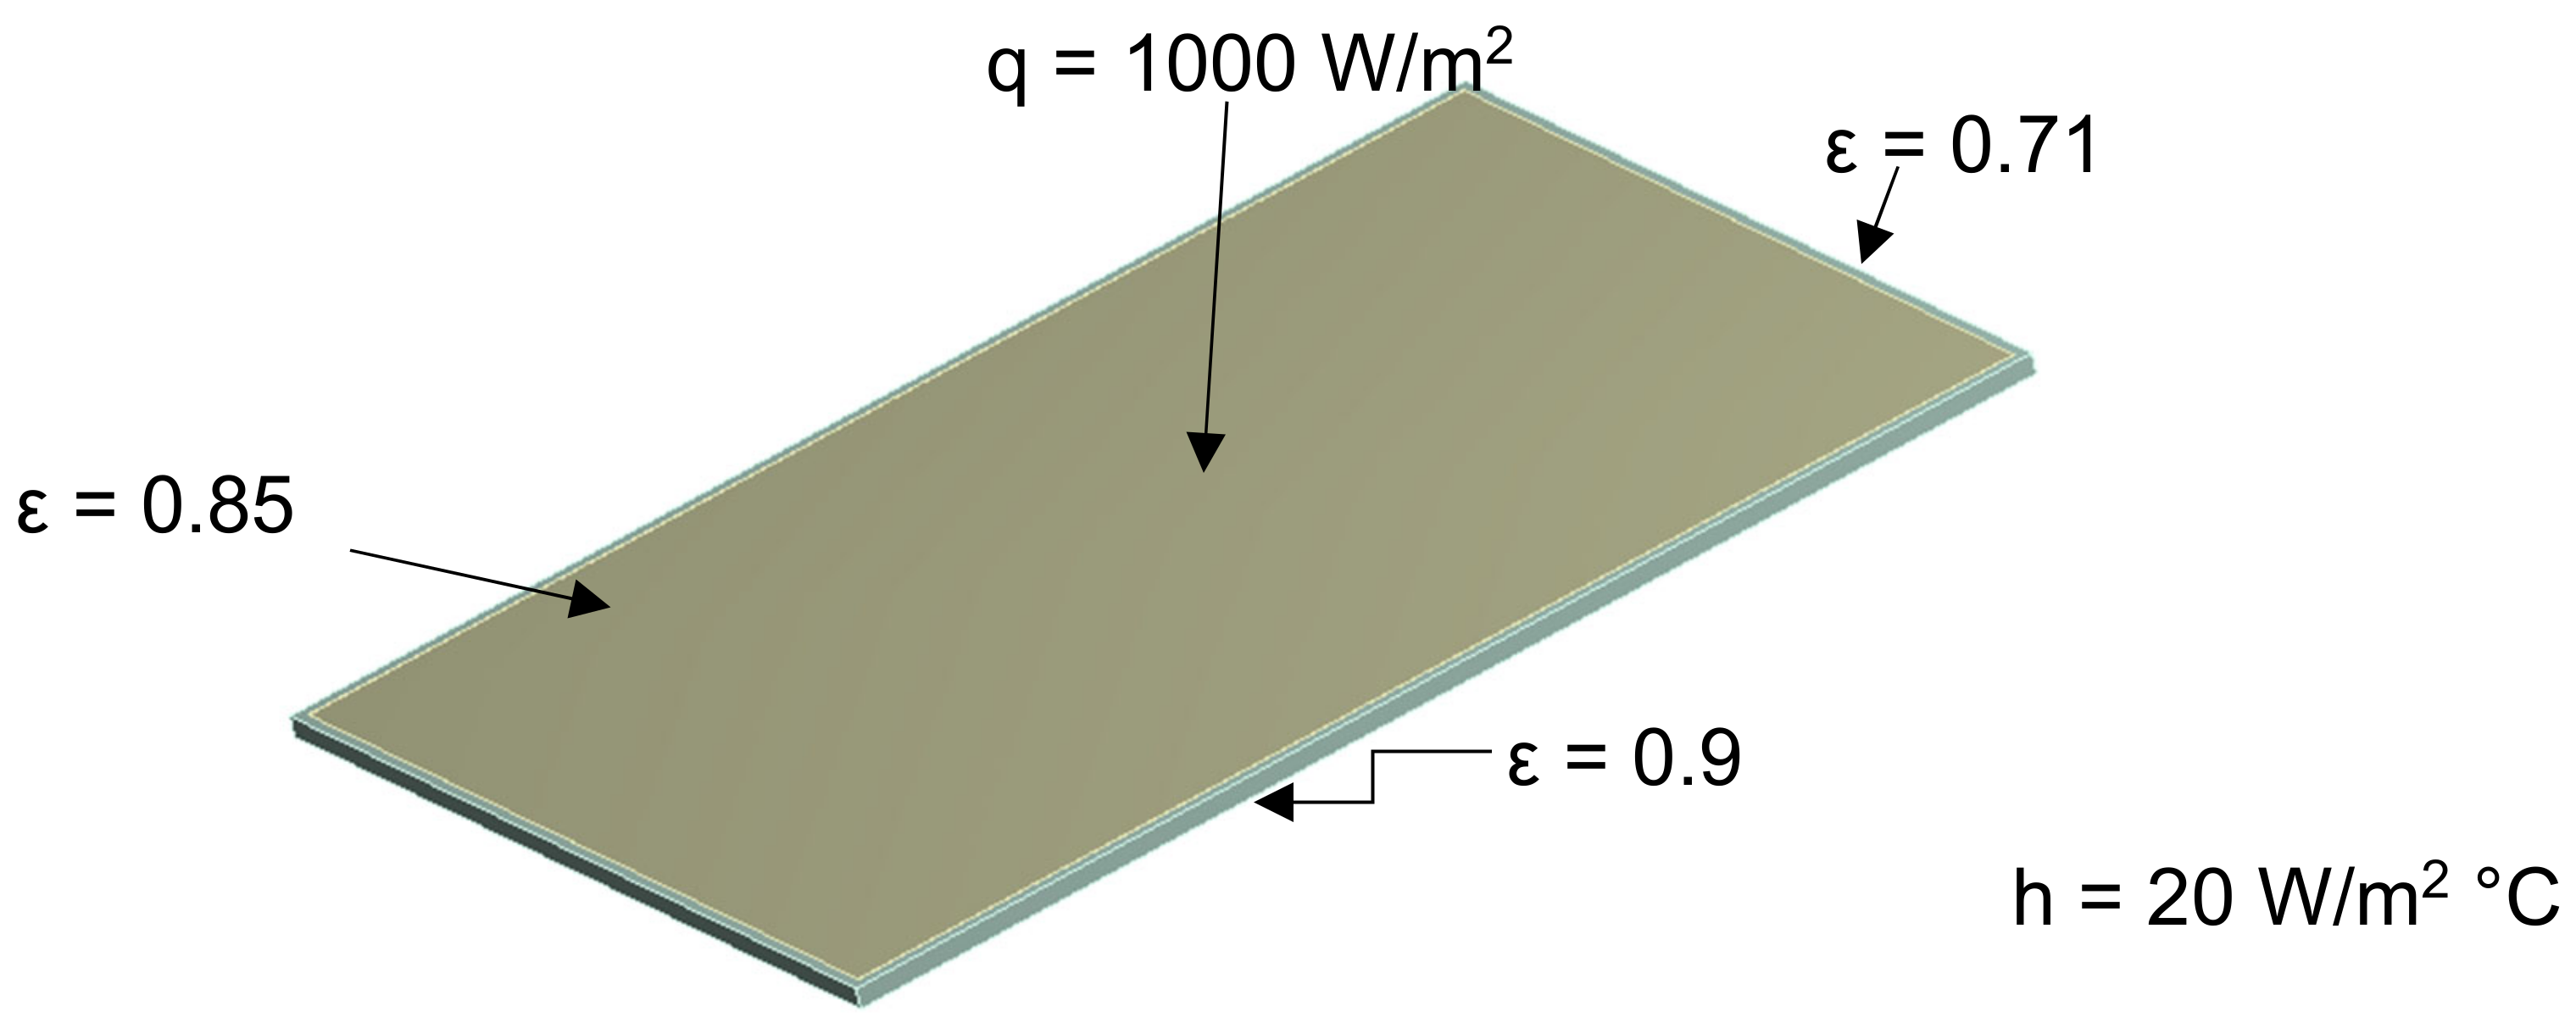
| Material | Thickness (mm) | Thermal Conductivity (W/mK) | Density kg/m3 | Coefficient of Thermal Expansion 1/°C | Specific Heat J/kg °C | Module of Young GPa | Ratio of Poisson | Tensile Yield Strength GPa |
|---|---|---|---|---|---|---|---|---|
| Glass | 3 | 1.8 | 2500 | 9 × 10⁻⁶ | 795 | 0.7 | 0.2 | - |
| Silicon | 0.35 | 148 | 2330 | - | 677 | 168 | 0.3 | - |
| EVA | 0.5 | 0.35 | 960 | 0.73 × 10⁻⁶ | 2090 | 2.1 | 0.4 | 0.00435 |
| Tedlar | 0.1 | 0.2 | 2700 | 0.73 × 10⁻⁶ | 1000 | 2.1 | 0.4 | 0.11 |
| Aluminium | 35 | 209.3 | 2698.4 | 0.24 × 10⁻⁶ | 900 | 70 | 0.33 | 2330 |
| Air | 0.025 | - | - |
| Parameters | Values |
|---|---|
| Convection | 20 W/m2 °C @ 30 °C |
| Radiation | 0.85 @ 30 °C |
| Radiation 2 | 0.90 @ 30 °C |
| Radiation 3 | 0.71 @ 30 °C |
| Heat flux | 1000 W/m2 |
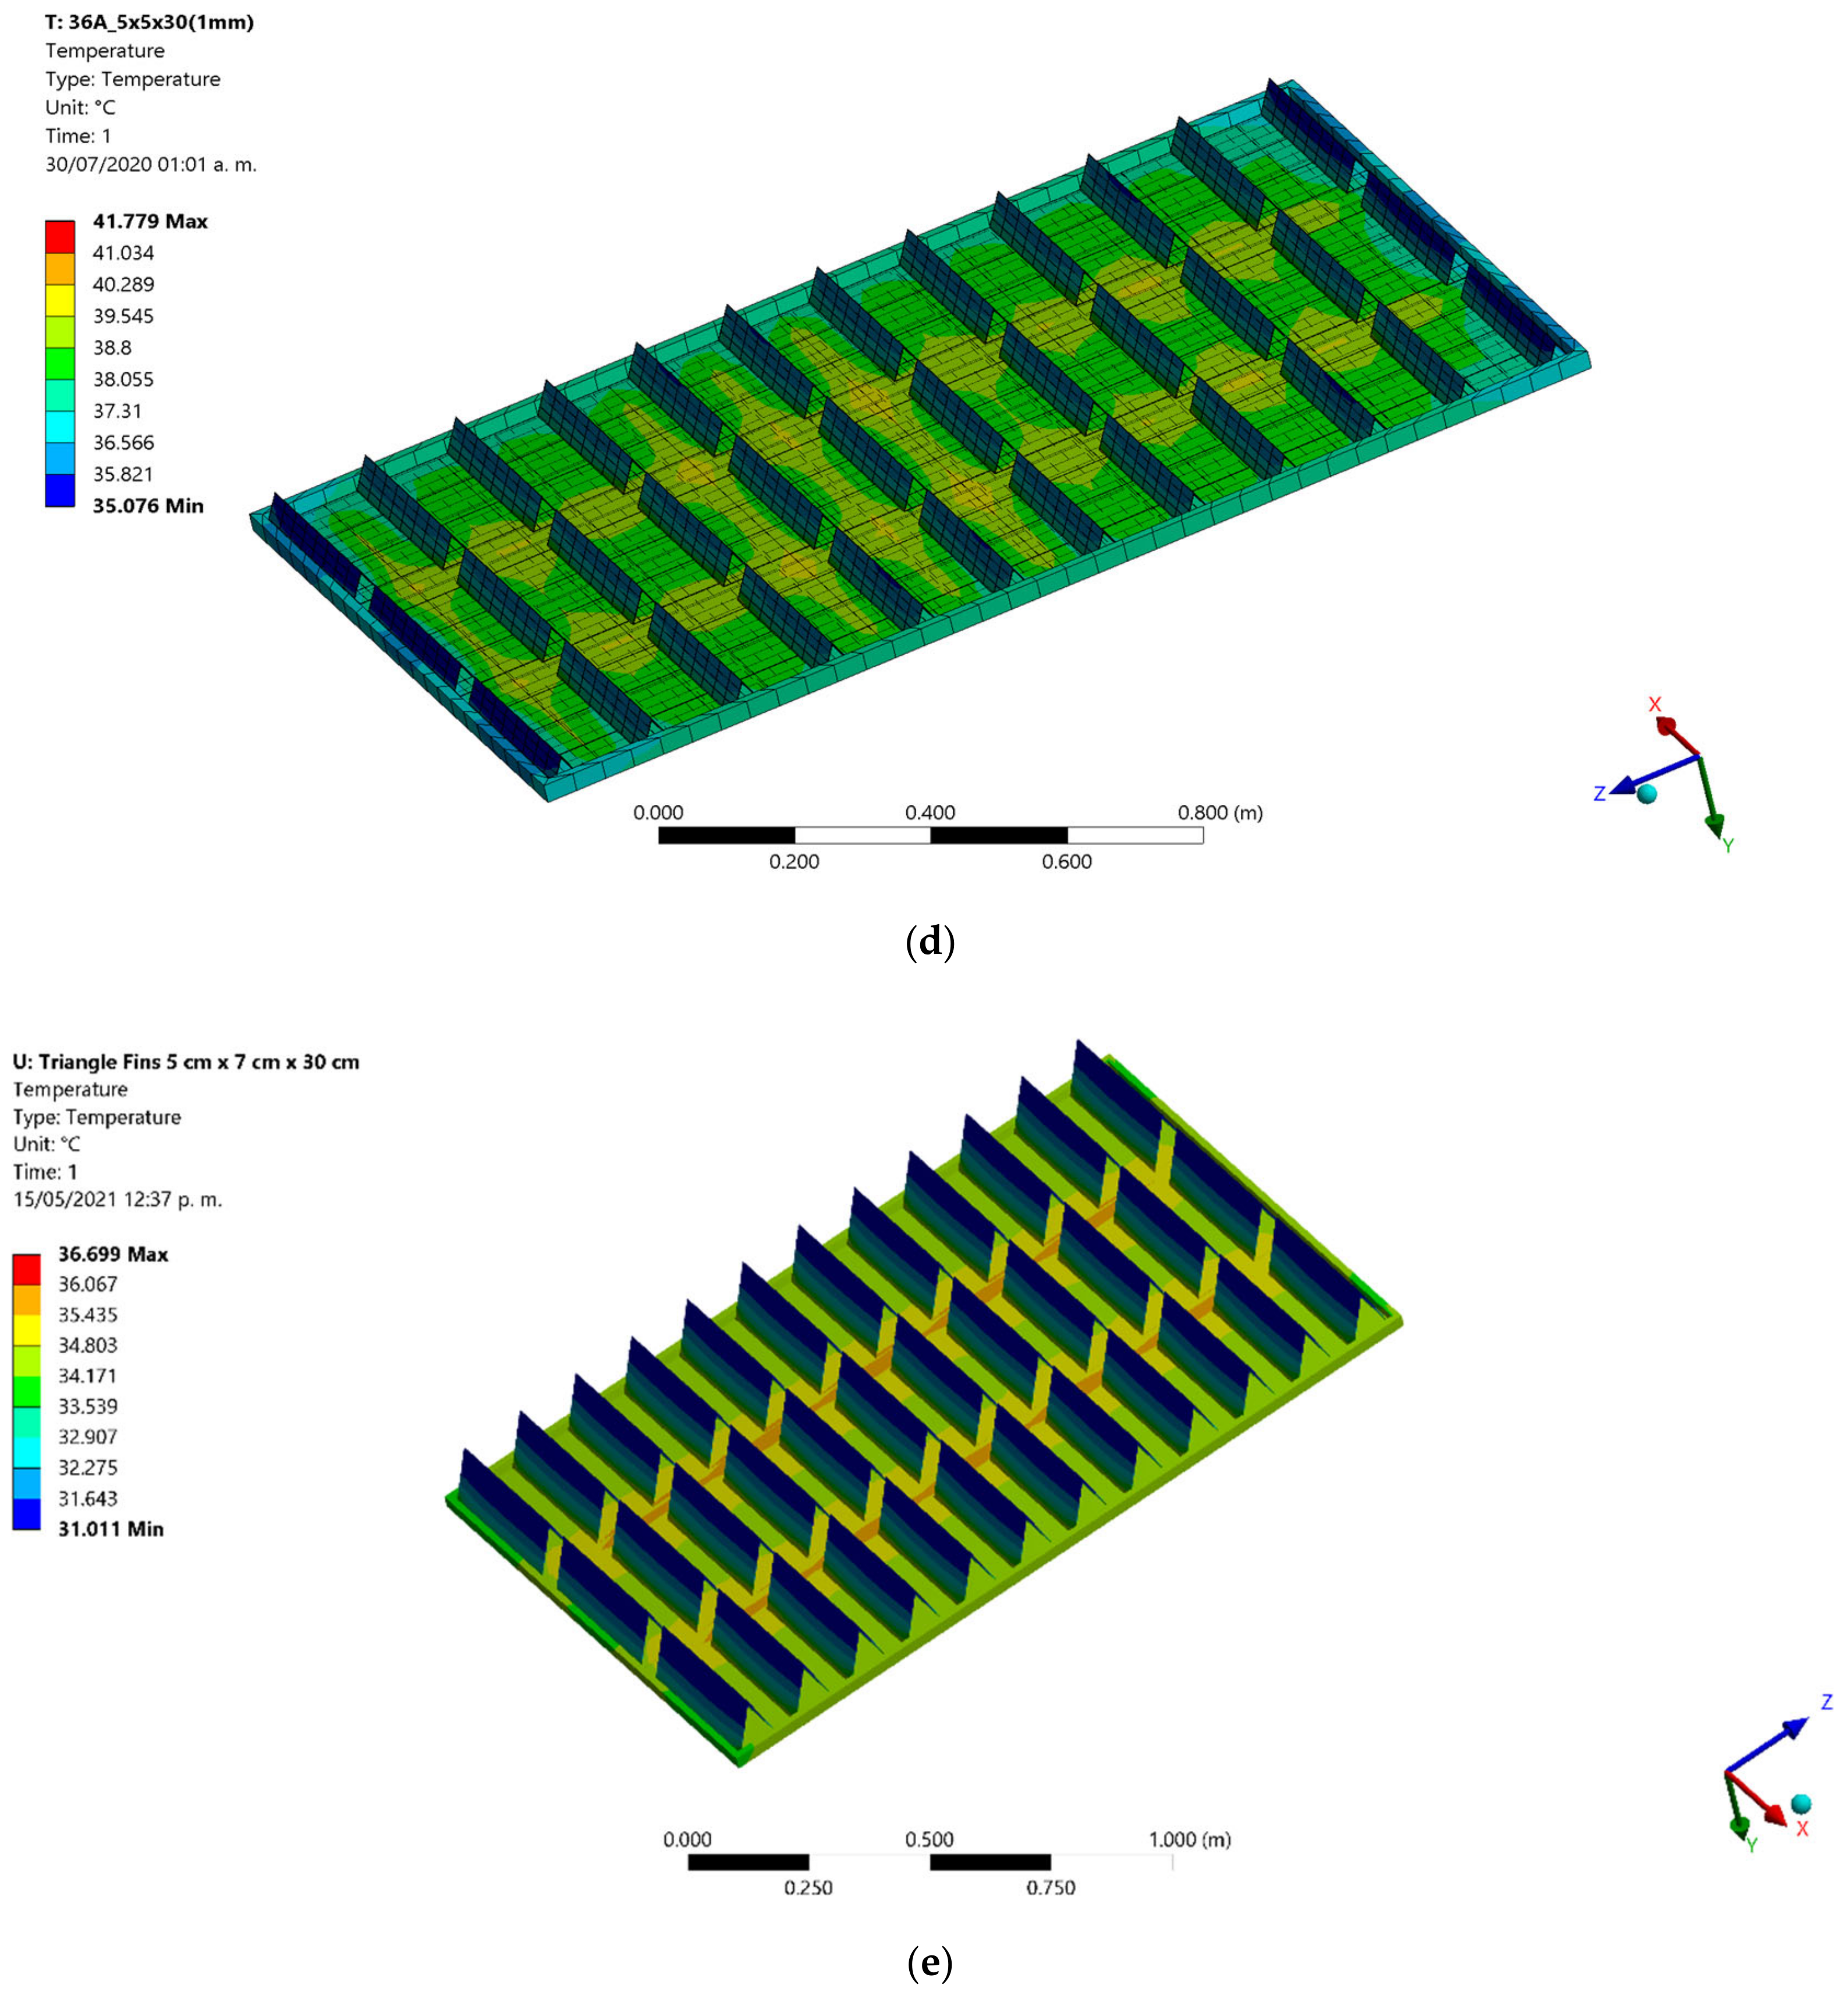
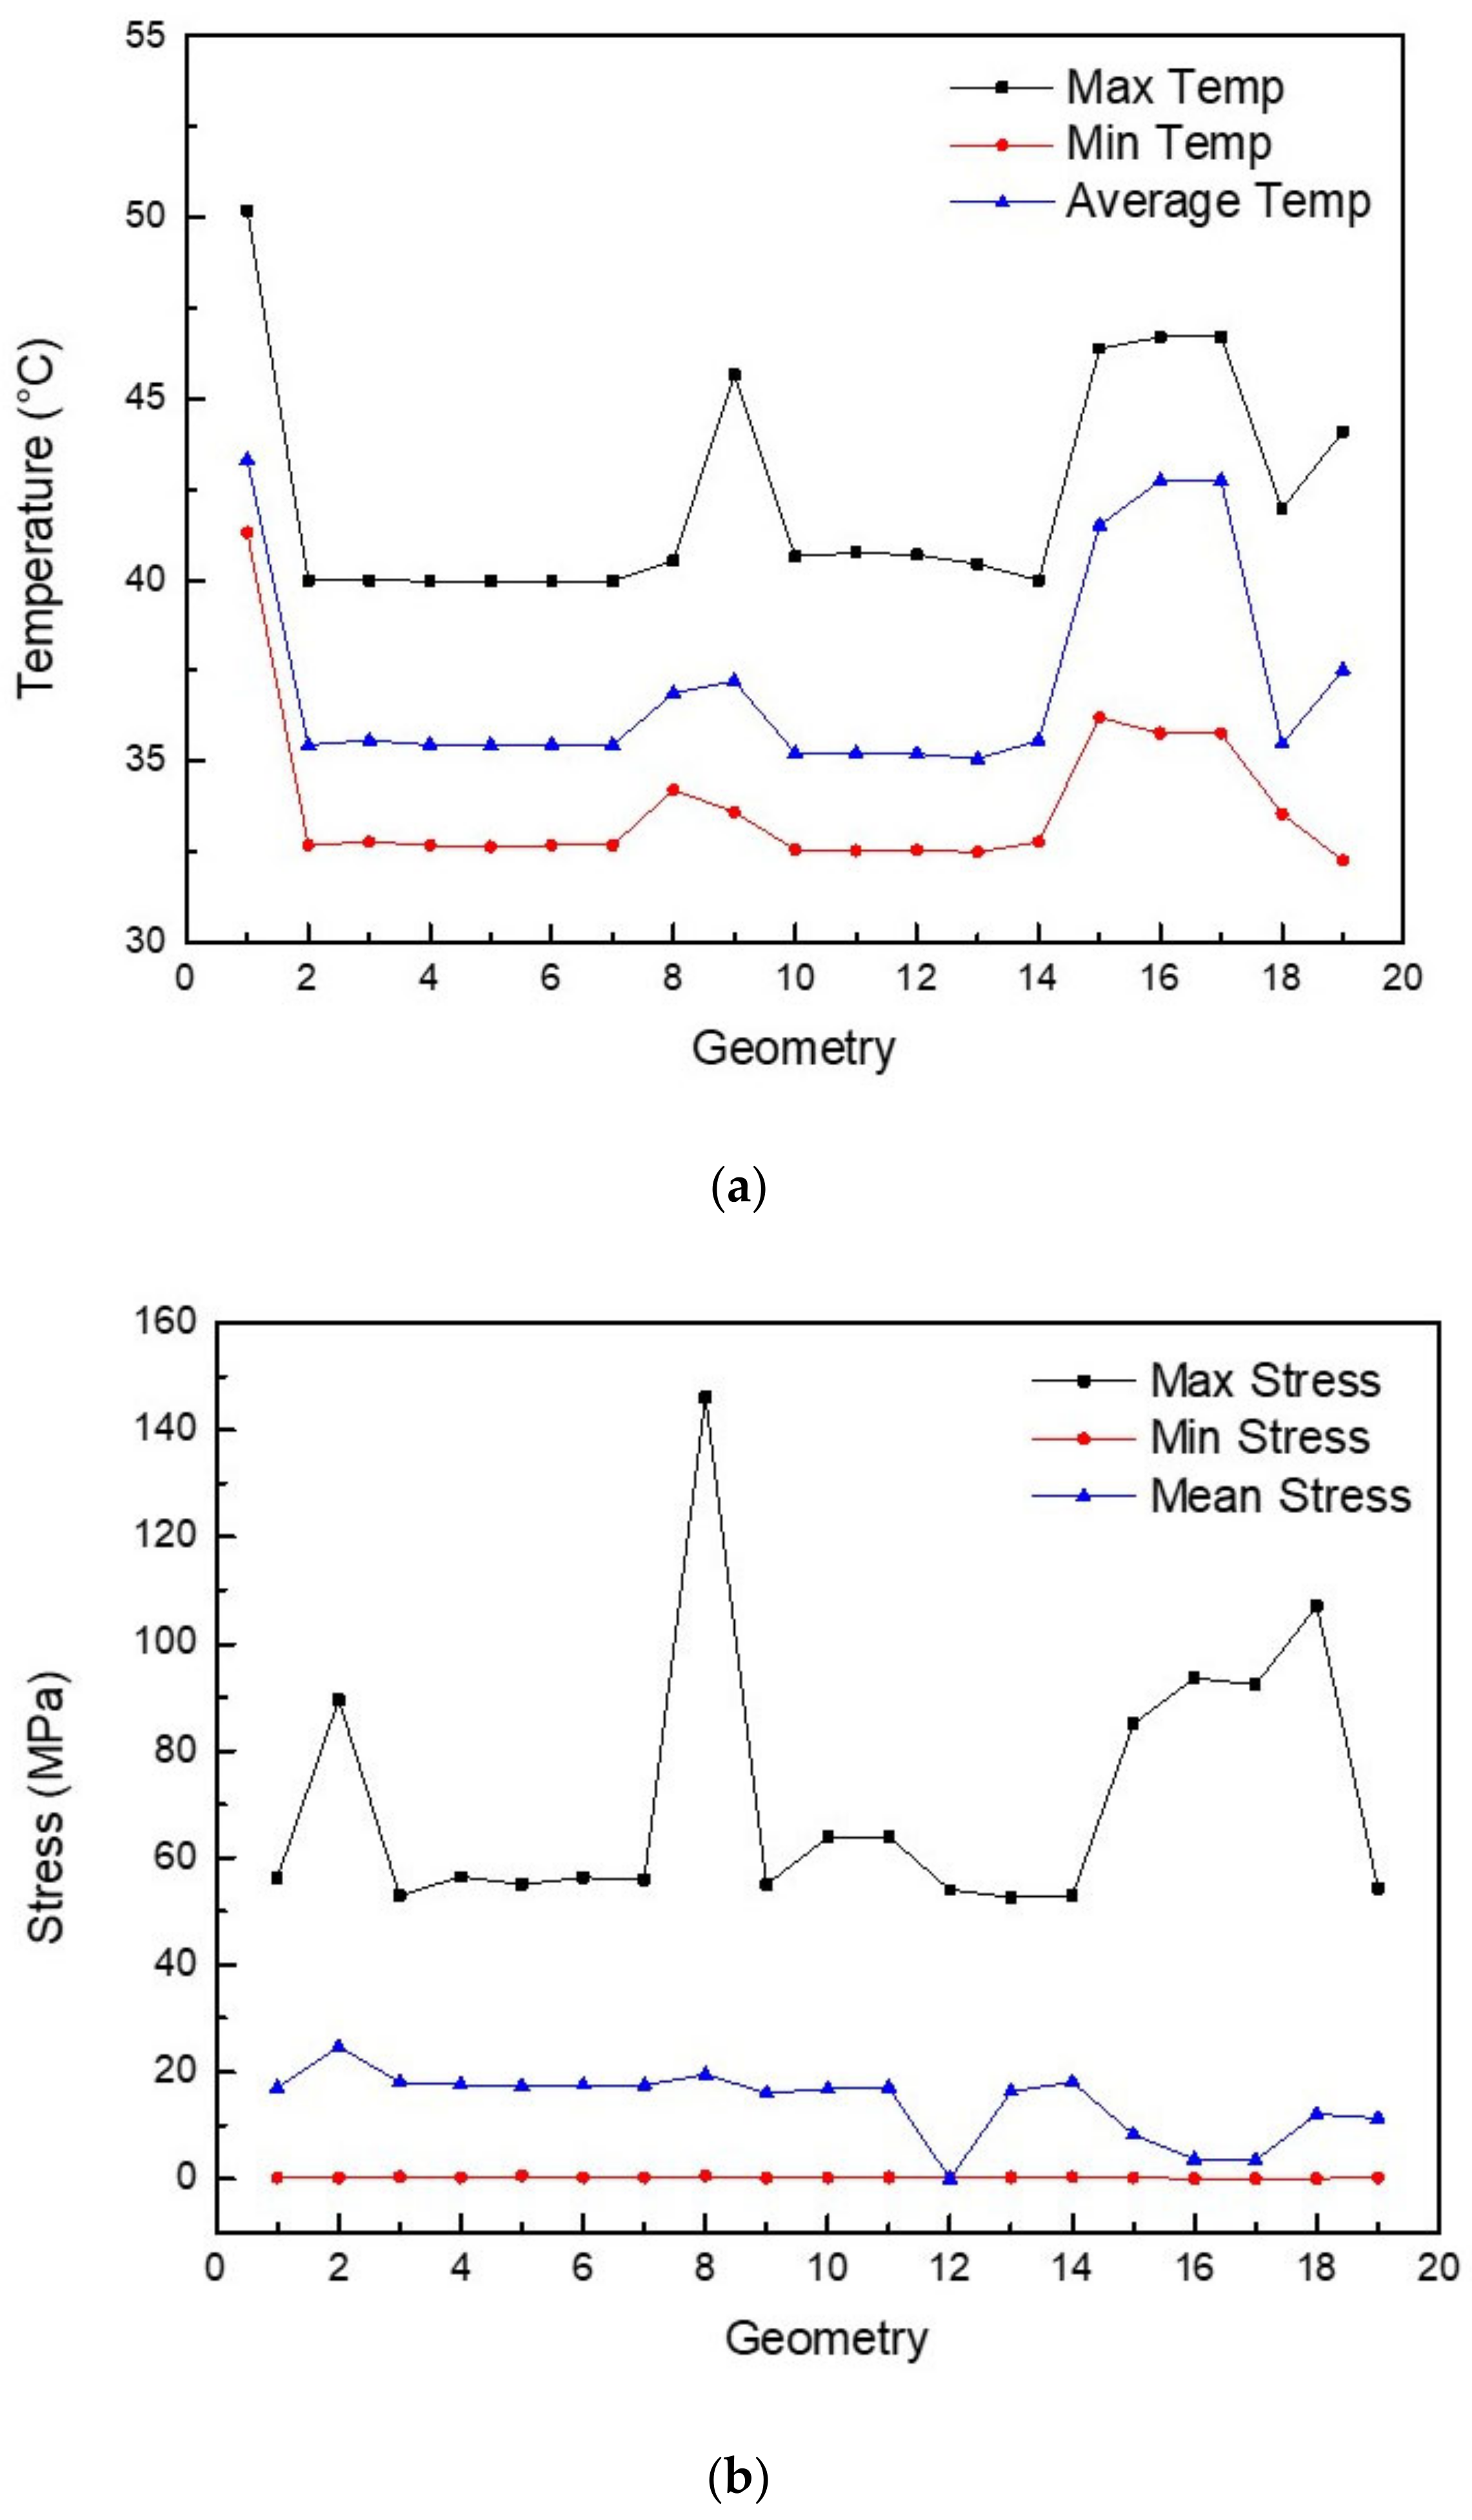
| Geometry | Fins | Fin Number |
|---|---|---|
| 1 | Convectional panel | Conventional Panel |
| 2 | Rectangular | 51 fins of 30 cm × 10 cm × 0.005 cm |
| 3 | Rectangular | 14 fins of 1 m × 10 cm × 0.005 cm EVA m, TEDLAR m |
| 4 | Triangle | 14 fins of 5 cm × 5 cm × 1 m, EVA m, m, TEDLAR m |
| 5 | Triangle | 14 fins of 5 cm × 5 cm × 1 m, TEDLAR m, EVA m, m |
| 6 | Triangle | 14 fins of 5cm × 5 cm × 1 m, EVA , TEDLAR m |
| 7 | Triangle | 14 fins of 5 cm × 5 cm × 1 m, EVA m, m, TEDLAR m |
| 8 | Triangle | 24 fins of 1 m × 10 cm × 5 cm, TEDLAR m, EVA m, m |
| 9 | Triangle | 36 fins of 5 cm × 5 cm × 30 cm, EVA m, TEDLAR |
| 10 | Triangle | 48 fins of 5 cm × 5 cm × 30 cm |
| 11 | Triangle | 48 fins of 5 cm × 5 cm × 30 cm, TEDLAR m, EVA m, m |
| 12 | Triangle | 48 fins of 5 cm × 5 cm × 30 cm, TEDLAR m, EVA m, m |
| 13 | Triangle | 48 fins of 5 cm × 5 cm × 30 cm, EVA m, m, TEDLAR m |
| 14 | Triangle | 48 fins of 5 cm × 5 cm × 30 cm, TEDLAR m, EVA m, m |
| 15 | Triangle | 51 fins of 5 cm × 5 cm × 30 cm, EVA, TEDLAR m |
| 16 | Triangle | 51 fins of 5 cm × 5 cm × 30 cm, TEDLAR m, EVA m |
| 17 | Triangle | 51 fins of 5 cm × 5 cm × 30 cm, EVA TEDLAR m |
| 18 | Triangle | 53 fins of 5 cm × 5 cm × 30 cm, EVA de m, TEDLAR m, 28 holes |
| 19 | Triangle | 54 fins of 5 cm × 5 cm × 30 cm, EVA m, TEDLAR m |
Publisher’s Note: MDPI stays neutral with regard to jurisdictional claims in published maps and institutional affiliations. |
© 2021 by the authors. Licensee MDPI, Basel, Switzerland. This article is an open access article distributed under the terms and conditions of the Creative Commons Attribution (CC BY) license (https://creativecommons.org/licenses/by/4.0/).
Share and Cite
Pérez Escobar, B.L.; Pérez Hernández, G.; Ocampo Ramírez, A.; Rojas Blanco, L.; Díaz Flores, L.L.; Vidal Asencio, I.; Hernández Perez, J.G.; Ramírez Morales, E. Analysis of Thermomechanical Stresses of a Photovoltaic Panel Using a Passive System of Cooling. Appl. Sci. 2021, 11, 9806. https://doi.org/10.3390/app11219806
Pérez Escobar BL, Pérez Hernández G, Ocampo Ramírez A, Rojas Blanco L, Díaz Flores LL, Vidal Asencio I, Hernández Perez JG, Ramírez Morales E. Analysis of Thermomechanical Stresses of a Photovoltaic Panel Using a Passive System of Cooling. Applied Sciences. 2021; 11(21):9806. https://doi.org/10.3390/app11219806
Chicago/Turabian StylePérez Escobar, Brayan L., Germán Pérez Hernández, Arturo Ocampo Ramírez, Lizeth Rojas Blanco, Laura L. Díaz Flores, Inocente Vidal Asencio, José G. Hernández Perez, and Erik Ramírez Morales. 2021. "Analysis of Thermomechanical Stresses of a Photovoltaic Panel Using a Passive System of Cooling" Applied Sciences 11, no. 21: 9806. https://doi.org/10.3390/app11219806
APA StylePérez Escobar, B. L., Pérez Hernández, G., Ocampo Ramírez, A., Rojas Blanco, L., Díaz Flores, L. L., Vidal Asencio, I., Hernández Perez, J. G., & Ramírez Morales, E. (2021). Analysis of Thermomechanical Stresses of a Photovoltaic Panel Using a Passive System of Cooling. Applied Sciences, 11(21), 9806. https://doi.org/10.3390/app11219806