1. Introduction
Money is still a most essential commodity, despite recent growth in the use of electronic financial transactions. Banknotes, due to their wide use and susceptible nature, are the most favorite target of defrauders and scammers. Recently, due to some technological advancements, the problem of counterfeit banknotes has increased on a large scale and seriously threatens the economy, financial institutions, and consumers. Earlier, only printing houses had the facility to print counterfeit paper notes, but today, everybody can do it at their home, by using appropriate commercially available scanners and printers. Therefore, the amount of production of fake banknotes is increasing every year [
1,
2,
3,
4].
Two basic ways are used to detect counterfeit banknotes: the manual method and analytical/forensic methods. In the manual method the currencies are inspected with the naked eye or by touch. Detection is based on the physical appearance of the banknotes. The forensic methods are based on science or technology for authentication of the banknotes. Modern banknotes are prepared with many features, which allow for machine authentication. While forensic detection of counterfeit banknotes is in most cases an easy task, several cases of sophisticated forgeries, in which authentication is very difficult, have been reported.
Among the currently used forensic technologies are multispectral imaging such as Video Spectra Comparator (VSC) and AFM coupled Raman spectroscopy. The VSC can detect low-level forgeries but is blind for more sophisticated cases. Other multispectral imaging methods, which are based on reflection spectroscopy may be useful in some cases; however, since these devices are only sensitive to the dyes used, sophisticated criminals can prepare their dye mixtures in a way that mimics the original spectra. Instruments working in several wavelength ranges are rare but are much more difficult to overcome.
AFM coupled Raman spectroscopy is a very powerful analytical tool. Its main drawbacks in banknotes applications are its time consuming and expensive operation. Moreover, the method can only be used for scanning small areas. It also suffers of limited sensitivity to trace compounds.
When countries face such criminal activities, authentication becomes very difficult, and it can only be based on observation of minor details, revealed using uncommon detection technologies. Therefore, application of new authentication technologies is of interest. Actually, most powerful analytical techniques (e.g., SIMS) can be applied in difficult cases; however, new methods that can scan banknotes in seconds and under ambient conditions, providing detailed and sensitive information, are still needed. Moreover, even when authentication is simple, fingerprinting of the fake banknotes, including the ink characteristics and the printing process, is of interest. This information is needed for identifying the source and for forensic purposes.
A rather new and uncommon analytical technology is Multiphoton Electron Extraction Spectroscopy (MEES), which has been based of previous analytical applications of multiphoton ionization under ambient conditions: starting with gas phase applications [
5,
6,
7,
8], liquids [
9], aerosols [
10,
11,
12], and solid surfaces [
13,
14,
15,
16,
17,
18,
19,
20,
21]. MEES is a quantitative analytical spectroscopy, based on detection of photoelectrons extracted in multiphoton process, as a function of laser irradiation wavelength. It was proved to be more sensitive and more informative than most common optical spectroscopies [
22,
23,
24,
25,
26,
27]. This method can directly be applied to surfaces, without any preparations and preprocessing. Thus far, it was applied to detecting a variety of compounds, including polycyclic aromatic hydrocarbons (PAH), pesticides, pharmaceutical compounds, explosives, and narcotic drugs. MEES method has never been applied to banknotes, and this is the first attempt to utilize it for authentication purposes and fingerprinting of counterfeit banknotes.
2. Experimental
2.1. MEES Apparatus and Spectra
At present, there is no MEES instrument commercially available. Our home-made setup is schematically described in
Figure 1. The apparatus has been previously described (Chen et al. 2010), and only slight modifications were needed for application to banknotes. Briefly, the radiation source was a solid state OPO laser (NT342/3/UVE EKSPLA, Vilnius, Lithuania), generating wavelengths in the range of 210–350 nm at a 10 Hz repetition rate and 5 ns pulse duration. The laser pulse energy at each wavelength was monitored with a pyroelectric sensor (Ophir LaserStar PE-10-sh-v2, Israel). The pulse energy was in the range of 300–350 μJ in all measurements. The tested banknotes were placed at a distance of 150 mm from a focusing lens of f = 180 mm, resulting in a spot diameter of ca. 250 μm. At such soft focusing, no breakdown took place.
The banknote was placed on a metal electrode, at an electrical field of 1.8 kV cm−1 (high voltage power supply: PS325, Stanford Research Systems, USA). This electrical field allowed for very high electron collection efficiency.
Multiphoton ionization at the laser spot resulted in emitting electrons from the surface. The current was amplified (Keithley amplifier, 428, 106 V/A) and digitized (Tektronix, TDS 220 oscilloscope). The time dependent photocurrent was integrated, normalized by the actual pulse energy at each wavelength, and presented as the total photocharge as a function of wavelength. The measurements and data acquisition were fully automated and controlled by a LabVIEW™ program.
All measurements were carried out under ambient conditions, i.e., room temperature (22 ± 2 °C), 60–80% humidity and air (or nitrogen) pressure of 750 ± 5 Torr.
In MEES setup, the tested surface is irradiated by a slightly focused beam of a pulsed UV laser. The energy of a single photon is not sufficient for ionization; however, multiphoton absorption takes place, resulting in electron extraction. The electrons are collected by a positive electrode placed above the surface. The current is amplified and recorded as a function of time. The integrated current provides the total photo-charges generated by each laser pulse. The photo-charges are recorded as a function of laser wavelength. Thus, MEES is the presentation of the photo-charges (normalized by the laser pulse energy) as a function of laser wavelength.
While scanning the laser wavelength, we reveal numerous resonant transitions between electronic and vibronic states of the surface molecules. Since the transitions are induced by multiphoton absorption, the number of possible transitions is much higher than in single photon processes. The peaks in MEES represent the sequence of transitions, whose result is ionization.
While this rather simplified description, is valid for multiphoton ionization in the gas phase, the actual processes taking place in the solid phase have not been investigated in detail and probably include additional effects. Assignment of MEES peaks to molecular transitions requires knowing the molecular energy levels. MEES peaks of simple molecules were in agreement with some of the calculated levels. However, MEES reveals additional peaks, corresponding to higher energy levels, not yet calculated. MEES peaks are also sensitive to molecular vibrational states and even to isotopic substituents.
Application of MEES to complex materials, such as natural products or banknotes, results in numerous peaks that cannot be yet interpreted. However, they are repeatable and can be used as a unique spectral fingerprint of the sample composition. Therefore, MEES can be used for identification and authentication purposes.
In principle, MEES is not totally a nondestructive method, since the tested surface is irradiated by UV light. However, the sample is placed on a conductive electrode, which supplies electrons for fast recombination. The level of surface damage depends on the irradiation intensity. In our experiments, we only slightly focus the beam, and thus, the damage is minimal. It can further be reduced by using a better current amplifier. Therefore, MEES can practically be a nondestructive method.
2.2. Banknotes
Foreign authentic banknotes (Euros and U.S. dollars) were purchased from local change. Local banknotes, New Israeli Shekel (NIS) were available from personal source. Counterfeit banknotes of several types (i.e., Euros, U.S. dollars, and NISs) were obtained from the Israeli Police, the division of identification and forensic science (DIFS aka MAZAP), along from the Bank of Israel (The Currency Department). Whenever known, information on the specific printing method was also provided.
3. Results and Discussion
Counterfeit Euro, U.S. dollar, and New Israeli Shekel banknotes, of different values and batches, were studied vs. authentic ones. Different bill areas were tested, e.g., low-colored frame and homogeneous well-defined colored areas (green, metallic, etc.)
All available banknotes were introduced in the MEES instrument and tested. MEES spectra depended on the tested location (white, colored, hologram, etc.) When measuring MEES spectra of the same site in different authentic banknotes of the same kind, excellent reproducibility was obtained. When measuring MEES spectra of a counterfeit banknote, in zones that are supposed to be identical (along the frame or in areas of the same color and shape), also excellent reproducibility was noted. (In 10 measurements, the reproducibility of peak location was of 0.2 nm, and the reproducibility of peak intensity was of ca 7%.) Therefore, we are confident that the differences in the spectra are significant and not related to instrumental factors or to local (invisible) dirt on the banknotes. We cannot exclude the possibility that the relative intensities of the peaks are affected by instrumental factors, but the reproducibility, on one hand, and the difference in the spectra of different banknotes definitely indicate that MEES provides a significant fingerprint of the rested site.
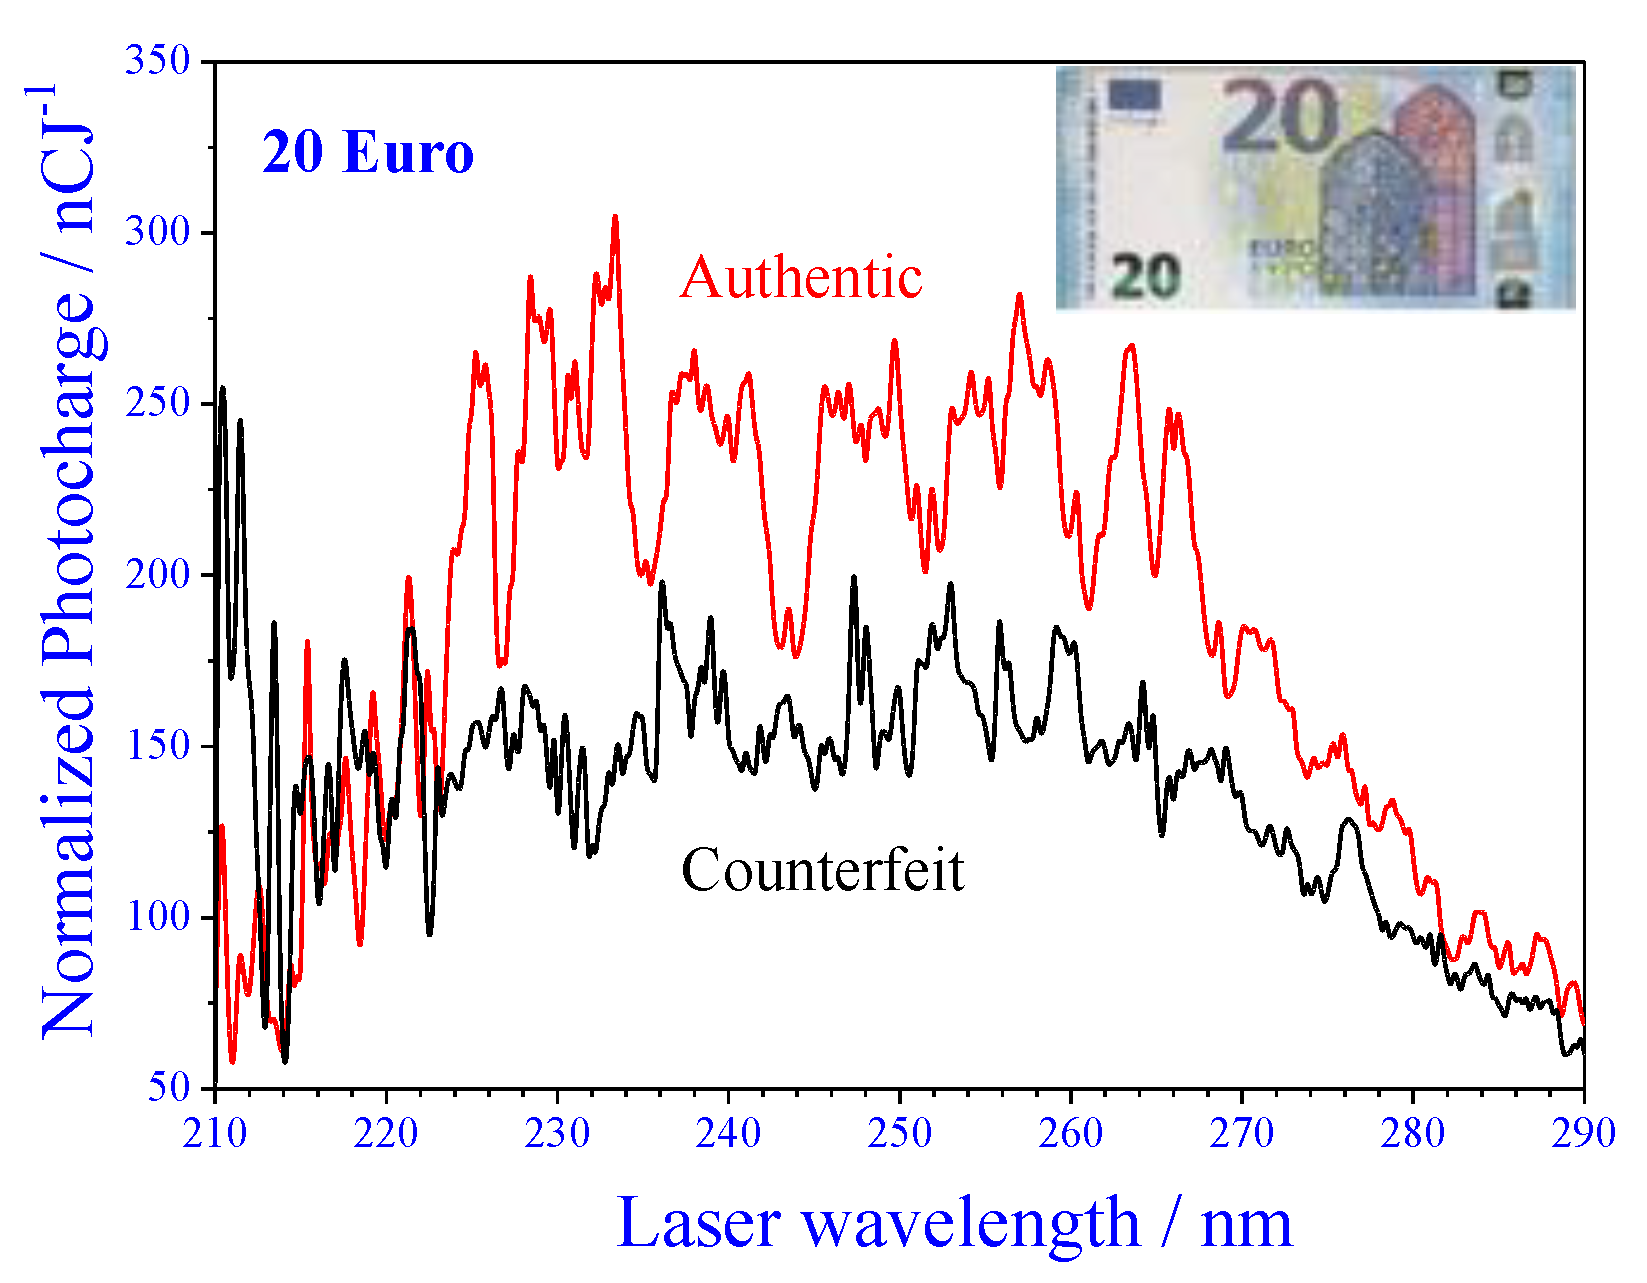
We first present the results from 20 Euro bills, which are the second common paper bills in Europe [
3].
Figure 2 presents MEES spectra collected from the lightly colored area (frame) and colored (silvery) hologram at the right-hand side of the bill. A clear distinction between the spectra of the authentic and counterfeit banknotes is evident. The list of the main peaks which are missing in the authentic banknotes and present in the counterfeit (and vice versa) is presented in
Table 1. The differences in the peaks indicate differences in the chemical composition at the tested sites. Based on previous investigations of MEES, this method is very sensitive to the molecular composition at the irradiate spot [
21,
22]. Therefore, although the chemical composition of banknotes is not in the public domain, the differences can be attributed to the local chemistry. Note that these differences are observed neither by the naked eye nor by reflectance spectroscopy in the visible range.
The variety of peaks observed in the MEES spectra of banknotes is characteristic to this method [
27]. Assignment of some peaks was only possible for simple molecules, such as nitrates, where the molecular energy levels are well known. Most MEES peaks cannot yet be assigned to specific transitions, since they involve high molecular energy states, which have not been calculated so far. In the case of banknotes, even their chemical composition is not known, so peak assignment is out of question. Nevertheless, MEES still can provide a fingerprint of the banknotes and be used for distinction between authentic and counterfeit ones.
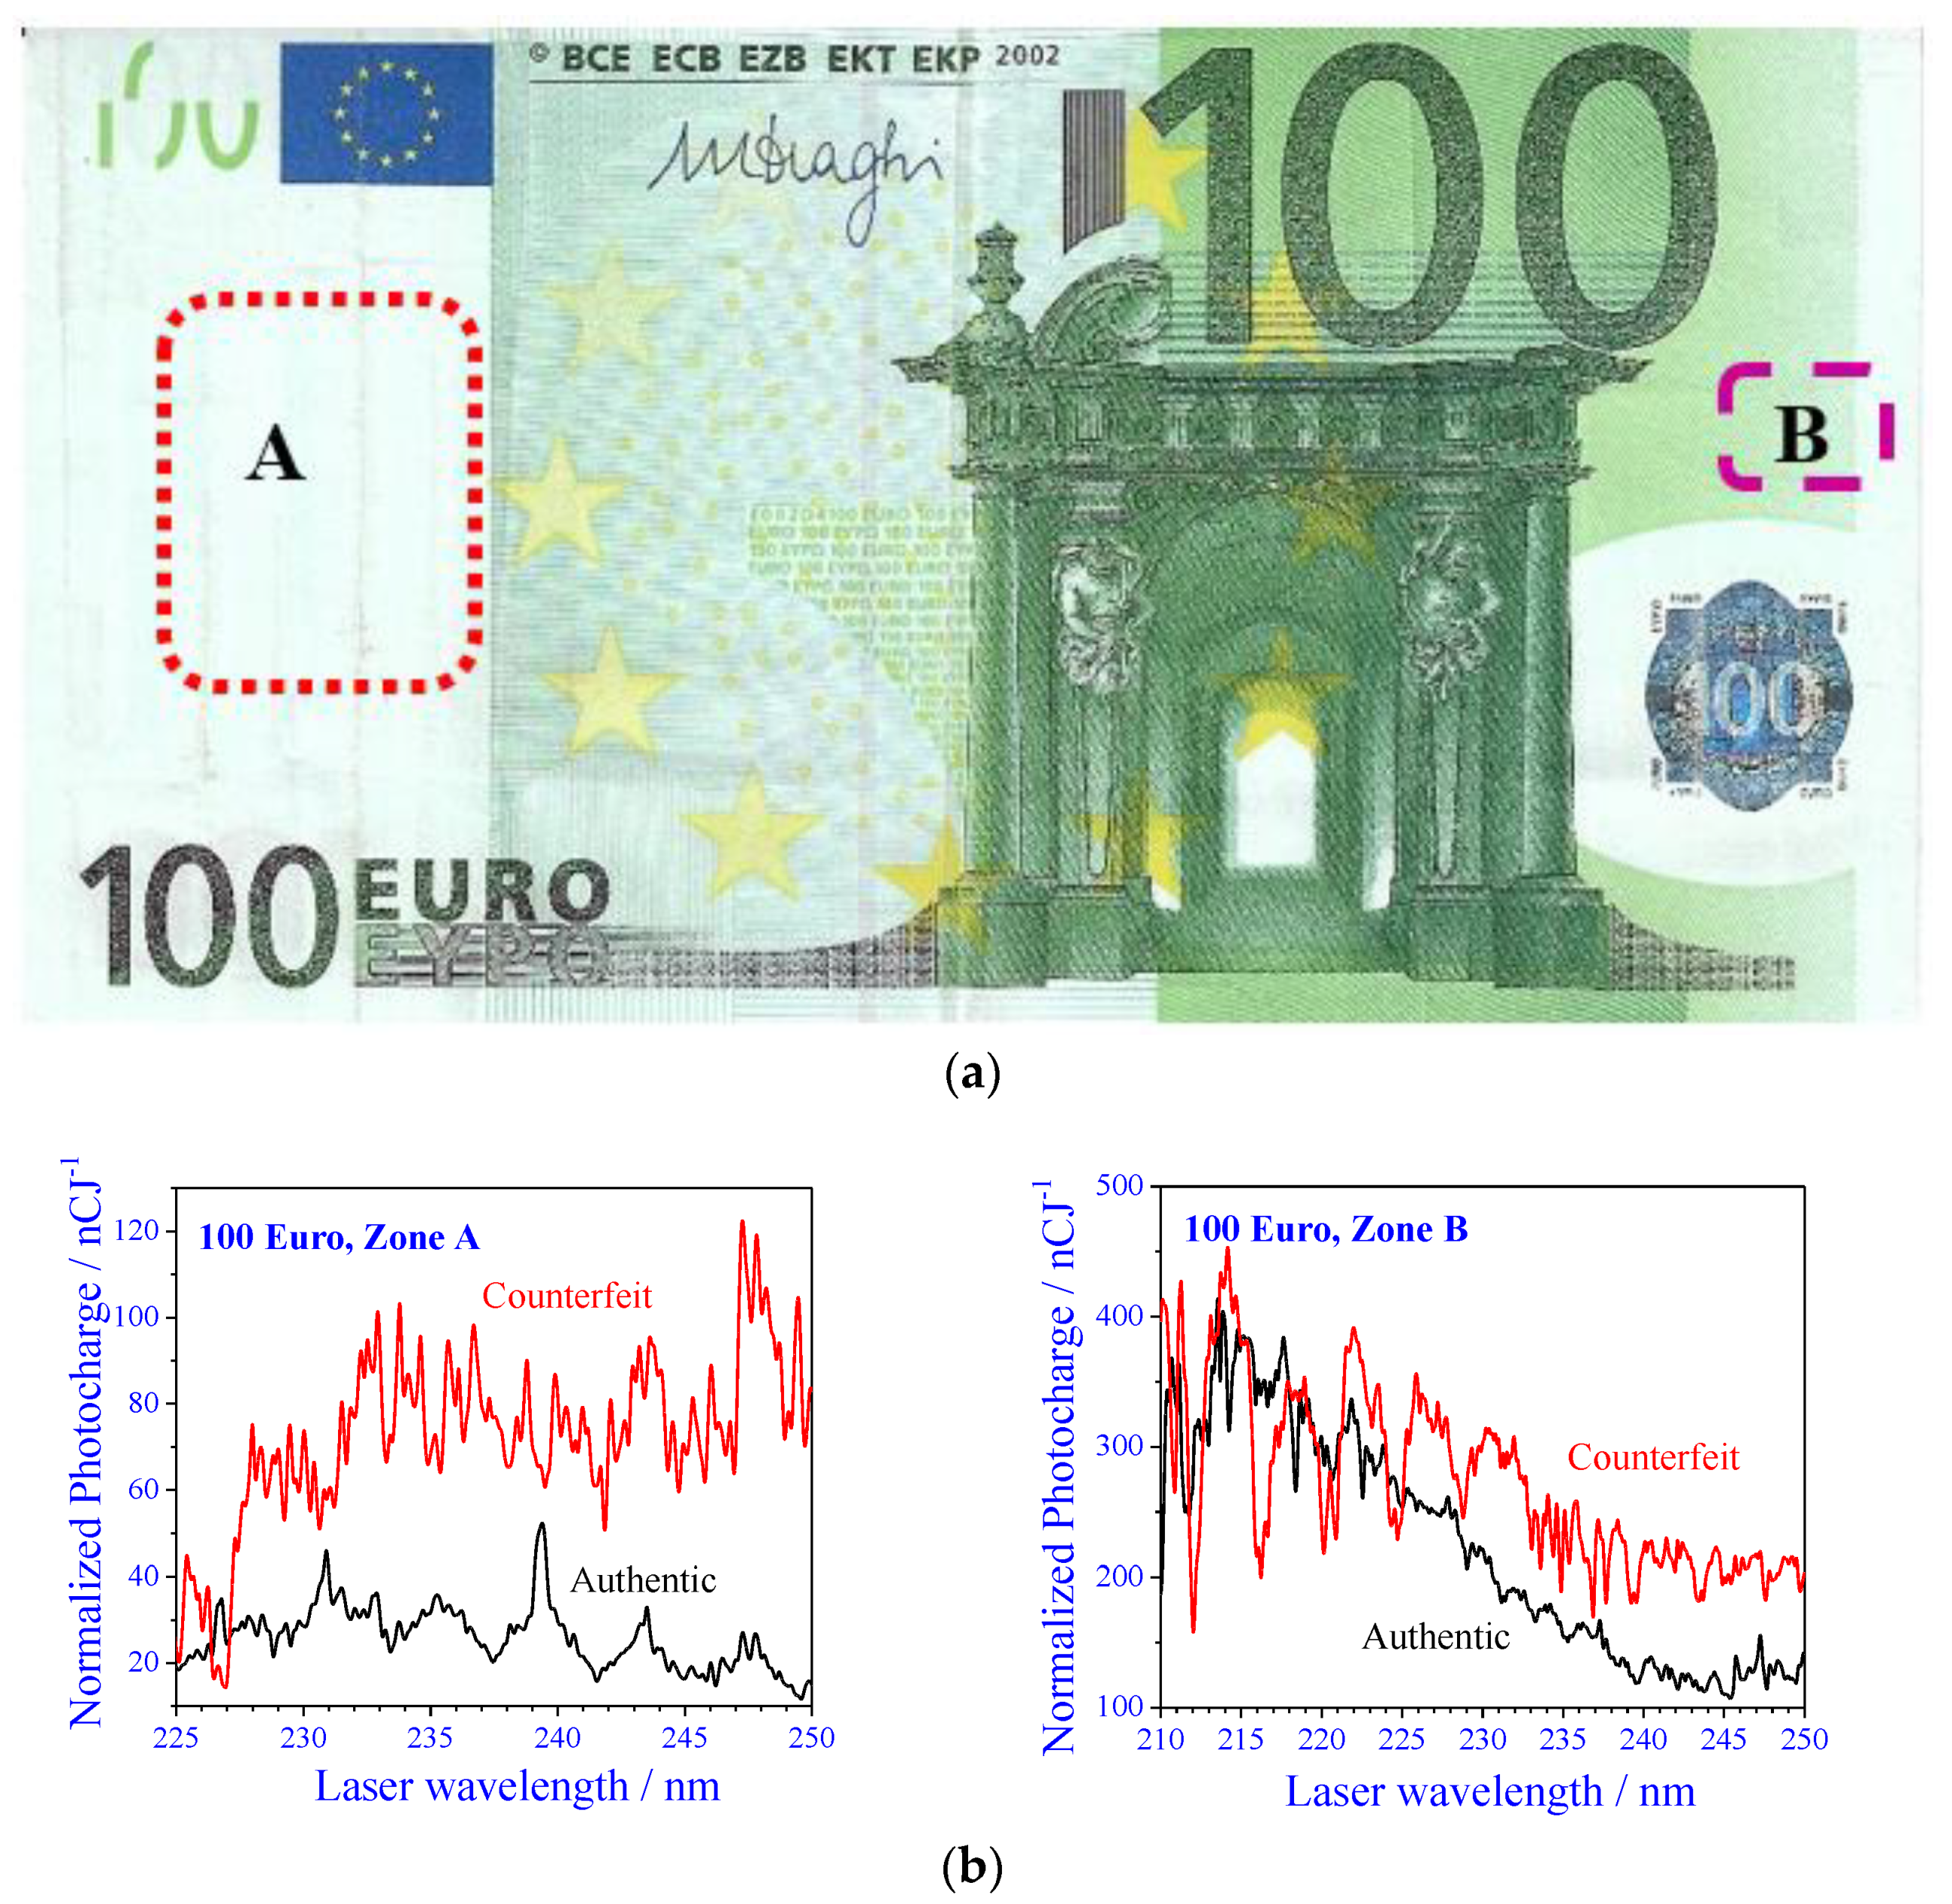
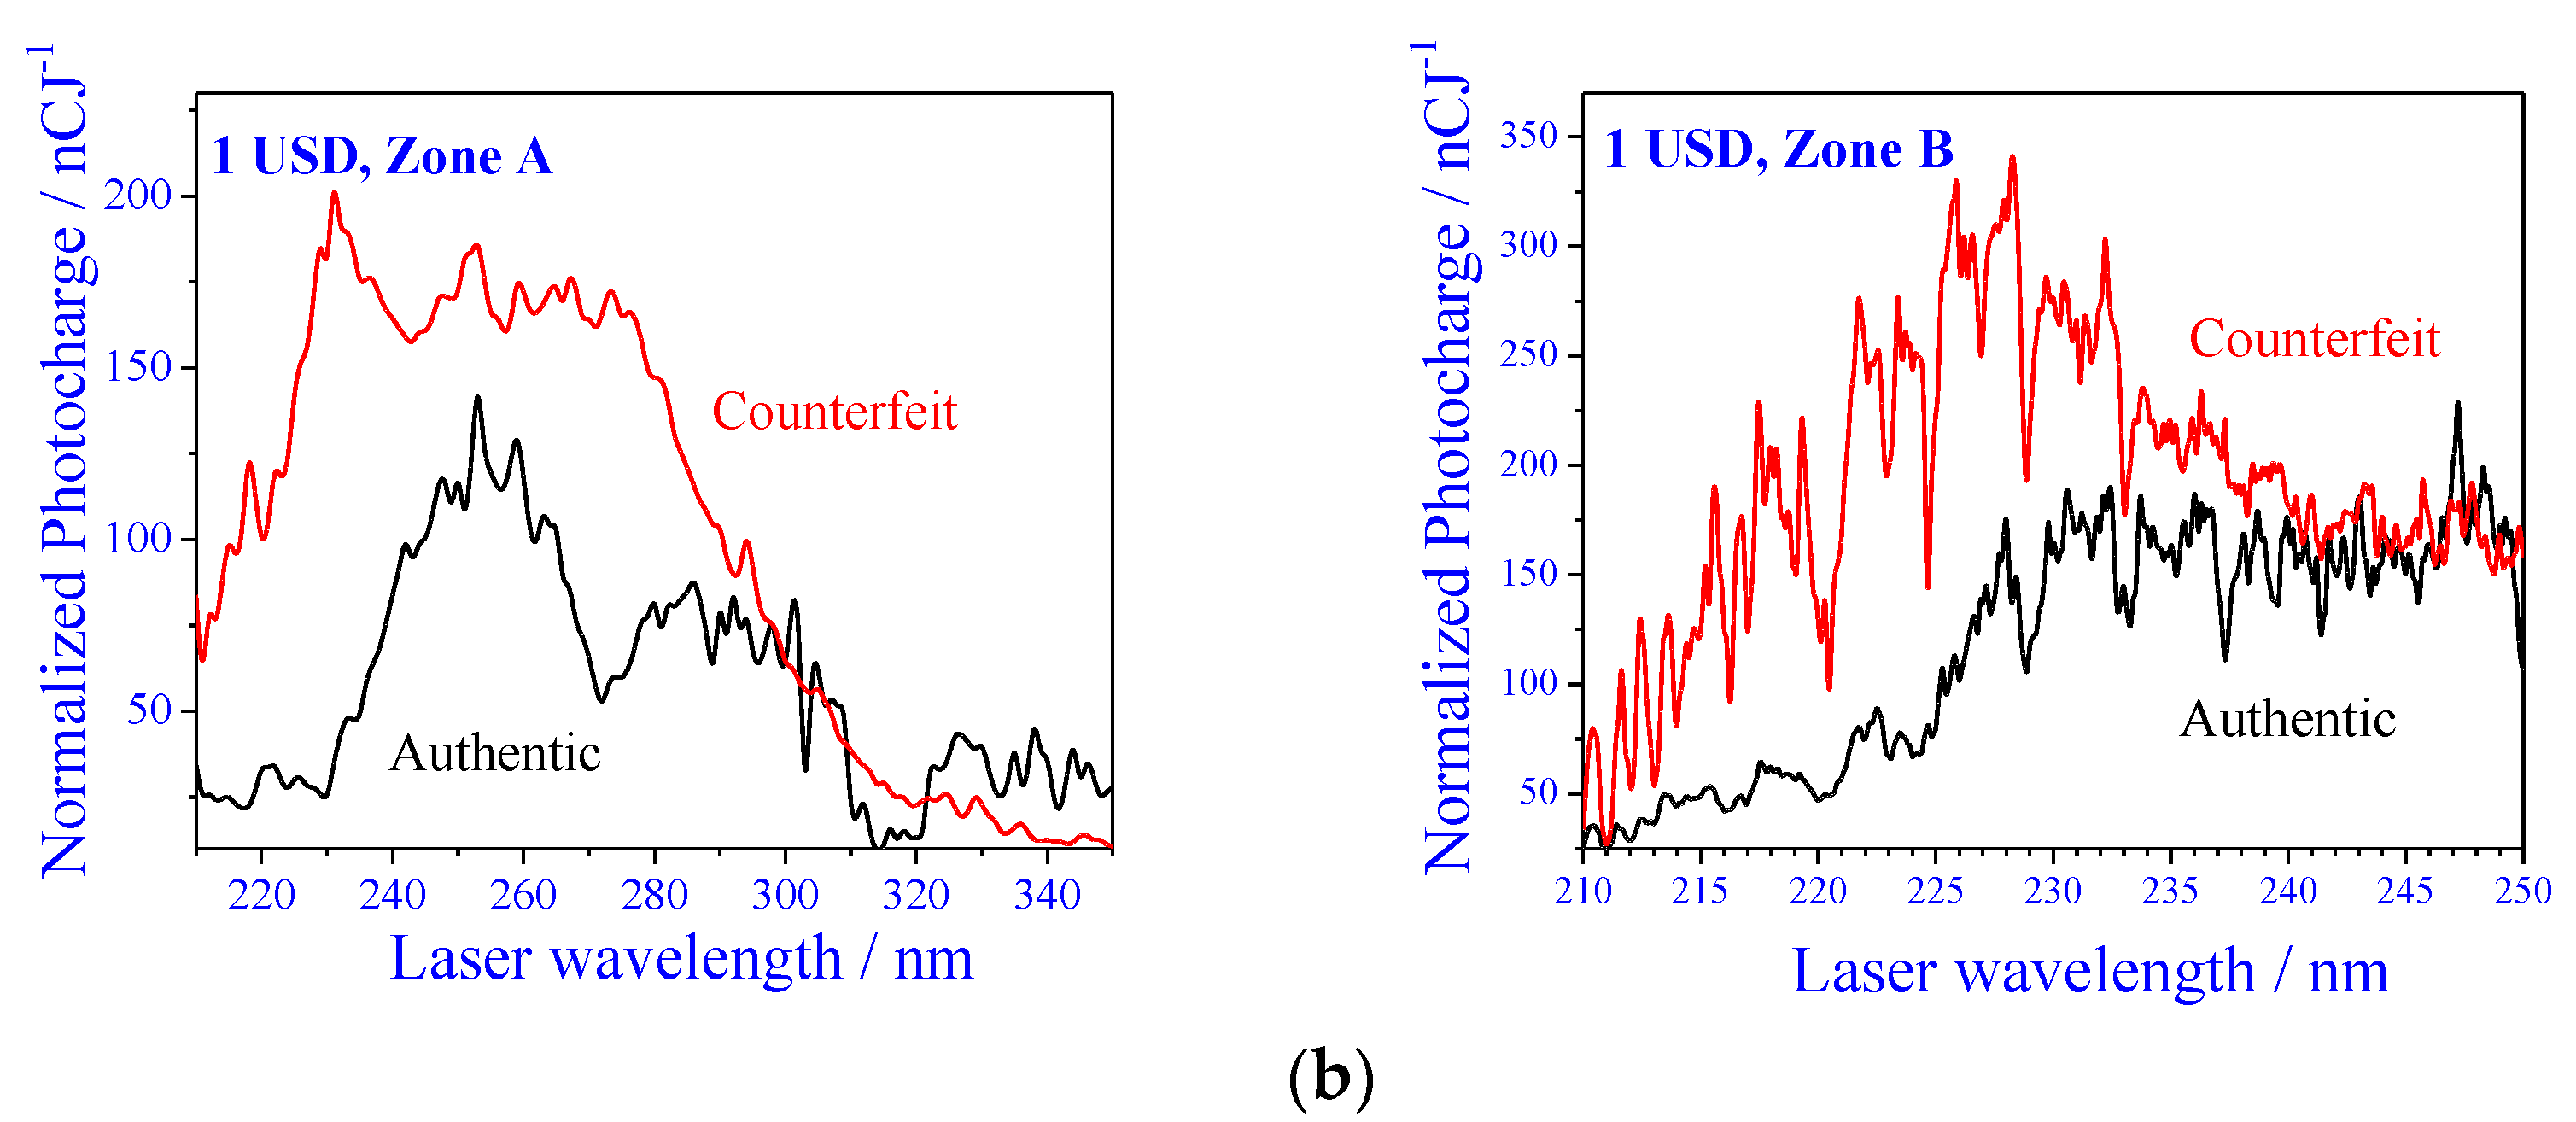
For more detailed examination, a 100 Euro banknote was thoroughly investigated. Firstly, we measured MEES spectra at two zones: “Zone A”: the low-color zone on the left-hand side (red dotted in
Figure 3a) and “Zone B”: the green zone at the right-hand side (purple dashed in
Figure 3a). The measurements were carried out on authentic and on counterfeit banknotes, in the same zones. The results are shown in
Figure 3b.
Clear and significant differences between the spectra measured from the authentic and counterfeit banknotes, in both sampled zones, are observed. The list of the main peaks which are missing in the authentic banknotes and present in the counterfeit (and vice versa) is presented in
Table 2 for Zone A and in
Table 3 for Zone B. In Zone A, a large dissimilarity is quite clear. Zone A is characterized by pretty-low MEES intensities (note the scale), and the spectrum of the counterfeit banknote is higher at most wavelengths. This may indicate the use of a different ink type [
28]. In Zone B, the overall MEES amplitudes are much higher than in Zone A, but also in this case, the spectrum of the counterfeit one is higher than that of the authentic one in wavelengths above 225 nm. The distinction between the authentic and counterfeit bills, based on the spectral peaks is unquestionable. Note that MEES signals of the counterfeit banknotes look noisy, even in Zone B, where the overall intensities are higher. We repeated the measurements several times and scanned in different directions and conditions and reached the conclusion that almost all peaks, except for the very smallest, are repeatable and are not noise. This is related to the fact that MEES spectra represent much more molecular transitions, as compared to single photon spectroscopies. The method reveals many resonances, which result in the many real peaks.
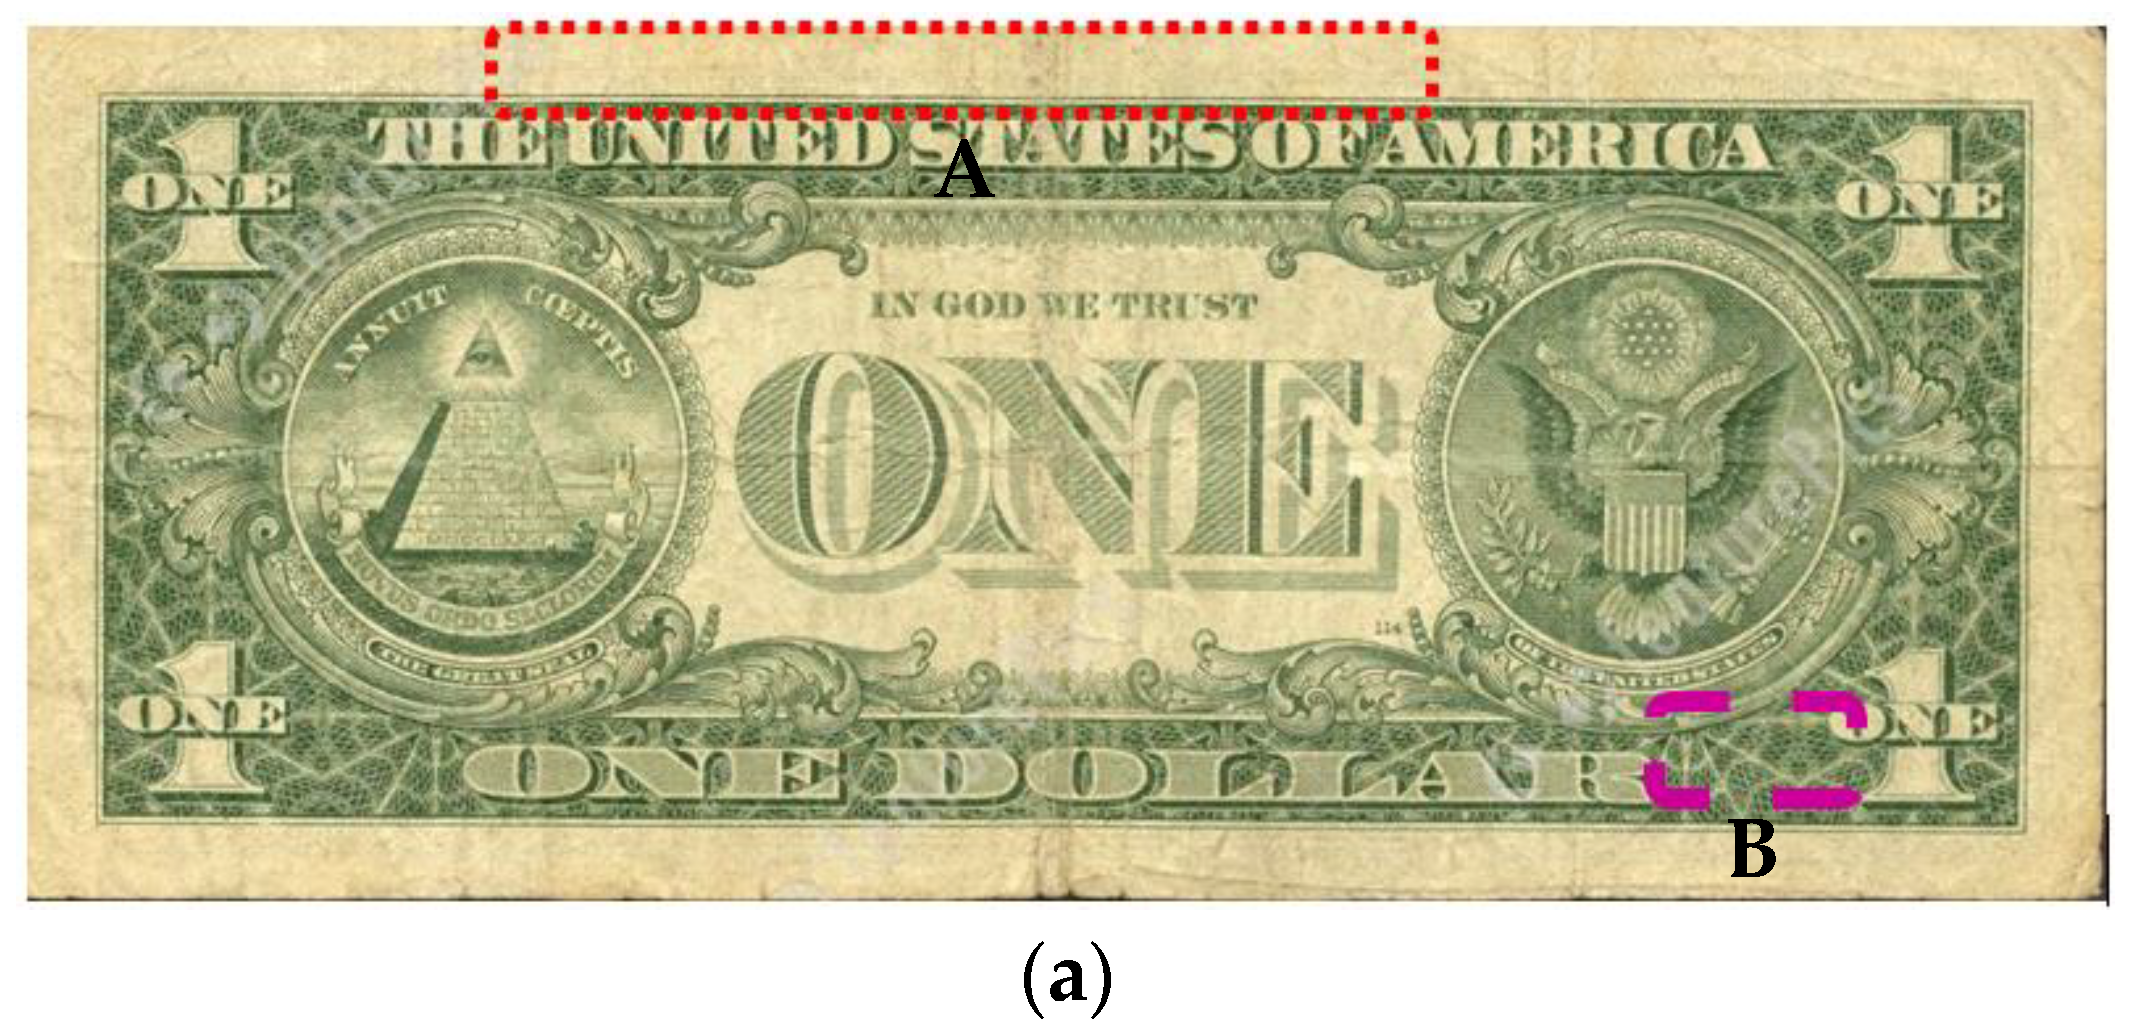
Next, we examined U.S. dollars, in two zones: “Zone A”, on the frame of the bill, red dotted in
Figure 4a, and “Zone B”, a green colored zone, purple dashed in
Figure 4a. These zones were analyzed in both authentic and counterfeit banknotes. The corresponding MEES spectra are shown in
Figure 4b.
Once again, unambiguous results have been observed. For both tested zones, MEES spectra can easily differentiate between authentic and counterfeit banknotes. The list of the main peaks which are missing in the authentic banknotes and present in the counterfeit (and vice versa) is presented in
Table 4 for Zone A and in
Table 5 for Zone B.
Another interesting observation is that in all tested banknotes, the MEES signals are significantly higher for the counterfeit, as compared to the authentic ones (the larger intensity differences are in the shorter wavelength range). Since the exact ink type or composition of authentic banknotes is not in the public domain, we can only assume that those who forge banknotes do not have access to the authentic ink and most probably use commercial/home-made inkjet inks or toners (for laser printing).
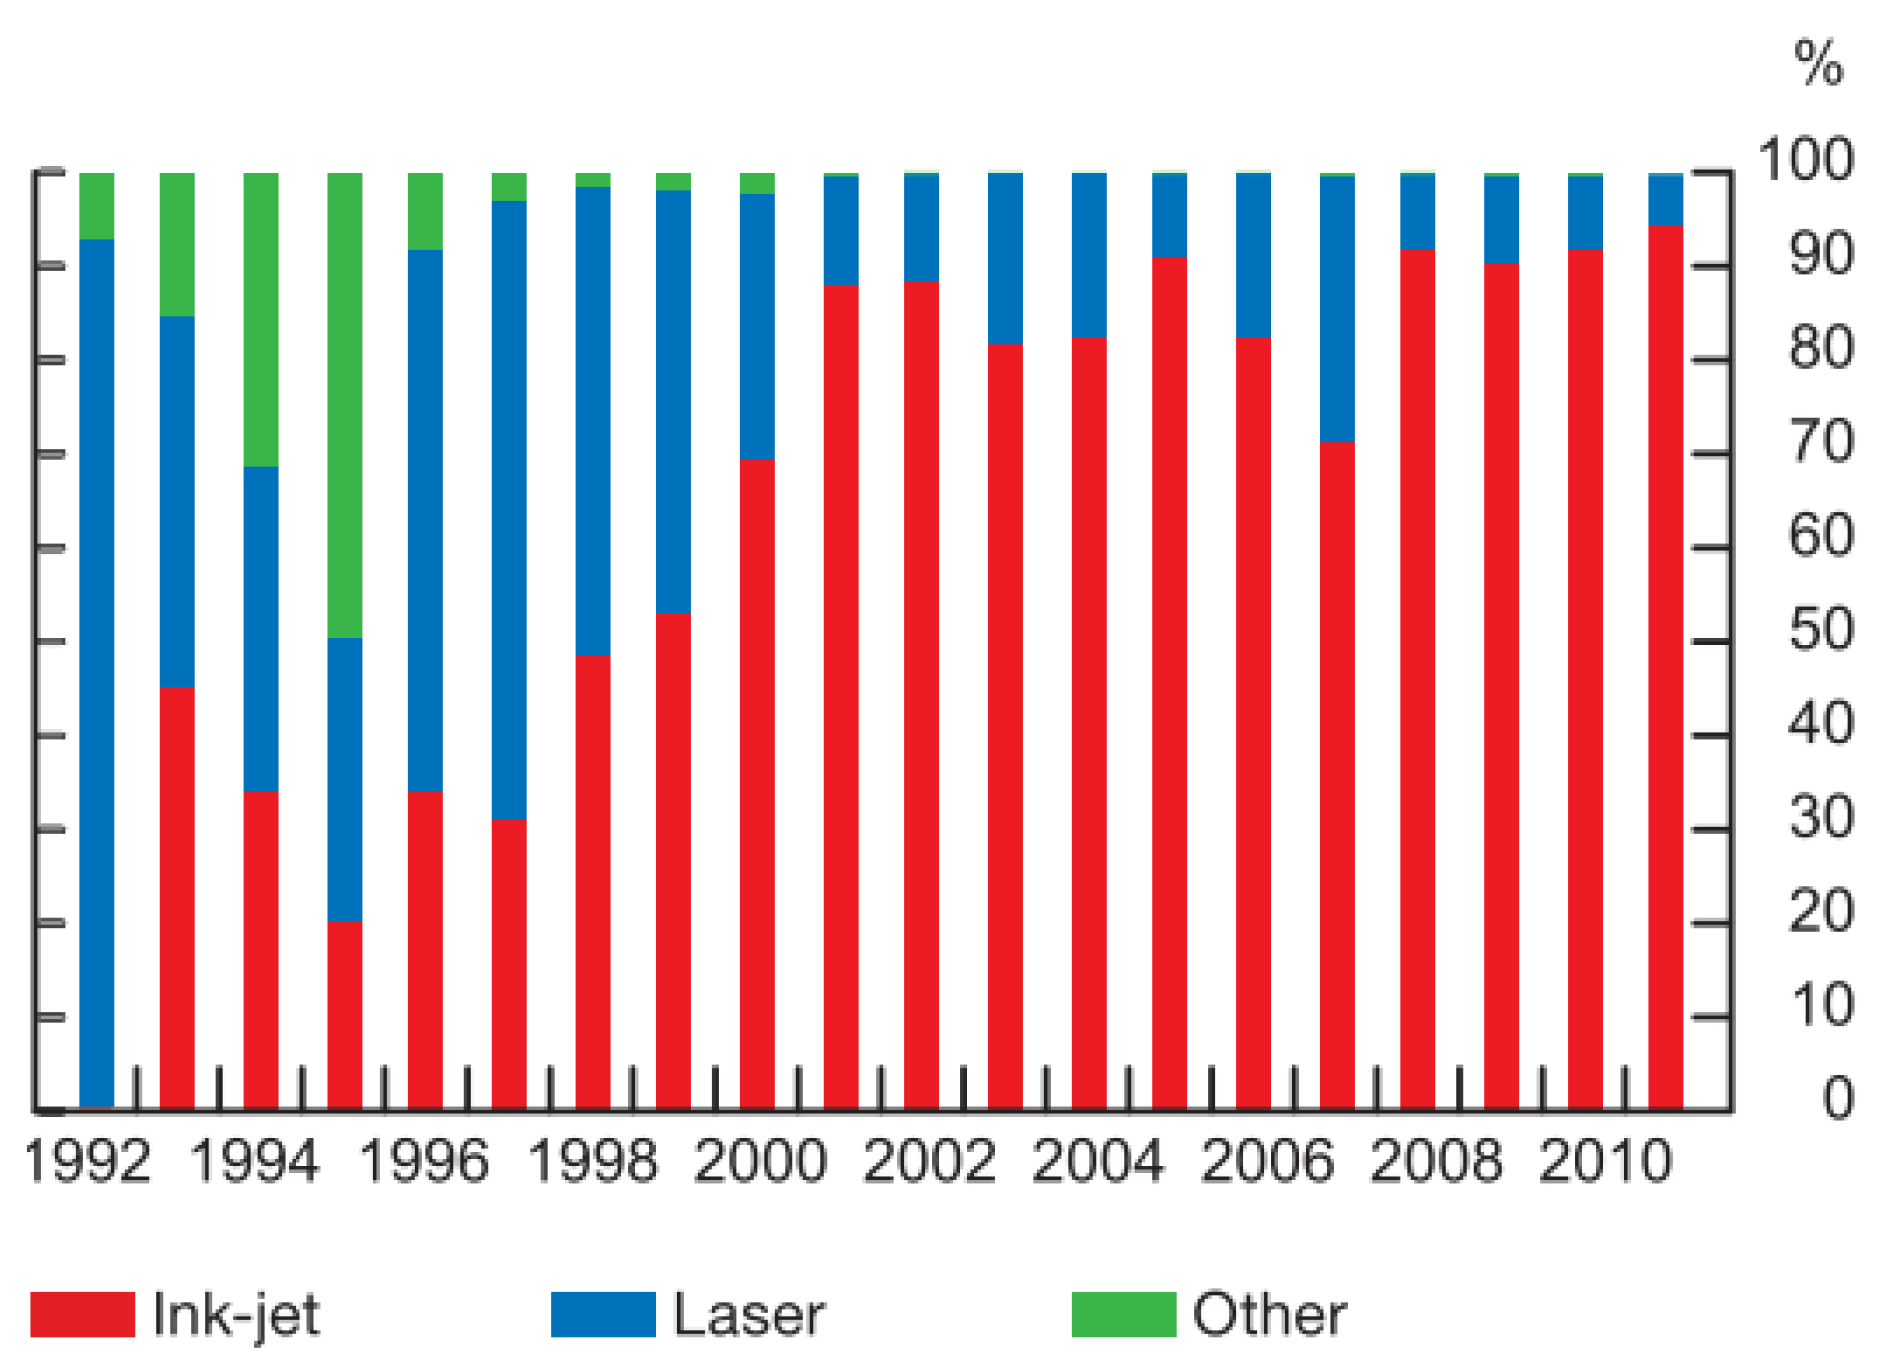
Inkjet printing became more popular among counterfeiters in the last decade [
4]. This is related to the better stability of these inks and the possibility to add metallic colors (which is not possible using laser printers). See, for example, the distribution of counterfeit printing methods in Canada for two decades (
Figure 5) [
29]. While the criminals take good care of obtaining excellent reproduction of the optical emission spectra, their product cannot reproduce the right MEES spectra.
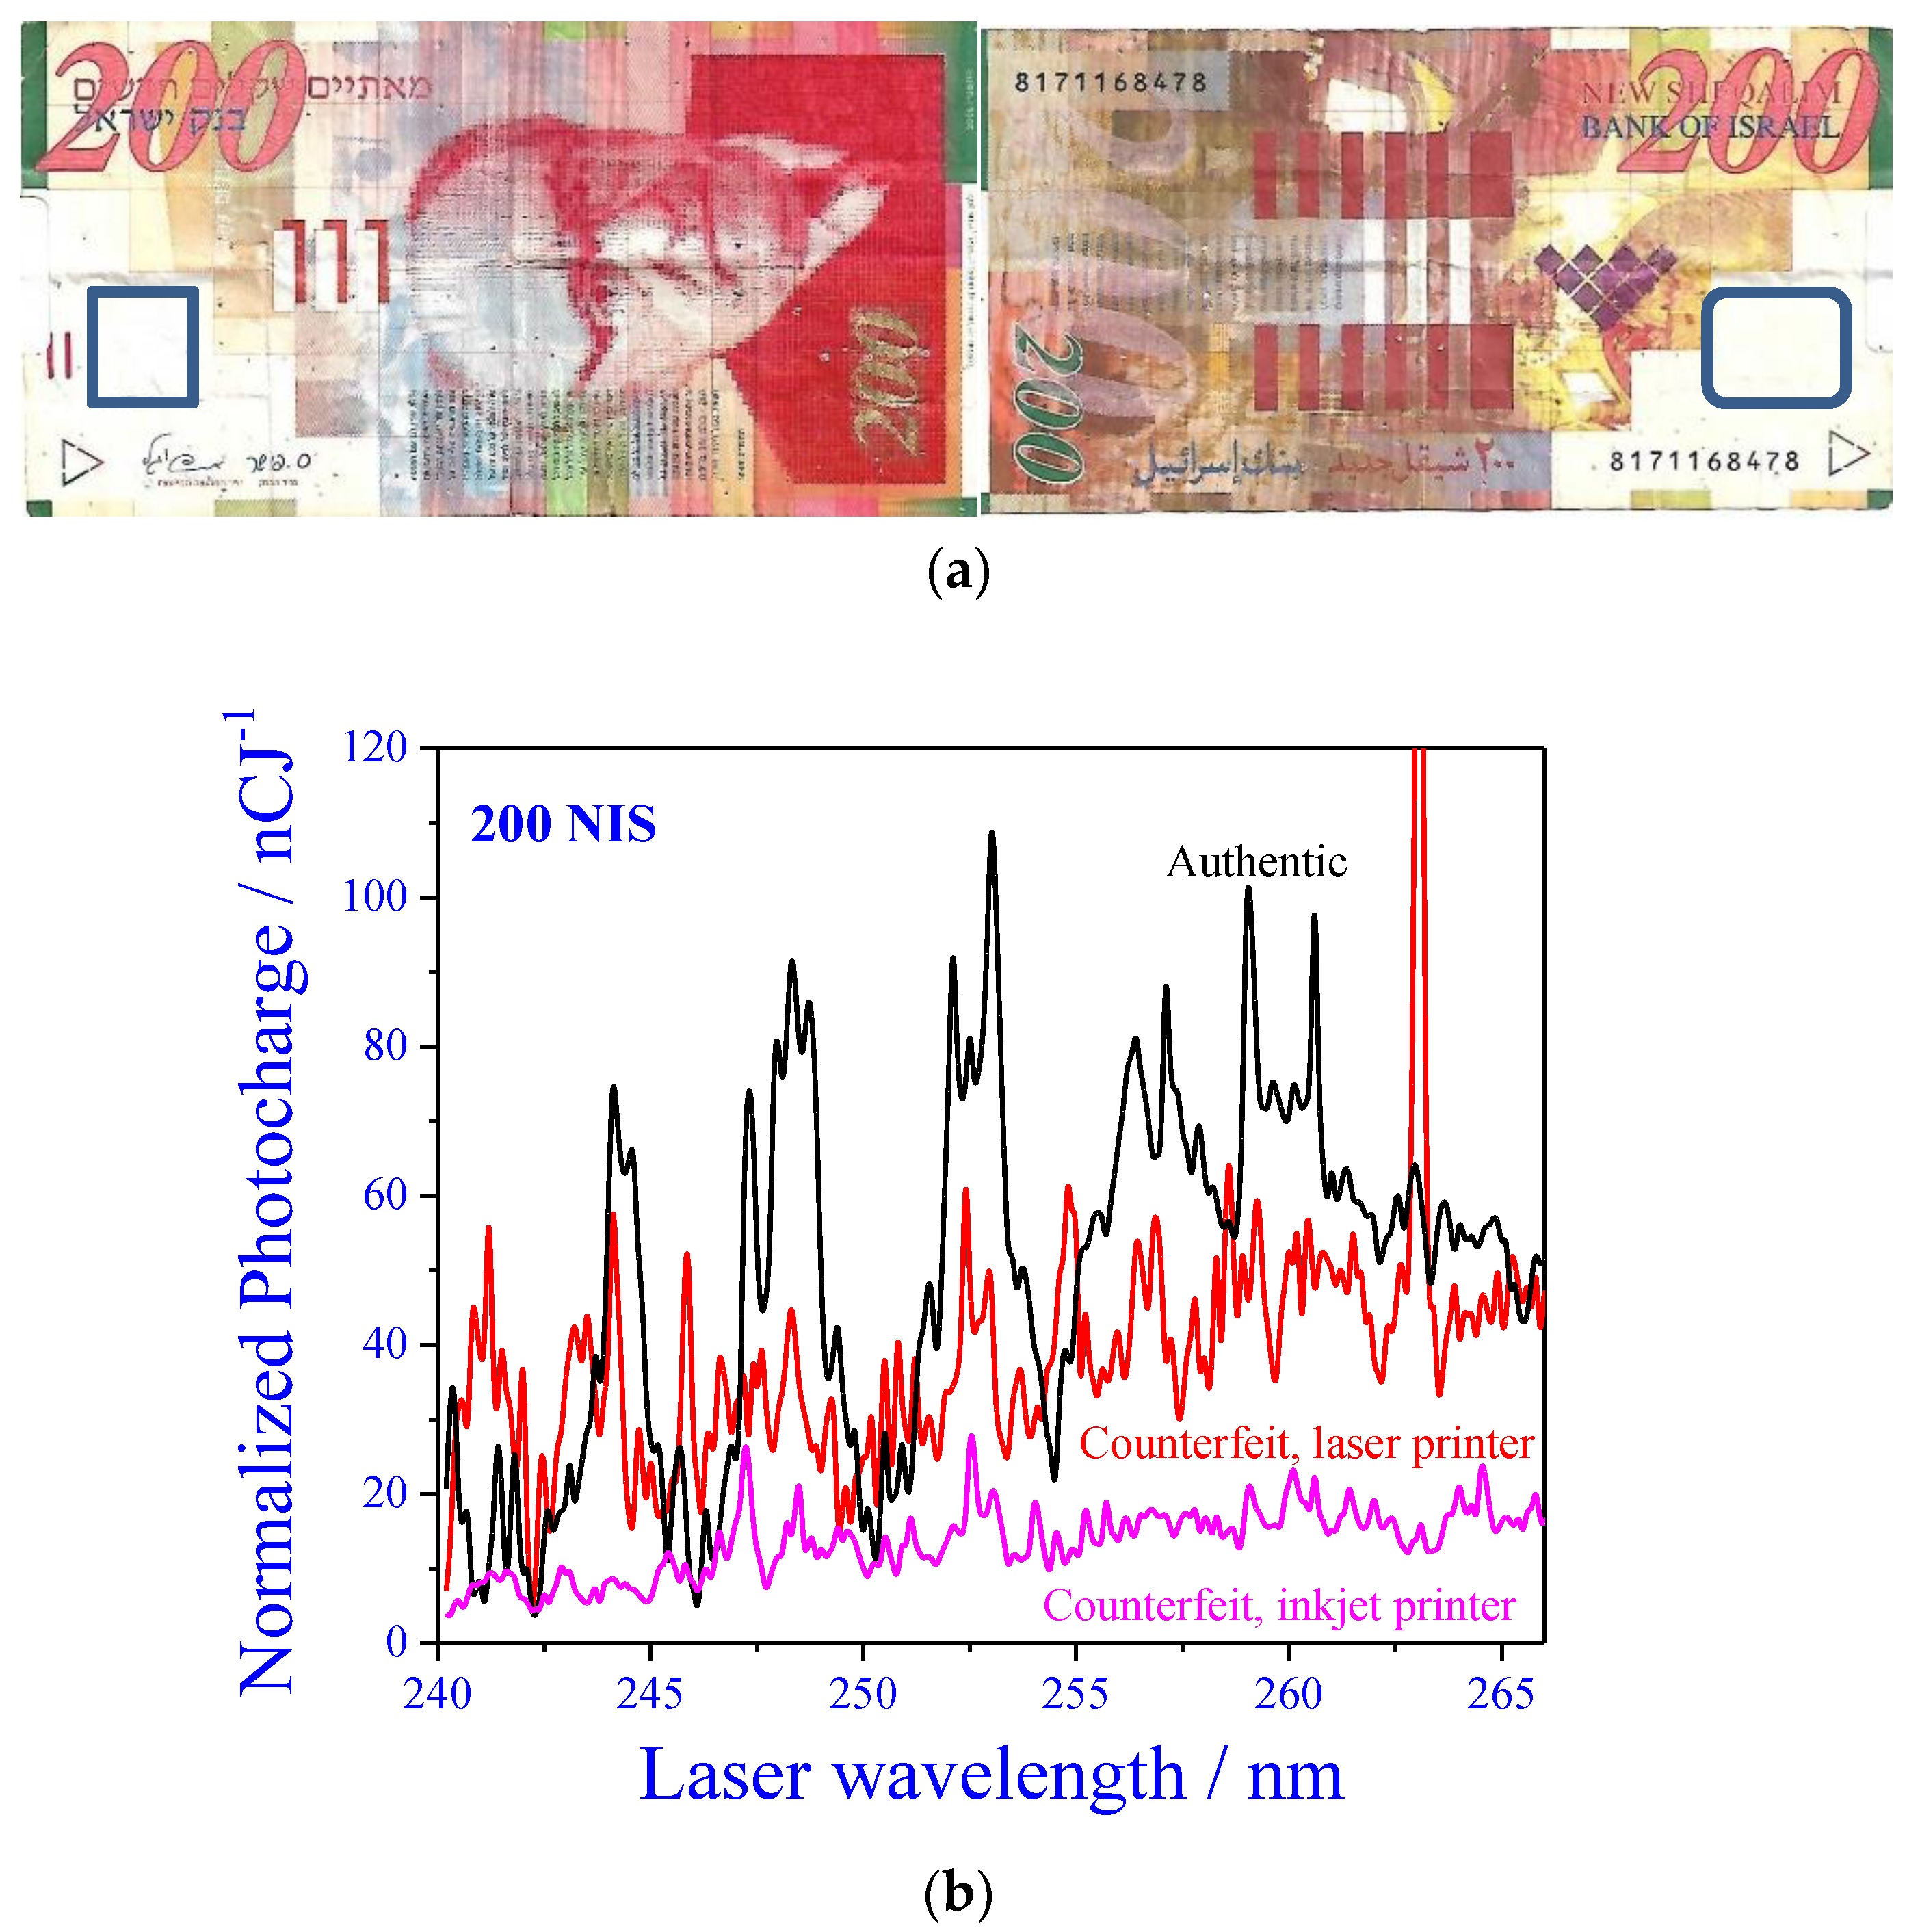
New Israeli Shekel (NIS) banknotes are also forged. According to unofficial estimates, about 250M NIS are forged each year. We analyzed authentic and counterfeit 200 NIS banknotes (which is the most popular banknote in Israel, with ca. 290 million bills in 2018) [
29].
The off-white zones on both sides of the bill, marked in blue in
Figure 6a, were analyzed by MEES. Contrary to foreign currency bills, this time, we obtained better information on the counterfeit banknotes: some of them were printed using inkjet, and others were laser printed bills. The comparison between the MEES spectra of the authentic, laser-printed, and inkjet-printed banknotes is presented in
Figure 6b.
In this case, a clear spectral distinction between the three banknotes is also evident. Another observation is related to the overall MEES intensities: unlike the previous cases, the authentic 200 NIS bills possess the highest MEES signals in most of the analyzed wavelength range. This is probably related to special composition of these bills, but this hypothesis could not be validated, since all information (chemistry and processes) on Israeli banknotes is kept secret. In addition to the significant differences in the peaks, differences in the overall intensities are noted. The intensities from the authentic bills are closer to those obtained from laser printed ones and much higher than those from inkjet-printed ones. Information on the printing mechanism of authentic Israeli banknotes is not in the public domain; however, it could be that they are printed in a process closer to that of a laser printer (namely, fusing of toners).
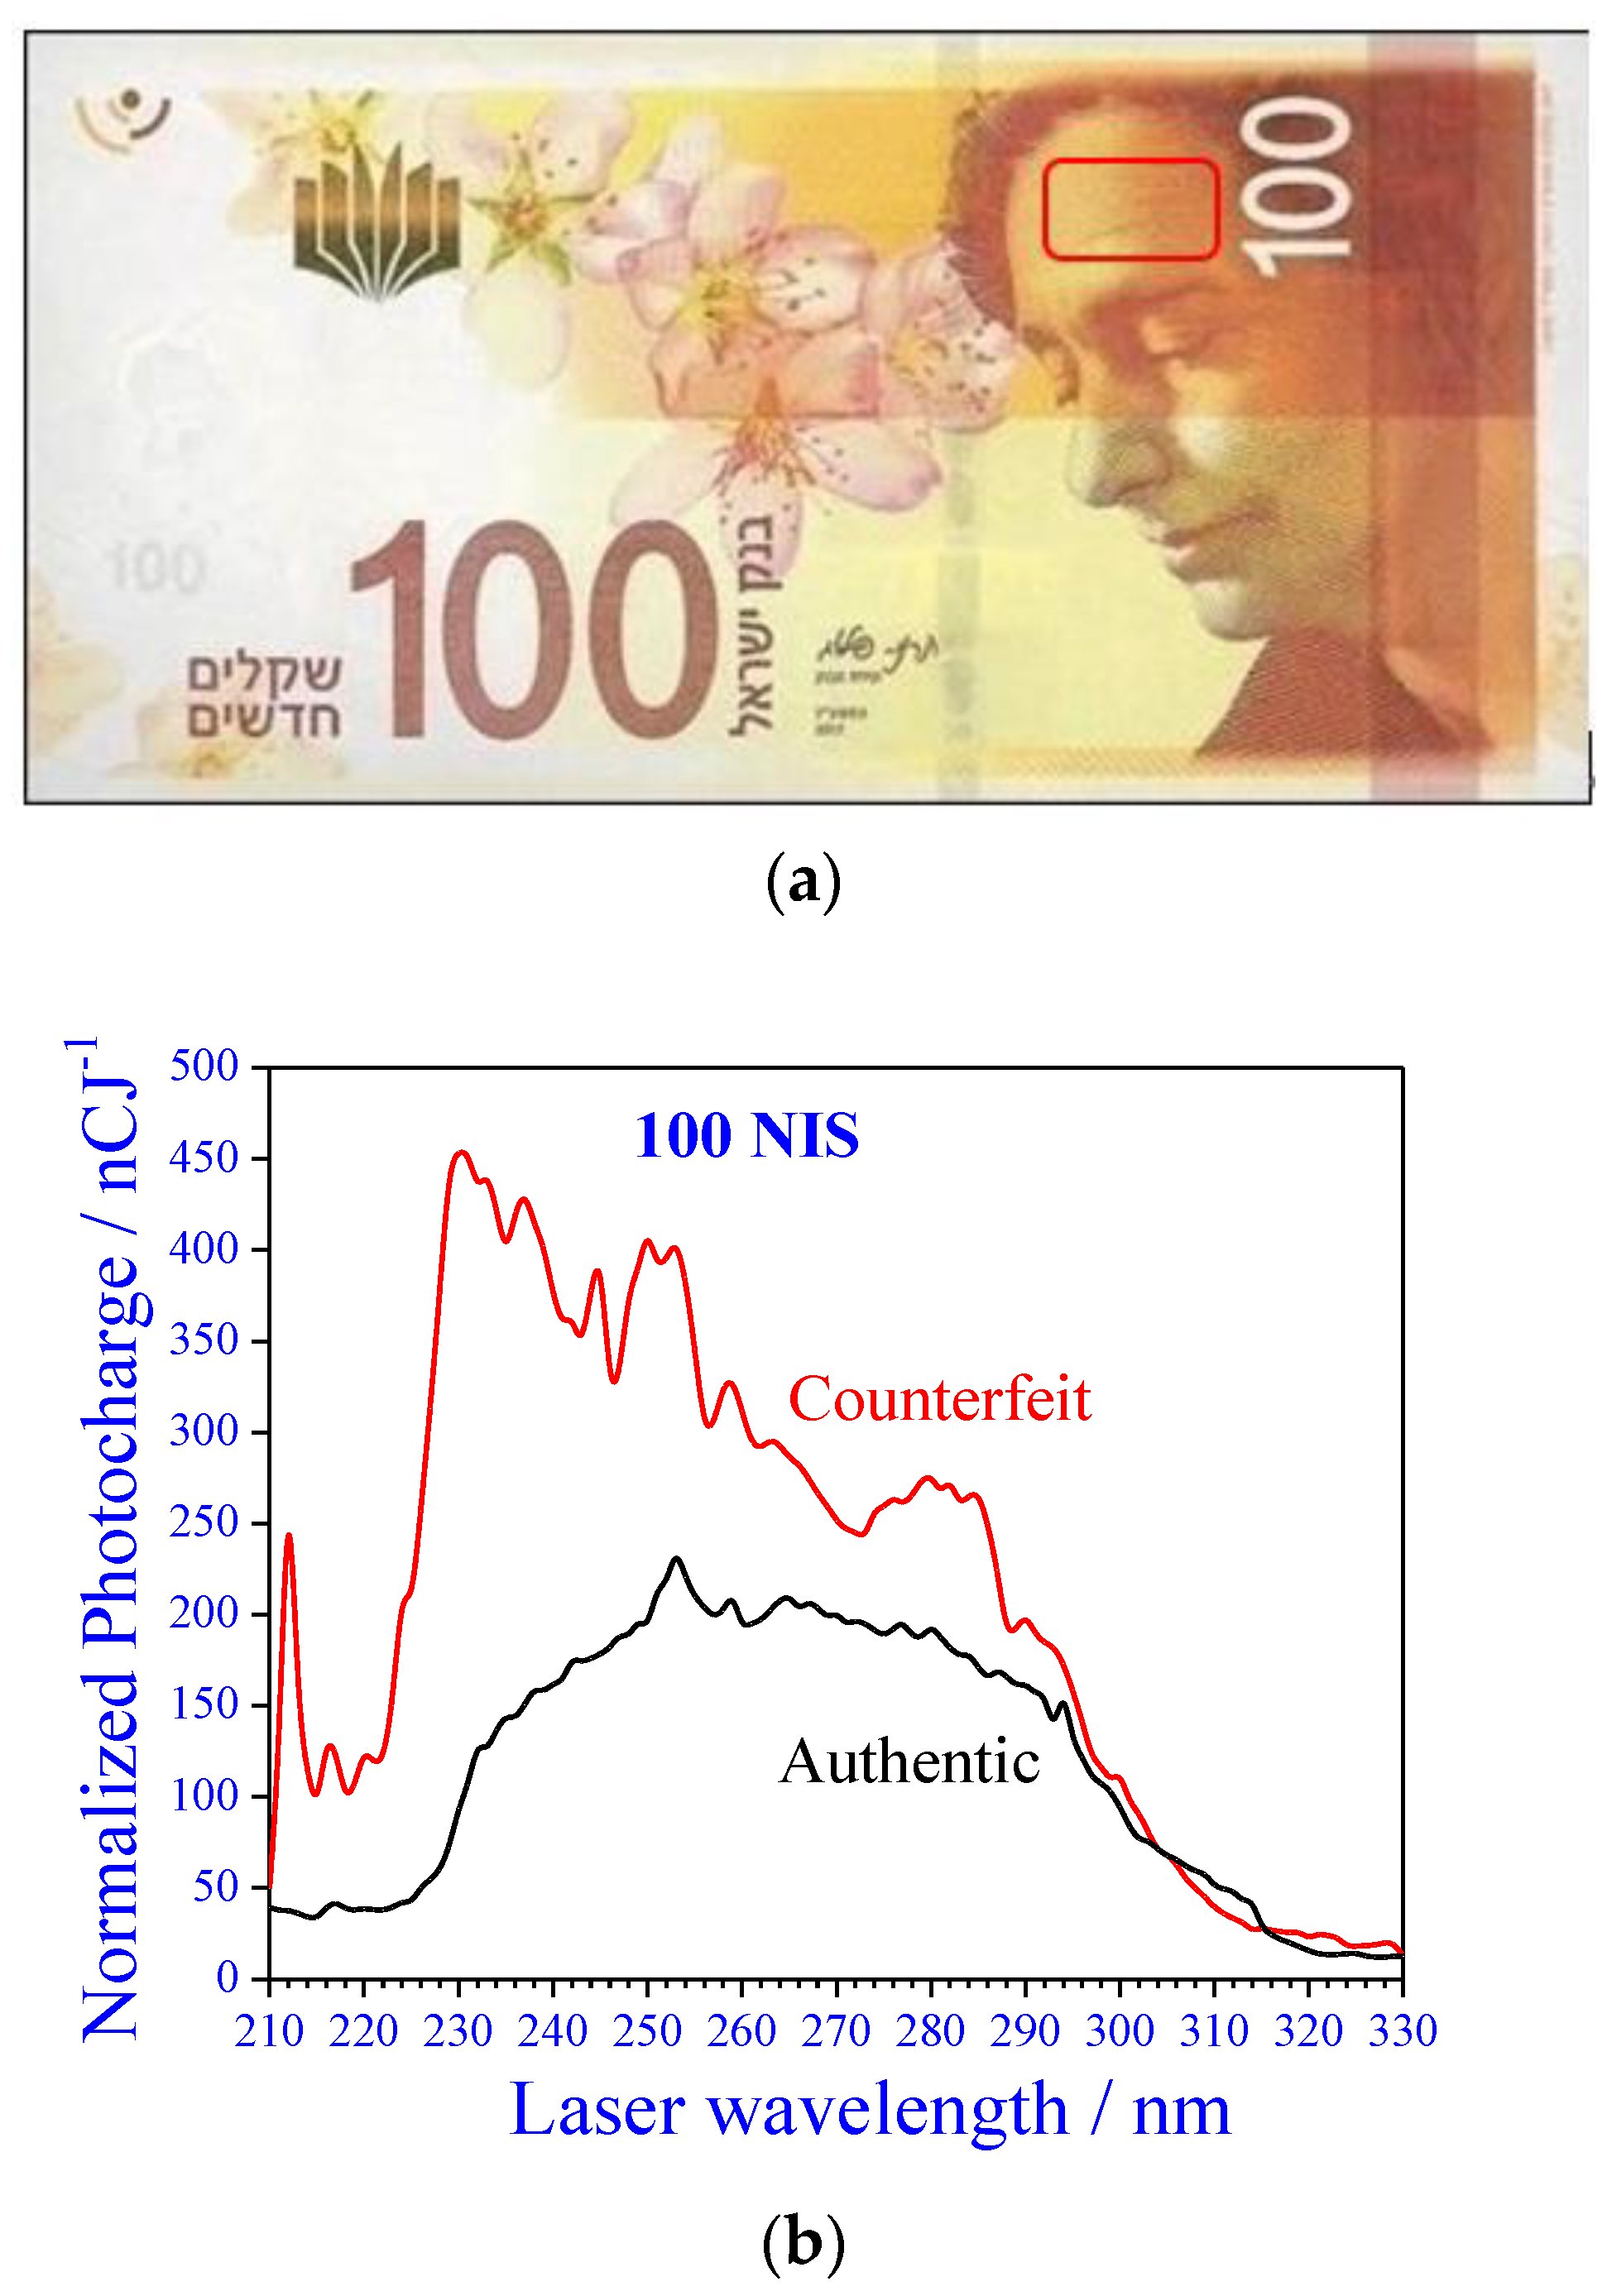
Another interesting case is the 100 NIS banknotes that we received from the Israel Police (Division of Identification and Forensic Science), for which the forgery method was unknown. MEES spectra of these banknotes were compared to those of authentic ones (at the same location), and the results are shown in
Figure 7.
Again, a clear-cut distinction is evident. Based on our previous measurements of various inks, it is possible that a laser printer was used to produce these counterfeit bills. The list of the main peaks which are missing in the authentic banknotes and present in the counterfeit (and vice versa) is presented in
Table 6.


