Abstract
An X-pinch scheme of a low-current generator (45 kA, 50 ns rise time) is characterized as a potential efficient source of soft X-rays. The X-pinch target consists of wires of 5 μm in diameter—made from either tungsten (W) or gold (Au)-plated W—loaded at two angles of 55° and 98° between the crossed wires. Time-resolved soft X-ray emission measurements are performed to provide a secure correlation with the optical probing results. A reconstruction of the actual photodiode current profile procedure was adopted, capable of overcoming the limits of the slow rising and falling times due to the “slow” response of the diodes and the noise. The pure and Au-plated W deliver an average X-ray yield, which depends only on the angle of the crossed wires, and is measured to be ~50 mJ and ~70 mJ for the 98° and 55° crossed wire angles, respectively. An additional experimental setup was developed to characterize the X-pinch as a source of X-rays with energy higher than ~6 keV, via time-integrated measurements. The X-ray emission spectrum was found to have an upper limit at 13 keV for the Au-plated W configuration at 55°. The portable tabletop X-pinch proved to be ideal for use in X-ray radiography applications, such as the detection of interior defects in biological samples.
1. Introduction
Pulsed-power plasma devices loaded as Z-pinch, X-pinch, wire arrays, or liners have the ability to reproduce a vast variety of plasmas, such as dense plasmas for fusion studies, laboratory astrophysics plasmas, dense and hot point-source plasmas for hard X-ray generation, and lower density hot plasmas. Since the first realization by Zakharov et al. [1], X-pinch plasmas driven by pulsed-power machines have been efficiently used as bright-point sources for X-ray radiation in applications such as point-projection radiography of plasmas [2,3], X-ray microscopy for biological samples [3,4,5], and inertial confinement fusion capsules [6]. The small size of these devices and the predictable location of the radiation source [7] also make them favorable for applications such as X-ray backlighting [8] and microlithography [9]. This variety of applications requires an energy range of radiation from 1 to 12 keV [4,10].
In the X-pinch wire configuration, plasmas are typically produced by two wires touching at the cross-point, forming an “X”. At that point, a hot, dense plasma is produced (the pinching effect), and energetic X-rays (~1–8 keV) are emitted for a short ns or sub-ns time duration [11]. Moreover, the X-ray burst can be related to the hot-spot (size ~1 μm; electron temperature ~1 keV) formation [11]. Progressively, and immediately after the generation of the thermal X-ray burst, a very low plasma density gap of several mm, which is accompanied by the generation of an electron beam, is formed. This process leads to non-thermal X-ray radiation, which is associated with bremsstrahlung photons—in the ~8–100 keV energy range—produced by electrons accelerating across that gap [12,13].
The aim of this study is to characterize the X-pinch scheme as an efficient source of soft X-rays. A tabletop pulsed-power plasma generator, hosted at the Institute of Plasma Physics and Lasers (IPPL) of the Hellenic Mediterranean University (HMU) Research Centre, has previously been used for optical probing experiments of Z-pinch [14,15,16] and X-pinch wire configurations [17], and time-integrated X-ray spectroscopic measurements of the radiation produced by X-pinch loads have been performed [18]. Herein, a new analysis of time-resolved soft X-ray emission measurements is performed to provide a secure correlation with the optical probing results. Additionally, the use of the X-pinch configuration as an X-ray source for energies greater than 6 keV is characterized, and its applicability in X-ray radiography applications is evaluated.
Our X-pinch device lies at the lower peak current range of X-pinch generators [19]. To the best of our knowledge, such a generator has not been used previously to deliver X-ray radiographs of biological samples, using photons in the range between 6 and 13 keV, produced by fast-rise-time (≥1 kA/ns) X-pinch generators [20]. Furthermore, a reconstruction of the actual photodiode current profile procedure is adopted for time-resolved X-ray measurements for first time. This procedure allows for overcoming the limits of the “slow” response of the diodes and the noise. The compact tabletop X-pinch used for X-ray radiography is proven to be ideal for the detection of interior defects in biological samples.
2. Materials and Methods
A tabletop pulsed-power plasma generator able to produce a peak current of ~45 kA, with a rise time (10–90%) of 50 ns, loaded with two thin wires of 5 μm initial diameter, forming an X-pinch load, was used in the experiments. The distance between the anode and cathode was 15 mm. A detailed description of the pinch device, including a 3D design as well as the functional specifications, is given in [14], while details about the laser-probing plasma diagnostics—such as three-frame Mach–Zehnder interferometry and three-frame focusing shadowgraph layouts—can be found in [16]. Four different two-wire configurations were tested: (1) tungsten (W) wires loaded at an angle between the crossed wires of 55°, (2) W wires loaded at an angle of 98°, (3) gold (Au)-plated W wires at an angle of 55°, and (4) Au-plated W wires loaded at an angle of 98°. The chosen angles follow the suggestions of [21]. W is an ideal material for such studies, since it results in efficient pinching for the current of 45 kA [22], and yields a very small X-ray source size [10]. On the other hand, the Au coating thickness used on the plated W wires was 0.09 μm for all of the experiments presented in this article. High-atomic-Z-number materials such as the Au coating are expected to decrease the rate of energy deposition within the core and, therefore, prohibit the formation of high-density plasma [23], which may lead to a modified emitted power spectrum and total X-ray yield.
Figure 1 shows the (a) top and (b) front views of the vacuum chamber of the X-pinch device, along with the three diagnostics (i.e., point-projection radiography diagnostic, X-ray PIN diodes, and pinhole camera) connected to three of the nine ports of the chamber. An NW40 flange was used to connect two silicon P-type intrinsic N-type (PIN) semiconductor diode detectors onto one of the nine ports of the vacuum chamber for the time-resolved X-ray measurements. Figure 1c,d schematically present the point-projection radiography and the pinhole camera, respectively.
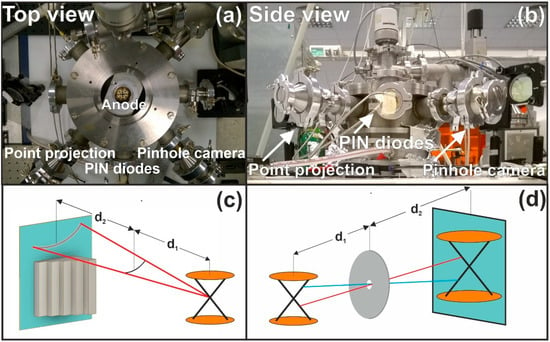
Figure 1.
(a) Top and (b) side views of the vacuum chamber of the X-pinch device, and of the three diagnostics—namely, the X-ray point-projection radiography, the PIN diodes, and the pinhole camera. Illustration of the (c) point projection and (d) pinhole camera methodology.
For the time-resolved measurements, filtered photodiodes were used, mounted on SubMiniature version A (SMA) female connectors. A suitable biasing circuit [24] was used to supply each detector for the X-pinch experiments. The spectral sensitivity S(E)f of the detector in the presence of a filter is determined by the equation:
where S(E) is the intrinsic spectral sensitivity of the photodiode as a function of energy E, while T(E), μ(E), and τ are the filter transmission, the linear attenuation coefficient, and the thickness of the filter, respectively. The sensitivity curve of the used BPX65 PIN detectors over the photon energy ranges from 0.1 to 20 keV [24].
The developed experimental scheme of the point-projection radiography, presented in Figure 1c, implies a point source of photons, such as an X-pinch to project the shadow of the sample on a photographic film. In our case, the source was located at a distance of d1 = 155 mm in front of the sample, and the photographic film was fixed behind the sample at a distance of d2 = 82 mm, achieving a magnification of M = (d1 + d2)/d1 ≈ 1.53. Furthermore, an Al step wedge of six steps was used for the spectral analysis of the X-ray source. The finest step of the wedge had a thickness of 15 μm, which was multiplied by 2 at every next step. The geometric resolution (or penumbra zone width) Δx = S(d2/d1) ≈ 0.53 S of a point-projection system is primarily determined by the size S of the photon source [25].
The pinhole camera provides time-integrated images of the X-ray source. The dimensions of the spot size of the X-ray source define its suitability for the point source projection radiography. The pinhole was set at a distance of d1 = 83 mm from the X-pinch, and at a distance of d2 = 150 mm from the film, offering a magnification factor M1 of d2/d1 ≈ 1.81, provided that the characteristic source diameter ds was much larger than the pinhole diameter. The diameter of the pinhole was d = 1.5 mm; therefore, the geometric resolution was Δx1 = d (1 + d1/d2) ≈ 2.33 mm. When the size of the source is much smaller than d, the source projects the shape of the pinhole onto the film plane with a magnification factor of M2 (d1 + d2)/d1 ≈ 2.81, and a typical resolution Δx2 of ds (M2 −1) = ds M1.
Figure 2a shows the graph of the filtered BPX65 PIN diode’s spectral sensitivity as a function of the photon energy, for the Al (15 μm) and Cu (10 μm) filters used in this study. The Al filter was added to detect X-ray energies higher than 1 keV, while the Cu-filtered PIN diode is sensitive in the range of 3.4–9 keV. Furthermore, the sensitivity curves have zero-valued regions that correspond to the X-ray absorption K-edge, at 1.56 keV and 8.99 keV for the Al and Cu filters, respectively. The film used as an X-ray detector for the X-ray radiograms was an Insight intraoral F-speed dental film, delivered in a package of paper foil of 125 μm thickness and a vinyl case of 175 μm thickness. Figure 2b shows their X-ray transmission profile, as well as the total transmission having a cutoff energy threshold of ~6 keV.
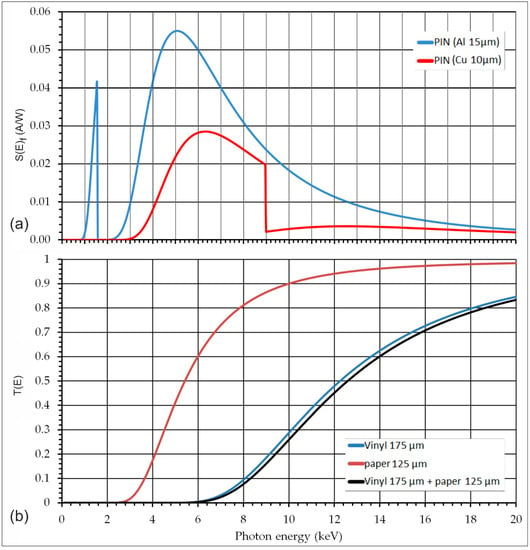
Figure 2.
(a) Filtered BPX65 PIN photodiode’s spectral sensitivity as a function of the photon energy, for the Al (15 μm) and Cu (10 μm) filters. (b) X-ray spectral transmission profile of the film package: paper foil (125 μm), vinyl case (175 μm), and the overall transmission of the package.
3. Results and Discussion
The time-resolved soft X-ray emission measurements and the X-ray radiography results are presented and discussed in this section.
3.1. Time-Resolved Soft X-ray Emission Measurements
A set of experiments was performed, and a variety of electrical signals were recorded on the oscilloscope at a sampling rate of 5 GS/s. Figure 3 shows typical results of four different X-pinch wire loads, and especially for W and Au-plated W wires crossed at 98° and 55°. Each plot represents the Al-filtered PIN X-ray signal in blue, the Cu-filtered PIN X-ray signal in green, the PIN laser probe signal in red—which determines the arrival time of the laser pulse used for the optical probing diagnostics in relation to the current start—the (dI/dt) time derivative of the current I of the X-pinch load waveforms obtained from the nonintegrated Rogowski coil in purple and, finally, the corresponding waveform of the current obtained via the numerical integration of dI/dt in brown; it should be noted that the actual current is equal to the normalized I by a constant of ~1.25 × 10⁻⁹ H, which is the mutual inductance value of the current monitor (Rogowski coil).
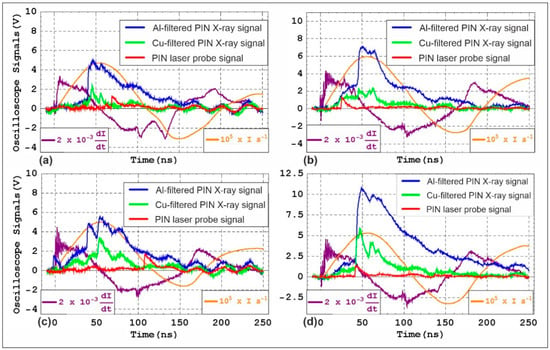
Figure 3.
Typical electrical signals as recorded on the oscilloscope for the X-pinch loads: (a) W wires crossed at 98°, (b) W wires crossed at 55°, (c) Au-plated W wires crossed at 98°, and (d) Au-plated W wires crossed at 55°. The dI/dt and I waveforms are plotted in purple- and brown-colored lines, respectively.
Multiple peaks that correspond to the phases of the plasma evolution were observed at the presented X-ray burst signals. The Al-filtered PIN X-ray signal in every case, and for the time window of 40–50 ns, shows a peak after the current start. This can be attributed to the formation of the bright spot at the cross-point [26]. The peaks that follow can be attributed to an electron beam interacting with the remaining wire material and the anode [26]. However, these plasma phases—and especially the hot-spot generation—are difficult to recognize. Thus, a reconstruction procedure of the actual photocurrent Iph profile was adopted in order to overcome the limits of the slow rising and falling times due to the “slow” response of the diodes and the noise.
Figure 4a shows the measured electrical signals of a typical shot for the two-W-wire X-pinch load crossed at an angle of 98°. The X-ray signals determine the first peak at 50 ns which, as already mentioned, is correlated to the hot-spot generation. However, the inset interferometric image captured at 45 ns, as revealed by the first peak of the red curve, depicts the formation of a gap at the initial location of the cross-point. This observation determines that the pinching has already occurred. To overcome this inconsistency, the photocurrent Iph was reconstructed for each diode. The first step of the reconstruction process is presented in Figure 4b. The soft X-ray waveforms were filtered by a second-order low-pass Butterworth filter to eliminate the high-frequency electromagnetic noise generated by the switches [14]. Moreover, the Al-filtered and the Cu-filtered X-ray signals, as well as their ratio waveforms, are presented. The low-pass filter has a cutoff frequency at 1 GHz, which is 2.5 times lower than the sampling frequency. At the second step of reconstruction, a simplified equivalent operating circuit [27] was analyzed in order to be used in the calculation of the photocurrent Iph (Equation (2) below), for each diode. The original electrical signal on the oscilloscope Vscope was used, with the typical values of 20 nF for the diode junction capacity Cj, and 200 Ω for the series resistance Rs. The load resistance RL was set to be equal to the input resistance of the oscilloscope, at 50 Ω.
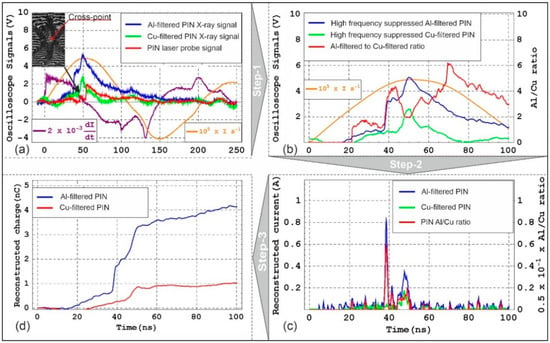
Figure 4.
(a) Electrical signals of a typical shot. (b) Signals resulting from the first step of the reconstruction procedure. (c) Reconstructed current wave forms for the two filtered PIN diode signals, and for their ratio. (d) Time integral of the reconstructed current. The dI/dt and I waveforms are plotted in purple- and brown-colored lines, respectively.
In Figure 4c, the reconstructed current waveforms for the two diode signals and their corresponding ratio are demonstrated. The first peak of the Al-filtered PIN signal waveform occurs at 38 ns, which is also when the hot spot is generated, 7 ns before the interferometric image capture, with an FWHM pulse duration of ~3 ns. A flat and very small Cu-filtered PIN signal was also recorded. Therefore, the soft X-ray emission spectrum is less than the lower limit of 3.4 keV (see Figure 2a), and corresponds to the thermal processes within the X-pinch cross-point region. A soft X-ray burst was observed within the time interval of 45–50 ns, and was recorded by both diodes. This X-ray emission occurred after the pinching time, corresponding to bremsstrahlung radiation emitted by a cascade of electrons, accelerated across the anode–cathode gap [12,13]. Considering the X-ray emission to be isotropic, the energy-filtered X-ray emission yield YX-ray of the source can be related to the reconstructed current of the diodes in the region of their sensitivity:
where r is the distance of the diode from the X-ray source, A is the active surface of the diode, and is the energy average of the spectral sensitivity in the presence of a filter. The sensitive area of the BPX65 PIN detector is 1 mm2, while the distance between the cross-point of the X-pinch load and the diodes is 150 mm. For the aforementioned range of energy, the average spectral sensitivity of Al- and Cu-filtered PIN diodes is 0.015 A/W and 0.02 A/W, respectively.
Figure 4d shows the time integral of the reconstructed photocurrent. For the time interval of 38–50 ns, where the Al-filtered diode was conductive, the electrical charge was calculated to be 2.8 nC, while for the Cu-filtered diode the corresponding time interval was 45–50 ns, and the electrical charge was 0.4 nC. The pure and Au-plated W have an average X-ray yield with the Al-filtered PIN (1–20 keV), depending on the angle of the wire configuration—estimated to be ~50 mJ and ~70 mJ for the X-pinch load angles of 98°and 55°, respectively. Moreover, the X-ray energies from 3.4 to 9.0 keV contribute to the total X-ray yield at a percentage of less than 15%, as shown by the analysis of the Cu-filtered PIN data.
For a series of shots, Figure 5a,b demonstrate the PIN diodes’ current values as a function of time for all of the X-pinch configurations, for the first and the second peaks, respectively. The vertical and horizontal error bars correspond to a 20% variation in the average peak current and average peak time, respectively. In Figure 5a, at 44.5 ns, it is evident that the W wire and the Au-plated W wire configurations loaded at a crossed angle of 98° have the same average value of 0.4 A, confirming that in this case the results are independent of the Au coating. The greater X-ray average power was obtained by the Au-plated W wire configuration load crossed at 55°, compared to the other configurations, resulting in an average peak current of 0.84 A at 48.5 ns. Moreover, all of the results of the PIN diodes’ peak current values corresponding to the maximum X-ray intensity presented in Figure 5a have a smaller amplitude when the first X-ray burst is delayed. Figure 5b shows that the Au-plated W wires crossed at 55° and 98° have the same average current value of 0.3 A at 58 ns, suggesting that the load’s crossed angle does not affect the results. The resulting average peak current values for the pure W are 50% lower than those of the Au-plated W.
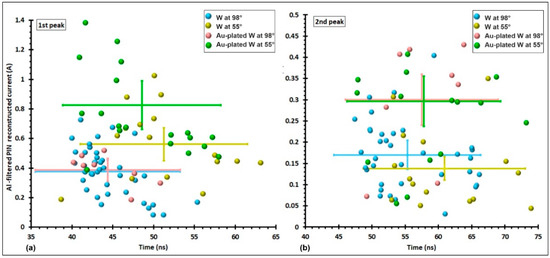
Figure 5.
Reconstructed PIN diode current values as a function of time for all of the X-pinch configurations, for the (a) first and (b) second peaks.
The first X-ray burst, as discussed above, corresponds to “thermal” soft X-ray radiation and, considering the Planckian-type spectrum, the effective plasma electron temperature can be calculated by the ratio of the Al-filtered to Cu-filtered PIN signals [28]. This ratio is presented in Figure 6a, and corresponds to the first burst peak of each configuration. The boxplots in Figure 6 provide a standardized and consistent means of displaying the dataset based on a five-number summary: the minimum, the maximum, the median (0.5), and the first (0.25) and third quartiles (0.75). In Figure 6a, the median value of the ratio for W wires crossed at 98° is 4.3, while at 55° it becomes 3.6. These ratios are 6.6 and 4.4 in the case of the Au-plated W wires crossed at 98°and 55°, respectively. Figure 6b shows the Planckian-type power spectrum as a function of the energy using the median values of the ratios. For W wires crossed at 98° and 55°, the temperature is 720 eV and 810 eV, respectively, while for the Au-plated W at 98° and 55° it is 580 eV and 710 eV, respectively. The lower temperature values of the Au-plated W compared to the W results can be attributed to the lower heat of vaporization for Au [23]. As discussed in the previous section, when a high-atomic-number (Z) material such as Au is used as a coating over a wire made of a material such as W—with a lower Z-number, but with a higher melting point and greater resistivity—the rate of energy deposition within the core is very slow. Therefore, the formation of high-density plasma and, subsequently, of the pinching effect, is not easily achieved.
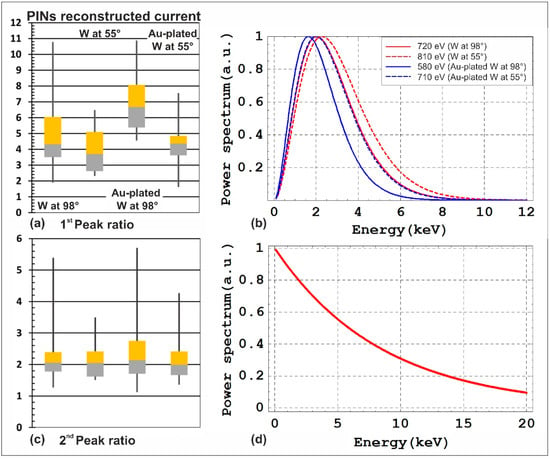
Figure 6.
(a) Boxplot of the reconstructed current corresponding to the 1st X-ray burst peak ratio. (b) Power spectrum as a function of energy for the four examined configurations, using the median values of the ratios. (c) Boxplot of the reconstructed current corresponding to the 2nd X-ray burst peak ratio. (d) The power spectrum for ratio 2.5.
From the above analysis, which leads to the temperature distribution of the power spectrum (Figure 6b), it can be concluded that the spectrum contains at least the M-shell X-ray lines in the range of 2–2.5 keV from the most prominent Ni-like W ions [29,30], while the L-shell emission lines (8.8–11 keV) have a very low efficiency.
Similarly, Figure 6c shows the Al/Cu ratio for the peak of the second X-ray burst, where the median value for all cases is equal to ~2. This low value can be attributed to the electron beam–plasma interaction; therefore, the emitted spectrum also contains the “cold” lines [26]. In Figure 6d, the exponential power spectrum of continuum emission for the characteristic temperature of 8200 eV is presented. The exponential form of the spectral profile optimally fits a minimum ratio value of 2.5. Thus, it is understood that the L-shell characteristic emission lines must be included in the bremsstrahlung emissions.
3.2. X-ray Radiography
The experimental measurements that characterize the X-pinch as an X-ray source, along with X-ray radiography applications, are presented in this section. Several shots were performed using the W X-pinch loads, crossed at 55° and 98°, based on the previously presented analysis. To increase the optical density, a time-integrated pinhole radiograph recorded for a sequence of eight shots was recorded on film, as presented in Figure 7a. The projected pinhole aperture was created on the film by the sequential shots, which provided the hot spots at various locations. Figure 7b shows a lineout of the film’s transmission along the diameter of the cross-point area. Due to the contribution of multiple hot spots and the short-lived energetic electrons [12] in the creation of the overlapped X-ray source, a slightly magnified diameter—larger than the expected 4.2 mm that holds for a point-like source—was observed. It should be noted that emission occurs only from the X-pinch limbs pointing to the anode, denoting the existence of the electron beam that interacts with the cold plasma [12]. The length of the limbs presented in Figure 7a is approximately 1.8 times magnified in relation to their real length. The limbs pointing the cathode do not emit X-rays higher than the cut-off energy of 6 keV; therefore, no signal was recorded, as shown by the radiographs.
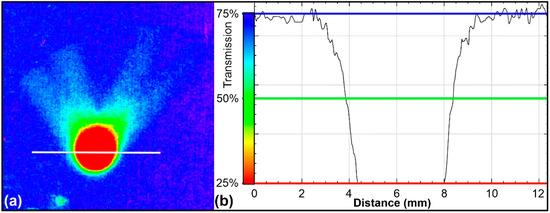
Figure 7.
(a) Typical time-integrated pinhole radiograph. (b) Lineout along the diameter of the cross-point area.
To evaluate the point projection radiography scheme, a Ti wire sample with a diameter of 50 μm was used as an image object. Figure 8a shows the time-integrated monochrome-negative radiograph with a typical transmittance (T), lying in the full-scale range (0–1), accompanied by the magnified section of the area of interest. It should be noted that this complementary transmittance (1-T) properly represents the monochrome-positive image of the inverted original radiograph. The numbers N = 0, 1, 2, 4, …, 32 correspond to the multiples of the specified thickness of the thinner first step of the Al step wedge. The film’s opaqueness is measured by the so-called optical density (OD). The OD = log10(I0/I) is a value that measures the film’s degree of darkening, and is usually obtained via a densitometer, where I0 is the incident light intensity measured in the absence of film, and I is the intensity transmitted through the film perpendicular to the film plane. In our case, a scanner with a resolution of 600 dpi (~42 μm) was used. A maximum OD equal to log10(255) = 2.4 can be achieved for an 8-bit grayscale image. Figure 8c shows the OD in relation to N, which is proportional to the log (exposure) [31]. The maximum value of OD observed in Figure 8c is 0.76 (N = 0), and is not included in the step-wedge area. The maximum OD value within the step-wedge area is 0.64 at N = 1, while the minimum is 0.24 at N = 32. The value of 0.18 corresponds to the null exposure (equal to “film base plus fog” density). Figure 8d shows the total transmission curves of the step wedge and the Ti wire, including the transmission of the film package. Since OD at the N = 32 step is greater than the null exposure density, we can conclude that the maximum detectable photon energy is above the cutoff energy of ~9.0 keV of the transmission profile corresponding to this step. Moreover, additional experiments on Al-plated W crossed at 55°, using a filter of Pd of 50 μm in thickness, delivered a minimum optical density for bremsstrahlung emissions in the range of 12–13 keV, including the “cold” characteristic L-series lines for W (7.4–11.7 keV), as presented by the magenta curve in Figure 8d. Figure 8a shows that the Ti wire can be identified up to the N = 8 step, while after the N = 16 step (OD = 0.26) the overall OD is of the same order as at the step-wedge OD, in the range of 0.24–0.26. A further analysis of the results of Figure 8d shows that the overall transmission curve (dashed red) is lower in amplitude than the curve obtained at N = 32 (solid white); therefore, an OD value lower than 0.24 is expected. This behavior confirms that the Ti wire is not irradiated by a point-like source [32]. Figure 8b shows the perpendicular lineout of the Ti wire (see the relevant yellow marking line on Figure 8a). The maximum width Ssw of the wire projection shadow is ~400 μm, as determined by the threshold level of the direct exposure area (N = 0 step). In addition, the minimum value is observed at the center of the transmission profile, and approximates the darkness of the area at step N = 8, resulting in a similar OD value of 0.36. Therefore, the transmission curve of step N = 8 can be approximated by a Ti sample with a thickness of 15 μm, as the solid yellow curve indicates. Additionally, the overall OD for this equivalent sample Tieq satisfies the limits set above, being in the range of 0.24 (N = 32)–0.26 (N = 16), as shown by the corresponding dashed yellow transmission curve in Figure 8d. Moreover, the size of the Tieq is ~137 μm, as derived by excluding the wave nature of radiation [32], using the expression SFWHM/M of geometrical optics [25], where the FWHM width SFWHM of the shadow is ~210 μm, as shown in Figure 8b, and M = 1.53 is the magnification factor. The time-integrated X-ray source size is approximated by S = Δx/0.53, as discussed in Section 2, to be ~330 μm, where the spatial resolution Δx is ~175 μm, as illustrated by Figure 8b.
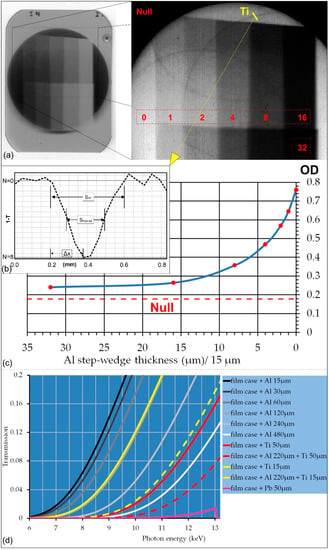
Figure 8.
(a) Time-integrated monochrome-negative radiograph (left) and its inverted X-ray-magnified area of interest (right). (b) Transverse lineout that indicates the shadow of the projected wire on the film. (c) OD in relation to the N numbers. (d) Total transmission curves, including the transmission of the film package.
In the literature, Beg et al. [6] demonstrated, for an X-pinch device of 80 kA using two 5 μm diameter tungsten wires, that the X-ray spectrum obtained via the X-ray pinhole camera has an increase in the X-ray yield observed at ~9–10 keV, which is mainly attributed to the electron beam produced in X-pinches. In [20], Beg et al. used a tungsten X-pinch configuration of 40 kA as an X-ray source, with a source size of less than 10 μm, an X-ray yield of 60 mJ, and a pulse duration of 7 ns, and the produced photon energy was in the range of 800 eV to 5 keV.
X-ray imaging is ideally suited for the detection of interior defects and contaminants in agricultural commodities [33]. Bactrocera oleae, the olive fruit fly, is the main insect pest of olives worldwide [34], and is a frequent cause of reduced olive oil quality. The presented and described X-pinch X-ray radiography was used to identify buried tunneling in olives. Figure 9a shows typical samples of olives and larvae of the olive fruit fly. The larvae feed inside the fruit, destroying the pulp, and allowing for the entry of secondary bacteria and fungi that rot the fruit and degrade the quality of the oil. The X-ray image in Figure 9b, obtained from the point-projection radiography method described above, clearly shows the extensive damage from olive fruit fly tunneling in the olive interior in the areas of the dashed black parallelograms, for the two olives at the bottom of the figure; the image of the larvae is also observed.
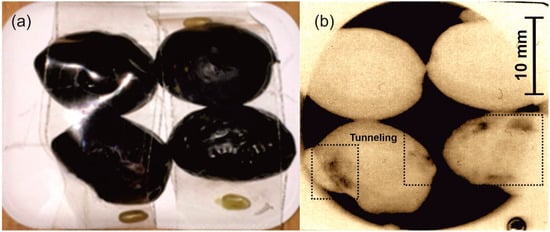
Figure 9.
(a) A sample of olives and larvae of the olive fruit fly above the film. (b) X-ray image obtained from the point-projection radiography method, magnified x~1. The dashed black parallelograms indicate the affected areas.
4. Conclusions
A 45 kA current X-pinch system of nanosecond-timescale rising time and ~0.9 kA/ns current rate was characterized using different X-pinch wire configurations as a potential efficient source of soft X-rays. An additional experimental setup was developed to characterize the X-pinch scheme as a source of X-rays higher than ~6 keV, and a typical/representative application of the proposed X-ray radiography was presented.
Based on the time-resolved measurements, the X-ray yield was in the range of 50–70 mJ per shot, while the first X-ray burst duration was ~3–5 ns and produced a Planckian-type spectrum, with its highest energies in the 7–8 keV range. The X-ray emission that occurred after the pinching time corresponds to bremsstrahlung continuum radiation, including the L-shell characteristic emission lines. Based on the time-integrated measurements, the X-ray emission spectrum has an upper limit at 13 keV for Au-plated W at 55°. Moreover, we found that the time-integrated size of the X-ray source formed in a 2 × 5 µm W X-pinch was ~330 µm. This characterization, in terms of energy, pulse width, and source size, is important for point-projection radiography. The compact tabletop X-pinch is also used for X-ray radiography, and has proven to be ideal for the detection of interior defects in biological samples. High-contrast, ~40 μm spatial resolution radiograms of biological specimens were obtained.
Furthermore, time-resolved X-ray emission measurements at various energy ranges, using a set of diodes filtered with Ross filter pairs, in association with time-integrated X-ray energy spectra characterization measurements, are in progress in order to enhance the capabilities of the developed X-pinch device for use in backlighting X-ray radiographic diagnostics for dense plasmas and biological samples.
Author Contributions
A.S., A.K., C.K. and I.F. performed the experiments; A.S. performed the data analysis and wrote the first draft of this paper, assisted by E.K. and V.D.; J.C. and N.A.P. gave essential inputs to the experimental setups; V.D. and N.A.P. were critically involved in the understanding of the experimental data and the associated physics; M.T. proposed the main idea, was critically involved in the understanding of the experimental data and the associated physics, supervised the experiments, had the responsibility for the writing up of this article, and was invited by this journal for publication. All authors have read and agreed to the published version of the manuscript.
Funding
The authors acknowledge financial support by the “ELI—LASERLAB Europe Synergy, HiPER& IPERION-CH.gr” (MIS 5002735), which was implemented under the Action “Reinforcement of the Research and Innovation Infrastructure”, funded by the Operational Program “Competitiveness, Entrepreneurship, and Innovation” (NSRF 2014–2020), and co-financed by Greece and the European Union (European Regional Development Fund). This research/work was partially carried out within the framework of the IAEA Coordinated Research Project F13020 “Pathways to Energy from Inertial Fusion—Materials Research and Technology Development”.
Institutional Review Board Statement
Not applicable.
Informed Consent Statement
Not applicable.
Data Availability Statement
The data presented in this study are available within the article.
Conflicts of Interest
The authors declare no conflict of interest.
References
- Zakharov, S.M.; Ivanenkov, G.V.; Kolomenskii, A.A.; Pikuz, S.A.; Samokhin, A.I.; Ulshmid, J. Wire X-pinch in a High Current Diode. Sov. Tech. Phys. Lett. 1982, 8, 456–457. [Google Scholar]
- Douglass, J.D. An Experimental Study of Tungsten Wire-Array Z-pinch Plasmas Using Time-Gated Point-Projection X-ray Imaging. Ph.D. Thesis, Cornell University, Ithaca, NY, USA, 2007. [Google Scholar]
- Shelkovenko, T.A.; Pikuz, S.A.; Hammer, D.A. A review of projection radiography of plasma and biological objects in X-pinch radiation. Plasma Phys. Rep. 2016, 42, 226–268. [Google Scholar] [CrossRef]
- Song, B.M.; Shelkovenko, T.A.; Pikuz, S.A.; Mitchell, M.A.; Chandler, K.M.; Hammer, D.A. X pinch x-ray radiation above 8 keV for application to high-resolution radiography of biological specimens. IEEE Trans. Nucl. Sci. 2004, 51, 2514–2519. [Google Scholar] [CrossRef]
- Liu, R.; Wang, X.X.; Zou, X.B.; Zeng, N.G.; He, L.Y. Phase-contrast imaging of a soft biological object using X-pinch as X-ray source. EPL (Europhys. Lett.) 2008, 83, 25002. [Google Scholar] [CrossRef]
- Beg, F.N.; Stephens, R.B.; Xu, H.-W.; Haas, D.; Eddinger, S.; Tynan, G.; Shipton, E.; DeBono, B.; Wagshal, K. Compact X-pinch based point x-ray source for phase contrast imaging of inertial confinement fusion capsules. Appl. Phys. Lett. 2006, 89, 101502. [Google Scholar] [CrossRef]
- Pikuz, S.A.; Shelkovenko, T.A.; Hammer, D.A. X-pinch. Part II. Plasma Phys. Rep. 2015, 41, 445–491. [Google Scholar] [CrossRef]
- Artyomov, A.P.; Fedyunin, A.V.; Chaikovsky, S.A.; Zhigalin, A.S.; Oreshkin, V.I.; Ratakhin, N.A.; Rousskikh, A.G. A double-frame nanosecond soft X-ray backlighting system based on X-pinches. Instrum. Exp. Tech. 2013, 56, 66–71. [Google Scholar] [CrossRef]
- Hammer, D.A.; Kalantar, D.H.; Mittal, K.C.; Qi, N. X-pinch soft x-ray source for microlithography. Appl. Phys. Lett. 1990, 57, 2083–2085. [Google Scholar] [CrossRef]
- Shelkovenko, T.A.; Sinars, D.B.; Pikuz, S.A.; Chandler, K.M.; Hammer, D.A. Point-projection x-ray radiography using an X-pinch as the radiation source. Rev. Sci. Instrum. 2001, 72, 667. [Google Scholar] [CrossRef]
- Pikuz, S.; Shelkovenko, T.; Sinars, D.; Hammer, D.; Lebedev, S.; Bland, S.; Skobelev, Y.; Abdallah, J.; Fontes, C.; Zhang, H. Spatial, temporal, and spectral characteristics of an X pinch. J. Quant. Spectrosc. Radiat. Transf. 2001, 71, 581–594. [Google Scholar] [CrossRef]
- Shelkovenko, T.A.; Pikuz, S.A.; Song, B.M.; Chandler, K.M.; Mitchell, M.D.; Hammer, D.A.; Ivanenkov, G.V.; Mingaleev, A.R.; Romanova, V.M. Electron-Beam-Generated X-rays from X Pinches. Phys. Plasmas 2005, 12, 033102. [Google Scholar] [CrossRef]
- Shelkovenko, T.A.; Pikuz, S.A.; Mingaleev, A.R. Accelerated Electrons and Hard X-ray Emission from X-pinches. Plasma Phys. Rep. 2008, 34, 754–770. [Google Scholar] [CrossRef]
- Kaselouris, E.; Dimitriou, V.; Fitilis, I.; Skoulakis, A.; Koundourakis, G.; Clark, E.L.; Chatzakis, J.; Bakarezos, M.; Nikolos, I.K.; Papadogiannis, N.; et al. Preliminary investigation on the use of low current pulsed power Z-pinch plasma devices for the study of early stage plasma instabilities. Plasma Phys. Contr. Fusion 2018, 60, 014031. [Google Scholar] [CrossRef]
- Kaselouris, E.; Dimitriou, V.; Fitilis, I.; Skoulakis, A.; Koundourakis, G.; Clark, E.L.; Bakarezos, M.; Nikolos, I.K.; Papadogiannis, N.; Tatarakis, M. The influence of the solid to plasma phase transition on the generation of plasma instabilities. Nat. Commun. 2017, 8, 1713. [Google Scholar] [CrossRef] [PubMed]
- Kaselouris, E.; Tamiolakis, G.; Fitilis, I.; Skoulakis, A.; Dimitriou, V.M.; Tatarakis, M. Instability growth mitigation study of a dielectric coated metallic wire in a low current Z-pinch configuration. Plasma Phys. Control. Fusion 2021, 63, 085010. [Google Scholar] [CrossRef]
- Koundourakis, G.; Skoulakis, A.; Kaselouris, E.; Fitilis, I.; Clark, E.L.; Chatzakis, J.; Bakarezos, M.; Vlahakis, N.; A Papadogiannis, N.; Dimitriou, V.; et al. A numerical study on laboratory plasma dynamics validated by low current x-pinch experiments. Plasma Phys. Control. Fusion 2020, 62, 125012. [Google Scholar] [CrossRef]
- Hassan, S.M.; Clark, E.L.; Androulakis, G.C.; Petridis, C.; Gopal, A.; Minardi, S.; Chatzakis, J.; Tzianaki, E.; Bakarezos, M.; Papadogiannis, N.A.; et al. Spectroscopic Investigation of Radiation from a Low Current X-pinch. In Proceedings of the 35th EPS Conference on Plasma Physics 2008, EPS 2008-Europhysics Conference, Hersonissos, Greece, 9–13 June 2008; pp. 1206–1209. [Google Scholar]
- Shelkovenko, T.A.; Pikuz, S.A.; Tilikin, I.N.; Mitchell, M.D.; Bland, S.N.; Hammer, D.A. Evolution of X-pinch loads for pulsed power generators with current from 50 to 5000 kA. Matter Radiat. Extrem. 2018, 3, 267–277. [Google Scholar] [CrossRef]
- Beg, F.N.; Krushelnick, K.; Lichtsteiner, P. Table-top X-pinch for X-ray radiography. Appl. Phys. Lett. 2003, 82, 4602. [Google Scholar] [CrossRef]
- Shelkovenko, T.A.; Pikuz, S.A.; Tilikin, I.N.; Bland, S.N.; Lall, D.; Chaturvedi, N.; Georgakis, A. X-pinch X-ray emission on a portable low-current, fast rise-time generator. J. Appl. Phys. 2018, 124, 083303. [Google Scholar] [CrossRef]
- Chittenden, J.P.; Ciardi, A.; Jennings, C.A.; Lebedev, S.V.; Hammer, D.A.; Pikuz, S.A.; Shelkovenko, T.A. Structural evolution and formation of high-pressure plasmas in x pinches. Phys. Rev. Lett. 2007, 98, 025003. [Google Scholar] [CrossRef]
- Bauer, B.S.; Kantsyrev, V.L.; Le Galloudec, N.; Makhin, V.; Mancini, R.C. Stabilization and Confinement of Hot, Dense, High-Beta Plasma; Report A757993; Nevada University: Reno, NV, USA, 14 February 2002. [Google Scholar]
- Mahtab, M.; Habibi, M. Nitrogen soft and hard X-ray emissions using different shapes of anodes in a 4-kJ plasma focus device. Plasma Phys. Rep. 2013, 39, 993–998. [Google Scholar] [CrossRef]
- Artyomov, A.P.; Chaikovsky, S.A.; Oreshkin, V.I.; Fedunin, A.V.; Rousskikh, A.G.; Ratakhin, N.A. On the Size of the Soft X-ray Radiation Source Based on an X-pinch. Russ. Phys. J. 2020, 62, 2194–2203. [Google Scholar] [CrossRef]
- Haas, D.; Bott, S.C.; Ueda, U.; Eshaq, Y.; Beg, F.N. Time resolved x-ray plasma emission in low current x-pinches. In Proceedings of the 16th IEEE International Pulsed Power Conference, Albuquerque, NM, USA, 17–22 June 2007. [Google Scholar]
- Ramírez-Jiménez, F.J. X-ray Spectroscopy with PIN diodes. AIP Conf. Proc. 2006, 857, 121–133. [Google Scholar]
- Christou, C.; Dangor, A.E.; Hammer, D.A. Characterization of wire X pinches driven by a microsecond-long capacitive discharge. J. Appl. Phys. 2000, 87, 8295–8303. [Google Scholar] [CrossRef]
- Safronova, A.; Kantsyrev, V.; Fedin, D.; Osborne, G.; Yilmaz, M.; Hoppe, T.; Nalajala, V.; Douglass, J.; Maxson, L.; Hammer, D.; et al. Spectroscopic and Imaging Study of Combined W and Mo X-pinches at 1 MA Z-pinch Generators. IEEE Trans. Plasma Sci. 2006, 34, 2256–2262. [Google Scholar] [CrossRef]
- Osborne, G.C.; Safronova, A.S.; Kantsyrev, V.L.; Safronova, U.I.; Yilmaz, M.F.; Williamson, K.M.; Shrestha, I.; Beiersdorfer, P. Diagnostic of charge balance in high-temperature tungsten plasmas using LLNL EBIT. Rev. Sci. Instrum. 2008, 79, 10E308. [Google Scholar] [CrossRef]
- White, S.C.; Pharoah, M.J. Part IV Imaging principles and techniques. In Oral Radiology: Principles and Interpretation, 4th ed.; Mosby Elsevier: Maryland Heights, MO, USA, 2000. [Google Scholar]
- Shelkovenko, T.; Pikuz, S.; Hammer, D. X-pinches as broadband sources of x-rays for radiography. J. Biomed. Sci. Eng. 2015, 8, 747. [Google Scholar] [CrossRef][Green Version]
- Haff, R.P.; Jackson, E.S.; Moscetti, R.; Massantini, R. Detection of Fruit-fly Infestation in Olives using X-ray Imaging: Algorithm Development and Prospects. Am. J. Agric. Sci. Technol. 2015, 4, 1. [Google Scholar] [CrossRef]
- Daane, K.M.; Johnson, M.W. Olive Fruit Fly: Managing an Ancient Pest in Modern Times. Annu. Rev. Entomol. 2010, 55, 151–169. [Google Scholar] [CrossRef]
Publisher’s Note: MDPI stays neutral with regard to jurisdictional claims in published maps and institutional affiliations. |
© 2021 by the authors. Licensee MDPI, Basel, Switzerland. This article is an open access article distributed under the terms and conditions of the Creative Commons Attribution (CC BY) license (https://creativecommons.org/licenses/by/4.0/).