Article

The Usefulness of Video Learning Analytics in Small Scale E-Learning Scenarios

by
César Córcoles
*,
Germán Cobo
and
Ana-Elena Guerrero-Roldán
Faculty of Computer Science, Multimedia and Telecommunications, Universitat Oberta de Catalunya, 08018 Barcelona, Spain
*
Author to whom correspondence should be addressed.
Appl. Sci. 2021, 11(21), 10366; https://doi.org/10.3390/app112110366
Submission received: 31 August 2021 / Revised: 13 October 2021 / Accepted: 1 November 2021 / Published: 4 November 2021
(This article belongs to the Collection The Application and Development of E-learning)

Abstract

:
A variety of tools are available to collect, process and analyse learning data obtained from the clickstream generated by students watching learning resources in video format. There is also some literature on the uses of such data in order to better understand and improve the teaching-learning process. Most of the literature focuses on large scale learning scenarios, such as MOOCs, where videos are watched hundreds or thousands of times. We have developed a solution to collect clickstream analytics data applicable to smaller scenarios, much more common in primary, secondary and higher education, where videos are watched tens or hundreds of times, and to analyse whether the solution is useful to teachers to improve the learning process. We have deployed it in a real scenario and collected real data. Furthermore, we have processed and presented the data visually to teachers for those scenarios and have collected and analysed their perception of their usefulness. We conclude that the collected data are perceived as useful by teachers to improve the teaching and learning process.

1. Introduction

Since the popularization of online video, teachers and students have used it more and more as a learning resource in online teaching [1], both in fully online and in blended environments, but also in conventional learning environments, e.g., as a teaching aid [2,3] or in flipped classroom settings. While we still cannot find relevant data in the literature, it is to be expected that the recent global pandemic has only helped make this change faster [4] (using video teaching and learning grew by 28% from the 2019 to the beginning of the 2020–21 academic year). Thus, it is essential to better understand how students learn from these resources [5,6,7,8,9].
Watching learning resources in video format (from now on we will use the term “educational video” to refer to them) in order to learn something presents a number of differences regarding the teaching and learning process compared to listening to a face-to-face lecture in a conventional classroom, or even attending that same lecture using videoconferencing software. On one hand, an experienced teacher is expected to diagnose how students are learning from visual cues, which are lost to a great degree when using videoconferencing software, and totally when students watch pre-recorded videos (this is so much so that with the growth of online teaching there has been a growing interest in the field of affective computing in order to automatically obtain information from students’ facial expressions [10]). In that aspect, educational video is closer to studying from a book, even when those videos try to capture a lecture. However, on the other hand, with the advent of HTML5 video, consuming video can be made to leave a trace: with the use of JavaScript libraries [11,12] and some back-end development, we can record when a student has started watching an educational video, and, more importantly, the moments when she paused it, skipped over a part of it or repeatedly rewatched a section of it, for example [13]. Marshall et al. [14] take a similar approach using xAPI [15]. These collected data are usually called clickstream data [13,16]. Moreover, given the linearity of video, one can be sure to a high degree of where in a video a student is, something that, in the case of text, would require cumbersome eye tracking technology. Could these clickstream data make it possible to give teachers actionable information regarding the learning process? Could we, as an example, detect patterns indicative of problems or opportunities in the learning process?
Additionally, it has become possible to add some level of interactivity to video players, beyond basic playing, pausing and skipping forwards and backwards. Some examples of such interactivity are: (i) a video can be made to stop automatically at a certain point, (ii) some text or figure can be shown on demand, or (iii) a certain action can be triggered by a sequence of events (say, we can show text if a student pauses for a certain amount of time in a given segment of the video and then skips backwards to another given segment). Could these features be used to intervene in a student’s learning process in real time?
It is our objective to determine whether the use of video learning analytics is perceived as useful for the improvement of the teaching process in small scale learning scenarios.
We use the term “small scale” to refer to all kinds of learning scenarios in which educational videos are watched by students individually (fully remote learning, flipped classroom environments, face-to-face learning scenarios in which students are given videos to watch as feedback or reinforcement, etc.) in which the student-to-teacher ratio allows for individual intervention: at most a few hundred students per teacher, and usually tens of students per teacher. This results in videos used in playbacks for a single video being at most a few hundred times per course collectively among all students, and, in many cases, fewer than one hundred times. Thus, in the present work, “small scale” refers to scenarios in which we have collected information for less than one thousand playbacks for each video. We are interested in small scale learning scenarios because, to our knowledge, there is no research in the field that applies to these scenarios, which are more common than the big scale learning scenarios commonly found in the literature.
We use the definition of “perceived usefulness” given by Davis in the framework of the technology acceptance model (TAM) [17]. That is, perceived usefulness is “the degree to which a person believes that using a particular system would enhance his or her job performance”. The TAM, first introduced by Davis [18], assumes that an individual’s information systems acceptance is determined by two major variables: perceived usefulness and perceived ease of use, and it is a widely applied theoretical model in the information sciences field [19]. Thus, we will use perceived usefulness and perceived ease of use as measures of success in this work. Again, to our knowledge, there are no examples in the literature of analysing the perceived usefulness by teachers of educational video learning analytics.
The rest of this paper is structured as follows. Firstly, we present the theoretical framework for our work and the context in which it was developed, followed by the research questions. Then, the methodology is described. That is followed by a description of how the data were collected, processed and analysed. Then, the results of presenting the analysed data to the implicated teachers in semistructured interviews are shown. The article is closed with the presentation of the results and the conclusions.

2. Literature Review

2.1. Educational Video

According to Cruse [20], the use of educational video reinforces reading and lecture material, aids in the development of a common base of knowledge among students, enhances student comprehension and discussion, provides greater accommodation of diverse learning styles, increases student motivation and enthusiasm, and promotes teacher effectiveness.
The growth in use of educational video has been widely documented for some time [1,21,22]. Kay [21] notes how research on the use of “video podcasts” in education began to surface in 2002, and how the arrival of YouTube in 2005 and the growth in bandwidth between 2006 and 2010 represented a shift in adoption. He also notes that with respect to purpose, four main types of educational video have emerged, including lecture-based, enhanced, supplementary and worked examples. Pedagogical strategies for educational videos include receptive viewing, problem solving, and created video. Educational video can also be classified by academic focus, which can be practical or conceptual. According to Kay, approximately half of educational videos target practical skills or specific problems and are typically short or segmented. The other half target higher level concepts and are relatively long. Tiernan [1] notes how educational video can be used in a variety of teaching and learning contexts to alter and enhance the experience provided for students, including in classrooms, and how, in skills-based teaching scenarios, video is a powerful tool for demonstrating practical examples and models for students.
Poquet et al. [22] remark on the mixed evidence around the observed effectiveness of the use of video as studied by Yousef et al. [23], which is an indication of the need for more research on the question of educational video. Poquet et al. also note how few MOOC studies report experimental findings and are often descriptive or correlational.

2.2. Learning Analytics and Educational Data Mining to Enhance the Teaching/Learning Process

The fields of learning analytics and educational data mining have put considerable effort into studying how students interact with learning resources. Naturally, this is hampered by the fact that one can only analyse interactions leaving a trace. Moreover, with textual resources, even if they are electronic in nature (a website, a PDF file), it is very hard to know where a student is in the text without intrusive, cumbersome equipment: it is only through the use of eye tracking that one can follow the gaze of students at a given point. This has had an effect on granularity: many of the research papers found in the literature (see [1,21,22]) are more concerned with student navigation through sequences of learning materials than the interaction with a single learning resource as a venue for the teaching and learning process. Thus, even when an infrastructure to collect learning analytics data has been put into place, in most cases its objective is not to get back some of the information that teachers are expected to obtain in traditional, face-to-face settings.
Online video, as we have seen, provides a big opportunity to dig down and operate at a lower level of granularity. Most research papers found in the literature focus on the context of MOOCs (massive online open courses) [16,24,25], which often use collections of educational videos as the main learning material. This context has given place to a lot of very interesting research on large scale information for a video: it is relatively easy, for example, to observe patterns such as student dropout or navigation patterns (say, students reviewing a given segment of a video at a given point in the course, or repeated viewing of worked-out examples) [26], and this can provide teachers with actionable information that can be used to detect problematic points in a video, segments that need to be explained in more detail, etc.
That research has, understandably, been more concerned with providing information for the improvement of an educational video than with analysing how a single student—or small groups of students showing common behaviour—watches that video and trying to detect patterns and intervene on her learning. That is especially justifiable in the MOOC context, where the student teacher ratio is very high and student expectations regarding teacher interaction are low. However, in many educational contexts, in higher or secondary education, student teacher ratios are much lower, and teachers are expected (and able) to give individual students feedback on their learning activities.
In our experience, when teachers are offered a peek into the trace left by students watching educational videos, they are often surprised at how a significant number of students do not watch the video from beginning to end without pausing or skipping backwards or forwards: for most educational videos we have analysed, independently of the subject or its learning objectives, there will be a significant number of students who will pause and skip, and go backwards and forwards, significantly more than lecturers had anticipated.
Additionally, most of the research has focused on either giving the student some feedback to improve her learning or trying to predict student success or failure. Our focus is on detecting segments in the video that could be improved in some way (by reshooting it, editing it or by adding some interactivity to the video in response to student behaviour patterns, such as suggesting additional learning resources for some students, for example) to improve the teaching and learning process.
The use of blended and virtual learning is currently increasing at a very fast pace, with pre-pandemic expectations of annual growth at a yearly rate of 15.5% until 2025 [27]. Due to the pandemic, higher educational institutions are adding additional tools and resources to support learners across their learning process. Nevertheless, the addition of tools and resources should be carefully considered in order to analyse their effectiveness and the impact on the learning process. The 2020 NMC Horizon Report [28] includes analytics for student success and adaptive learning technologies as two of its six emerging technologies and practices practitioners believe will have a significant impact on postsecondary teaching and learning.
When focusing on the impact of learning resources such as educational videos through a virtual learning environment, as aforementioned, learning analytics (LA) [29], as well as educational data mining (EDM) [30], become useful areas to analyse data collected of/from learners’ interaction with a video in any virtual learning environment (VLE). However, LA and EDM focus on the use of large data sets, as can be seen in Romero and Ventura [30], leaving behind small data sets collected to suggest enhancements by providing meaning insights to single courses with low ratio of learners, that we call small scale scenarios. As previously stated, we use “small scale scenarios” to refer to videos with collected data from less than one thousand playbacks. Multimedia Learning Theory (MLT) suggests several possible applications of LA data to improve learning [31].
Some interesting findings in the field include those by Li et al. [32] who reported a relationship between clusters of interactions such as those we analyse (pausing, skipping, etc.) and perceived difficulty.
The interaction between worked-out examples as a teaching and learning tool and self-explanations by students when learning from those examples are of particular interest (Renkl et al., 1998). Worked-out examples consist of a problem formulation, solution steps and the final solution itself. Research has shown that learning from such examples is of major importance for the initial acquisition of cognitive skills in well-structured domains such as mathematics, physics and programming [33].
According to the research in the field [34], spontaneously generating explanations to oneself as one studies worked-out examples from a text is a process that promotes skill acquisition, even though it is neither the direct encoding of instruction nor the compilation of an encoded skill. Self-explanation is a domain general constructive activity that engages students in active learning and ensures that learners attend to the material in a meaningful way while effectively monitoring their evolving understanding. Several key cognitive mechanisms are involved in this process, including generating inferences to fill in missing information, integrating information within the study materials, integrating new information with prior knowledge, and monitoring and repairing faulty knowledge. Thus, self-explaining is a cognitively demanding but deeply constructive activity. For a review of the effectiveness of self-explanation and its use as a trainable learning strategy, see [35].

2.3. Clickstream Data Visualization

The large amount of data generated by logging clickstreams has led, naturally, to research in the field looking for visual tools for the presentation of that kind of data. Clickstream visualization is especially important in e-commerce, for example, and it is easy to find literature on website clickstream visualization. Kateja et al. [36] present a systematic approach to visualizing clickstream data. In the field of education, some examples of clickstream visualization can be found in Goulden et al. [37] or Chen et al. [38]. It is less frequent to find research on video clickstream visualization. Wang et al. [39] remark on the fact that although various analytic techniques have been proposed to explore patterns in video clickstream data, those techniques usually do not sufficiently support presentation, which makes it difficult to communicate the information to audiences without prior knowledge.
If we focus on video clickstream visualization in the field of education, Giannakos et al. [13] present graphs assigning an importance value to every moment in the video. Kim et al. [26] are interested in interaction peaks and, thus, build graphs representing interactions and re-watching sessions for every moment in the video. In [26] a timeline is built to scrub videos that use the number of interactions in an attempt to improve interaction. In the same spirit, Chen et al. [38] also observe interaction peaks. Lau et al. [24] are interested in dropouts and, thus, focus on audience retention. Hu et al. [40] and Mubarak et al. [41] report on the number of the different types of events occurring in every minute of a video. Finally, Shi et al. [16] are the closest in spirit to the present work, as they not only show interactions (play, pause, seek) per moment of the video in their graphs but they also build diagrams showing skipping forwards and backwards behaviour. No other diagrams or graphs have been found in the literature that show skipping and pausing behaviour.

3. Methods and Materials

3.1. Research Questions and Research Design

As previously stated, it is our objective to determine the perceived usefulness (as defined by Davis [17]) of video learning analytics in small scale learning scenarios. In order to do so, our research questions are:
RQ1.
Are data generated by students watching educational videos perceived as useful by teachers in small scale learning scenarios?
RQ2.
Is there a minimum number of video playbacks to record so that the presented data are perceived as useful by teachers to enhance the learning process? In the affirmative case, what is that minimum?
In order to give answers to our research questions we collected LA data on a series of educational videos, we developed visualizations to make the data easier to understand for stakeholders, we distributed the information to lecturers in the different courses for which we collected data and, finally, we conducted semistructured interviews with them to gather their opinion on the utility of the information.
In this paper we use a mixed research methodology combining action research with a design and creation approach [42]. Action research is used as a framework since it tries to create a system to solve an existing problem, generating a product dealing with market needs that will undergo basic pilot tests. Derived from that action research approach, it concentrates on practical issues, is based on an iterative cycle and puts its emphasis on change and collaboration with practitioners. Our iteration cycle is based on five steps. The first step is awareness: we realize we do not have an understanding of how students watch educational videos beyond the very basic. Then comes suggestion: we decide a learning analytics approach is the best approach to gather the best possible information to solve the problem. The next step is development: we implement a learning analytics solution which is tailor-made for our circumstances (but is easily applicable to other scenarios). Then comes evaluation: we go over the collected data, process them, create some visualizations, and present them to the teachers involved in the teaching and learning process our objective is to understand better. The development and evaluation steps are repeated in order to provide better results.

3.2. Context

The focus of our research is the use of educational video in higher education environments, but it should also apply to other levels (such as secondary education) and contexts (such as informal education).
The Open University of Catalonia (UOC) is a fully online university created in 1994. Its educational model is learner and competence centred. The university’s assessment model is based on Continuous Assessment (CA), and learners receive qualitative feedback after delivering learning activities. Teachers and tutors communicate with the learners through personal and group-class communication spaces through the Virtual Learning Environment (VLE). The VLE includes all communication spaces to promote social interaction, a digital library and teachers and tutors to support learners across courses. The university’s enrolled students are mostly aged between 25 and 45 years old. Most of them already have a full-time job and familiar commitments, so there are some time constraints to overcome when enrolling in online courses. Learning activities, tools, resources and learning materials are offered taking such conditions into consideration. Teachers design activities and provide feedback to learners to reduce isolation and guide learners as much as possible across their learning path.
The VLE consists of a number of classrooms that students and teachers access. The classrooms contain different spaces. Some of those spaces are dedicated to communication, both unidirectional from teacher to students, and multidirectional, among students and teachers. In an activity-centred approach, the main space in the classroom is dedicated to the different learning activities (including assessment activities) to be carried out during the course, and the spaces for each activity contain the learning resources suggested to students in order to carry out those activities. Those learning resources can include educational resources, such as the educational videos that we analyse in the present work. As with all other learning resources, they can be either mandatory watching, central to the activity, or additional content.

3.3. Participants, Study Procedure and Instruments

Data were collected from 37 different educational videos in four different courses, all of them belonging to the Computer Science, Multimedia and Telecommunications department at the UOC. Figure 1 shows two examples of how videos are presented to students.
Four videos (two videos presenting the same contents in two different languages) belong to a Database Design course belonging to a degree in Computer Engineering. Video duration ranges from 8:34 to 15:10 min. The analysed data were collected for a total of six semesters. In that period the pages containing the different videos were accessed 1208 times, and in 572 cases a playback lasting more than 10 s was recorded (a 10-s duration has been set arbitrarily as a non-empty session). In total, 17,181 events were recorded.
Four more videos belong to an Introductory Statistics course in the same degree. One of the videos has been shown to students in two variants, one containing an automatic pause at a point in the video. Video duration ranges from 7:11 to 12:07 min. The analysed data were collected for a total of ten semesters. In that period the pages containing the different videos were accessed 408 times, and in 320 cases a playback lasting more than 10 s was. In total, 6239 events were recorded.
Eight more videos (four in two languages, Catalan and Spanish) belong to an Electronics course as part of a degree in Telecommunications Engineering. Video duration ranges from 4:01 to 7:04 min. The analysed data in this work were collected for a total of ten semesters. In that period, playback sessions were initiated a total of 334 times, with 243 lasting more than seconds. In total, 2592 events were recorded.
Finally, 20 videos belong to a course in non-traditional (non-relational) database architecture. Video duration ranges from 6 min and 36 s to one hour and thirty seconds, with an average of 24:48 min and a standard deviation of 14:25 min. The data analysed in this work were collected for a total of six semesters. In that period the pages containing the videos were accessed 6741 times, with 2205 playback sessions lasting more than ten seconds recorded. In total, 44,987 events were recorded. Some of the videos in this course contained an interactive index allowing students to jump to sections in the video.
All courses are worth 6 European Credit and Accumulation System (ECTS) credits. The first three courses rely on conventional teaching materials, with the videos being additional but required material created by the teaching team. In the non-traditional database architecture course, the videos are the main material.
A total of 28 of the analysed videos (those in the Database Design, Introductory Statistics and non-traditional database architecture courses) are enhanced videos and include some worked examples, according to the classification by Kay [21]. The eight remaining videos (those in the Electronics course) are worked examples, according to the same classification. According to pedagogical approach (also following Kay’s classification) the 24 videos in the Database Design and non-traditional database architecture courses, have a main receptive viewing strategy combined with some problem solving. The videos in the Introductory Statistics and Electronics courses are best classified as problem-solving videos. All the videos have a practical approach.
A summary of this information is provided in Table 1 for easy referencing.

3.4. Data Analysis

We set up an infrastructure to collect anonymous session data. The goal was to capture every student interaction with an educational video in order to be later processed and presented to teachers and other stakeholders. Videos were originally uploaded to the Vimeo online service (other services, such as YouTube, can be used too). A JavaScript library, popcorn.js, was used to intercept interactions between students and videos embedded in a webpage. Each collected interaction was then sent to a database for storage and posterior analysis. Therefore, it is not necessary to be the owner of a video in order to collect clickstream data: it is possible to collect information for any videos embedded in a webpage.
While large scale scenario clickstream data collection would require an ad hoc back-end solution, for small scale scenarios almost any database can be used. In order to maximize compatibility, a solution using PHP (version 7.4) as the server language and MySQL/MariaDB (version 10.4) as the (relational) database was used.
No measures were taken to prevent students from accessing videos directly in their hosting services. If students watched videos on the original hosting service webpage, no clickstream data was collected. Allowing students to watch videos as they preferred was prioritized over collecting all data.
Our data scheme collects the following timestamped events: web page accessed; student clicks on the play/pause button (with the position of the play head in the video timeline as a parameter); student scrubs the timeline (with play head position); for videos where indexes are offered, clicks on a menu item moving the play head; play head reaches the end of the video (technological limitations make it impossible to capture all possible variations of this event); student closes the browser window or tab (again, technological limitations make it impossible to capture all possible variations of this event).
The code for our solution has been licensed under an open-source license and has been published for public access [43].
Naturally, there are limitations to the quality and significance of the collected data. Firstly, we cannot mistake action data for attention data: a video being played for a given amount of time after the student has clicked play on it does not mean said student has been paying attention. In the same way, when a student rewatches a fragment of a video, we do not know if it is because she did not understand or, for example, because she was not paying attention due to some disruption. Thus, while the collected data and the analysis of their visualizations (see below) lead us to believe there is valuable information to be extracted from the observation of individual behaviour, caution is required when taking decisions affecting individuals.
Only anonymous data was collected. This is in part because of technical limitations of the initial approach that have already been addressed, but also because of the regulatory [44] and ethical [45,46] frameworks: anonymous data collection is both allowed by the legal framework and the institution’s ethical committee without the need for explicit consent.
For each video in each course, the collected data were processed. Firstly, we looked for anomalous data that may have been indicative of a problem with data collection. In that case, the whole session was discarded. Less than 0.1% of sessions presented anomalous data.
The raw collected data, as presented in Table 2, may not be easy to interpret for untrained stakeholders. Thus, in order to present the data to teachers and other stakeholders in the involved courses, the collected data was processed and converted into a variety of visualizations.
We did not use the visualizations seen in the literature, as they did not seem appropriate for our volume of data and the objective of intervention in the learning process at the individual or small group level, more suitable in small scale scenarios. Firstly, a visualization (see Figure 2) was developed to present single playback sessions. This was used to show teachers how there were a significant number of students that did not watch the videos from beginning to end without skipping forwards or backwards or pausing. For each video, the five playback sessions with the most recorded events were shown to the teacher, accompanied by a summary of skipping and pausing data.
Presenting data for single playbacks is challenging because, as video is a time-based medium, there are two different time variables involved: “video time” and “session time”. By “video time” we refer to the position in the video a student is currently watching. By “session time” we refer to the elapsed time since the session began. As most video playback interfaces use the horizontal axis to represent “video time”, the horizontal axis in the graph has been chosen to represent “video time”, while the vertical axis is used for session time. Thus, video playback appears in the graph as diagonal segments (typically with slope 1, although, if a student watches video at an accelerated rate slopes are bigger, and lower if a student watches at a slower speed). Pauses appear as vertical segments, with the length of the pause corresponding to the length of the segment. Finally, skipping backwards or forwards appears in the graph as horizontal segments.
Secondly, in order to present the skipping forwards and backwards behaviour, data are visualized using scatter plots (see Figure 3 for an example). In this case, both axes represent “video time”. Every time a student skips in a video, she skips from a starting point to an ending point. The horizontal axis has been chosen for starting points, while the vertical axis has been chosen for ending points. Thus, every point in the plot represents a jump. Points below the diagonal represent backwards jumps, while those above the diagonal represent forwards jumps. Points close to the diagonal represent short jumps, while those further away from it represent longer jumps.
It was a common occurrence in the data that a student skipped many times in a very short amount of time. This was generally interpreted as the student looking for a certain point in the video. It is not desirable to show this in the graph as many jumps instead of one, so an arbitrary modifiable parameter, t, has been introduced (in the examples used in this work, it has been set to one second). If two jumps appear in the data for the same session, less than t seconds apart, then they are considered a single jump, from the starting point of the first jump to the ending point of the second jump. This is applied iteratively to simplify skipping behaviour.
Lastly, pausing behaviour has also been visualized with the use of scatter plots (see Figure 4 for an example). In this case, again, the horizontal axis has been chosen to represent “video time” (the moment in the video at which the student pauses). The vertical axis has been chosen to represent the length of the pause. As pause durations have a very wide range, with many short and few longer pauses, a logarithmic scale can be chosen for the vertical axis. In order to better represent at what points in a video pauses take place, a histogram can be employed too.
We can observe different kinds of events by their grouping: “pause and follow”, “pause and skip backwards”, “pause and skip forwards”, “pause and leave”, “skip backwards while playing” and “skip forwards while playing”. It is beyond the scope of this article to provide an exhaustive study of the different kinds of events that can be found in the scatter plots and to analyse whether there are significant differences among them, although we consider it an interesting line of future work.
Semistructured interviews were carried out with the teachers for the courses. In order to answer the first research question, sets of visualizations of types 2 and 3, and, where appropriate, a subset of visualizations of type 1 (the five single playbacks with the most events, and then five examples corresponding to the most common behaviour patterns, when visual inspection has shown common patterns) for each course were presented to the involved teachers. A block of four identical questions was presented regarding each graph (for brevity, we only present the block regarding playbacks with the most events):
  • Have you found the graphs corresponding to the five single playbacks with the most events useful?
  • Would you be interested in having those graphs for videos you use in your teaching activity?
  • Is there any information in those graphs that will lead you to take any action related to your teaching activity related to those videos useful? If so, please state which information and which actions.
  • On a scale from 1 (very hard to read) to 5 (very easy to read), how easy to read are these graphs?
Questions 1 and 4, in particular, were informed by the technology acceptance model [17]. Finally, an open question was presented to collect feedback from teachers:
5.
Can you think of any improvements we could make to the graphs you have been shown? If so, which?
In order to answer the second research question, we have presented subsets of the same data. As courses are organized in semesters, we chose semesters as the unit: for a particular course, visualizations 2 and 3 are presented for the data corresponding to the first semester. Then, the same visualizations are presented for the first two semesters, and so on. Teachers were asked which of the graphs would be the first one to be useful to them.

4. Results

4.1. Summary of the Obtained Results

All the interviewees answered positively to the first and second questions (“Have you found the graphs corresponding to the five single playbacks with the most events useful?” and “Would you be interested in having those graphs for videos you use in your teaching activity?”).
Regarding the third question (“Is there any information in those graphs that will lead you to take any action related to your teaching activity related to those videos useful?”), despite the positive answers to the two first questions, no specific actions related to teaching activity were suggested directly, although some of them gave feedback later in the interviews that may be considered as potential changes to be made to the videos to improve them, which we will see below.
Regarding the fourth question (“How easy to read are these graphs?”), single playback graphs (as seen in Figure 2) were considered interesting but initially hard to read and teachers considered it hard to extract conclusions from them. Skipping behaviour scatter plots (as seen in Figure 3) were, in general, considered somehow hard to read, while pause scatter plots (as seen in Figure 4) were considered easier to read. Some teachers suggested that, for pausing behaviour, using a histogram showing the distribution of spots at which students paused the video might be more useful than a scatter plot. Another suggestion was that the difference between forwards and backwards jumps should be made clearer. Additionally, one teacher stated that it was not clear from the graphs the number of playbacks where jumps happen, relative to the total number of playbacks. Finally, some teachers pointed out that while the graphs were useful as presented, they missed being able to tell whether a jump or pause corresponded to the first playback of a video by a student or a subsequent one, and that it might be interesting to be able to identify sessions with atypically high numbers of events.
One lecturer considered the pause scatter plot more useful than the jump scatter plot: “Many very concentrated pauses can indicate problems of understanding what the video explains/shows in that place”.
Regarding the fifth question (“Can you think of any improvements we could make to the graphs you have been shown?”), no significant feedback was obtained. Given that the interviewed persons are not experts in the domain of data visualization, this has not been considered of particular interest.
Three examples of feedback corresponding to the series of questions regarding the usefulness of the videos, and possible improvements to the videos as a result of the provided information are the following:
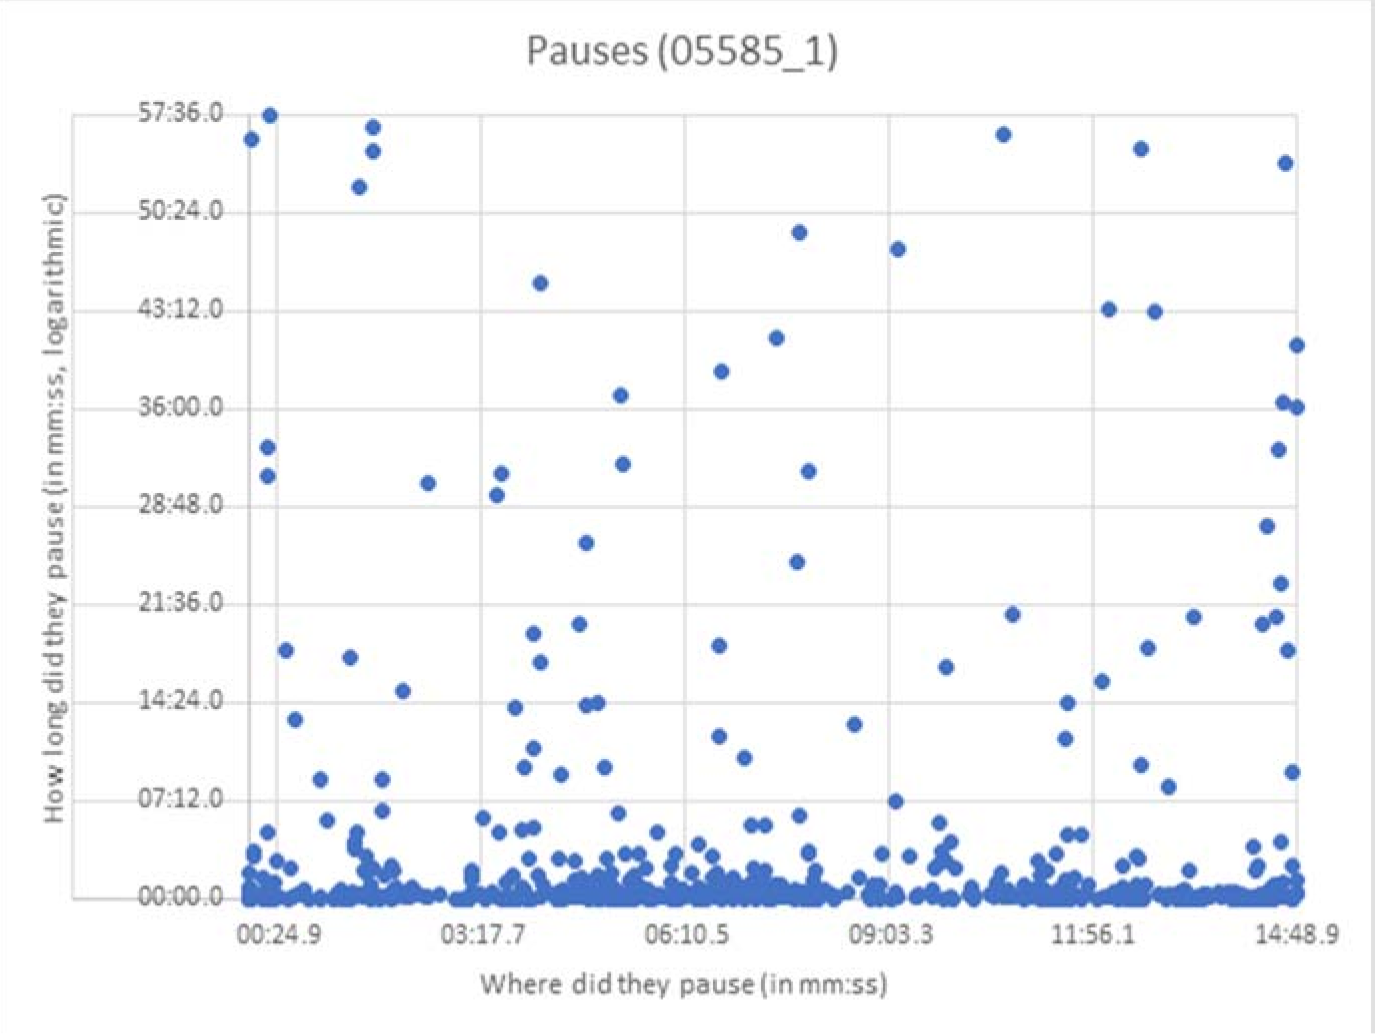
  • “I don’t think the video should be changed for this, but I interpret these two pause patterns (one towards the beginning and one towards the end) as indicating that the students have stopped in these two areas to reproduce with their practice kits what is being shown in the video (the cluster of pauses at the beginning: testing the tracks of the breadboard; the cluster of pauses at the end: assembly of the circuit). The absence of pauses in the central area can be interpreted as that this part of the video hardly provides any information and, perhaps, could be shortened to obtain a shorter but just as informative video.”
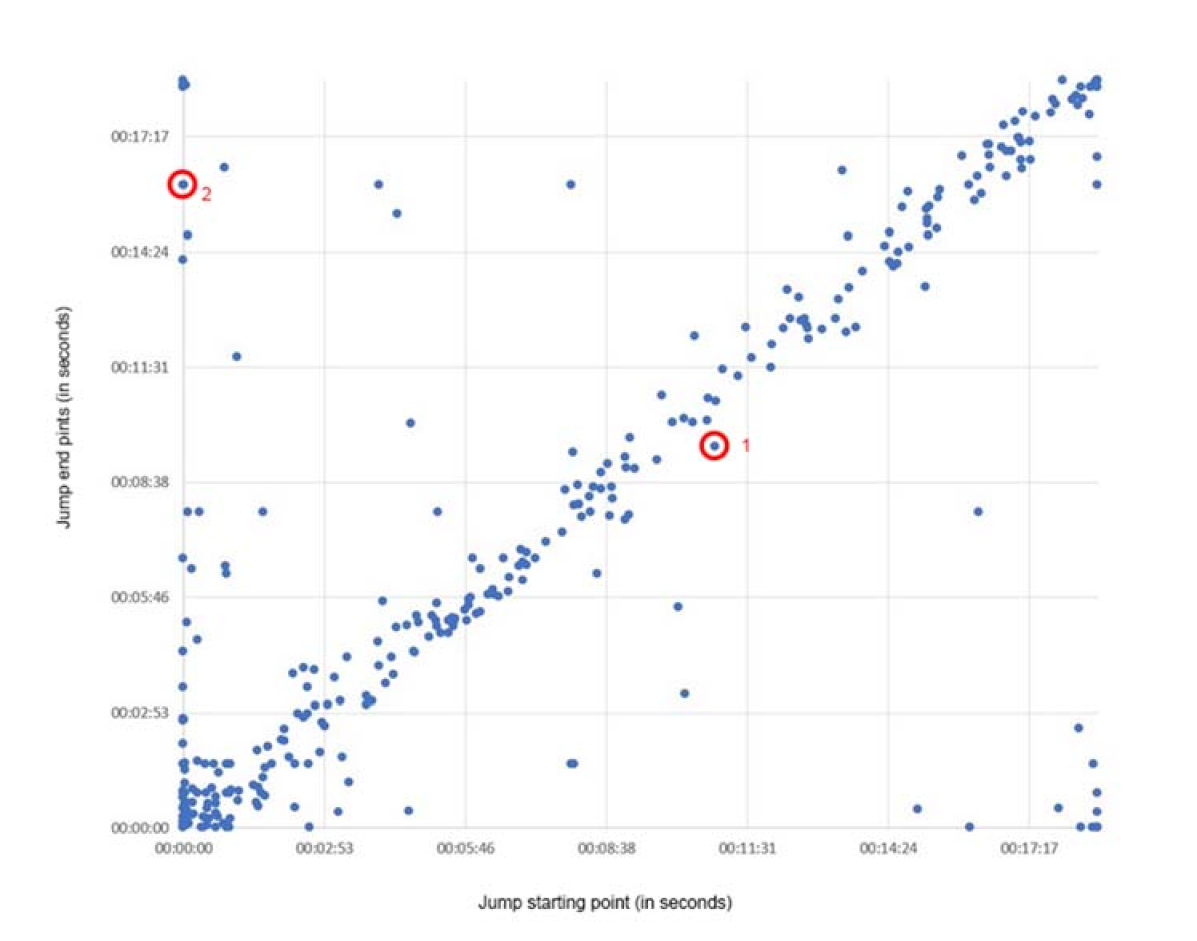
  • “I see a lot more jumping forward than backward. This may be indicative that the video is too long, or perhaps that it has parts of little interest or that provide redundant information (e.g., once you have shown how to connect one or two components on the breadboard, the connection procedures of the rest of the components are exactly the same, and maybe they could be elided and directly show the result of the connection) and that they last too long.”
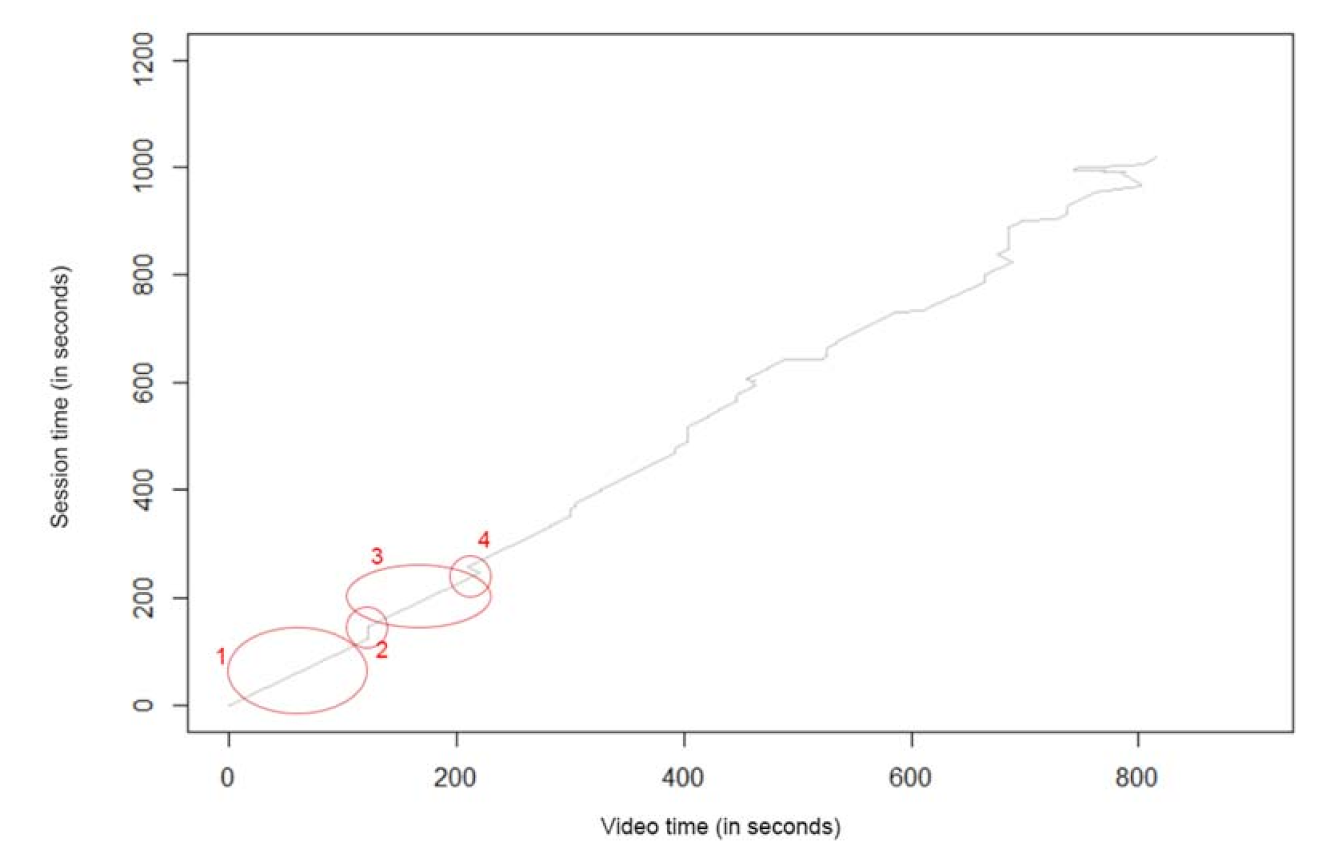
  • A lecturer in the non-traditional database course (in which an index was provided allowing students to jump to sections in the video) spotted a number of students jumping to points in the video corresponding to certain slides that had not been in the index, and suggested that those slides may be included in the index for future students. Additionally, she suggested that aggregations of jumps may change from first views to second views of a video, and that if this is the case, the provided index could change dynamically to better help students navigate the video.
These three examples of possible changes to be made to the videos seem indicative of the fact that the presented graphics, while basic and needing more work, can be useful to detect possible points of improvement to the videos they represent.
If during the interview teachers were offered the possibility of being able to program questions to be asked to students regarding their watching behaviour, triggered by sequences of events (student pauses at a particular segment in the video, student jumps from a particular segment to another one, student jumps a number of times), teachers usually considered it an interesting option, but did not have a clear line of questions to ask.
Regarding the number of points needed for the jump scatter plot to be useful, for short-to-medium length videos (less than 15 min long), the most common cut off point was between 100 and 75 points. Reaching 100 points for a graph was, in the short-to-medium videos for which we collected information, achieved in less than 70 playbacks. For longer videos, the most common cut off points were below 200 and between 200 and 400 points. Reaching 200 points, in that class of videos, was achieved in less than 175 playbacks, while 400 points were reached in less than 225 playbacks.

4.2. Answers to the Research Questions

The answer to the first research question (“Are data generated by students watching educational videos perceived as useful by teachers in small scale learning scenarios?”) is affirmative: all interviewed teachers state that they find the presented graphs useful, and they would like to have them for all educational videos they use in their classes, although they do not see changes or improvements to be made to the videos as a result of the information obtained from the data. There is no clear explanation for this fact. One possible reason may be that the analysed videos were the result of work by teachers with a long experience in the creation of educational videos and, as such, they do not present points to be improved because of the obtained information. Another possible explanation may be that the timeframe of the interviews did not provide sufficient time for interviewees to reflect on the obtained information and conceptualize improvements to the videos. In any case, while the results of this research are encouraging on this point, more work is needed. This may come as an expansion to include more videos in the research, possibly created by less experienced teachers, or on expanding interviews on the videos that have already been analysed in this fork, for example.
The answer to the first part of the second research question (“Is there a minimum number of video playbacks to record so that the presented data are perceived as useful by teachers to enhance the learning process?”) is also affirmative: all interviewed teachers needed a minimum amount of data in the presented graphs in order to consider them useful. Regarding the second part of the question (“In the affirmative case, what is that minimum?”), in the case of short-to-medium length videos that minimum is achieved in less than 70 playbacks. In the case of longer videos, that minimum is achieved in less than 225 playbacks. In our cases, this corresponds to between one and three editions of a course, depending on cohort size, which could be considered as an initial estimate for when it is worth setting up a data collection infrastructure.
Regarding the classification of the analysed videos, according to Kay [21], e.g., lecture-based; enhanced containing worked examples; containing just worked examples; those focusing on problem solving; those combining problem solving with receptive viewing, there is not enough collected data to make any statements regarding differences in navigation patterns according to those classifications. This suggests a future line of work expanding the research to more videos, so that enough data are collected.

5. Discussion

Both research questions have been answered with positive results: learning analytics data collected from students watching educational videos are perceived as useful by teachers, even in small scale learning scenarios, and the minimum amount of data required to achieve that perception of usefulness can be achieved in small scale scenarios. While more research is needed in order to present more conclusive results, it appears that in every learning scenario in which we expect at least 225 playbacks for a video (which may be aggregated over time), it is useful to set up an infrastructure to collect clickstream data for educational videos, to process the collected data and present the resulting information to teachers and other stakeholders. It is to be expected that in many cases, that 225 limit can be significantly lower, especially for shorter videos. One question that remains unanswered is whether data obtained from similar scenarios (say, similar courses in different schools, for example), can be aggregated together, which may reduce the impact of that lower bound. In any case, these data are at least an order of magnitude lower than those present in the literature: for those studies presenting the number of playback sessions analysed or equivalent data, Kim et al. [26], Chen et al. [38] and Shi et al. [16] talk about “millions of clicks”; Lau et al. [24] use thousands of playbacks; Ozan and Ozarslan [8] analyse thousands of events.
According to the definition of perceived usefulness by Davis [17], the results we have obtained regarding both perceived usefulness and ease of use and presentation of our data seem promising and granting further work: the interviewed teachers universally felt that the presented data gave them information about how students watch their videos that was not previously available to them, such as the frequency with which students skip to certain segments in the video or review other segments, and they were unanimous in their desire to have the infrastructure for data collection and analysis deployed to their videos in the future and the obtained information presented to them. Thus, the previously little explored application of learning analytics to educational videos in small scale learning scenarios seem deserving of further attention. More work is needed on the presentation of the data so that the presented information is easier to interpret, and to analyse how possible improvements are decided upon, brought to the videos and their results are analysed.
In the interviews that were conducted, teachers were proactive in pointing out possible data patterns that might be indicative of potential problems associated with the educational video itself or with the design of the courses in which the videos are used and which could lead to, firstly, detecting the occurrence of those problems and, secondly, taking measures to eliminate them or minimize their effects. Some examples of such patterns are a predominance of skipping forwards being indicative of a video containing redundant segments that could be eliminated (potentially just for some students, according to their previous navigation patterns), or the existence of segments that are reviewed frequently, which could be complemented with more detailed explanations for some students, again as a result of their navigation patterns. This leads us to think that there is a big opportunity to extend the scope of the research so that it is taken to more small scale scenarios, especially those in which the use of educational videos has not been the focus until very recently, where it is to be expected that more easily detectable problems may be occurring.
Regarding the limitations of our work, firstly, we must be aware we are dealing with possibly incomplete data. Collected data are not necessarily representative of the attention patterns by students: e.g., interruptions in their environment do not necessarily map to collected data. This must be made clear to teachers and other stakeholders, although we are confident that aggregate results reduce the noise in the data.
Lastly, the anonymity of the collected data, while intentional and taken into account, represents a limitation. Whenever made possible by the legal and ethical frameworks, some sort of identification should be recorded so that better information can be made available to teachers and other stakeholders to improve usefulness.
This final limitation can be easily addressed. The first presents an opportunity for analysis in more controlled environments so that we may have better information about the correlation of clickstream data patterns and their possible real-life sources.

6. Conclusions and Future Lines of Work

Our main contribution with this work is applying the TAM to check if teachers perceive the collected educational video learning analytics data as useful, with positive results. We have no knowledge of any works in the literature that have studied formally the perception of usefulness of learning analytics data for educational video, at this scale or any other scale. We have also gathered some initial information about the minimum amount of data to be collected so they are perceived as useful. A secondary contribution is the development and testing of a data collection system for educational video learning analytics that is usable and easy to deploy for small scale scenarios, which can be used to collect data for first- and third-party learning resources and, especially, that has been released as open-source software. Moreover, we have developed a series of novel, if basic, visualizations tailored for our low volume of data and the objective of presenting learner behaviour at this scale and allowing for future teacher intervention at an individual or small group level.
Finally, we remark on avenues for future work, which include: the expansion of the research to more scenarios in order to collect data from more sources and in a variety of educational environments that may help paint a clearer and more complete picture; work in order to reduce the limitations we have observed and their impact; further research about how the data can be presented to teachers and other stakeholders, including the use of visualizations found in the literature; obtaining more information regarding student actions; lastly, analysing the types of feedback that may be the most useful to teachers and other stakeholders. We would especially like to highlight is that after the research expands to more courses, scenarios and educational videos, it should become possible to build a repository of patterns and their possible explanations, and then detect those patterns automatically in the data so that better diagnostic information can be presented.

Author Contributions

Conceptualization, C.C., G.C. and A.-E.G.-R.; methodology, C.C., G.C. and A.-E.G.-R.; software, C.C.; investigation, C.C.; resources, C.C.; data curation, C.C.; writing—original draft preparation, C.C.; writing—review and editing, C.C., G.C. and A.-E.G.-R.; visualization, C.C.; supervision, G.C. and A.-E.G.-R. All authors have read and agreed to the published version of the manuscript.

Funding

This research received no external funding.

Institutional Review Board Statement

The study was conducted according to the guidelines of the Declaration of Helsinki. The Institutional Review Board of the Open University of Catalonia was contacted and concluded no further authorisation was required for the study.

Informed Consent Statement

According to the Institutional Review Board, and due to the anonymity of the collected data, no informed consent was required from subjects involved in the study.

Data Availability Statement

The data presented in this study are available on request from the corresponding author. The data are not publicly available due to concerns about the possibility of deanonimization.

Acknowledgments

We would like to thank all teachers contacted for the study, and in particular M. Elena Rodríguez-González.

Conflicts of Interest

The authors declare no conflict of interest.

References

  1. Tiernan, P. An inquiry into the current and future uses of digital video in University Teaching. Educ. Inf. Technol. 2015, 20, 75–90. [Google Scholar] [CrossRef]
  2. Makarem, S.C. Using online video lectures to enrich traditional face-to-face courses. Int. J. Instr. 2015, 8, 155–164. [Google Scholar] [CrossRef]
  3. Wieling, M.B.; Hofman, W.H.A. The impact of online video lecture recordings and automated feedback on student performance. Comput. Educ. 2010, 54, 992–998. [Google Scholar] [CrossRef]
  4. Kaltura Inc. The State of Video in Education 2020; Kaltura Inc.: New York, NY, USA, 2020. [Google Scholar]
  5. Lange, C.; Costley, J. Improving online video lectures: Learning challenges created by media. Int. J. Educ. Technol. High. Educ. 2020, 17, 1–18. [Google Scholar] [CrossRef]
  6. Costley, J.; Christopher, H.L. Video lectures in e-learning: Effects of viewership and media diversity on learning, satisfaction, engagement, interest, and future behavioral intention. Interact. Technol. Smart Educ. 2017, 14, 14–30. [Google Scholar] [CrossRef]
  7. Nagy, J.T. Evaluation of online video usage and learning satisfaction: An extension of the technology acceptance model. Int. Rev. Res. Open Distrib. Learn. 2018, 19. [Google Scholar] [CrossRef] [Green Version]
  8. Ozan, O.; Ozarslan, Y. Video lecture watching behaviors of learners in online courses. Educ. Media Int. 2016, 53, 27–41. [Google Scholar] [CrossRef]
  9. Razak, R.A.; Kaur, D.; Halili, S.H.; Ramlan, Z. Flipped ESL teacher professional development: Embracing change to remain relevant. Teach. Engl. Technol. 2016, 16, 85–102. [Google Scholar]
  10. Hung, J.C.-S.; Chiang, K.-H.; Huang, Y.-H.; Lin, K.-C. Augmenting teacher-student interaction in digital learning through affective computing. Multimed. Tools Appl. 2017, 76, 18361–18386. [Google Scholar] [CrossRef]
  11. Mozilla. Mozilla/Popcorn-Js: The HTML5 Media Framework. GitHub. Available online: https://github.com/mozilla/popcorn-js (accessed on 31 August 2021).
  12. H5P. Available online: https://h5p.org/ (accessed on 31 August 2021).
  13. Giannakos, M.N.; Chorianopoulos, K.; Chrisochoides, N. Making sense of video analytics: Lessons learned from clickstream interactions, attitudes, and learning outcome in a video-assisted course. Int. Rev. Res. Open Distrib. Learn. 2015, 16, 260–283. [Google Scholar] [CrossRef] [Green Version]
  14. Marshall, J.; Marshall, F.; Chauhan, A. Students’ video watching patterns within online instructional videos. In Innovate Learning Summit 2020; Association for the Advancement of Computing in Education (AACE): Morgantown, WV, USA, 2020; pp. 202–210. [Google Scholar]
  15. What Is XAPI Aka the Experience API or Tin Can API. xAPI.com. Available online: https://xapi.com/overview/ (accessed on 31 August 2021).
  16. Shi, C.; Fu, S.; Chen, Q.; Qu, H. VisMOOC: Visualizing video clickstream data from massive open online courses. In Proceedings of the 2015 IEEE Pacific visualization symposium (PacificVis), Hangzhou, China, 14–17 April 2015; IEEE: New York, NY, USA, 2015; pp. 159–166. [Google Scholar]
  17. Davis, F.D.; Davis, G.; Morris, M.; Venkatesh, V. Technology acceptance model. J. Manag. Sci. 1989, 35, 982–1003. [Google Scholar]
  18. Davis, F.D. A Technology Acceptance Model for Empirically Testing New End-User Information Systems: Theory and Results. Ph.D. Thesis, Massachusetts Institute of Technology, Cambridge, MA, USA, 1985. [Google Scholar]
  19. Lee, Y.; Kozar, K.A.; Larsen, K.R.T. The technology acceptance model: Past, present, and future. Commun. Assoc. Inf. Syst. 2003, 12, 50. [Google Scholar] [CrossRef]
  20. Cruse, E. Using educational video in the classroom: Theory, research and practice. Libr. Video Co. 2006, 12, 56–80. [Google Scholar]
  21. Kay, R.H. Exploring the use of video podcasts in education: A comprehensive review of the literature. Comput. Hum. Behav. 2012, 28, 820–831. [Google Scholar] [CrossRef]
  22. Poquet, O.; Lim, L.; Mirriahi, N.; Dawson, S. Video and learning: A systematic review (2007–2017). In Proceedings of the 8th International Conference on Learning Analytics and knowledge, Sydney, Australia, 7–9 March 2018; pp. 151–160. [Google Scholar]
  23. Yousef, A.; Fahmy, M.; Chatti, M.A.; Schroeder, U. Video-based learning: A critical analysis of the research published in 2003–2013 and future visions. In Proceedings of the eLmL 2014: The Sixth International Conference on Mobile, Hybrid, and Online Learning, Barcelona, Spain, 23–27 March 2014; pp. 112–119. [Google Scholar]
  24. Lau, K.; Vincent, H.; Farooque, P.; Leydon, G.; Schwartz, M.L.; Sadler, R.M.; Moeller, J.J. Using learning analytics to evaluate a video-based lecture series. Med Teach. 2018, 40, 91–98. [Google Scholar] [CrossRef]
  25. Atapattu, T.; Falkner, K. Impact of lecturer’s discourse for students’ video engagement: Video learning analytics case study of moocs. J. Learn. Anal. 2018, 5, 182–197. [Google Scholar] [CrossRef] [Green Version]
  26. Kim, J.; Guo, P.J.; Seaton, D.T.; Mitros, P.; Gajos, K.Z.; Miller, C. Understanding in-video dropouts and interaction peaks in online lecture videos. In Proceedings of the First ACM Conference on Learning@ Scale Conference, Atlanta, GA, USA, 4–5 March 2014; pp. 31–40. [Google Scholar]
  27. Panigrahi, R.; Srivastava, P.R.; Sharma, D. Online learning: Adoption, continuance, and learning outcome—A review of literature. Int. J. Inf. Manag. 2018, 43, 1–14. [Google Scholar] [CrossRef]
  28. Brown, M.; McCormack, M.; Reeves, J.; Brook, D.C.; Grajek, S.; Alexander, B.; Bali, M. 2020 Educause Horizon Report Teaching and Learning Edition; EDUCAUSE: Louisville, CO, USA, 2020. [Google Scholar]
  29. Sclater, N.; Peasgood, A.; Mullan, J. Learning analytics in higher education. Lond. Jisc. Accessed Febr. 2016, 8, 176. [Google Scholar]
  30. Romero, C.; Sebastian, V. Educational data mining and learning analytics: An updated survey. Wiley Interdiscip. Rev. Data Min. Knowl. Discov. 2020, 10, e1355. [Google Scholar] [CrossRef]
  31. Mirriahi, N.; Vigentini, L. Analytics of learner video use. In Handbook of Learning Analytics; SOLAR: New York, NY, USA, 2017; pp. 251–267. [Google Scholar]
  32. Li, N.; Kidziński, Ł.; Jermann, P.; Dillenbourg, P. MOOC video interaction patterns: What do they tell us? In European Conference on Technology Enhanced Learning; Springer: Cham, Switzerland, 2015; pp. 197–210. [Google Scholar]
  33. Renkl, A. The worked-out examples principle in multimedia learning. In The Cambridge Handbook of Multimedia Learning; Cambridge University Press: Cambridge, UK, 2005; pp. 229–245. [Google Scholar]
  34. Bisra, K.; Liu, Q.; Nesbit, J.C.; Salimi, F.; Winne, P.H. Inducing self-explanation: A meta-analysis. Educ. Psychol. Rev. 2018, 30, 703–725. [Google Scholar] [CrossRef]
  35. Roy, M.; Michelene, T.H. The self-explanation principle in multimedia learning. In The Cambridge Handbook of Multimedia Learning; Cambridge University Press: New York, NY, USA, 2005; pp. 271–286. [Google Scholar]
  36. Kateja, R.; Rohith, A.; Kumar, P.; Sinha, R. VizClick visualizing clickstream data. In Proceedings of the 2014 International Conference on Information Visualization Theory and Applications (IVAPP), Lisbon, Portugal, 5–8 January 2014; IEEE: New York, NY, USA, 2014; pp. 247–255. [Google Scholar]
  37. Goulden, M.C.; Gronda, E.; Yang, Y.; Zhang, Z.; Tao, J.; Wang, C.; Duan, G.X.; Ambrose, A.; Abbott, K.; Miller, P. CCVis: Visual analytics of student online learning behaviors using course clickstream data. Electron. Imaging 2019, 2019, 681-1–681-12. [Google Scholar] [CrossRef] [Green Version]
  38. Chen, Y.; Chen, Q.; Zhao, M.; Boyer, S.; Veeramachaneni, K.; Qu, H. DropoutSeer: Visualizing learning patterns in massive open online courses for dropout reasoning and prediction. In Proceedings of the 2016 IEEE Conference on Visual Analytics Science and Technology (VAST), Baltimore, MD, USA, 23–28 October 2016; IEEE: New York, NY, USA, 2016; pp. 111–120. [Google Scholar]
  39. Wang, Y.; Chen, Z.; Li, Q.; Ma, X.; Luo, Q.; Qu, H. Animated narrative visualization for video clickstream data. In SIGGRAPH Asia 2016 Symposium on Visualization; Association for Computing Machinery: New York, NY, USA, 2016; pp. 1–8. [Google Scholar]
  40. Hu, H.; Zhang, G.; Gao, W.; Wang, M. Big data analytics for MOOC video watching behavior based on Spark. Neural Comput. Appl. 2020, 32, 6481–6489. [Google Scholar] [CrossRef]
  41. Mubarak, A.A.; Cao, H.; Zhang, W.; Zhang, W. Visual analytics of video-clickstream data and prediction of learners ‘performance using deep learning models in MOOCs’ courses. Comput. Appl. Eng. Educ. 2021, 29, 710–732. [Google Scholar] [CrossRef]
  42. Oates, B.J. Researching Information Systems and Computing; Sage: Thousand Oaks, CA, USA, 2005. [Google Scholar]
  43. Córcoles, C. Videolearninganalytics. GitHub. Available online: https://github.com/ccorcoles/videolearninganalytics (accessed on 24 September 2021).
  44. Hoel, T.; Chen, W. Privacy-driven design of Learning Analytics applications–exploring the design space of solutions for data sharing and interoperability. J. Learn. Anal. 2016, 3, 139–158. [Google Scholar] [CrossRef] [Green Version]
  45. Kitto, K.; Knight, S. Practical ethics for building learning analytics. Br. J. Educ. Technol. 2019, 50, 2855–2870. [Google Scholar] [CrossRef]
  46. UOC. Functions and Aims. Ethics Committee—Research and Innovation—(UOC). Available online: https://research.uoc.edu/portal/en/ri/activitat-rdi/comite-etica/funcions/index.html (accessed on 31 August 2021).
Figure 1. Two examples of the presentations of videos in the virtual classroom. All videos in a course are presented in a homogenous way, but differences in presentation exist among different courses. In most cases, the video or videos are embedded in the webpage with no additional features, see leftmost figure (a). In some cases, a table of contents is provided, with active links that take the user to the corresponding moment in the video, see rightmost figure (b).
Applsci 11 10366 g001
Figure 2. Single playback visualization for a typical session. The video is 810 s long (13′30″), and the playback session lasts 1013 s (16′53″). The presented session corresponds to a student watching the first 130 s of the video (1 in the figure), then pausing for 11 s (2), watching the video until the 212″ mark (3), skipping backwards 6″ (4), etc.
Applsci 11 10366 g002
Figure 3. A scatter plot representing skipping behaviour for a typical educational video. Two jumps have been highlighted. Jump 1 represents a short backwards jump. Jump 2 represents a jump from the beginning of the video to the 16:04 mark.
Applsci 11 10366 g003
Figure 4. A scatter plot representing pausing behaviour for a typical video.
Applsci 11 10366 g004
Table 1. Summary of the analysed videos.
CourseNumber of
Videos
Video DurationsAccessesSessions
Longer than 10″
Recorded Events
Database design4 (2 + 2)8:34–15:101208572 (47.4%)17,181
Introductory statistics47:11–12:07408320 (78.4%) 6239
Electronics8 (4 + 4)4:01–7:04334243 (72.8%)2592
Non-traditional databases206:36–1:00:3067412205 (32.7%)44,987
Table 2. An example of the collected data for a typical session. Parameters are described in the text.
Page AccessedVideoTimestampActionParameters
Tue, 10 March 2019 11:27:44 GMT05585_0111:27:44 GMTpage loaded
05585_0111:27:49 GMTplay0
05585_0111:27:50 GMTseek77.867
05585_0111:27:51 GMTseek196.011
Publisher’s Note: MDPI stays neutral with regard to jurisdictional claims in published maps and institutional affiliations.

