Abstract
This paper presents environmental acute problems from increasing noise levels caused by automobile and rail transport. Noise barriers are considered to be an effective element in reducing noise in densely populated urban areas. However, do these barriers have the correct height, shape, material design, and construction? In the materials and methods, the basic characteristics of noise barrier, sound absorption, and sound insulation are described. Further, measurement methods of the insertion loss of outdoor noise barriers of all types using the direct and indirect method according to standard ISO 10847 and the Adrienne method according to standards EN 1793-5 and EN 1793-6 are presented. The measurement results of insertion loss of the selected noise barrier obtained by the indirect method showed a value of 19.1 dB(A) of insertion loss. This result was compared with simulation by our own software based on the CNOSSOS methodology, giving value of 19.6 dB(A), which is a good correlation. The Adrienne method was used for determination of the airborne sound insulation index of another noise barrier, giving a value of the single-number rating of the sound insulation of the barrier of 28 dB. In discussion, according to EN 1793-2, this value assigns an insulation index of category D3, which means that the barrier is high quality and has satisfactory airborne sound insulation. The advantages and disadvantages of both methods according to STN ISO 10847 and STN EN 1793-6 were discussed. We concluded that the main advantage of the method Adrienne—TN EN 1793-6 is that it can be used in situ under direct sound field conditions and can directly evaluate the sound insulation index of the whole barrier structure.
1. Introduction
One of the acute problems from the point of view of environmental protection is the increase of noise levels produced by transport. Noise is increasing, especially in the vicinity of traffic routes with road and rail transport. Traffic noise increases mainly with the number of vehicles and with increasing load capacity of trucks. Traffic noise is a random variable. Therefore, an equivalent noise level is used for its evaluation. Noise clearly and unequivocally produces negative effects on human health. Even today, people underestimate its harmful effects on health [1].
In 2010, according to the European Environmental Agency (EEA), noise from railway transport during the day affected approximately 12 million inhabitants of the European Union where the sound pressure level was higher than 55 dB, and approximately 9 million inhabitants were affected by the noise at night [2]. Around 56 million people (54%) in the European Union live in places with more than 250,000 people, and they are subjected to road traffic noise of more than the average LDEN (day-evening-night) of 55 dB per year, which is regarded as health threatening [3,4]. In Slovakia, the situation is similar, as the length of roads is about 5 times longer than railway lines (18,000 and 3600 km, respectively).
Currently, modernization of the railway infrastructure is underway on the railway lines of the main corridor Košice–Žilina–Bratislava in Slovakia, associated with the transition to a qualitatively new higher standard, which includes the use of new types of trainsets, some with tilting bodies, that will be able to operate on a modernized line at a speed of up to 160 km/h [5]. As for road transport in Slovakia, highways have been under construction since 1972. The D1 highway is the oldest and longest of them, which connects Bratislava, Trnava, Trenčín, Žilina, Martin, Poprad, Prešov, Košice, and the Slovak-Ukrainian border. It is part of the European roads E50, E58, E75, E442, and E571 [6]. In this context, the environmental impacts of this modernization are also important areas. The greatest impacts of transport on the environment include noise and vibration and their impact on inhabitants living near traffic lines [7,8].
Unlike road traffic, where permissible limits for noise sources have existed in the EU since the 1970s, noise standards for railways did not come into force until the beginning of the 21st century [9]. In 2007, Decree 549/2007 of the Ministry of Health of the Slovak Republic [10] was issued. According to this decree, the value of the permissible value for noise level LAeq p from road and rail traffic for residential areas during the day and evening should not exceed 50 dB(A) and 45 dB(A) during the night. For areas around transport communication (100 m from the axis of the traffic communication) for road transport, it is 60 dB(A) during the day and evening and 50 dB(A) during the night and for railway transport, it is 60 dB(A) during the day and evening and 55 dB(A) during the night [10].
The construction and improvement of road infrastructure in Slovakia is currently affected by the amount of state funds. One of the cost components is the cost of noise abatement measures as noise significantly affects human health as well as the value of the affected area [11]. These harmful acoustic effects on humans can be reduced by designing passive noise protection devices, among them noise barriers [12]. The history of building noise barriers dates back to the middle of the 20th century, when the first noise barriers were built in the United States, protecting the population from road traffic noise [13].
The first noise barriers were constructed as self-supporting monolithic walls with a mostly smooth surface. The visual impact of these walls was often neglected, and the walls mostly did not fit into the surrounding environment. Over time, requirements also began to be placed on the walls in terms of their aesthetic and architectural design, and segmented walls began to be built.
In the territory of the Slovak Republic, the construction of noise barriers was developed in the late 1980s and early 1990s of the 20th century, when traffic, especially road traffic, increased accompanied with increased noise emissions to the surrounding residential areas. There was also a change in political and social views on the protection of the environment and the protection of citizens’ rights [13]. Along railway lines, noise barriers began to be built in the first half of the 1990s, in connection with the modernization of railways. There was a significant increase after 2007, when the aforementioned Decree of the Government of the Slovak Republic was adopted [10].
Experts recommended prioritizing noise-mitigating measures at source, as they are more cost effective. Nevertheless, according to the latest figures [14], a total of EUR 150–200 million is being spent in Europe on the construction of noise barriers. Noise barriers are an effective element in reducing noise in densely populated urban areas [15]. However, are these barriers the correct height, shape, material design, and construction?
For better design of noise barriers and to identify sufficient protection of the population against noise generated by road traffic, it is necessary to determine their effectiveness by the so-called insertion loss of the barrier. Their effectiveness is determined by the direct and indirect method and the Adrienne method. This paper presents the individual methods, measurements by the indirect method, verification of the barrier by our own simulation method, and measurement by the Adrienne method for assessment of the noise barriers’ effectiveness.
This article will also address methods used for evaluating the effectiveness of noise barriers on roads in Slovakia. The main objectives solved within are as follows:
- Possibilities of evaluating of noise barriers’ effectiveness,
- Advantages and disadvantages of the individual methods of evaluating noise barriers’ acoustic characteristics;
- Measurement methods of acoustic performance and their realization on real noise barriers on selected sections of highways; and
- Discussion of the measured results from individual methods and their applicability.
2. Materials and Methods
Based on acoustic properties, noise barriers can be divided into two groups, namely absorbing barriers, which absorb noise by their construction, and reflective barriers, from which noise is largely reflected. A special group then consists of reactive barriers, which are barriers that contain cavities or resonators. The structure of the barrier and its appearance is largely determined by its acoustic action. While both absorptive and reactive barriers are relatively massive, reflective barriers have a lighter structure and are often transparent [13].
The acoustic and aesthetic effects of noise barriers are influenced by their shape and the material used. The most commonly used barriers include concrete, wood or wood-chip cement, bricks, metal, plastic, acrylic glass, and gabion, and recycled materials are also increasingly used [13].
2.1. Theory of Sound Energy Propagation Through a Noise Barrier
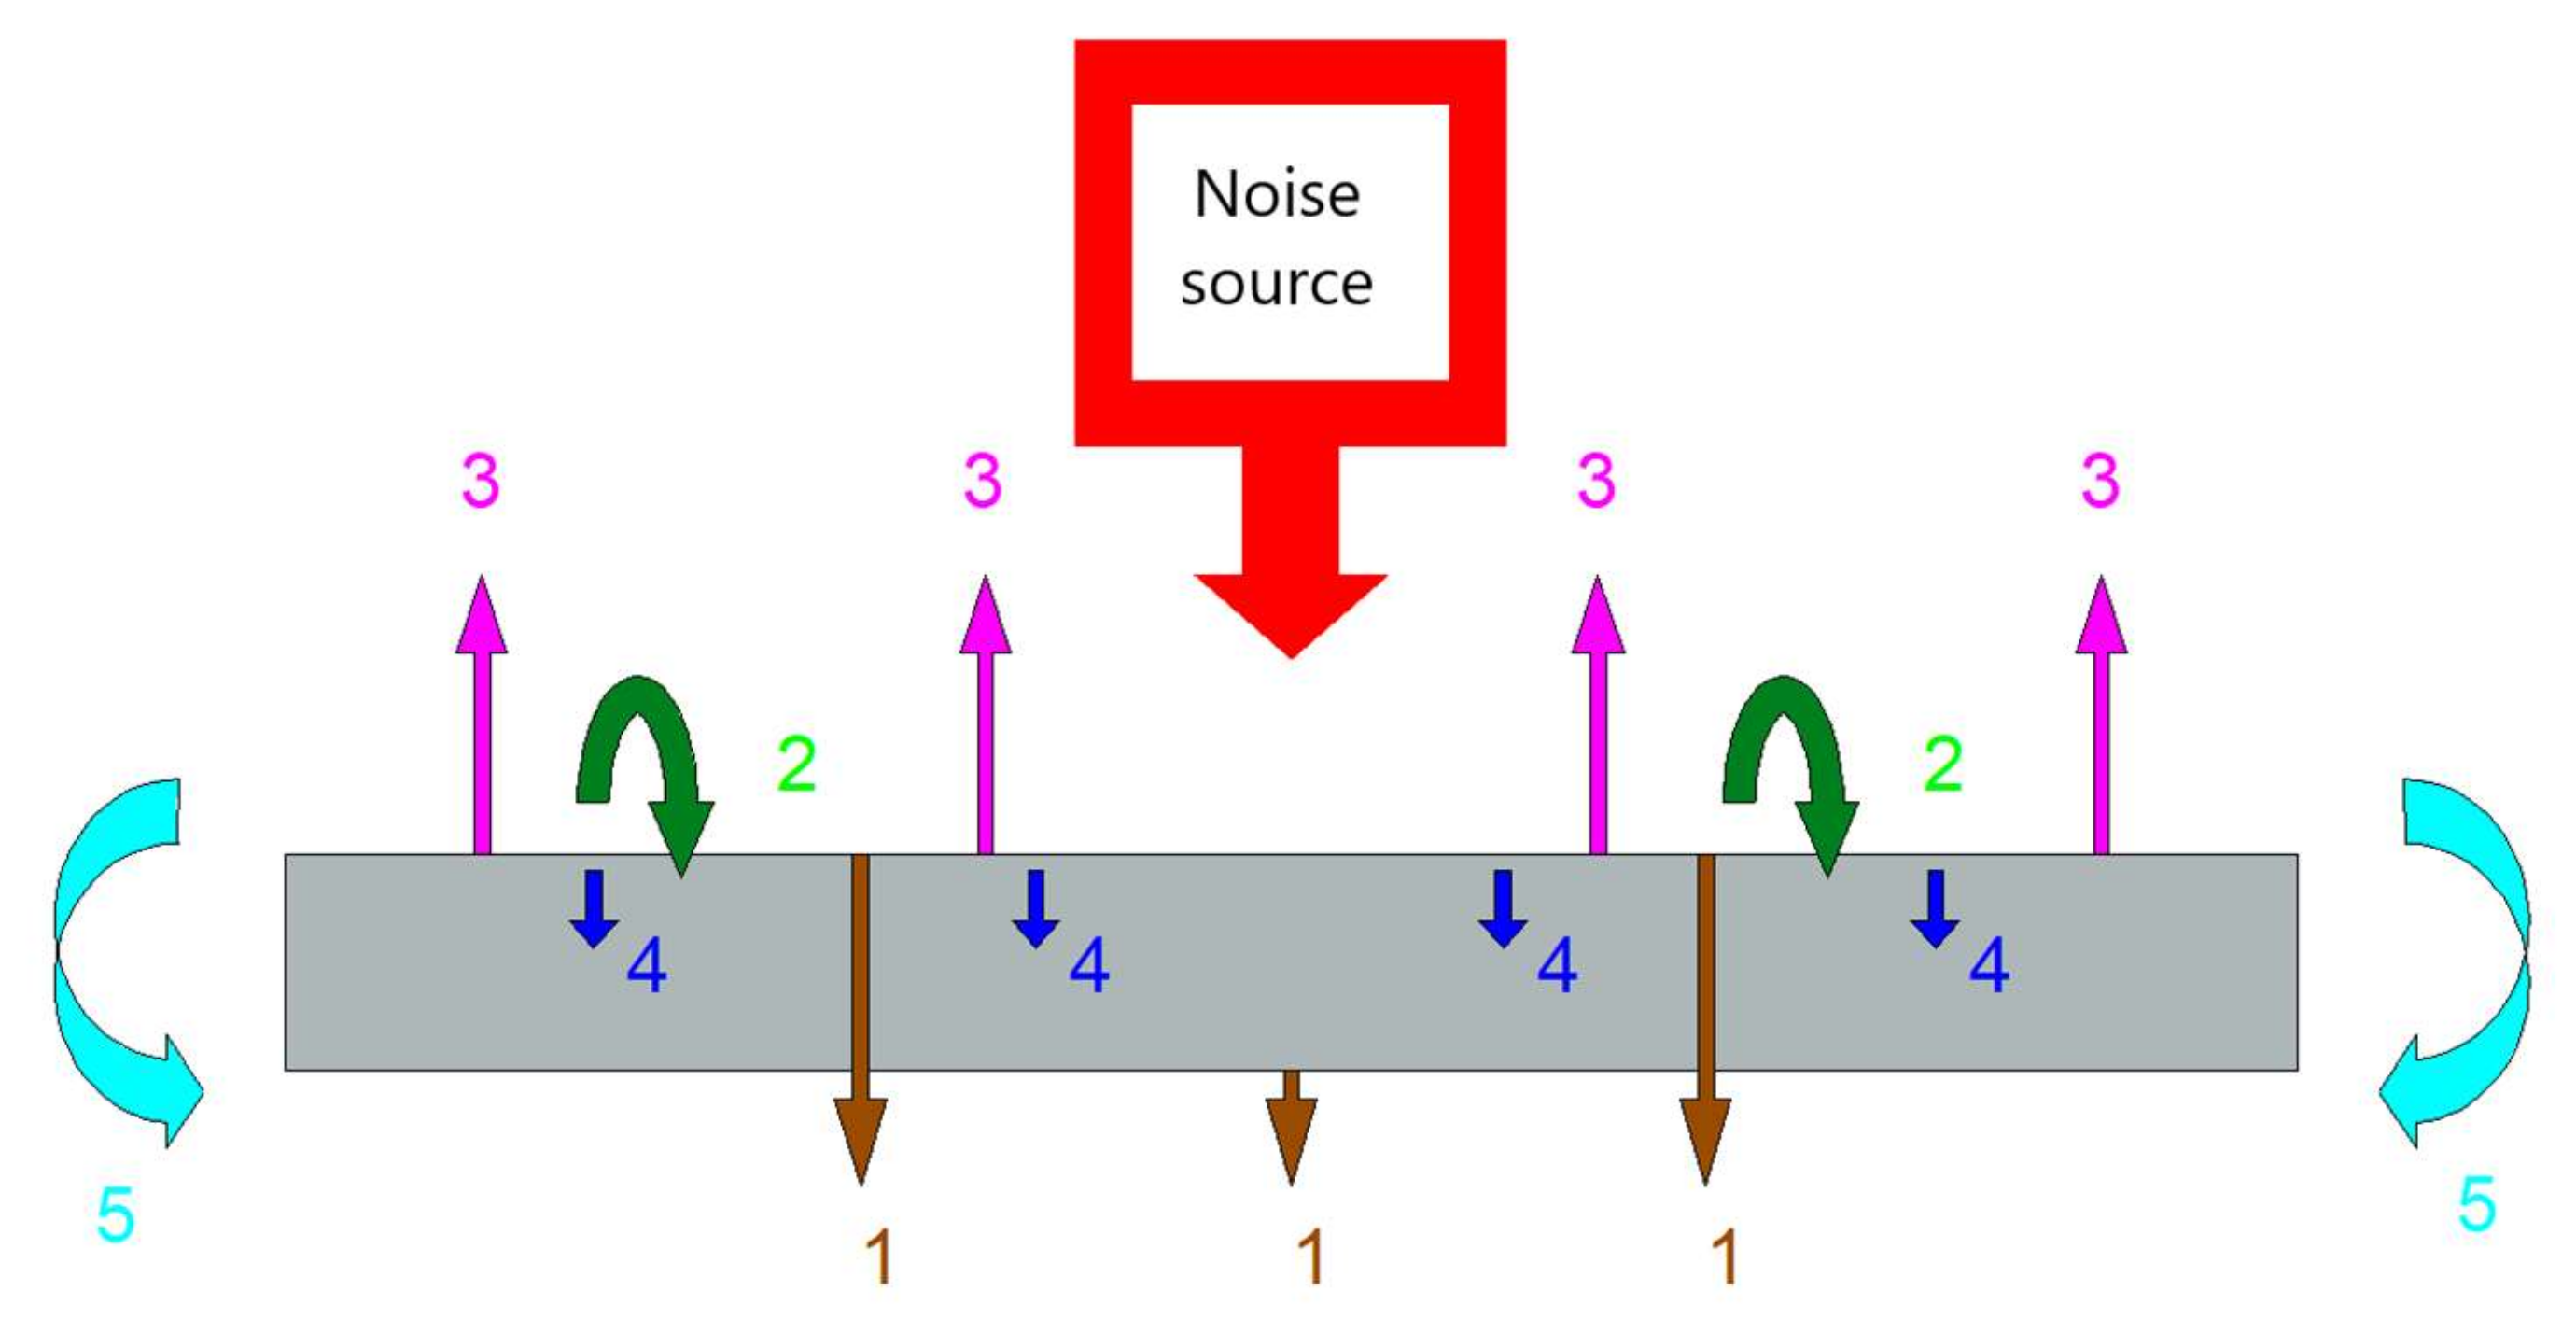
The sound energy propagating from the source is divided into five components on the barrier, which are evident from Figure 1, while portions of the sound energy [16]:
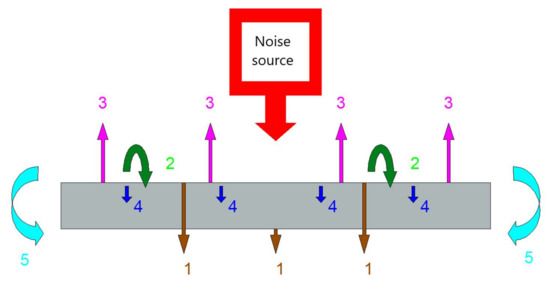
Figure 1.
Schematic representation of the propagating sound energy from a noise source.
- Passes through the barrier to the recipient;
- Propagates around the upper edge of the noise barrier (diffraction);
- Is reflected back from the surface of the noise barrier;
- Is absorbed by the barrier (absorption); and
- Passes at the ends of the noise barrier to the receiver.
The effectiveness of a noise barrier depends on the structural elements, material, shape (vertical, tilted, angled, cantilever, arc, tunnel, gallery), height, length, and location in the landscape [17].
Large numbers of companies worldwide construct noise barriers, such as [18,19,20,21,22].
The acoustic properties of a noise barrier structure include [23]:
- Sound absorption—DLα;
- Sound insulation—DLSI,G; and
- Sound reflection—RIj.
2.1.1. Sound Absorption
To evaluate the sound absorption of soundproof walls, a single number rating of sound absorption DLα is used, determined by laboratory measurements and given by Equation (1) [23]:
where:
- αSi—sound absorption coefficient in the i-th one-third octave band—is the ability of the body surface to absorb sound; the coefficient takes values from 0 to 1; 18 is a number of one-third octave bands; and
- Li—sound pressure level (A) of the normalized traffic noise spectrum in the i-th one-third octave band (dB).
From a design point of view, it is effective for acoustic noise barriers to have a sound-absorbing surface (with a higher value of α).
If, in addition to determining the DLα value, the sound absorption needs to be categorized, the categories listed in Table 1 are used.

Table 1.
Sound absorption categories [24].
In the case of increased reflectivity of the obstacle surface, the reflected sound energy contributes to an increase in the noise level in the space in front of the obstacle, and thus to a deterioration of the acoustic situation on the other side of the communication.
In terms of the sound absorption of a noise barrier, the following categories of barriers are used [7]:
- Reflective for DLα < 5 dB;
- Partly absorptive for 5 ≤ DLα ≤ 8 dB; and
- Absorptive for DLα > 8 dB.
2.1.2. Sound Insulation
Airborne sound insulation is the ability of a planar separating structure to transmit acoustic power propagating in air from a source into an adjacent space in an attenuated extent and is characterized by the sound insulation index SI (dB). This index is frequency dependent and increases with the area density of the separating structure. It is given in the third-octave bands in the frequency range from 100 to 3150 Hz [25]. Noise barriers must have an average sound insulation that is sufficiently great so that the sound passing directly through them is negligible compared to the sound propagating around their upper edge.
A single number rating of sound insulation determined in the laboratory is used to assess airborne sound insulation and is given by the following equation [23]:
where:
- SIi—sound insulation index in the i-th one-third octave band; and
- Li—sound pressure level (A) of the normalized traffic noise spectrum in the i-th third-octave band (dB).
Evaluation of airborne sound insulation can be categorized according to Table 2.
Table 2.
Airborne sound insulation categories [26].
2.1.3. Sound Reflection
The EN 1793-5 standard defines and focuses the measurement of the sound reflection index RI in the conditions of a direct sound field.
To determine the functional characteristics of the product (noise barrier), a single number rating of sound reflection DLRI is determined according to Equation (3) [27]:
where:
- m—the number of the lowest reliable one-third octave frequency band; according to EN 1793-5, the lowest reliable frequency is 300 Hz, which corresponds to m = 6; and
- Li—sound pressure level (A) of the normalized traffic noise spectrum in the i-th one-third octave band (dB).
The maximum theoretical value of the ratio of the sums of the expressions in Equation (3) cannot be more than 1; therefore, the value is limited to 0.99.
In general, noise barriers are made of a small number of basic elements.
In order for a barrier to be acoustically efficient and fulfill its purpose, it is necessary for the barrier to be made precisely with high-quality individual elements, without the creation of joints and leaks. In view of this fact, after construction of the barrier, it is necessary to verify its effectiveness by measurements.
Standard ISO 10847 Acoustics—In situ determination of insertion loss of outdoor noise barriers of all types [28] specifies two methods for determining the insertion loss of external noise barriers: the direct and indirect method.
The Adrienne method defined in the EN 1793-5 and EN 1793-6 standards enables the comparison of design characteristics with the values of the actual structure after the completion of construction works, which is a significant advantage of this method.
2.2. Measurement by the Direct Method According to Standard ISO 10847
With the direct method [28], measurement is performed before and after the construction of the noise barrier. This method can only be used if the barrier has not yet been installed, or it can be removed so that a barrier-free measurement can be performed. Sound pressure levels are measured at the reference point and at the point of reception without a barrier and subsequently after its installation. In both cases, the same reference point and point of reception must be used. The equivalence of resources, terrain profiles, obstacles, if any, and terrain surfaces must be met.
For a valid determination of the insertion loss, the noise source must be equivalent to the measurement without a barrier and the measurement after its installation. An unregulated natural resource for which a noise barrier is constructed is usually the best source. However, it is usually very difficult to ensure its stability. Therefore, a regulated natural source can be used, in which one or more test vehicles are selected as typical sources and used as a regulated natural source for without barrier and with barrier measurements. It is also possible to use a speaker with typical traffic noise.
A regulated artificial noise source is used when the equivalence of a natural source cannot be ensured. An artificial source must be used for both measurements with and without a barrier. The operating parameters of the artificial source must be as close as possible the characteristics of the natural source.
The microphone reference point is the point where the sound of the source is minimally affected by the noise barrier installed or planned. The reference microphone is placed at a point in the vertical plane containing the barrier so that the equivalence of the source can be checked. The height of the reference microphone must be at least 1.5 m above the upper edge of the barrier.
The insertion loss of the noise barrier is given by Equation (4):
where:
- DIL—insertion loss of the noise barrier;
- Lref, B—sound pressure level at the reference point without a barrier;
- Lr,B—sound pressure level at the reception point without a barrier;
- Lref,A—sound pressure level at the reference point with a barrier; and
- Lr,A—sound pressure level at the point of reception with a barrier.
An alternative method is the indirect measurement method using levels measured at an equivalent location without a barrier.
2.3. Measurement by the Indirect Method According to Standard ISO 10847
If the noise barrier has been installed and cannot be easily removed to allow direct measurement without the barrier, an estimate of the sound pressure level is obtained at a barrier-free location equivalent to the location under consideration and measurement by the indirect method [28]. The location at the same distance from the axis of the traffic flow with and without the noise barrier is chosen, taking into account that the natural environmental conditions (terrain reflectivity, terrain profile, free sound propagation without acoustic shadow or reflections from buildings) are the same. The equivalence of the measuring point refers to the equivalence of noise sources, terrain profiles, terrain surface, and obstacles. The value of the insertion loss of the noise barrier, D′IL, is given by Equation (5) complemented by Equations (6) and (7):
where:
- D′2IL—indirectly measured insertion loss of the noise barrier;
- ΔLA—theoretical value of the sound pressure expressed by the calculation with a barrier;
- ΔLB—theoretical value of the sound pressure expressed by the calculation without a barrier;
- Cr—correction factors for a free field in the hemisphere (Cr = 0 dB); and
- C′r—correction factors for reflective surfaces (C′r = 6 dB).
2.4. Measurement of Sound Insulation of a Barrier by the Adrienne Method
The purpose of this measurement is to demonstrate the value of the sound insulation of the noise barrier in situ by the Adrienne method in accordance with EN 1793-5 [27] and EN 1793-6 [29]. Noise reduction devices along roads must be soundproof so that the sound passing through the device is negligible in comparison with the sound bent over its top. This European Standard specifies a test method for assessing the intrinsic airborne sound insulation for the barriers designed for roads in non-reverberant conditions. This method uses the same principles and equipment used for measurement of sound reflection [27] and uses a direct sound field.
The test method can be used for:
- Determination of the intrinsic characteristics of the sound insulation index of in situ or laboratory noise abatement equipment [29];
- Determination of the in situ intrinsic characteristics of the sound insulation index of noise reduction devices [29];
- Determination of sound reflection characteristics for in situ noise reduction in real conditions [27];
- Comparison of design characteristics with the values of the actual design after the completion of construction work [27].
To calculate the sound insulation index SI as a function of the frequency in the one-third octave frequency band, the Adrienne method uses Equation (8):
where:
- hik(t)—reference transmitted pulse response component of the free field in the k-th microphone position;
- htk(t)—transmitted pulse response component in the k-th microphone position;
- wik(t)—Adrienne temporal window for the reference transmitted pulse response component of the free field in the k-th microphone position;
- wtk(t)—Adrienne temporal window for the transmitted component in the k-th microphone position;
- F—symbol of the Fourier transform;
- j—index of the j-th one-third octave frequency band (between 100 Hz and 5 kHz);
- Δfj—the width of the j-th one-third octave frequency band; and
- N = 9—number of microphone positions.
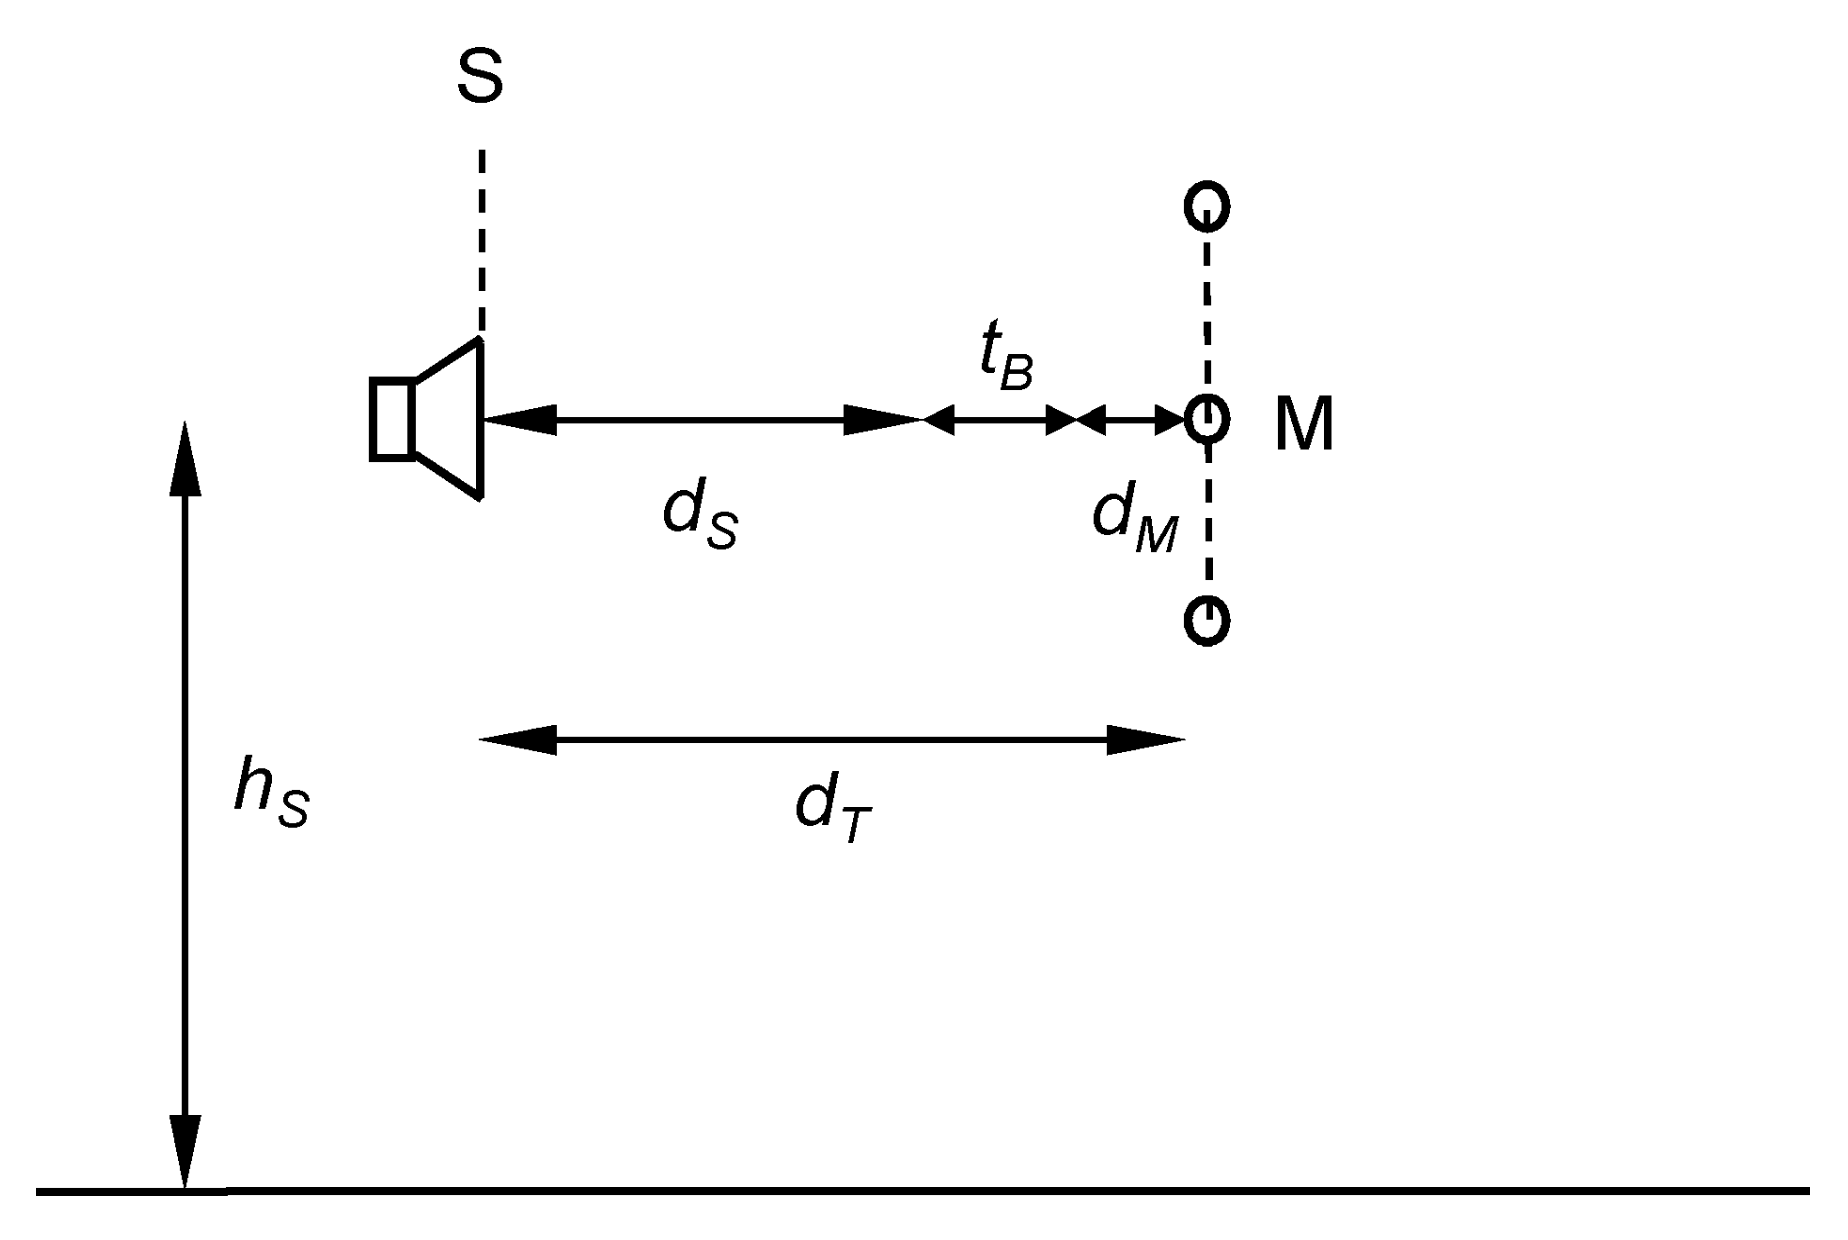
First, an in situ measurement is performed in order to calculate the impulse response of the barrier under investigation. For this purpose, a grid of nine microphones is placed behind the barrier to be tested. Using an adequate noise source located between the path and the barrier (Figure 2), a maximum sequence length is generated, long enough to overcome the ambient background noise. The impulse response thus obtained includes a direct component, a component reflected by the barrier, as well as other undesired reflected components caused by surrounding obstacles. Their effect can be eliminated by using a time window (Adrienne window) [29].
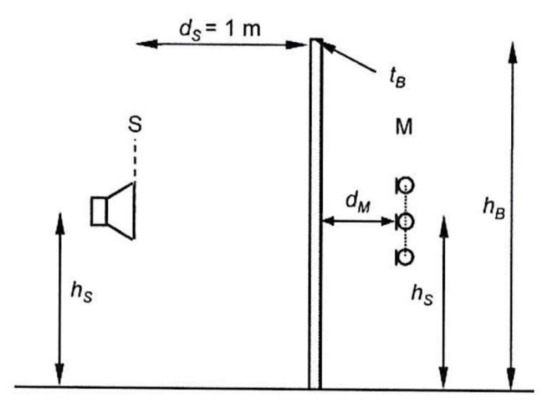
Figure 2.
Diagram of the set-up for measurement of the sound insulation index [29].
The measurement principle for the Adrienne method is as follows. The sound from the source propagates in the form of sound waves, which are partly reflected from the barrier, partly bent over the barrier, and partly transmitted through the barrier material (Figure 1). A set of microphones located on the other side of the barrier receives a sound pressure wave from a sound source that has passed through the test device and that has bent over the upper edge of the barrier.
Legend:
- M—measurement grid of nine microphones (Figure 3a);
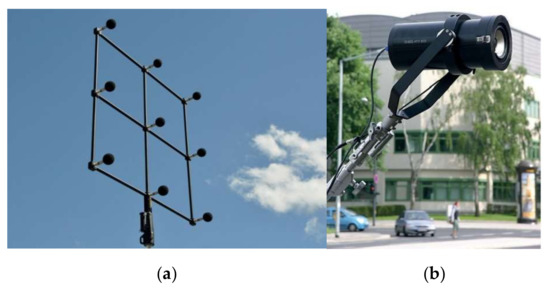 Figure 3. (a) Grid of 9 microphones; (b) noise source characteristics of given traffic [30].
 - S—noise source front panel—loudspeaker (Figure 3b);
- dS—horizontal distance (loudspeaker—noise source reference plane) at the height hS (m);
- hS—reference height—height of source position (m);
- tB—thickness of the barrier at the height hS (m);
- dM—horizontal distance of the central microphone (no 5) from the barrier at the height hS (m);
- hB—height of the barrier (m); and
- dT—horizontal distance between the loudspeaker and the central microphone at the height hS (dT = ds + tB + dM).
In the case of a large number of elements and for which the barrier is made, the indices of sound insulation of the individual elements (pole, panel) are first determined and the total sound insulation index is calculated as an acoustic average according to Equation (9):
where:
- DLSI,E–sound insulation index for acoustic element (panel) (dB); and
- DLSI,P–sound insulation index for pillar (dB).
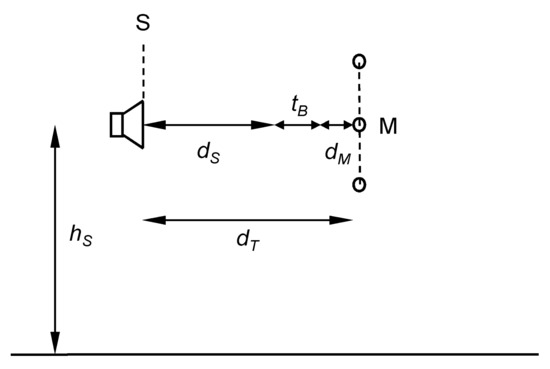
The second step performs the measurement with the same device in situ without a barrier (measurement known as the free field) (Figure 4). The impulse response obtained in this way contains only a direct component.
3. Results
Measurements of the acoustic properties of barriers by the indirect method according to the ISO 10847 standard were performed on selected sections of the motorway. Simulation was also performed by a calculation program as well as measurements by the Adrienne method according to the EN 1793-6 standard.
3.1. Determination of the Insertion Loss of a Barrier by the Indirect Method
To determine the input of noise barrier attenuation, the indirect measurement method according to [28] was chosen. The measured sound barrier is located in the section of the Motorway D1 Hričovské Podhradie–Lietavská Lúčka in the direction from Bratislava to Poprad on the right side, between the villages of Lietavská Lúčka and Bytčica at the end of the bridge on the bridge dilatation according to stationing km 35,416. Reception points represent the open space behind the barrier and are situated so that there are no obstacles in the sound propagation.
Sound barrier SO 241-00 consists of polymethacrylate panels in an aluminum frame (PMMA) with a height of H = 4 m with steel poles. This type of barrier is located only on bridge structures.
A regulated artificial noise source was chosen as the noise source (Figure 5), which was used for both measurements, i.e., for measurements without a barrier and with a barrier. It was an omnidirectional simple point source with pink noise, which was situated in the middle of the road during the measurement. The acoustic average was used to calculate the insertion loss of the noise barrier.
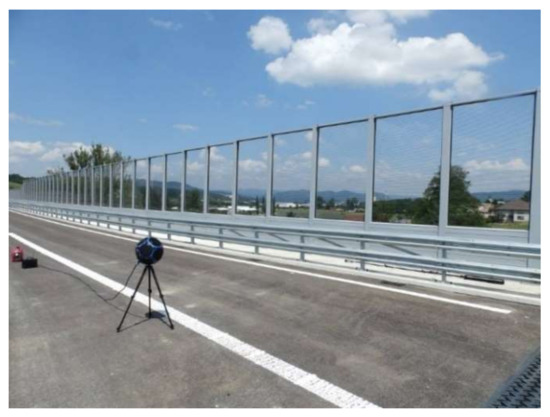
Figure 5.
Regulated artificial noise source.
The location of the measuring points according to [28] is schematically shown in Figure 6a,b) and in situ in Figure 7. The duration of measurements was 2 min in accordance with [28] due to the use of an artificial steady noise source.
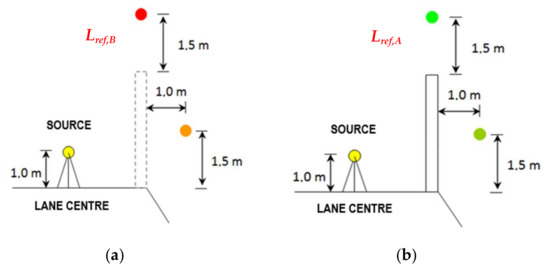
Figure 6.
Diagram of the set-up of the measuring points and noise source for the indirect method: (a) measurement without a barrier and (b) measurement with an installed barrier (distance from the source 5 m).
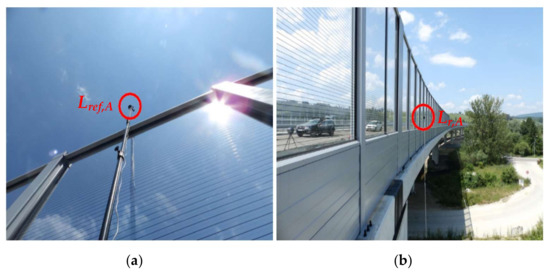
Figure 7.
Measurement of the noise barrier insertion loss SO 241-00: (a) location of the microphone above the barrier Lref,A and (b) location of the microphone at the reception point Lr,A.
- Lref,B—sound pressure level at the reference point without the barrier, microphone located at a height of 1.5 m above the level of the barrier, at an equivalent point with the place of installation of the barrier.
- Lr,B—sound pressure level at the reception point without the barrier, microphone located from the reference point Lref,B at a distance of 1.0 m behind the place of installation of the barrier and at a height of 1.5 m above the road surface.
- Lref,A—sound pressure level at the reference point with the barrier, microphone located at a height of 1.5 m above the barrier.
- Lr,A—sound pressure level at the reception point with the barrier, microphone located at a distance of 1.0 m behind the place of installation of the barrier and at a height of 1.5 m above the road surface.
In Table 3, the climatic conditions during the measurement are given.
Table 3.
Climatic conditions during the measurement.
The following instrumentation was used for the measurement: Integrating—averaging sound level meter SVAN 979 2pcs, Measuring microphone G.R.A.S—40AE 2pcs, Calibrator Nor 1251, Thermal anemometer T405-V1. We used pink, white, and pink/white noise as the excitation signal using a Nor-280 amplifier and a Nor-276 all-directional dodecahedron speaker, which emits an acoustic power level LW = 120 dB.
The results of the measurement and calculation according to Equations (5)–(7) are given in Table 4 and a diagram of the sound pressure levels in the range of the middle frequencies of the one-third octave bands and single-number rating of sound insulation with a barrier and without a barrier are presented in Figure 8 (reference values) and in Figure 9 (levels at the reception point).
Table 4.
Measurement results by the indirect method.
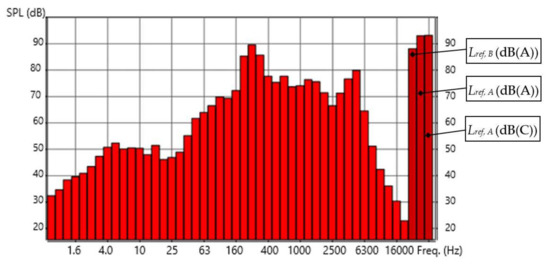
Figure 8.
Diagram of sound pressure levels in the range of middle frequencies of the one-third octave bands from 20 Hz to 20 kHz with a barrier at the reference point and the single-number rating of sound insulation at the reference point: without a barrier Lref, B in dB(A), with a barrier Lref, A in dB(A), and with a barrier Lref, A in dB(C).
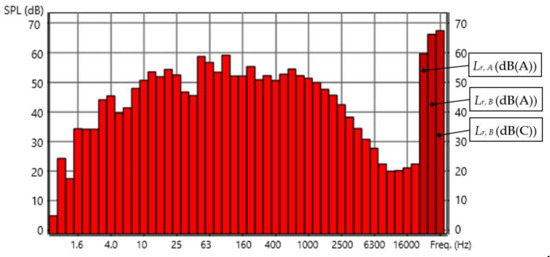
Figure 9.
Diagram of the sound pressure levels in the range of the middle frequencies of the one-third octave bands from 20 Hz to 20 kHz at the point of reception behind the barrier and the single-number rating of sound insulation at the point of reception: with a barrier Lr,A in dB(A), without a barrier Lr,B in dB(A), and without a barrier Lr,B in dB(C).
It is important to realize that the reference point is situated above the barrier (Figure 6). The sound pressure level at the reference point without the barrier is lower (Lref,B = 88.2 dB(A)) than in the case when the barrier is installed (Lref,A = 93.4 dB(A)). This is caused by the reflection of sound from the barrier surface.
The sound pressure level at the reception point with the barrier is Lr,A = 59.3 dB(A) and without the barrier is Lr,B = 67.2 dB(A). However, the insertion loss was calculated not as s simple difference of these two values, but in accordance with Equations (5)–(7). Thus, the resulting insertion loss is 19.1 dB(A).
When comparing sound pressure levels in the range of the middle frequencies of the one-third octave bands from 20 Hz to 20 kHz measured at the reference point (Figure 8) and at the reception point (Figure 9), we can see that barrier more effectively reduces sound pressure levels at frequencies higher than 63 Hz.
3.2. Computer Simulation of the Nosie Barrier Effect
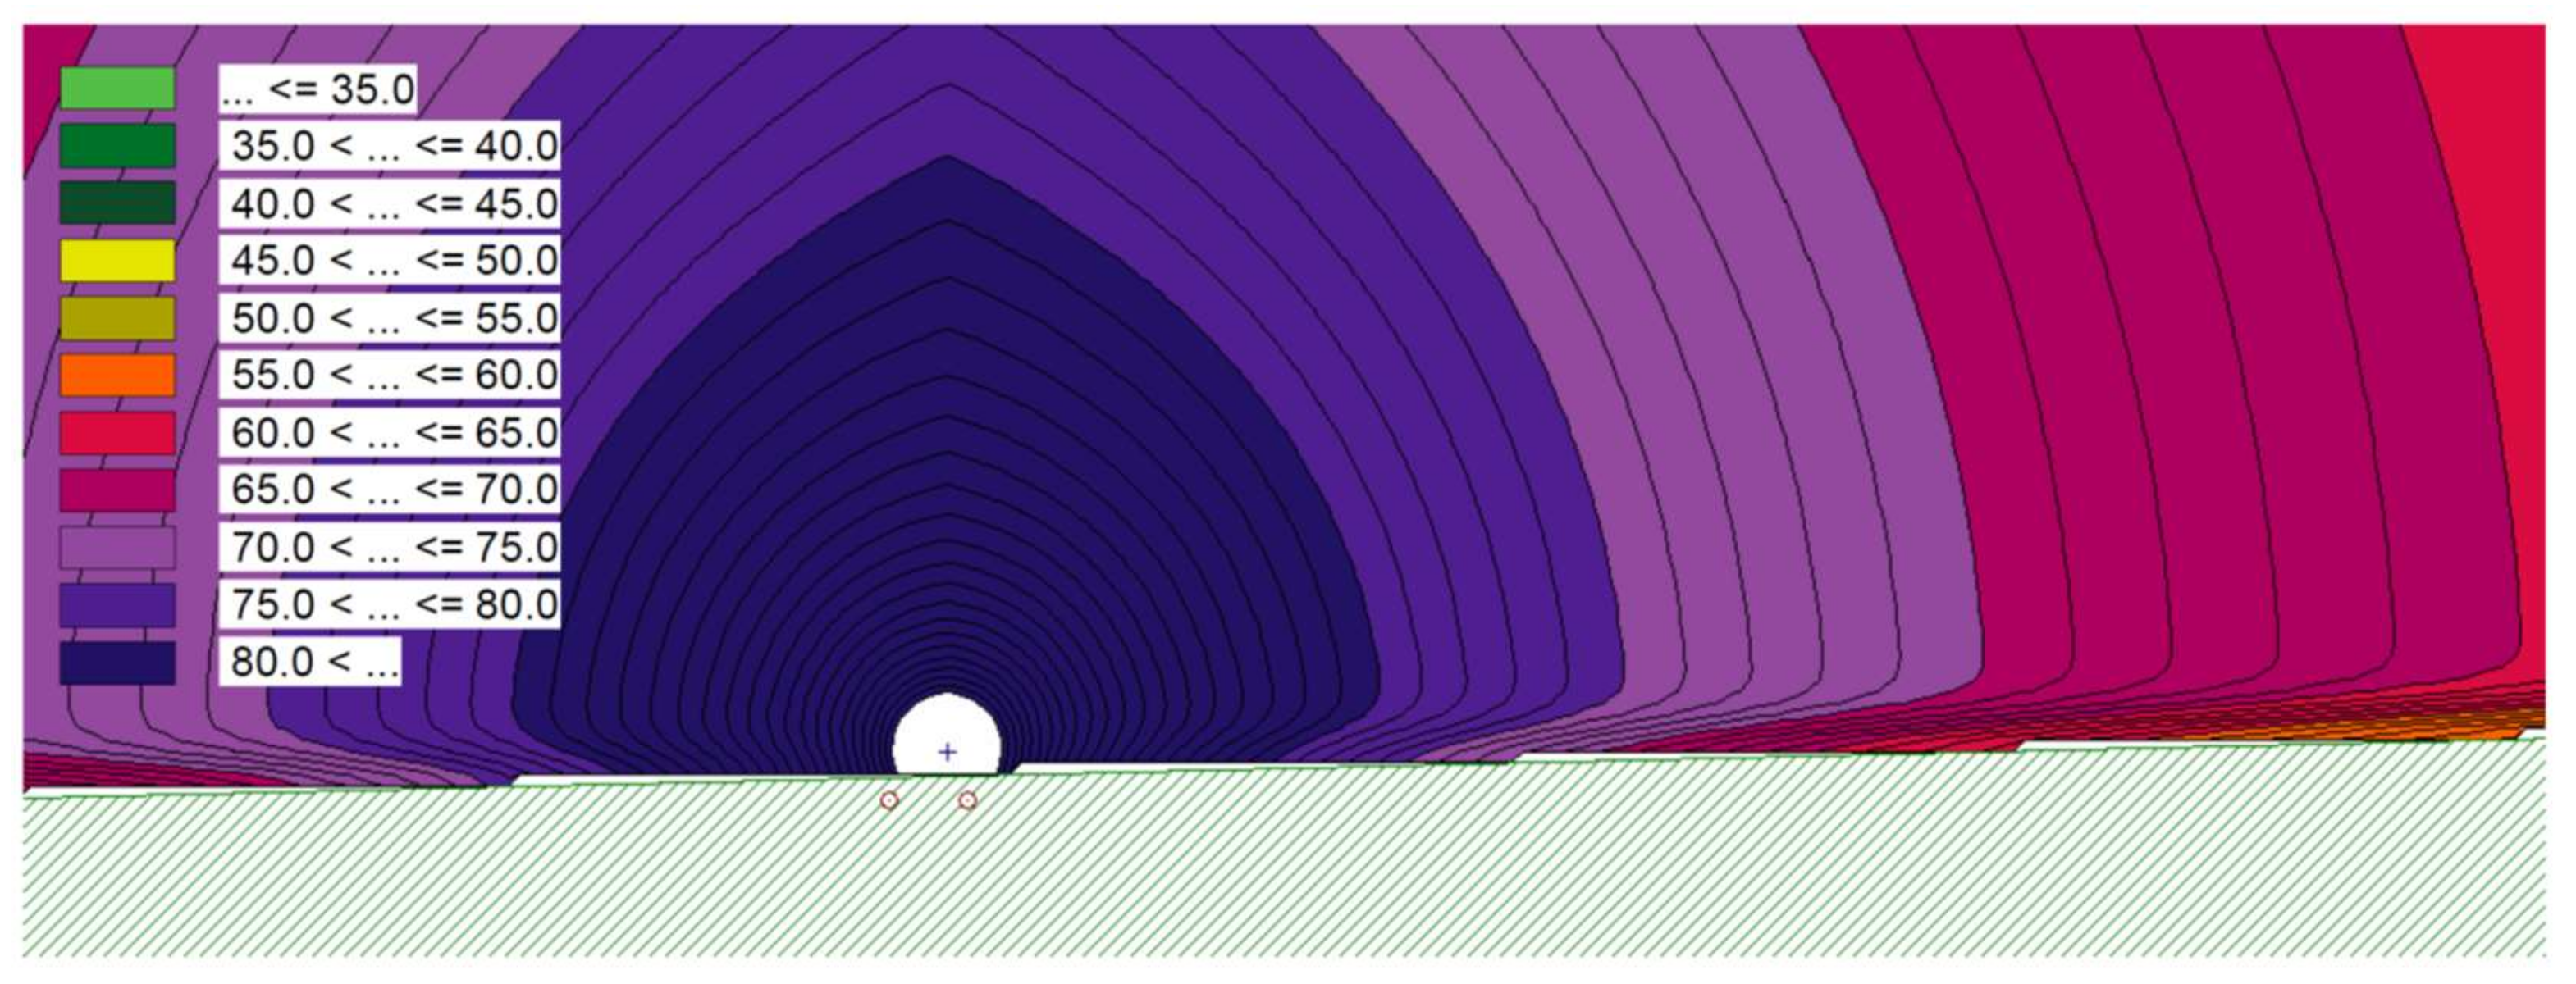
The theoretical insertion loss of the noise barrier SO 241-00, height of 4 m (DIL, theor), which is the same location as that used for the measurement by the indirect method (Figure 7), was determined on the basis of a detailed study of sound propagation in the monitored location calculated by our own software based on the CNOSSOS directive [31,32]. It expresses the maximum value of the insertion loss at the point of reception, which takes into account the attenuation of sound waves at the maximum sound insulation of the barrier. In Figure 10, simulation of the acoustic field cross-section without a barrier is shown and simulation with a noise barrier is shown in Figure 11.
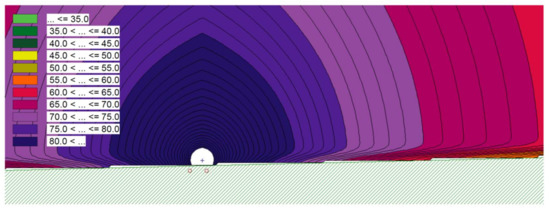
Figure 10.
Simulation of sound propagation from the source without a barrier.
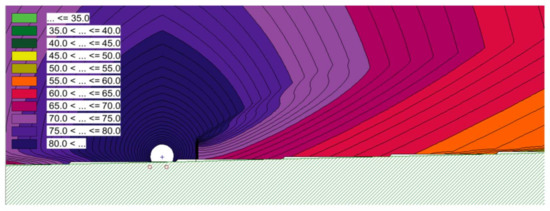
Figure 11.
Simulation of sound propagation from the source with a barrier (distance of the barrier from the noise source was 5 m).
For assessment of the barrier, in the case of a difference between the theoretical and evaluated values of the insertion loss of the barrier determined by the indirect method (ΔDIL < 2 dB), we rate it as satisfactory. It represents a satisfactory technical implementation of the barrier as a whole in the place of the permanent location in the section with a noise barrier SO 241-00 D1 Hričovské Podhradie–Lietavská Lúčka.
3.3. Measurement of Sound Insulation of the Noise Barrier 275-D4JS In Situ Using the Adrienne Method
The measurement of the barrier by the Adrienne method was performed on the D4 motorway at km 16.826. The location selection was such that no other sound-reflecting and sound-bending objects were present.
The tested noise barrier was a single-layer barrier built of three types of panels:
- 0.8-m-high concrete plinth;
- Panel SGRABS500-V: 1.2–0.8 from the manufacturer Sugremin, C/Cronos 10, 4a planta, local 1 28,037 Madrid Spain—installed from 0.8 m to a height of 2.3 m of the total height of the noise barrier; and
- Polycarbonate panel installed from a height of 2.3 m of the total height of the noise barrier. The height of the installed polycarbonate panel varied along the length of the noise barrier. The noise barrier panels were placed on steel I-profiles spaced 3 m and 4 m apart. The overall dimensions of the test specimen were 4.8 m × 7.0 m (height × width). The total thickness of the panel was 0.1 m.
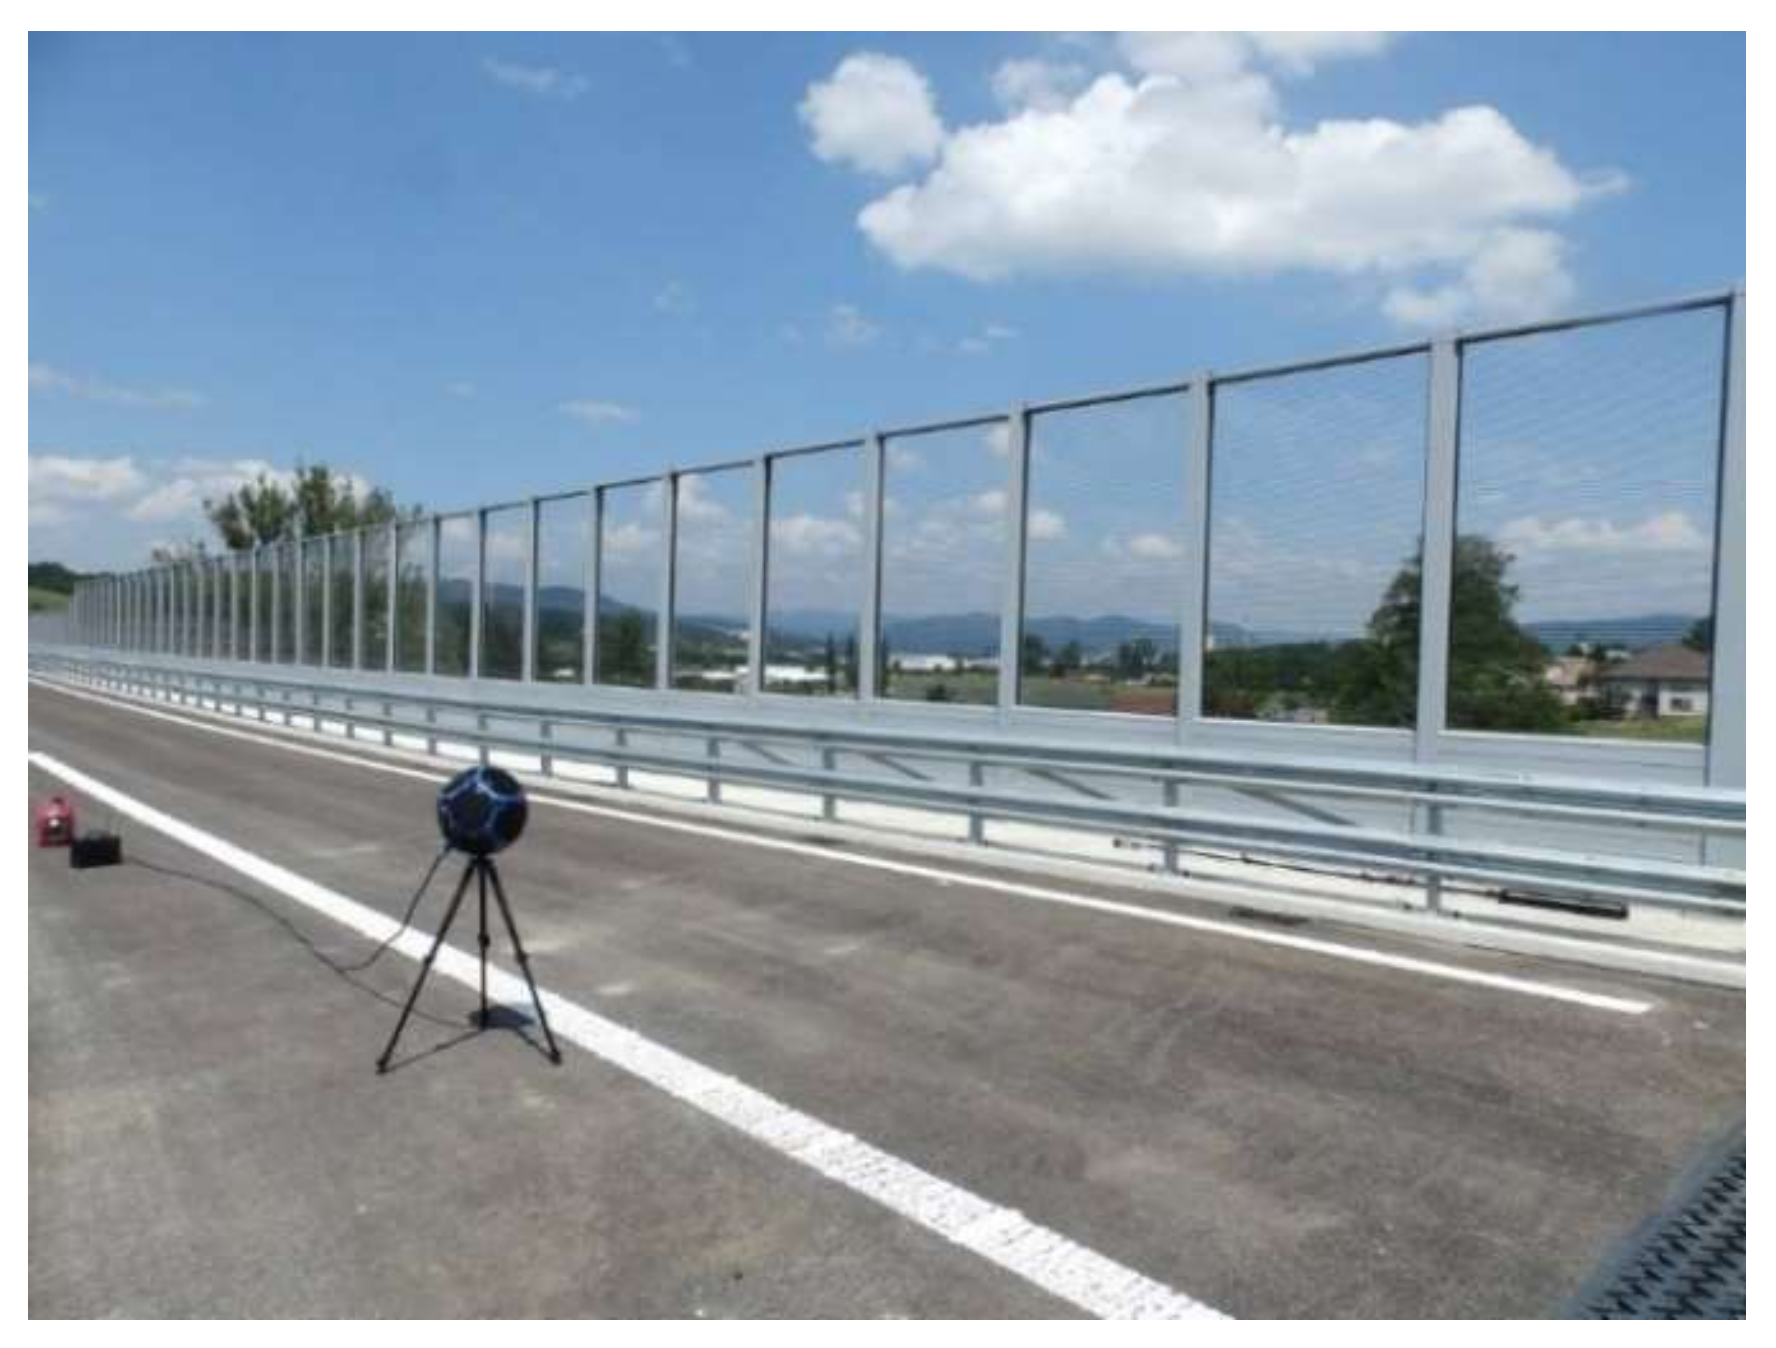
Figure 12 shows the location of the noise source (a) and the set of nine microphones (b).
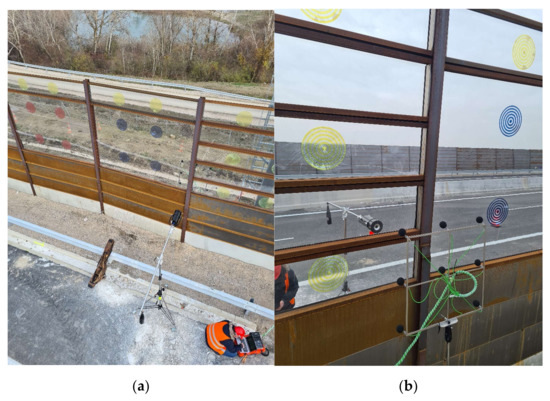
Figure 12.
(a) Location of the sound source; (b) location of the microphone set in situ.
- DM = 0.25 m—horizontal distance (microphone grid, microphone no. 5—reference plane of the source) at a height hS;
- dS = 1.0 m—horizontal distance (loudspeaker—reference plane of the source) at a height hS;
- hB = 4.8 m—height of the barrier;
- hS = 2.4 m—reference height of the loudspeaker;
- tB = 0.1 m—thickness of the barrier at height hS.
The measurement was done according to the norm EN 1793-6 [29]. The duration of Adrienne temporal window was 7.9 ms and the low-frequency limit was 166 Hz. The noise source was a regulated artificial sound source.
The used measurement instrumentation included:
- Analyser Apollo_Lt_2B—Analyzer for Sound and Vibration;
- Microphone M400_B;
- Amplifier ATLAS PA601 Power Amplifier—Single Channel, 60-Watt Power Amplifier with Global Power Supply; and
- AcoustiAdrienne Base Module.
The wiring and measurement diagram according to the Adrienne system is shown in Figure 13.
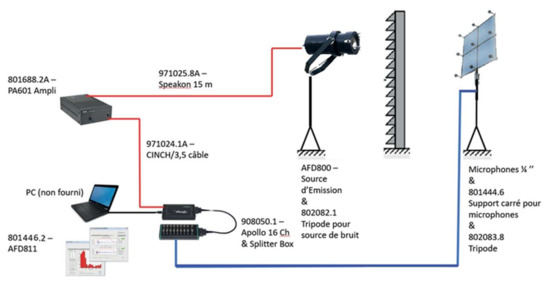
Figure 13.
Measurement scheme of a barrier by the Adrienne system [30].
Measurement results:
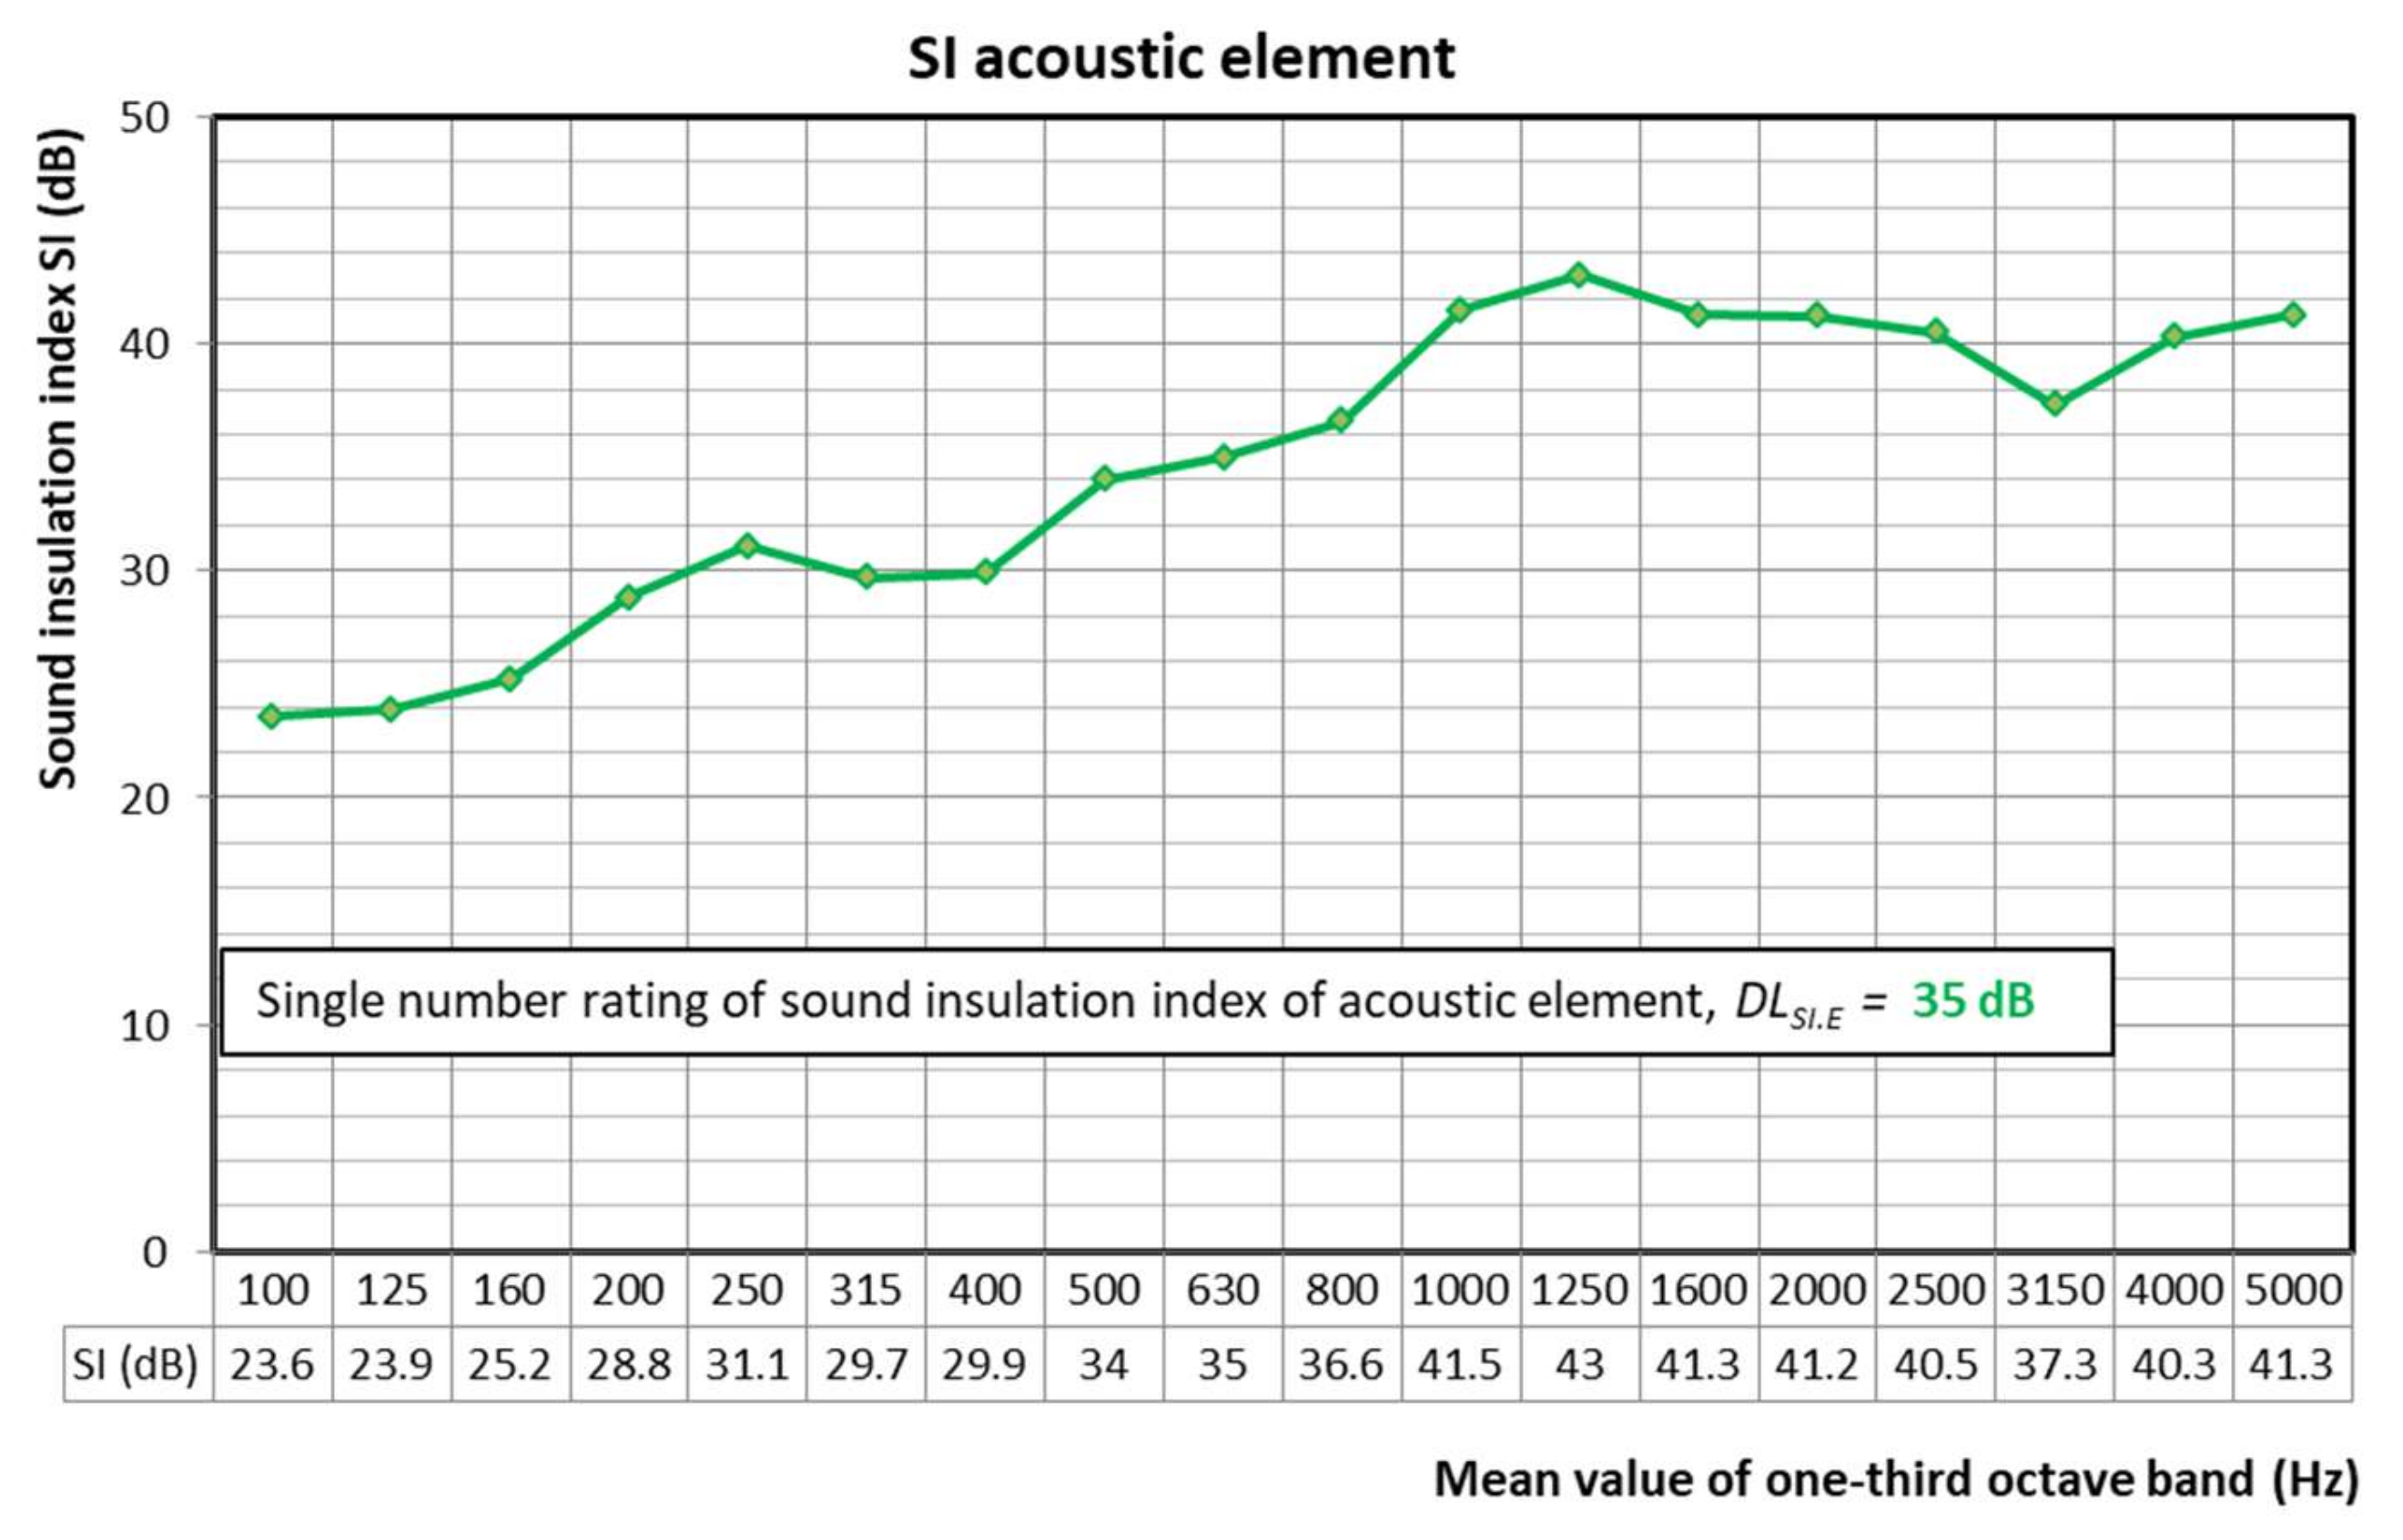
The single-number rating of sound insulation in the range of 200 to 5000 Hz of a polycarbonate panel (Figure 14) was calculated using:
DLSI,E = 35 dB

Figure 14.
Diagram from the measurement of the airborne sound insulation index of an acoustic element: a polycarbonate panel.
The single-number rating of sound insulation in the range of 200 to 5000 Hz of a pole (Figure 15) was calculated using:
DLSI,P = 26 dB
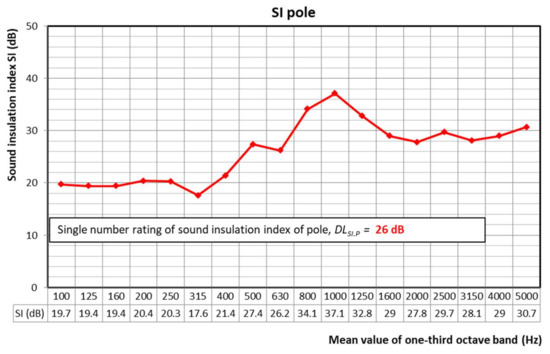
Figure 15.
Diagram from the measurement of the airborne sound insulation index of a pole.
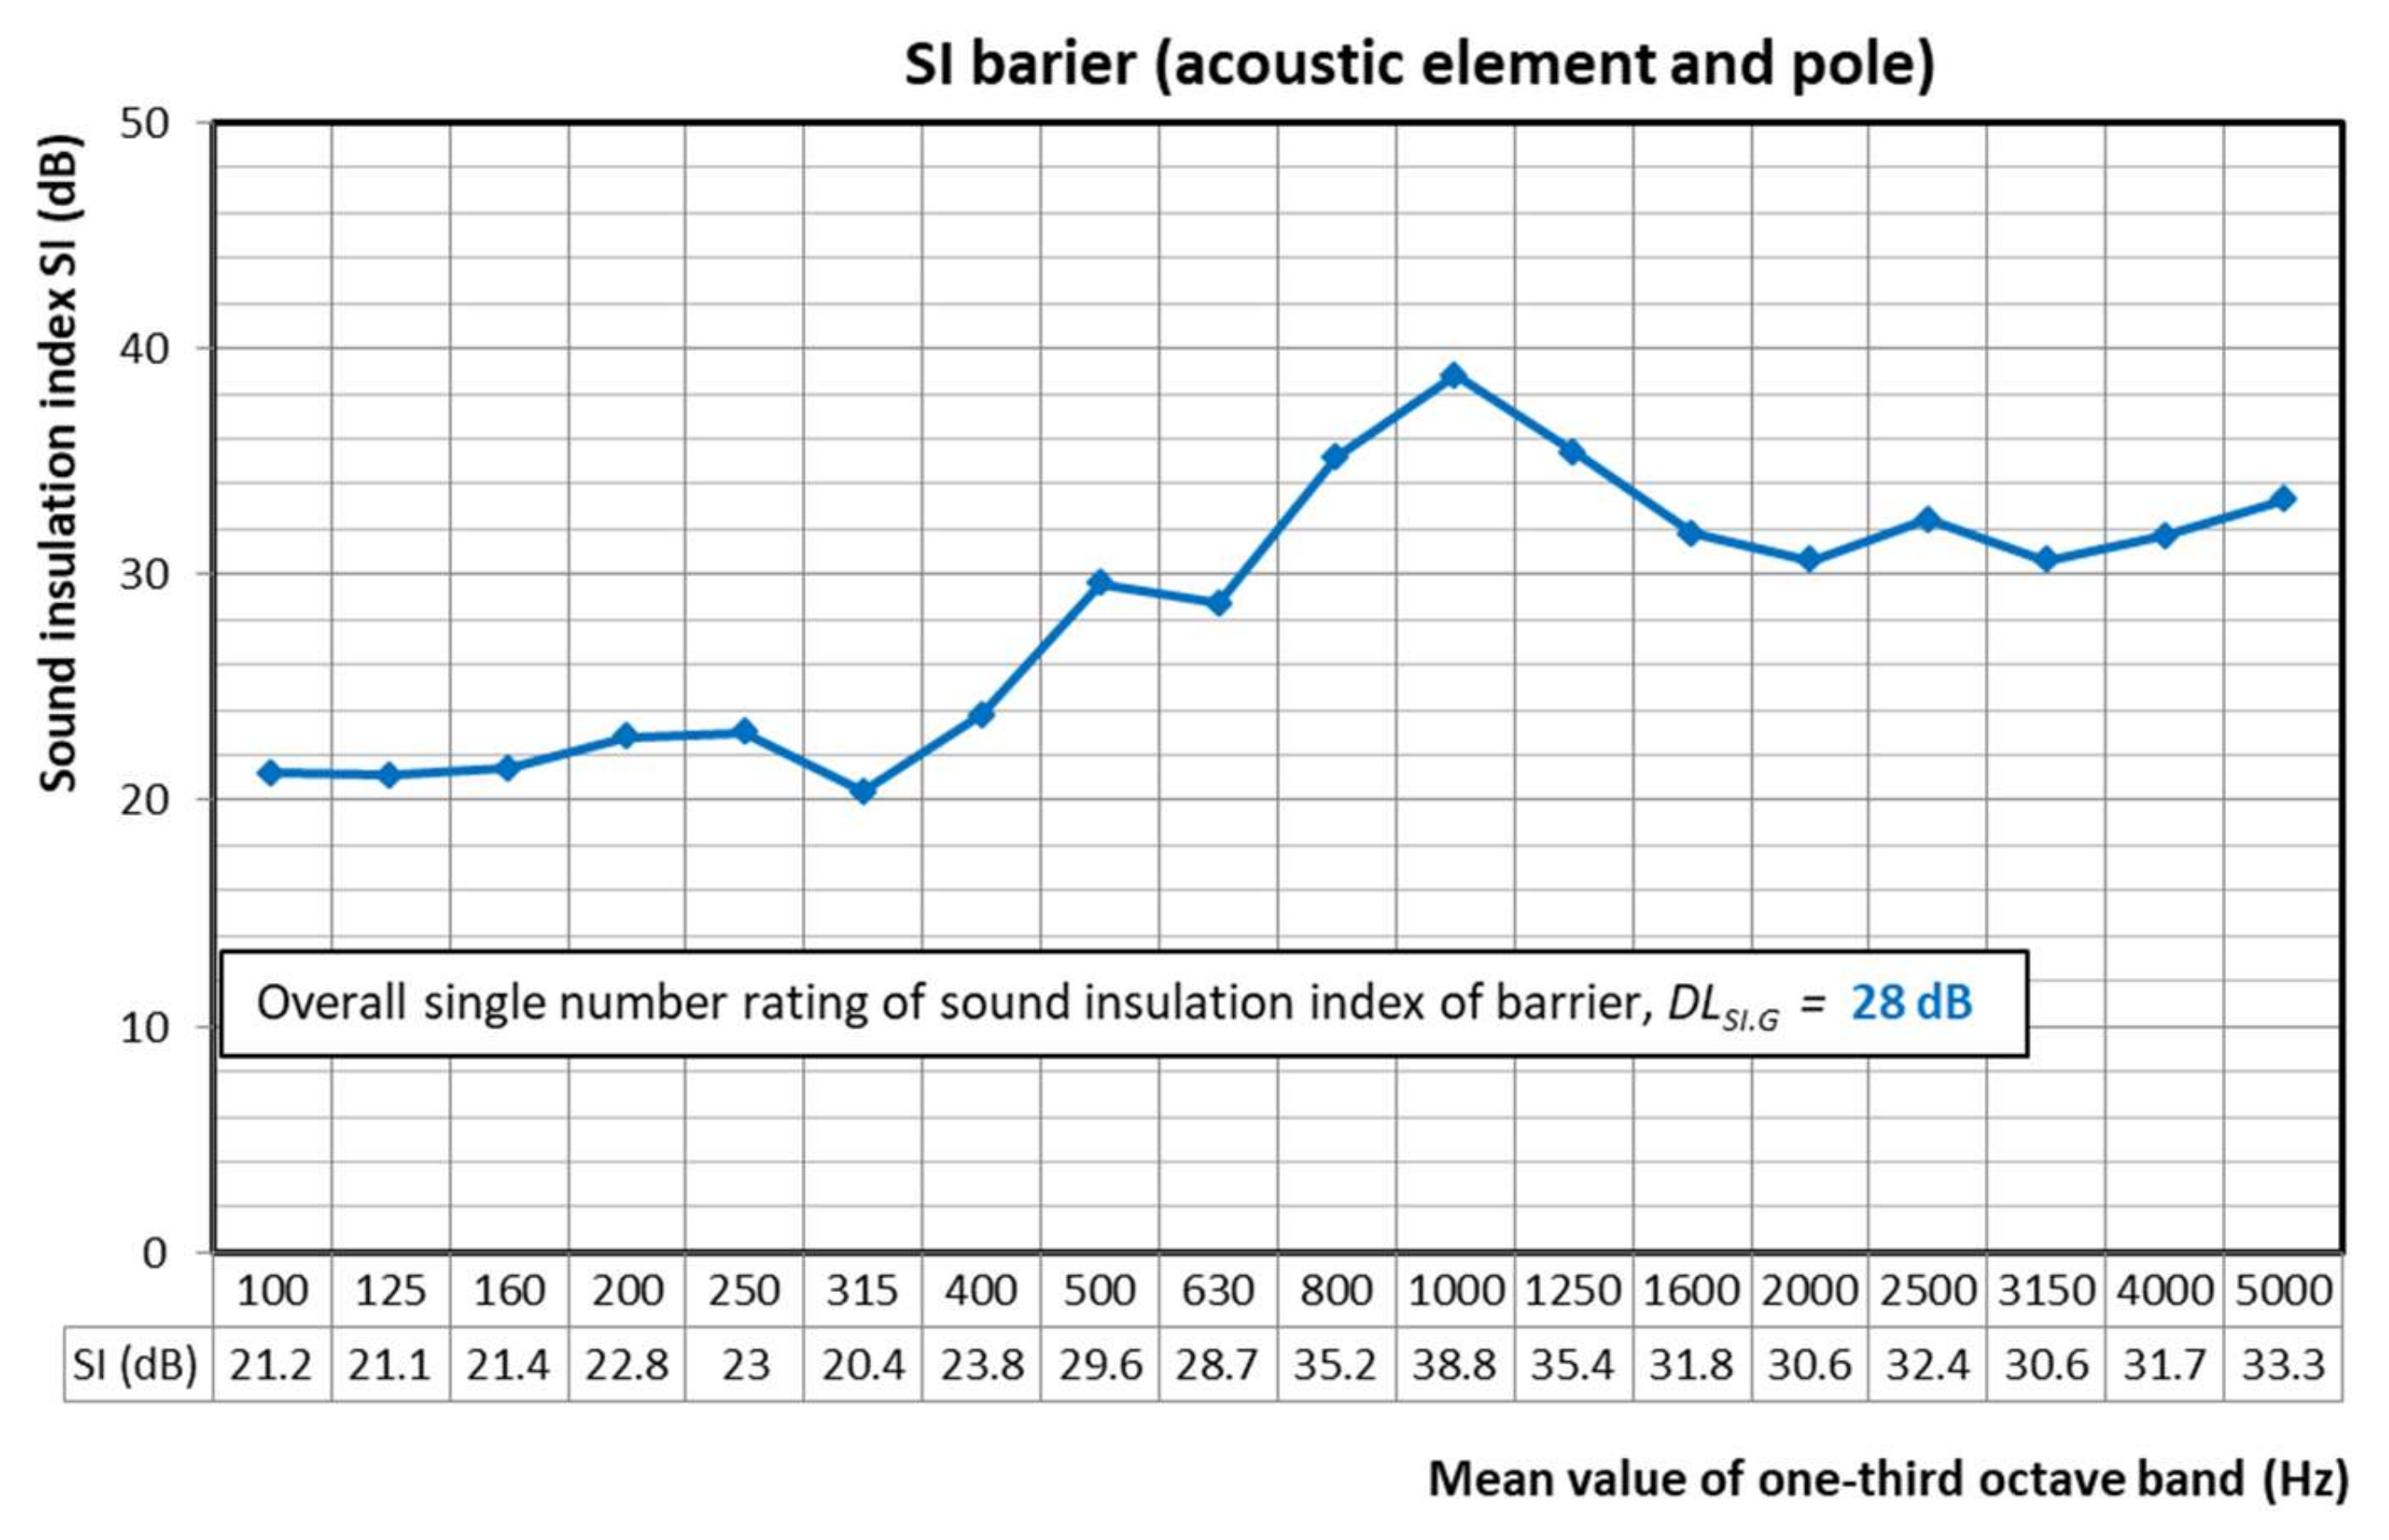
The overall single-number rating of the sound insulation of the barrierwas calculated according to Equation (9) (Figure 16):
DLSI,G = 28 dB
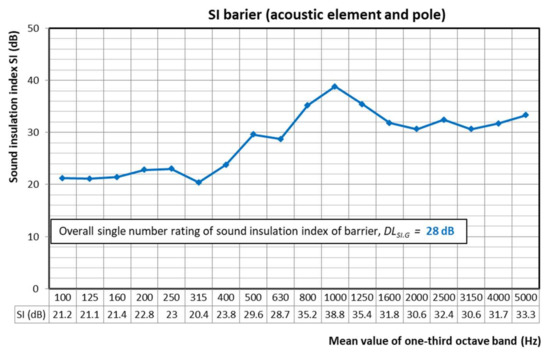
Figure 16.
Diagram from the measurement of the airborne sound insulation index of the barrier.
Measurement uncertainty:
Reproducibility standard deviation for acoustic elements: 1.31 dB.
Reproducibility standard deviation for poles: 0.92 dB.
The airborne sound insulation index of the barrier determined by the Adrienne method could not be compared with the theoretical insertion loss of the noise barrier calculated according to the CNOSSOS method, because the sound insulation index and insertion loss are not the same quantities.
4. Discussion
In this study, we used several methods to evaluate the effectiveness of noise barriers used in real conditions in Slovakia intended for noise reduction in the vicinity of newly constructed motorways.
The methods specified by standard ISO 10847 [28] are proposed for determining the insertion loss of noise barriers for acoustic shielding of various types of noise sources. The standard specifies detailed procedures for measuring the insertion loss of barriers at their locations (in situ), including definitions of the microphone positions, source conditions, and the acoustic environment of the measurement sites. It allows measurement of the insertion loss of a barrier at a given location and for given meteorological conditions. However, it does not allow comparison of the values of the insertion loss of the equivalent barrier measured at different locations. It can be used to compare the values of the insertion loss of different types of noise barriers at the same location and under given meteorological conditions using a direct measurement method.
This standard specifies a method for determining the insertion loss from the level difference before the installation of a barrier (without barrier) and after its installation (with barrier). If this is not possible because the barrier has already been installed, then the indirect method should be used to estimate the sound pressure levels prior to the installation of the barrier by measurement at another location that is considered as equivalent. For an equivalent location, a close match of the characteristics of the source, the positions of the microphone, the characteristics of the Earth’s surface, and the terrain profiles, in the surrounding man-made structures and in the meteorological conditions is required. The standard prescribes principles to ensure sufficient equivalent conditions that allow some reliability and repeatability of determining the value of the insertion loss of the barrier between the situation before and after the installation of the barrier.
This standard does not cover the determination of acoustic quantities of a barrier in an indoor environment, such as the airborne sound insulation index and the sound absorption coefficient.
We used this method to measure the insertion loss of the selected barrier at the end of the bridge structure on the newly built section of the D1 motorway. A regulated artificial sound source was used as the noise source, thus fulfilling the condition of close matching of the characteristics of the noise source.
The resulting value of the insertion loss of the barrier obtained from the measured values was 19.1 dB(A). At the same time, simulation of sound propagation from a source was performed using our own calculation program based on the methodology according to Commission Directive (EU) 2015/996 [31,32]. From the simulation, a value of 19.6 dB(A) was obtained, which testifies to the quality construction and fabrication of the assessed barrier.
Further measurements were performed according to standard EN 1793-6 (Adrienne method) [29], which is used to qualify the products being installed along roads as well as to verify the compliance of the installed noise reduction of barriers with their design specifications. This method can be used to qualify a barrier for noise reduction for other applications, such as barriers along railway lines or industrial zones. Regular application of the method can be used to verify the long-term properties of a barrier. The method uses the same principles and devices to measure sound reflection (given by standard EN 1793-5 [27]) and airborne sound insulation (given by this standard). This test method should not be used to determine the intrinsic airborne sound insulation characteristics of barriers that are installed in reverberant conditions, e.g., inside tunnels or deep cuts or in galleries.
This standard introduces a specific quantity called the sound insulation index to define the airborne sound insulation of a barrier.
As a result of measuring the acoustic elements and poles of the barrier, we obtained both values of the sound insulation index in the one-third octave band in the range of 100–5000 Hz for acoustic elements, the pole, and the whole barrier, as well as the single-number rating of the sound insulation of the barrier as well as its individual elements. Based on the result (DLS1,G = 28 dB), we were able to assign the insulation index category D3 according to the EN 1793-2 standard, which means that the barrier is high quality and has satisfactory airborne sound insulation.
It is worth noting that the value of the airborne sound insulation of acoustic elements (panels) has a value of DLSl,E = 35 dB(A), but the poles only have a value of DLSl,P = 26 dB(A), which gives the barrier a total value of 28 dB(A).
A comparison of ISO 10847 and EN 1793-6 shows that the latter standard can directly evaluate the sound insulation index of the whole barrier structure, which is its advantage.
The effectiveness of barriers can also be assessed based on the subjective perception of noise by the population using questionnaire surveys. Recently, a survey of railway noise annoyance in the Kysuce region (Northwest Slovakia) [33] was carried out. The results showed that people perceived noise disturbance, especially at night. Similar surveys are expected to be done in the region for road transport as well. The results of the subjective perception of the noise situation before and after the installation of noise barriers will show the effectiveness of these noise barriers. This type of research can be found in [34], where the subjective perception of noise was compared with the measured values before and after the noise control intervention. Such an assessment of the noise barriers’ effectiveness can be considered comprehensive and is planned to be done in Slovakia.
5. Conclusions
The main outputs of the research are:
- Noise barriers’ effectiveness in Slovakia can be evaluated by three methods: the direct and indirect method in accordance with the standard ISO 10847, by simulation modelling according to the CNOSSOS method and in accordance with the standard EN 1793-6 (Adrienne method).
- By comparing the measurement methods of noise barriers’ acoustic characteristics, it can be stated that the method of ISO 10847 can be used in different measurement locations and only the reference point above the barrier is defined. The Adrienne method precisely defines the distances of the noise source and nine microphones from the noise barrier and its direct output is a value of the airborne sound insulation index obtained in situ for the whole structure. The simulation according to the CNOSSOS method is used for modeling the sound field. It enables comparison of the simulated values of the insertion loss of a barrier with the values measured according to the ISO 10847 standard and to assess whether the barrier satisfies the expectations.
- The measurement methods were used on real noise barriers on selected highway sections, thus real values of the insertion loss and airborne sound insulation index were obtained and gave a picture of their sound performance. The researched noise barriers were proven to be good quality.
- Construction materials that have given acoustic properties from the manufacturer (declared airborne sound insulation category D0 to D4) may lose these values over time due to material degradation. In addition, during the construction of noise barriers, defects can occur that contribute to reduced effectiveness. Measurement according to the EN 1793-6 Adrienne method is used to determine the quality of a noise barrier and its actual values of the airborne sound insulation index in situ. So, the Adrienne method can evaluate (degradation) the acoustic properties of a barrier in situ during a longer time period.
Author Contributions
Conceptualization, A.P. and J.Š.; methodology, A.P. and J.G.; software, J.Š.; validation, A.P., J.G. and J.Š.; formal analysis, A.P.; investigation, A.P.; resources, J.Š.; data curation, J.Š.; writing—original draft preparation, A.P.; writing—review and editing, A.P and J.G.; visualization, A.P., J.Š. and J.G.; supervision, J.Š.; project administration, A.P.; funding acquisition, A.P. All authors have read and agreed to the published version of the manuscript.
Funding
This research was funded by the Slovak Grant National Agency VEGA, project No. 1/0006/20, Constructions of transport structures in terms of dynamic analysis of real operational states.
Institutional Review Board Statement
Not applicable.
Informed Consent Statement
Not applicable.
Data Availability Statement
Publicly available datasets were analyzed in this study. The data presented in this study are available on request from the corresponding author.
Acknowledgments
The authors would like to express their appreciations to the Klub ZPS vo vibroakustike, s.r.o. for providing measurements data and their support and to the Slovak Grant National Agency VEGA, project No. 1/0006/20.
Conflicts of Interest
The authors declare no conflict of interest.
References
- Clausen, U.; Doll, C.; Franklin, F.J.; Franklin, G.V.; Heinrichmeyer, H.; Kochsiek, J.; Sieber, N. Reducing Railway Noise Pollution; European Parliament: Brussels, Belgium, 2012; pp. 10–55. [Google Scholar]
- European Environment Agency. Noise in Europe 2014. EEA report 10/2014; Publications Office of the European Union: Luxembourg, 2014. [Google Scholar]
- Environmental Noise Guidelines for the European Region. WHO Regional Office for Europe: Copenhagen, Denmark, 2018. Available online: https://www.euro.who.int/en/health-topics/environment-and-health/noise/environmental-noise-guidelines-for-the-european-region (accessed on 9 June 2021).
- Hurtley, C.H. (Ed.) Night Noise Guidelines for Europe. Geneva: WHO 2009. 184p. Available online: https://www.euro.who.int/__data/assets/pdf_file/0017/43316/E92845.pdf (accessed on 9 June 2021).
- Ižvolt, L.; Dobeš, P. Analysis of Measuring the Deformation Resistance of the Subgrade Surface of a Modernised Line Považská Teplá—Žilina. Civ. Environ. Eng. 2020, 16, 210–218. [Google Scholar] [CrossRef]
- NDSAS. Available online: https://www.ndsas.sk/stavby/dialnicna-siet (accessed on 2 June 2021).
- Lumnitzer, E.; Románová, M. Modeling of traffic noise and noise from stationary sources in the field of urban development (Modelovanie dopravného hluku a hluku z stacionárnych zdrojov v oblasti mestskej zástavby). Acta Mech. Slovaca 2005, 9, 225–228. (In Slovak) [Google Scholar]
- Ižvolt, L.; Hodás, S. Projektovanie, Stavba, Rekonštrukcia a Modernizácia Železničných Tratí a Staníc (Design, Construction, Reconstruction and Modernization of Railway Lines and Stations); EDIS: Žilina, Slovakia, 2020; p. 699. (In Slovak) [Google Scholar]
- Murphy, E.; King, E.A. Environmental Noise Pollution. Noise Mapping, Public Health, and Policy, 1st ed.; Elsevier: Amsterdam, The Netherlands, 2014; pp. 1–282. [Google Scholar]
- Ministry of Health of the Slovak Republic. Decree of the Ministry of Health No 549/2007 Coll. on Permissible Levels of Noise, Infrasound and Vibration and on the Objectification Requirements for Noise, Infrasound and Vibration in the Environment; Ministry of Health: Bratislava, Slovakia, 2007. (In Slovak)
- Margorínová, M.; Trojanová, M.; Decký, M.; Remišová, E. Noise costs from road transport. Civ. Environ. Eng. 2018, 14, 12–20. [Google Scholar] [CrossRef] [Green Version]
- Matonoková, L.; Krokker, A. Zásady Navrhovania Protihlukových Stien (Principles of Designing Noise Walls) (In Slovak). Available online: https://www.asb.sk/stavebnictvo/zaklady-a-hruba-stavba/priecky/zasady-navrhovania-protihlukovych-stien (accessed on 9 June 2021).
- Neubergová, K. Protihlukové Clony—Jejich Ztvárnění a Estetické Působení. (Noise Prevention Walls—Their Design and Aesthetic Effect) (in Czech). Available online: http://old.silnice-zeleznice.cz/clanek/protihlukove-clony-jejich-ztvarneni-a-esteticke-pusobeni/ (accessed on 9 June 2021).
- Hübner, P.; Oertli, J. Noise Reduction in European Railway Infrastructure. Status Report 2007; SB Imprimeurs: Paris, France, 2007; p. 40. [Google Scholar]
- Communication from the Commission to the European Parliament, the Council, the European Economic and Social Committee and the Committee of the Regions. Available online: https://eur-lex.europa.eu/legal-content/EN/TXT/DOC/?uri=CELEX:52013DC0913&from=SK (accessed on 7 June 2021).
- Ďurčanská, D. Posudzovanie Vplyvov ciest a Diaľníc na Životné Prostredie. Hluk a Imisie z Cestnej Dopravy (Environmental Impact Assessment of Roads and Motorways. Noise and Immissions from Road Transport); EDIS: Žilina, Slovak, 2002. (In Slovak) [Google Scholar]
- Lazarová, P.; Beck, Z. Methodology ways of reducing traffic noise. In Proceedings of the 13rd Management of Environment International Conference, Bratislava, Slovakia, 18–19 April 2013; pp. 133–139. [Google Scholar]
- Anping Zenyo Wire Mesh Products Co. Available online: http://chinawire-mesh.com/Product/Sound%20Barriers/verticaltypeofnoisebarrier.html (accessed on 7 June 2021).
- Quietstone UK Ltd. Available online: http://chinawire-mesh.com/Product/Sound%20Barriers/verticaltypeofnoisebarrier.html (accessed on 7 June 2021).
- Knauf Insulation OEM. Available online: https://www.oem.knaufinsulation.com/solutions/road-sound-barriers (accessed on 7 June 2021).
- Hatko Sound Barriers & Noise Wall Panels. Available online: https://www.hatkosoundbarrier.com/how-to-design-effective-noise-barriers/ (accessed on 7 June 2021).
- OBEX Systems. Available online: https://obexsystems.com/barriers/noise-barriers/ (accessed on 7 June 2021).
- Salaiová, B.; Mandula, J.; Kovaľaková, M. Vybrané Kapitoly z Cestných a Železničných Stavieb. Hluk z Dopravy (Selected Chapters from Road and Railway Constructions. Traffic Noise); TU: Košice, Slovak, 2001. (In Slovak) [Google Scholar]
- Úrad pre normalizáciu, metrológiu a skúšobníctvo Slovenskej republiky. EN 1793-1. Road Traffic Noise Reducing Devices. Test Method for Determining the Acoustic Performance. Part 1: Intrinsic Characteristics of Sound Absorption; Úrad pre normalizáciu, metrológiu a skúšobníctvo Slovenskej republiky: Bratislava, Slovakia, 2017. [Google Scholar]
- Puškáš, J.; Schwarz, J.; Hofman, R.; Tomašovič, P.; Zajac, J. Znižovanie Hluku v Pozemných Stavbách (Noise Reduction in Buildings); Alfa: Bratislava, Czechoslovakia, 1988. (In Slovak) [Google Scholar]
- Úrad pre normalizáciu, metrológiu a skúšobníctvo Slovenskej republiky. EN 1793-2 Road Traffic Noise Reducing Devices. Test Method for Determining the Acoustic Performance. Part 2: Intrinsic Characteristics of Airborne Sound Insulation; Úrad pre normalizáciu, metrológiu a skúšobníctvo Slovenskej republiky: Bratislava, Slovakia, 2018. [Google Scholar]
- Úrad pre normalizáciu, metrológiu a skúšobníctvo Slovenskej republiky. EN 1793-5: Road Traffic Noise Reducing Devices—Test Method for Determining the Acoustic Performance—Part 5: Intrinsic Characteristics—In Situ Values of Sound Reflection under Direct Sound Field Conditions; Úrad pre normalizáciu, metrológiu a skúšobníctvo Slovenskej republiky: Bratislava, Slovakia, 2016. [Google Scholar]
- The International Organization for Standardization. ISO 10847 Acoustics—In-Situ Determination of Insertion Loss of Outdoor Noise Barriers of All Types; The International Organization for Standardization: Geneva, Switzerland, 1997. [Google Scholar]
- Úrad pre normalizáciu, metrológiu a skúšobníctvo Slovenskej republiky. EN 1793-6: Road Traffic Noise Reducing Devices—Test Method for Determining the Acoustic Performance—Part 6: Intrinsic Characteristics—In Situ Values of Airborne Sound Insulation under Direct Sound Field Conditions; Úrad pre normalizáciu, metrológiu a skúšobníctvo Slovenskej republiky: Bratislava, Slovakia, 2018. [Google Scholar]
- Solution AcoustiAdrienne AED811. Available online: https://www.alliantech.com/img/cms/PDF%20blog/Solution%20AcoustiAdrienne%20Norme%201793-6.pdf (accessed on 14 June 2021).
- Commission Directive (EU) 2015/996 of 19 May 2015 Establishing Common Noise Assessment Methods According to Directive 2002/49/EC of the European Parliament and of the Council. Available online: https://eur-lex.europa.eu/legal-content/EN/TXT/PDF/?uri=CELEX:32015L0996&from=PT (accessed on 14 June 2021).
- Kephalopoulos, S.; Paviotti, M.; Anfosso, L.F. Common Noise Assessment Methods in Europe (CNOSSOS-EU); Publications Office of the European Union: Luxembourg, 2012; 180p. [Google Scholar]
- Pultznerová, A.; Panulinová, E.; Kuchárová, D.; Argalášová, Ľ. Railway noise annoyance on the railway track in Northwest Slovakia. Noise Health 2018, 20/94, 90–100. [Google Scholar]
- Van Renterghem, T.; Aletta, F.; Botteldooren, D. Changes in the Soundscape of the Public Space Close to a Highway by a Noise Control Intervention. Sustainability 2021, 13, 5284. [Google Scholar] [CrossRef]


Publisher’s Note: MDPI stays neutral with regard to jurisdictional claims in published maps and institutional affiliations. |
© 2021 by the authors. Licensee MDPI, Basel, Switzerland. This article is an open access article distributed under the terms and conditions of the Creative Commons Attribution (CC BY) license (https://creativecommons.org/licenses/by/4.0/).