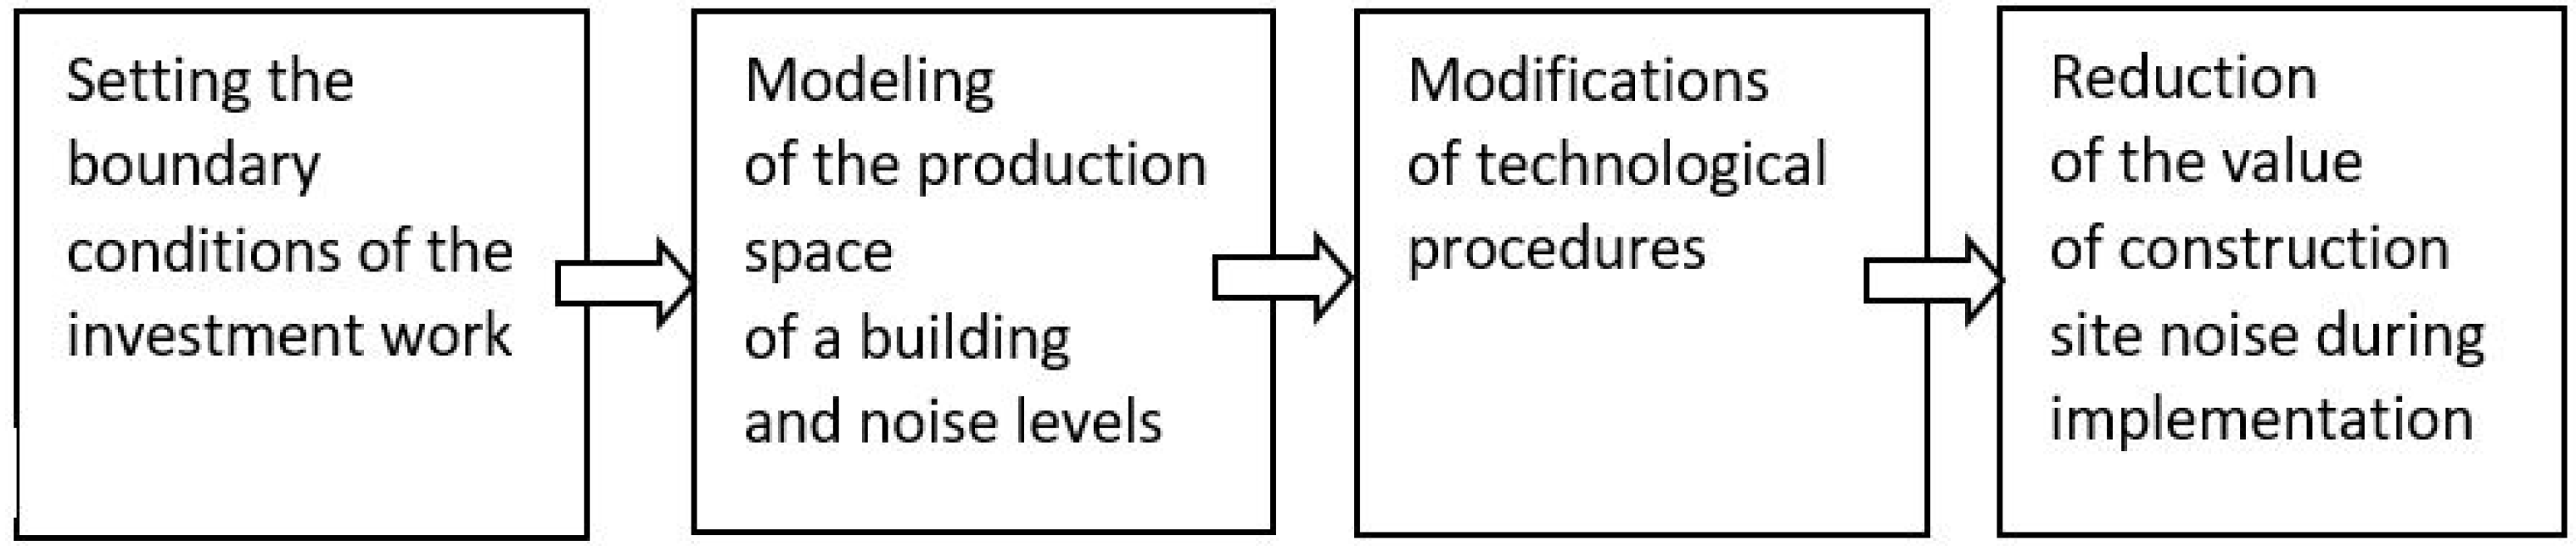
Figure 1.
Reducing the value of construction site noise by modelling the production area of construction site and modifications of technological procedures during construction.
Figure 1.
Reducing the value of construction site noise by modelling the production area of construction site and modifications of technological procedures during construction.
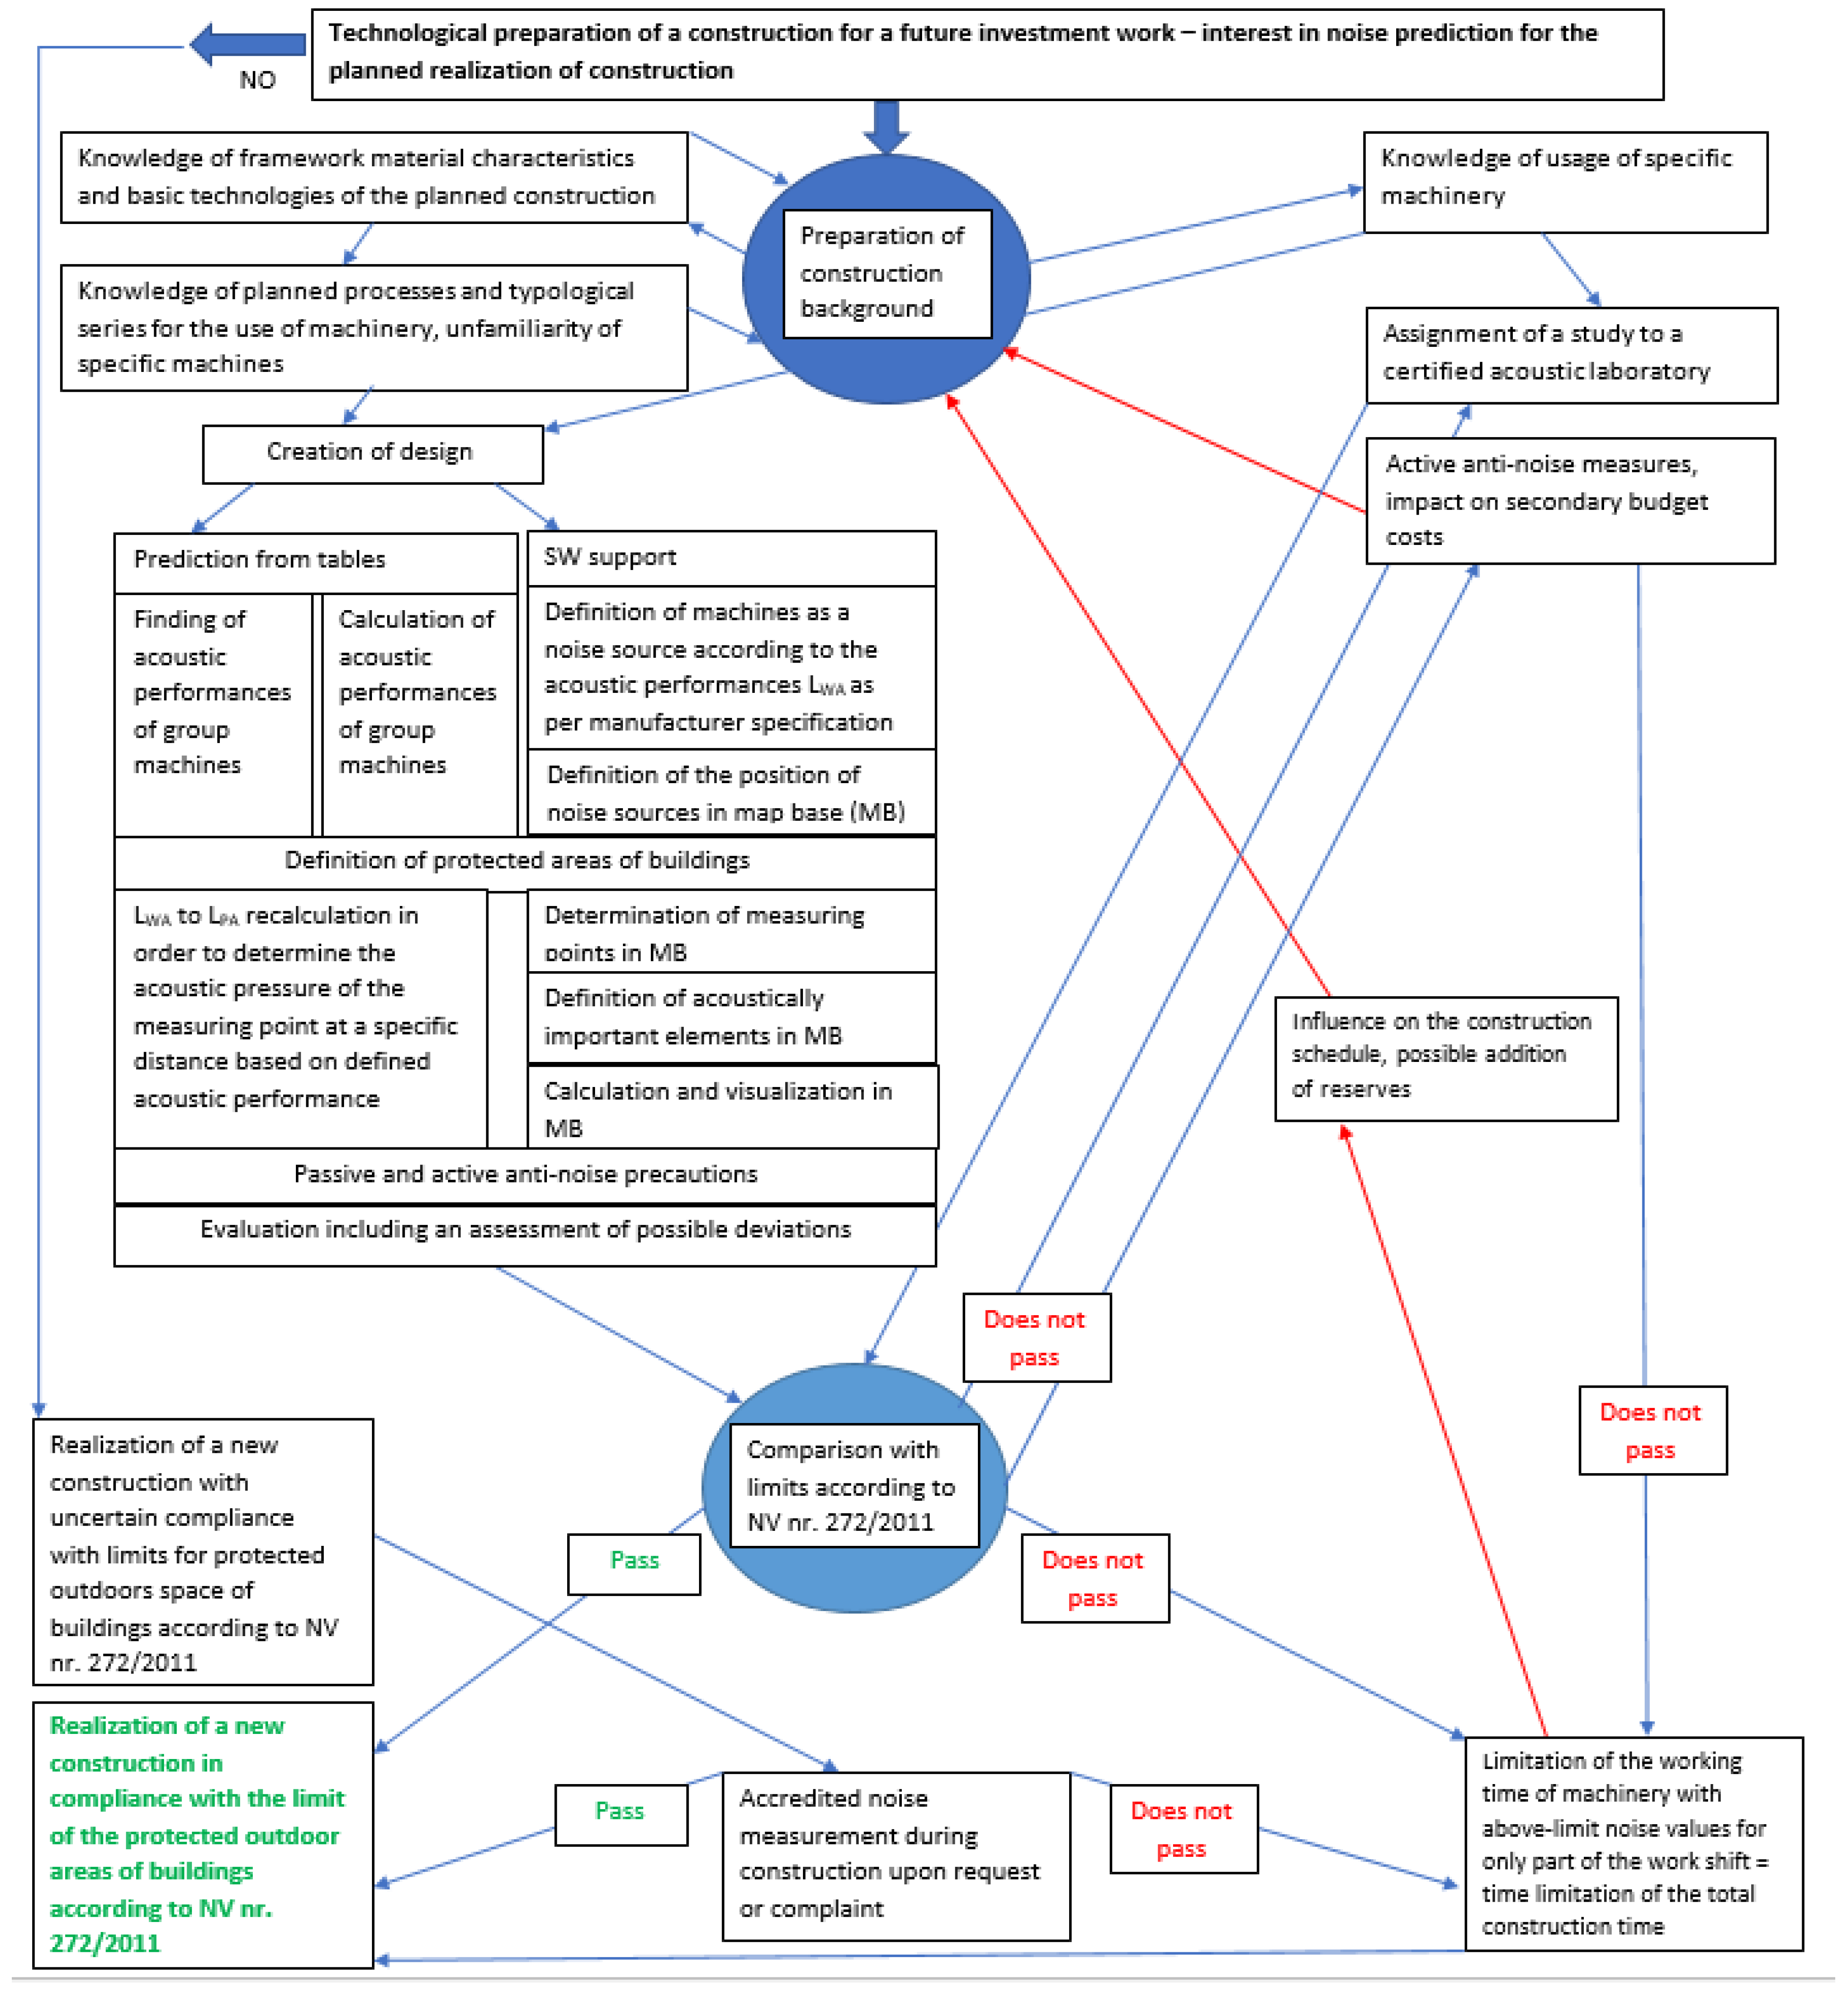
Figure 2.
Methodology for noise prediction from construction activities.
Figure 2.
Methodology for noise prediction from construction activities.
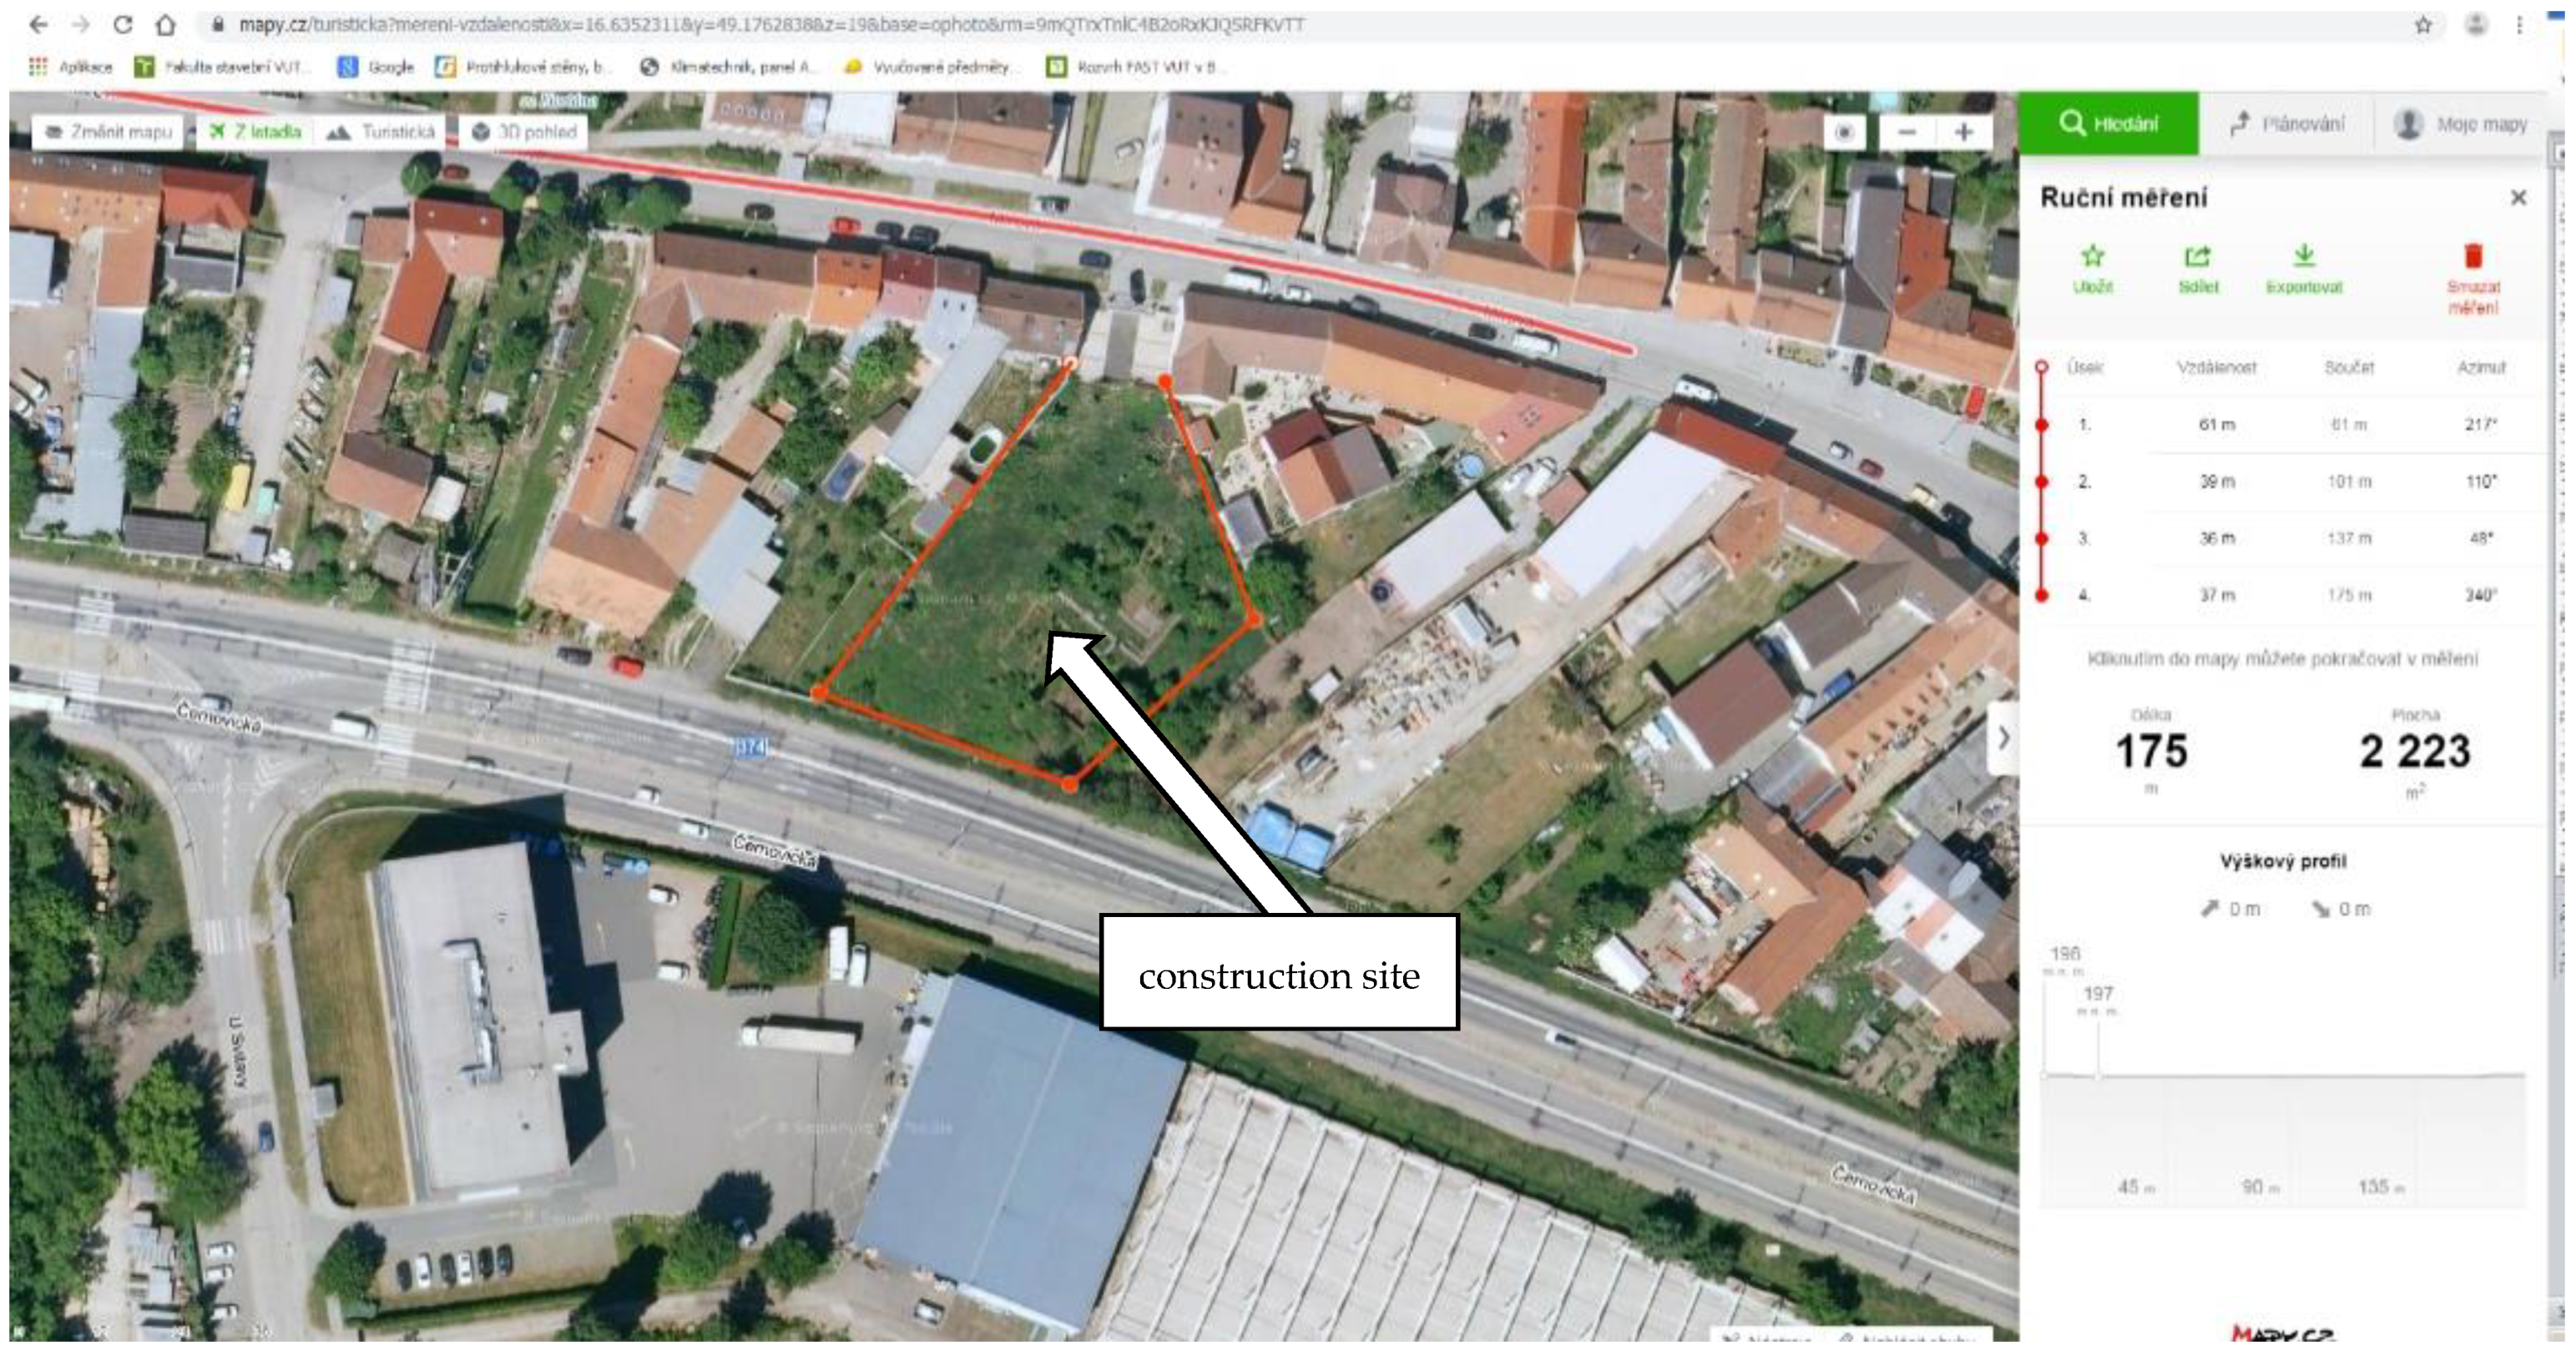
Figure 3.
The area of the construction site and the area for the trajectories of construction machines during the construction of the investigated building project.
Figure 3.
The area of the construction site and the area for the trajectories of construction machines during the construction of the investigated building project.
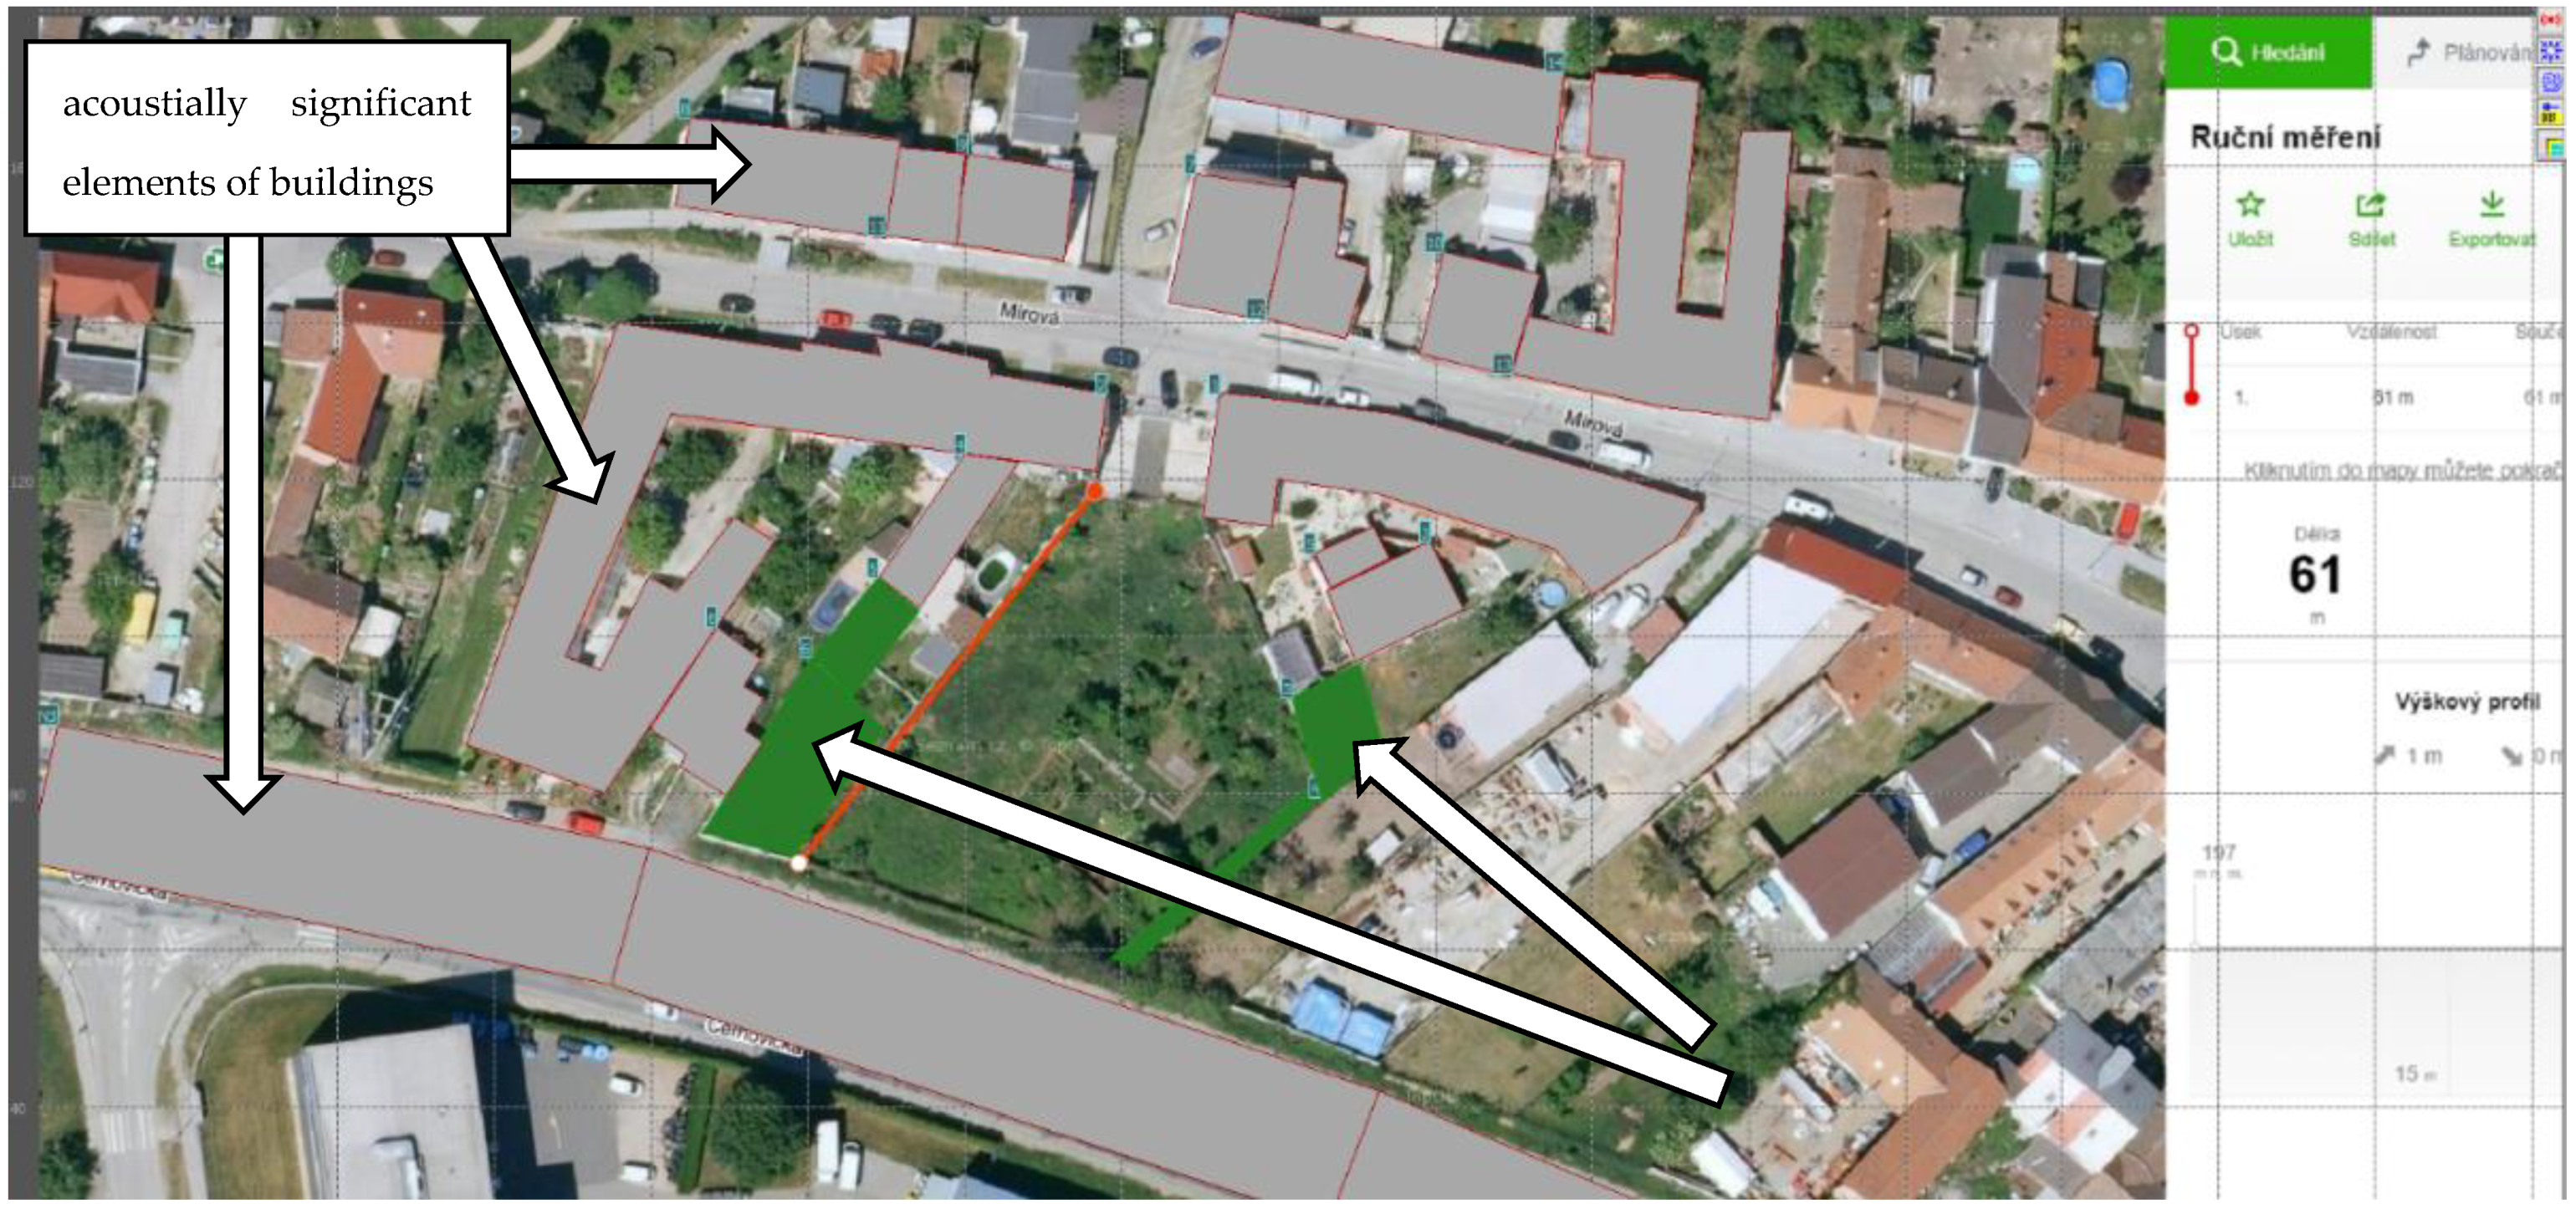
Figure 4.
Acoustically significant elements in the investigated area.
Figure 4.
Acoustically significant elements in the investigated area.
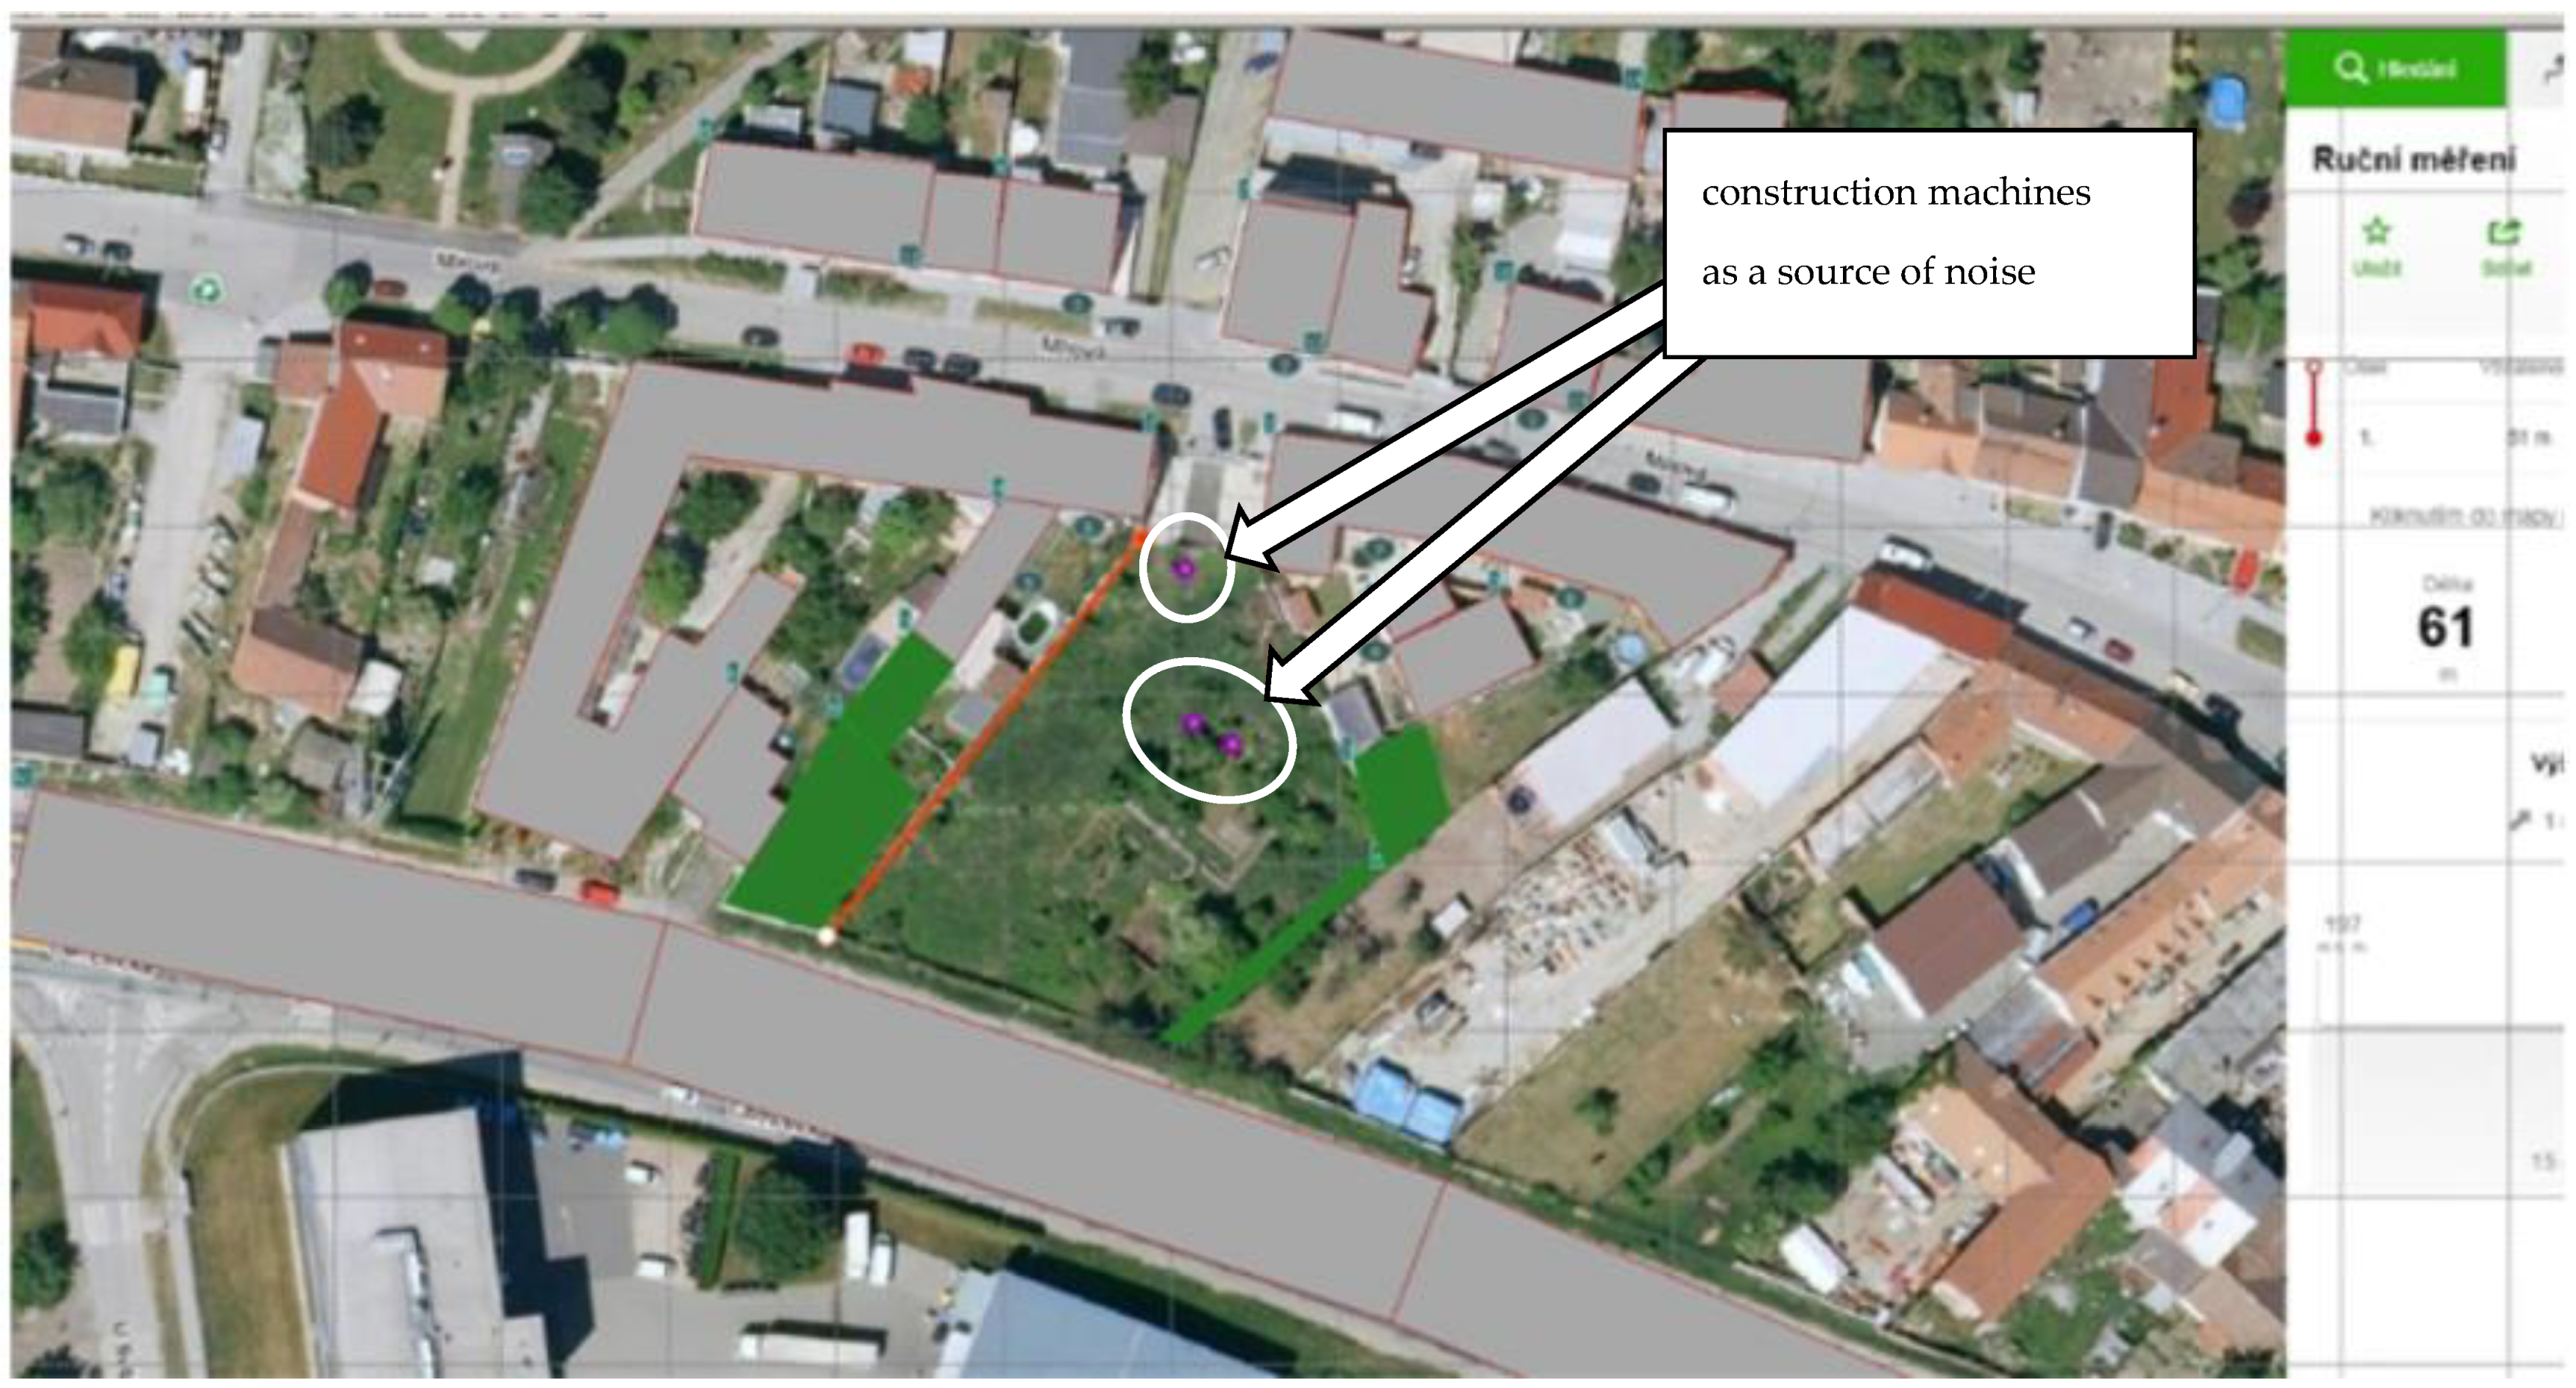
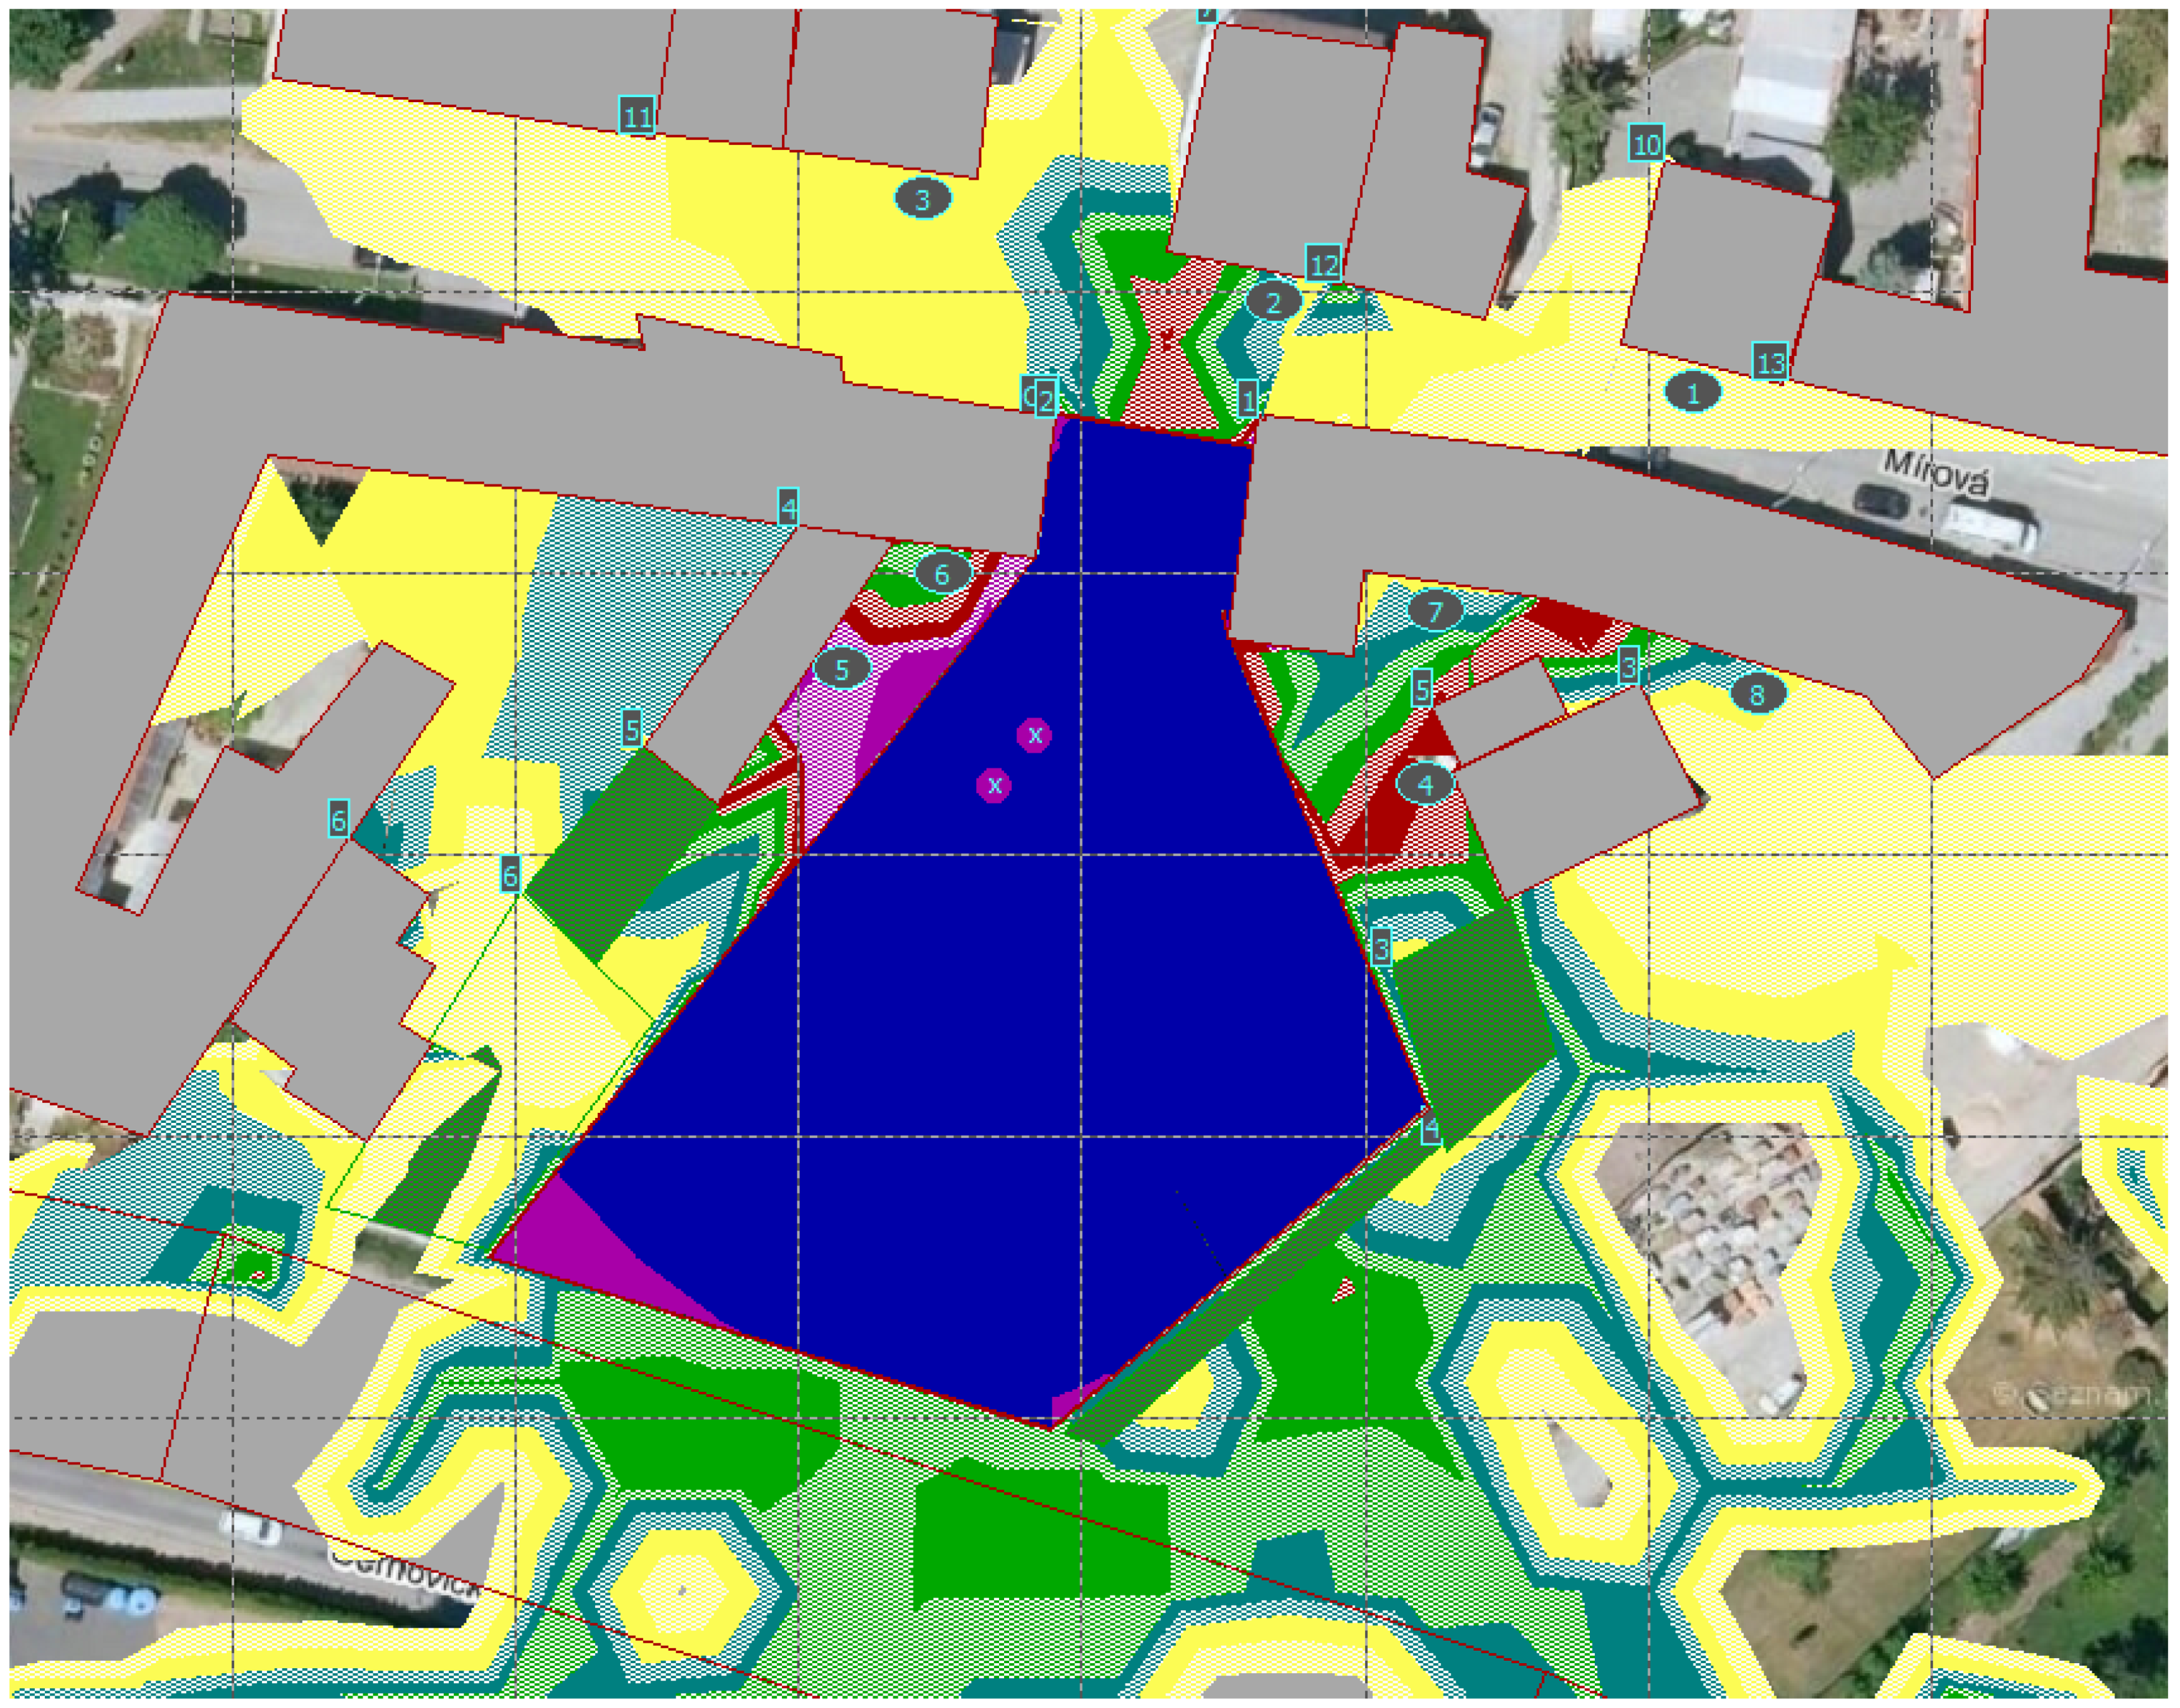
Figure 5.
Acoustically significant elements of the investigated area, with the positions of construction machines as sources of noise, with simultaneous deployment.
Figure 5.
Acoustically significant elements of the investigated area, with the positions of construction machines as sources of noise, with simultaneous deployment.
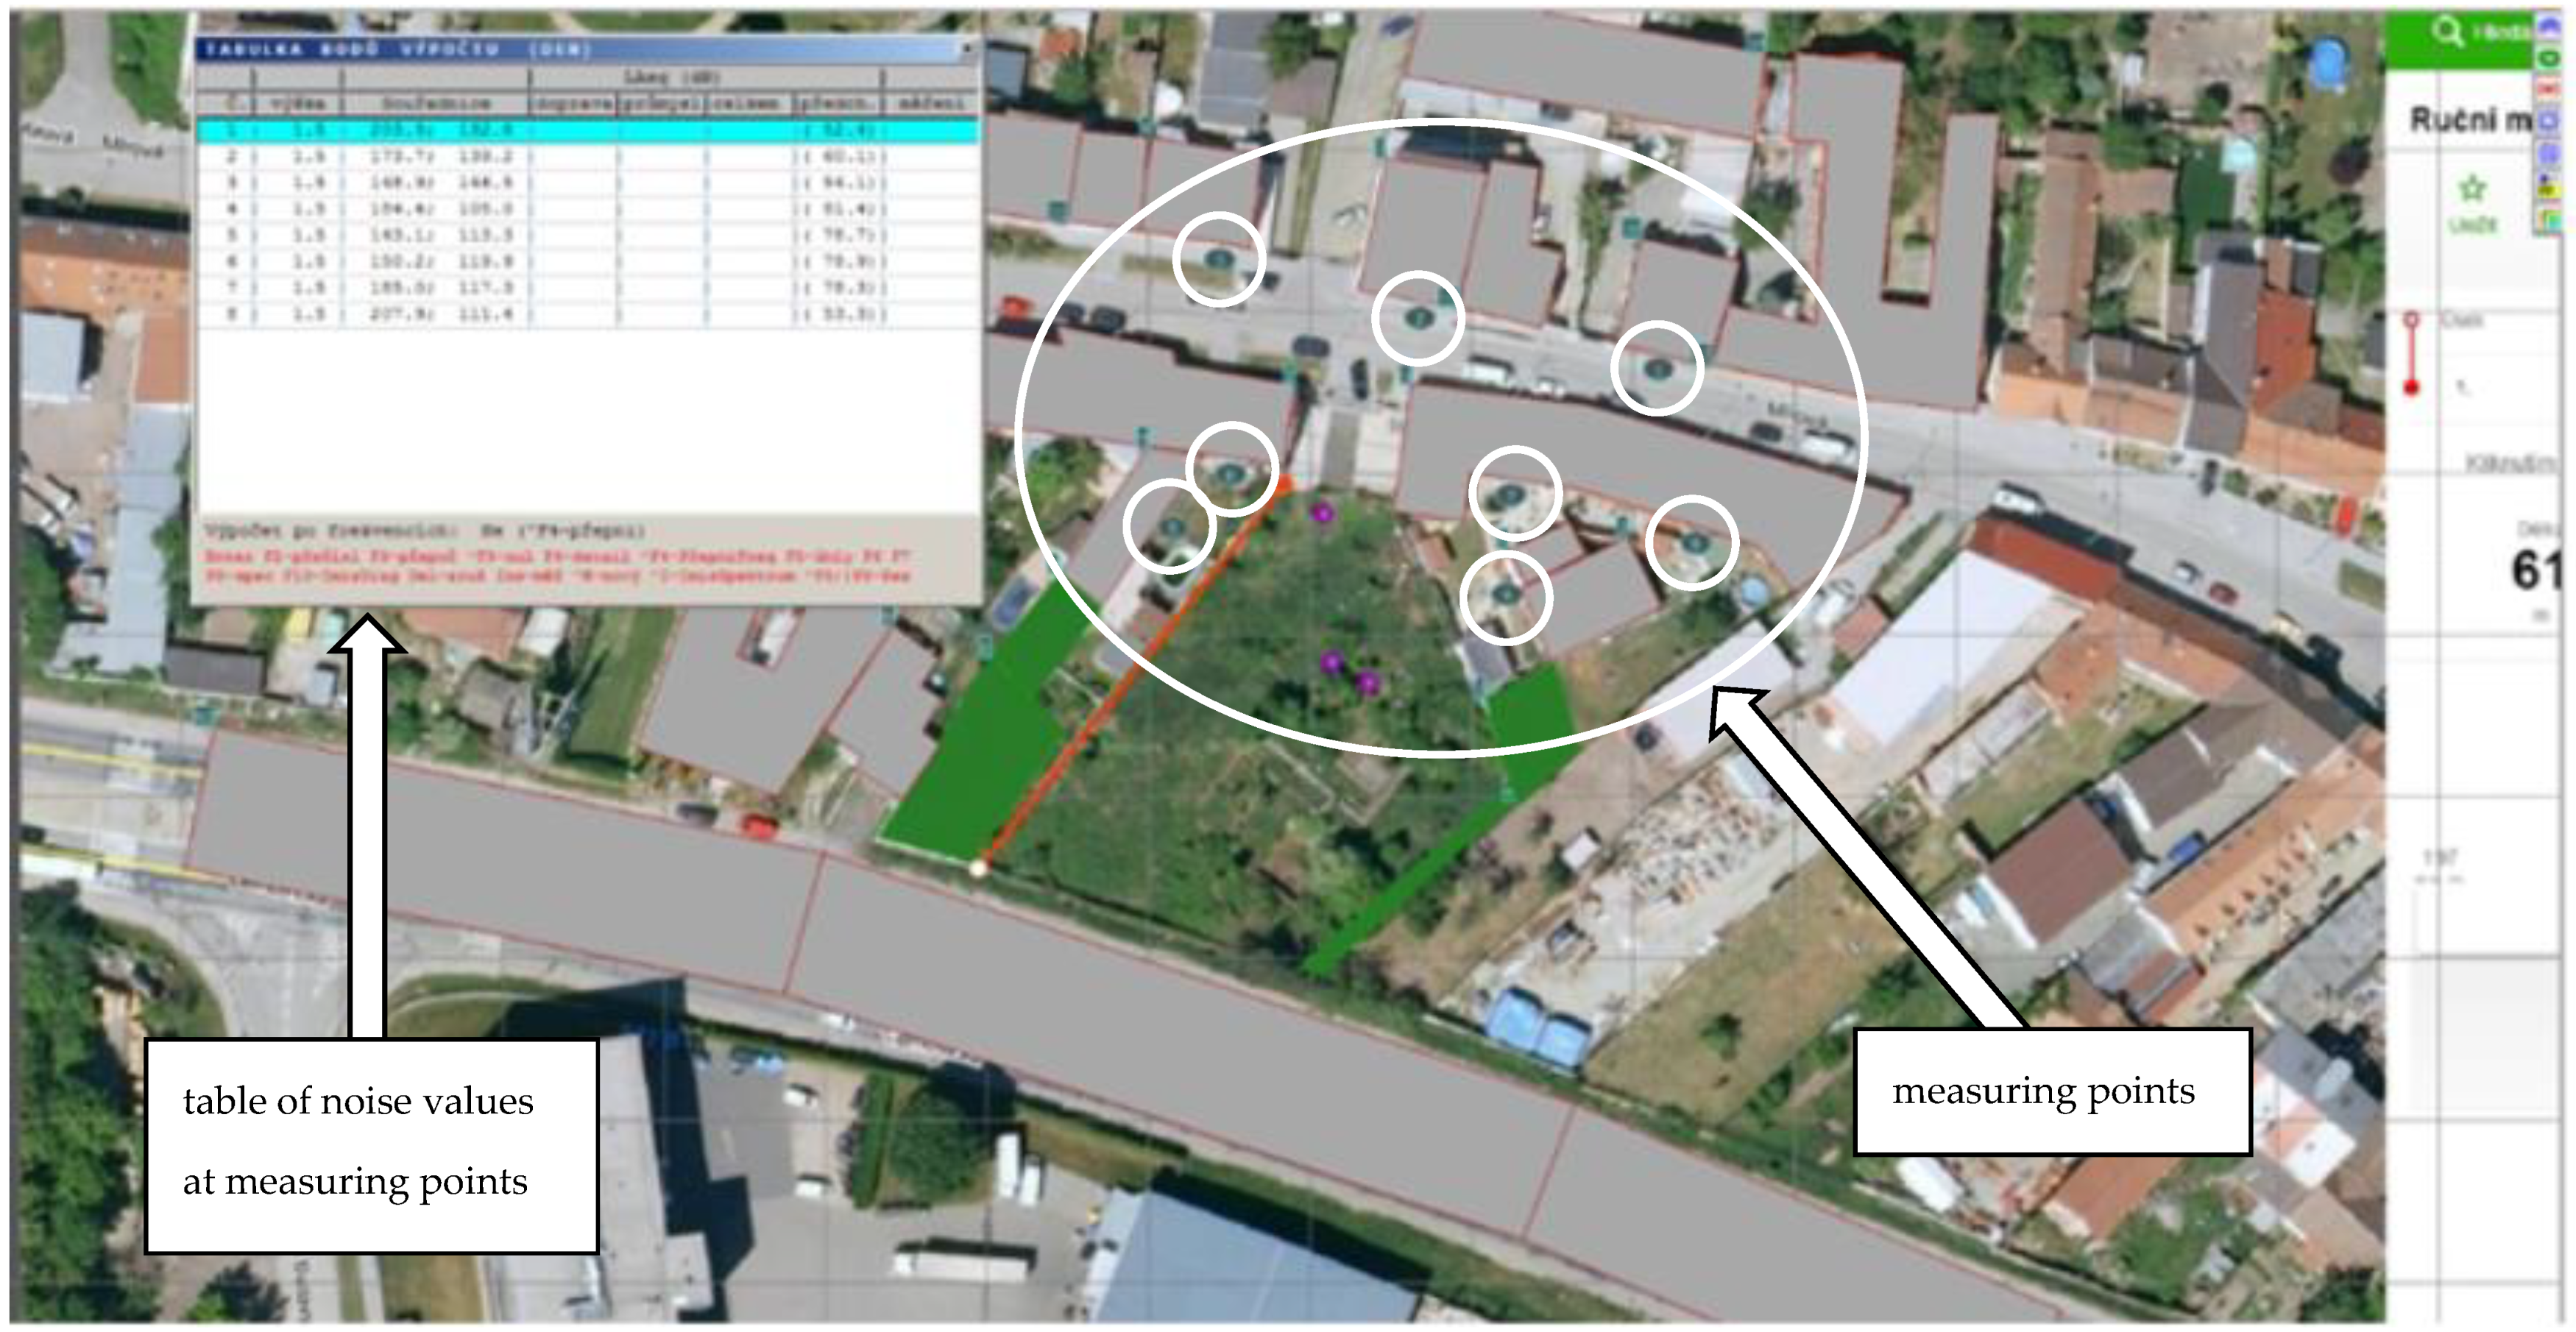
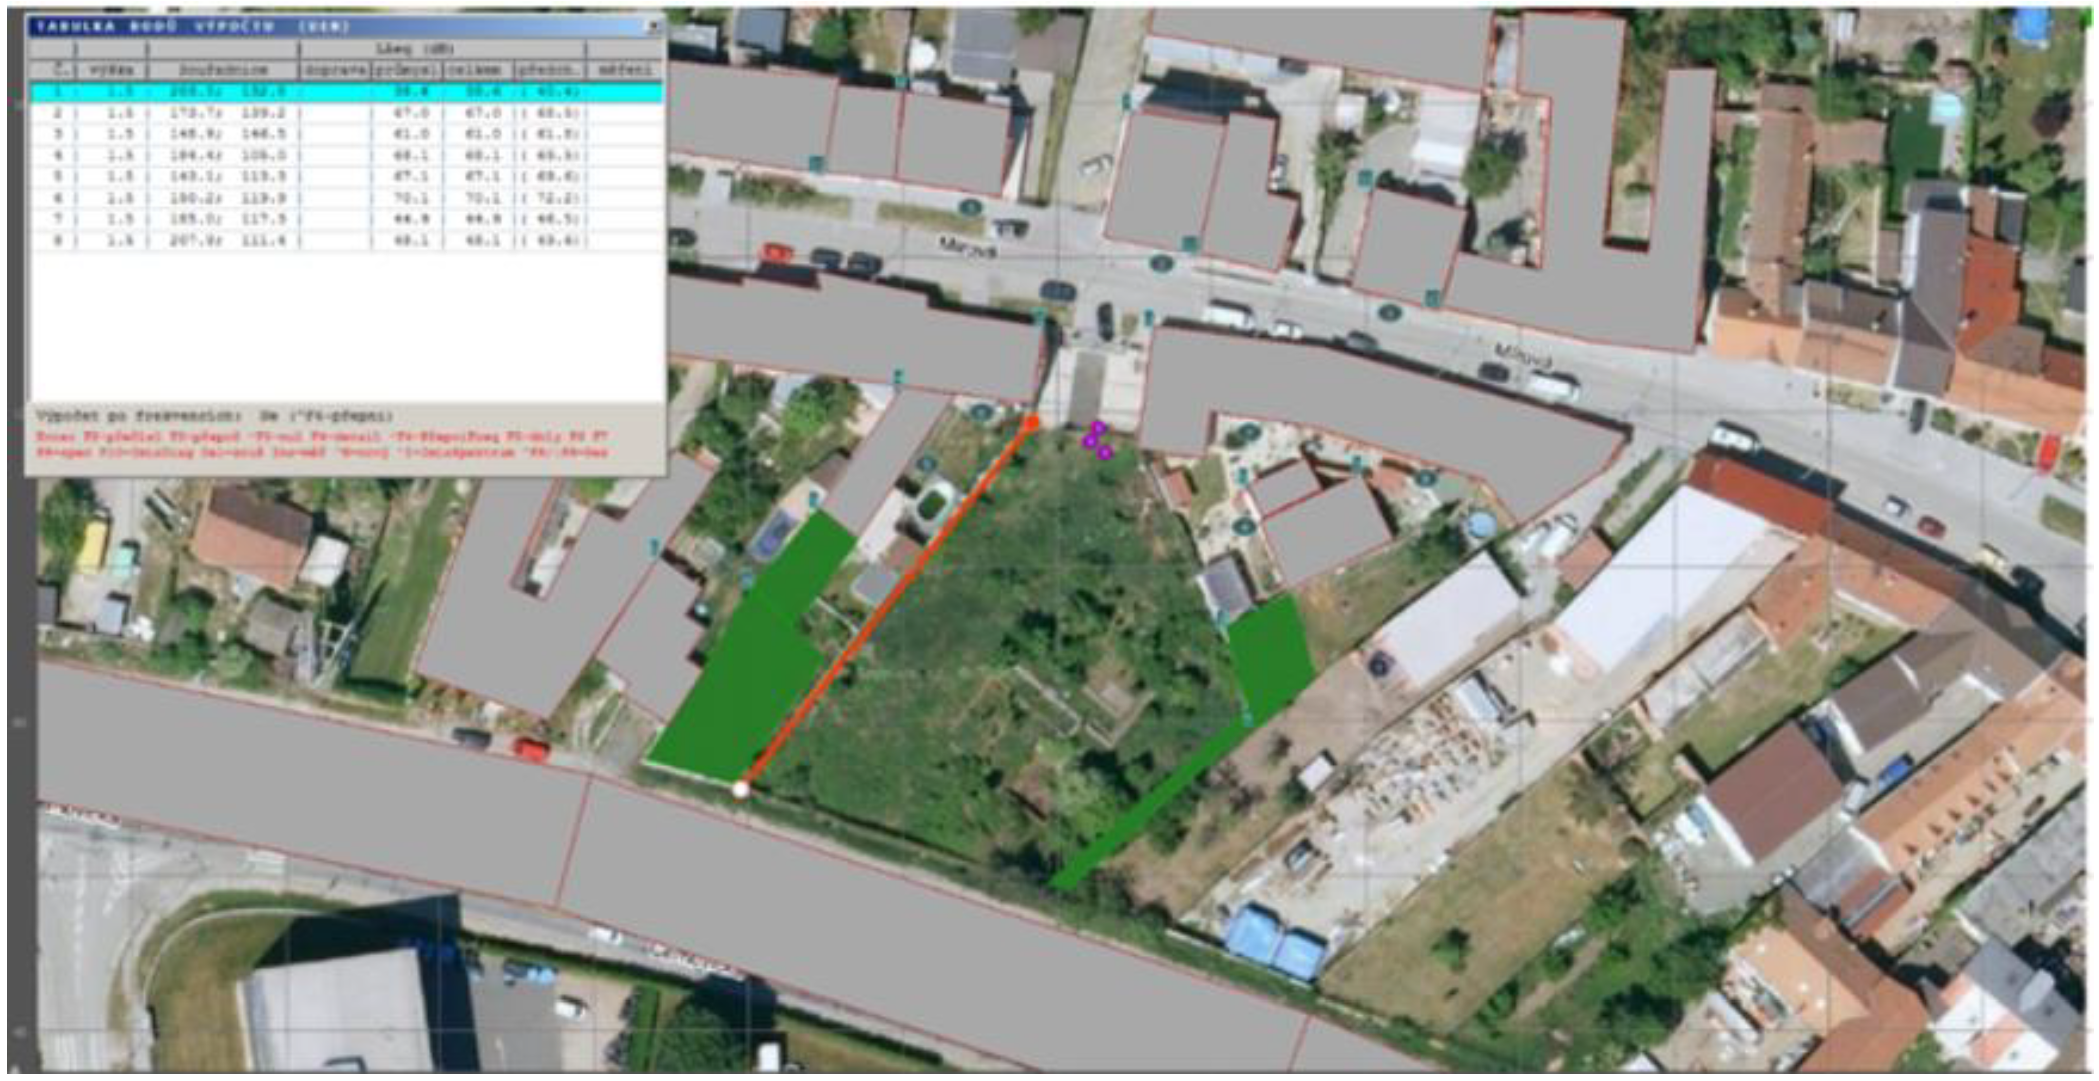
Figure 6.
Acoustically significant elements of the investigated area, with the positions of construction machines as sources of noise, with simultaneous deployment and a table with values.
Figure 6.
Acoustically significant elements of the investigated area, with the positions of construction machines as sources of noise, with simultaneous deployment and a table with values.
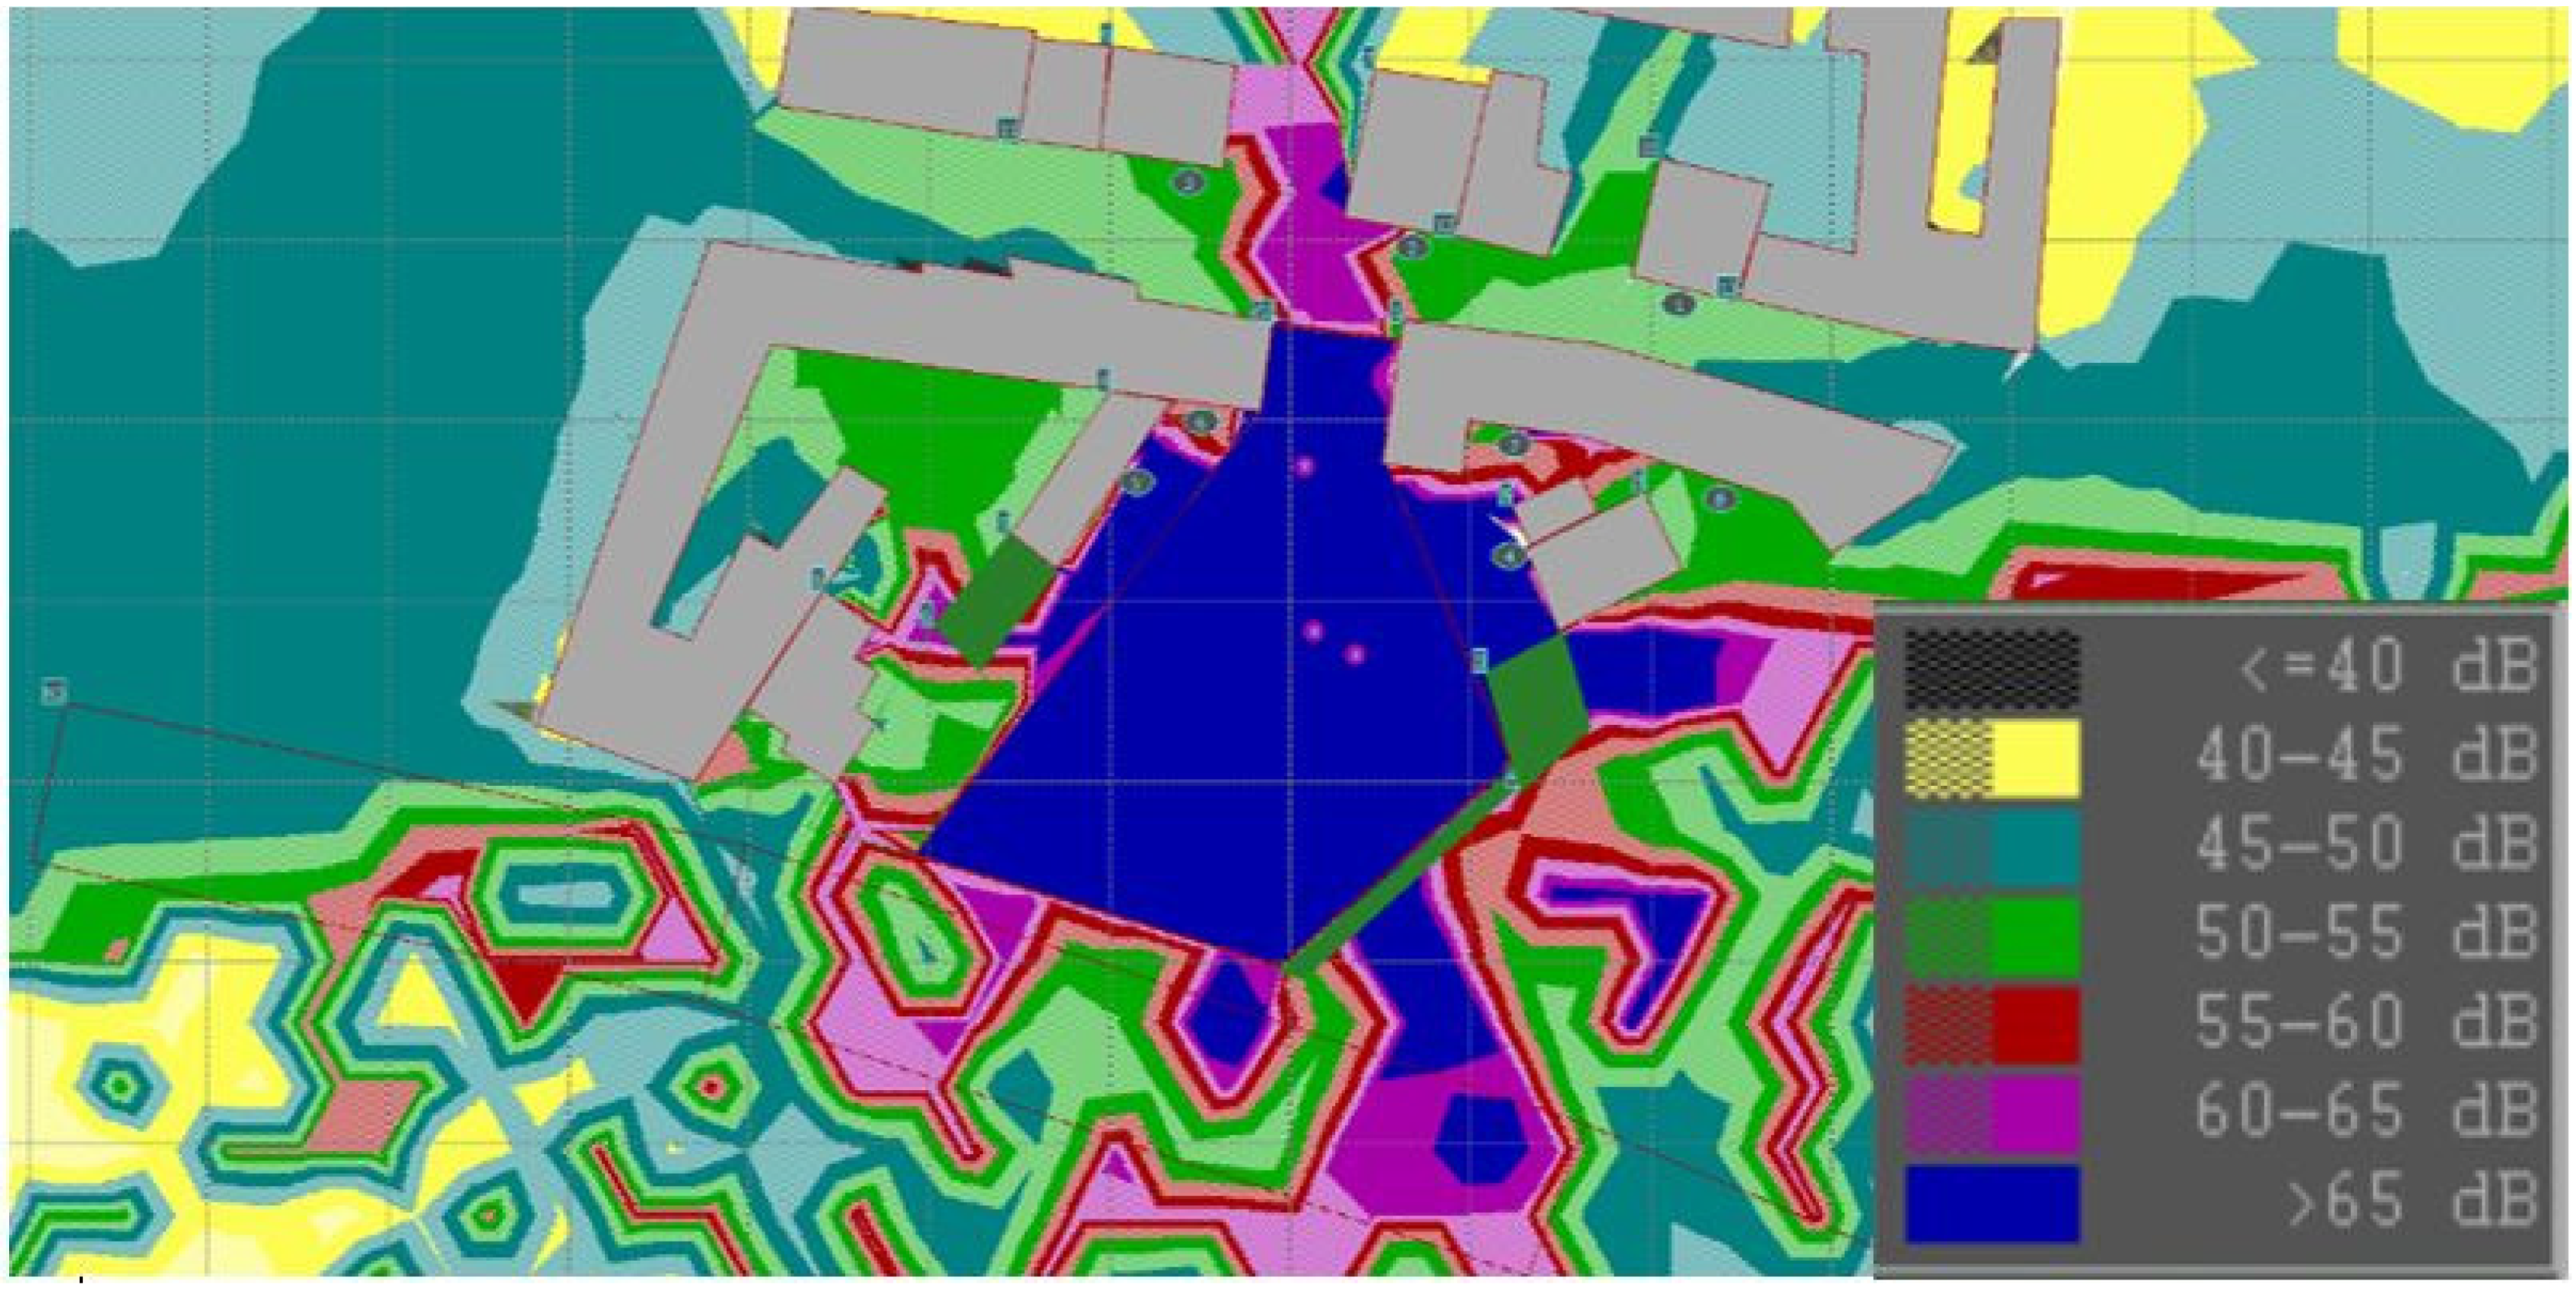
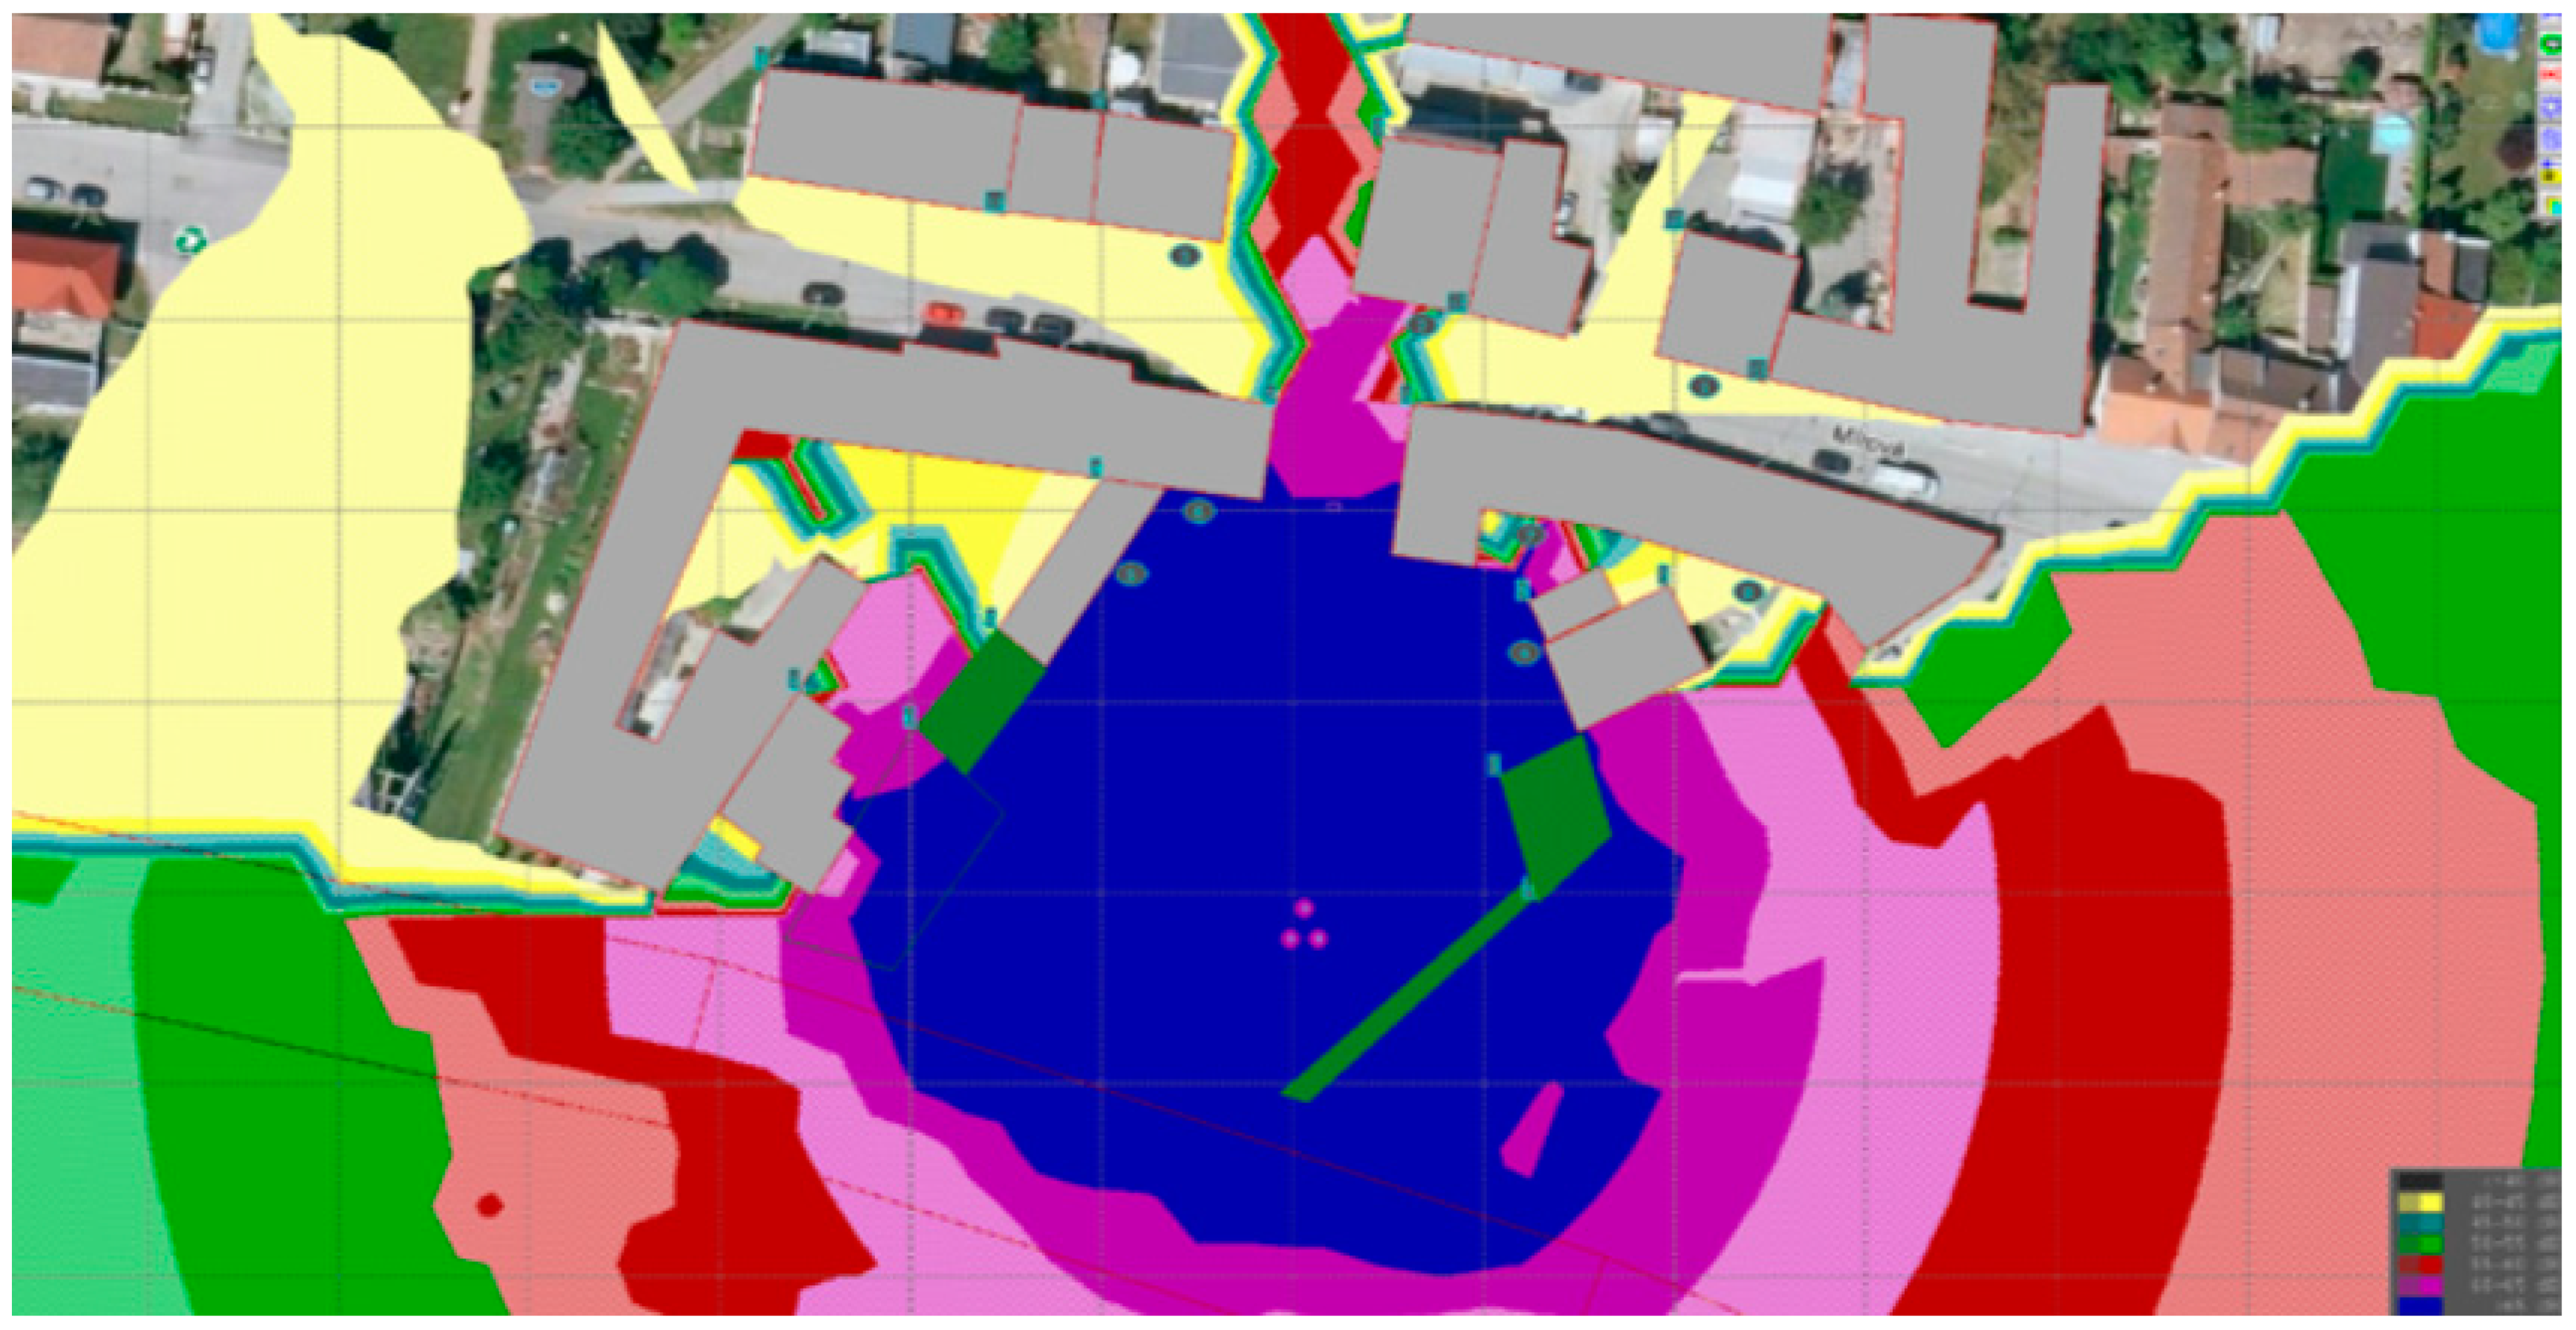
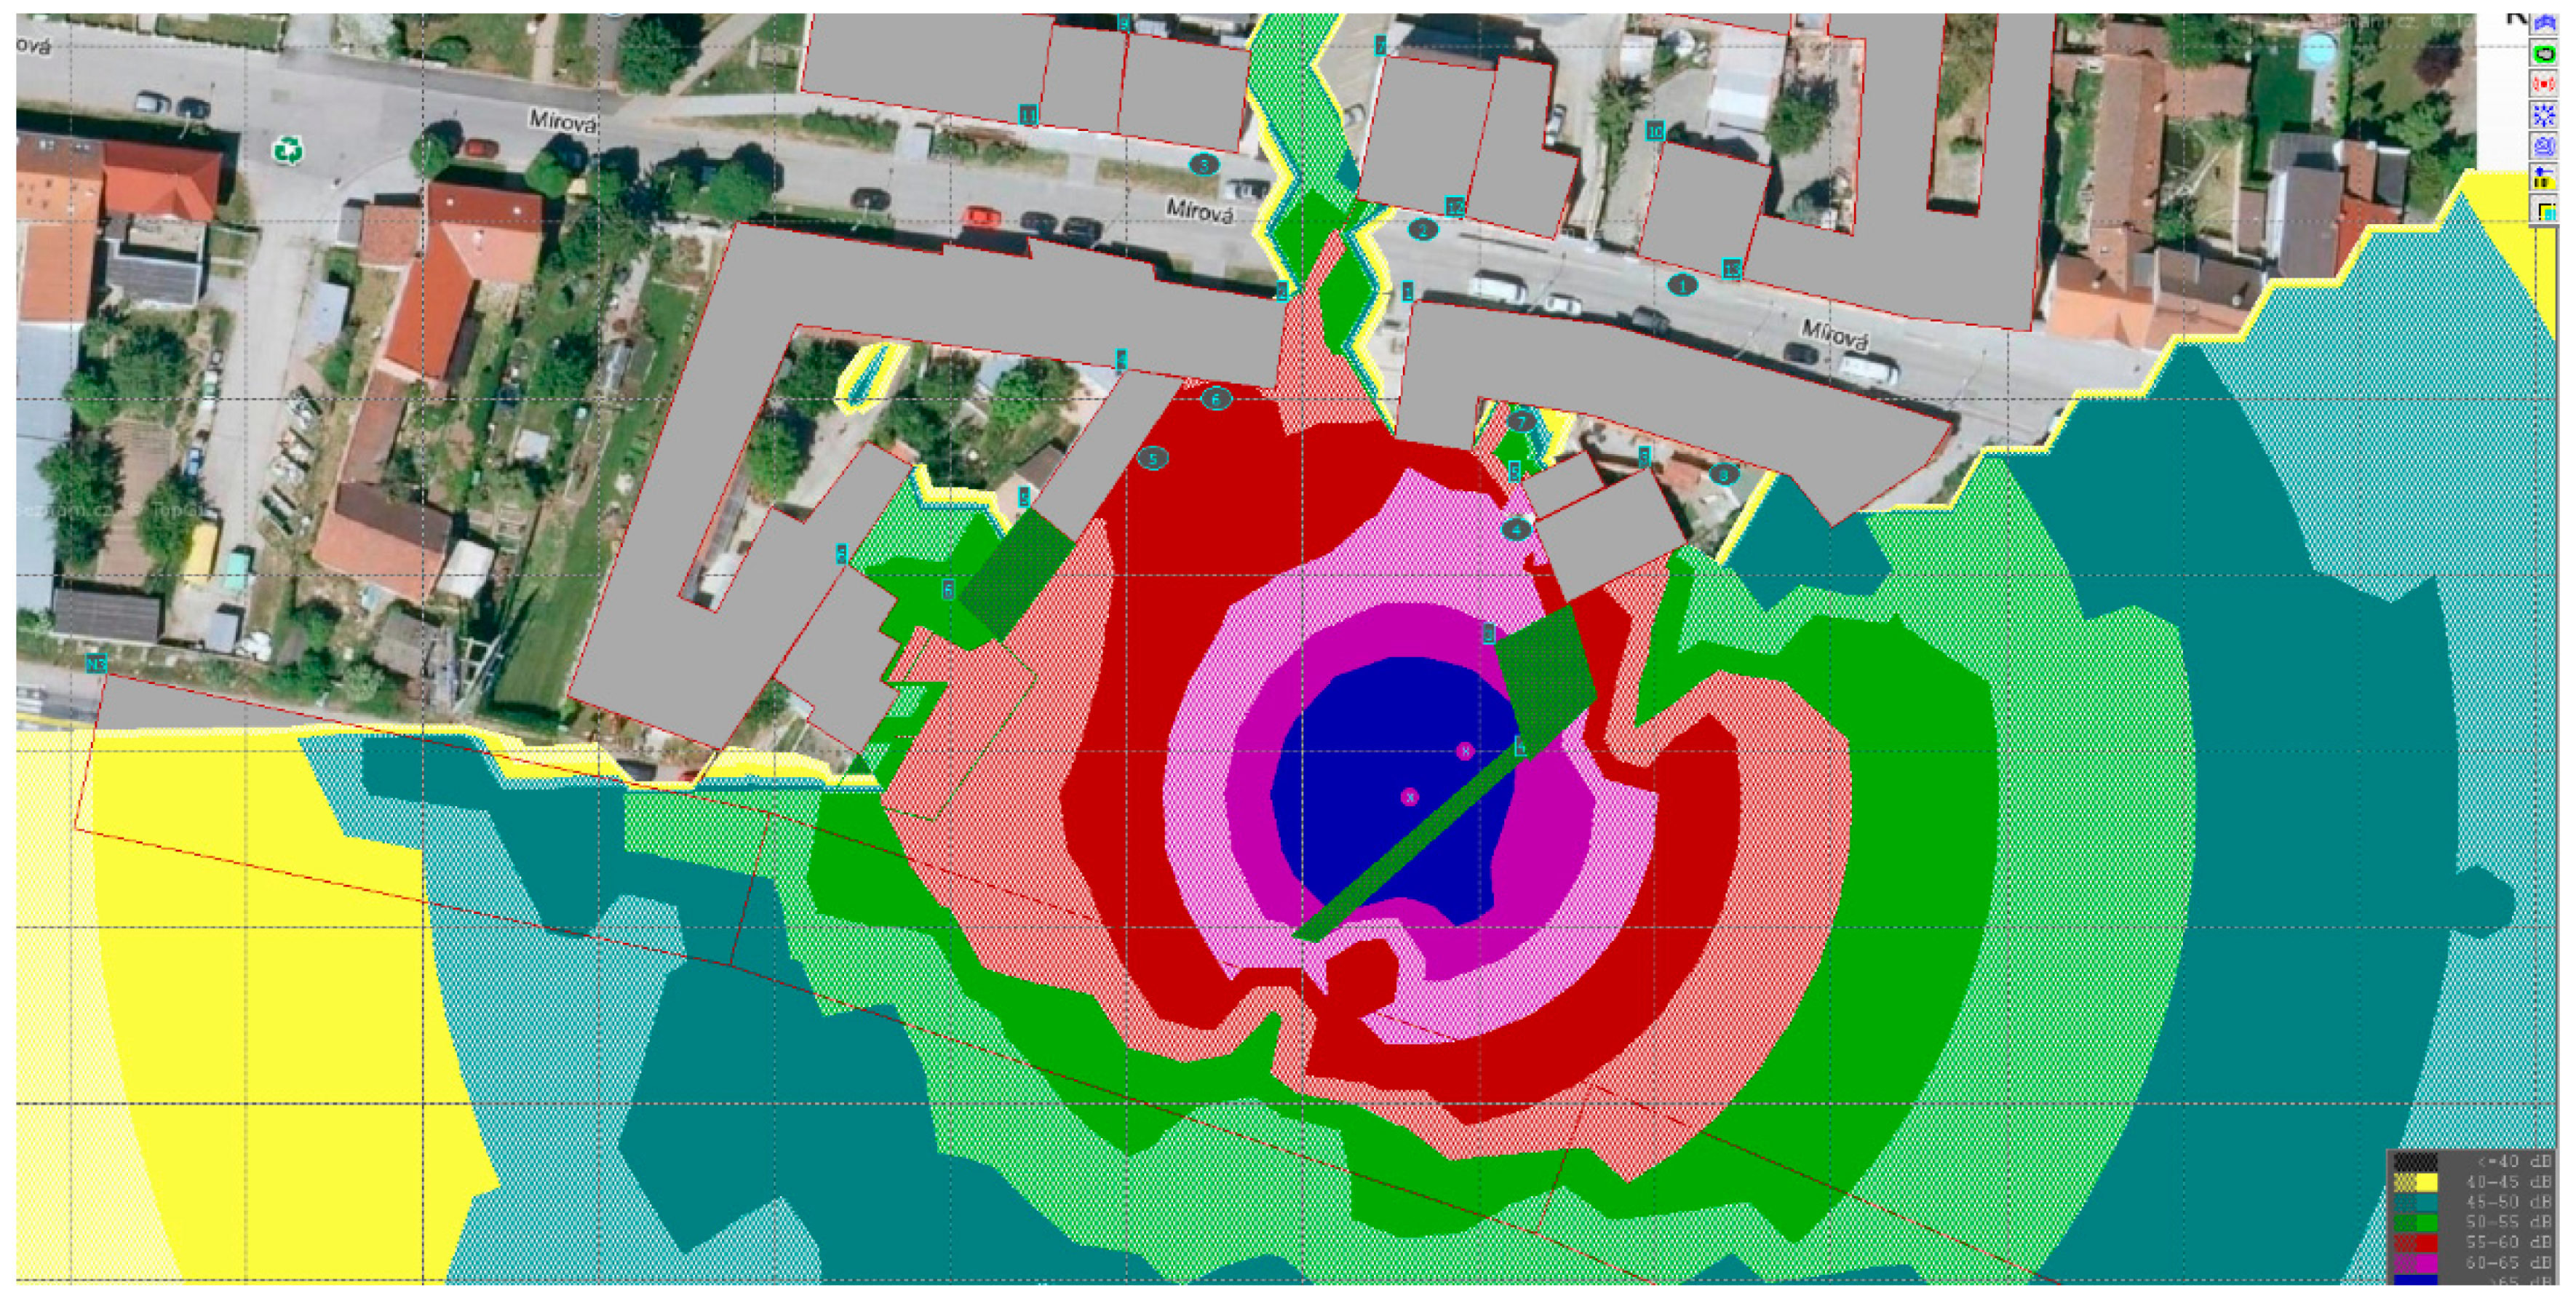
Figure 7.
Colour representation of isophone bands after considering acoustically significant elements, including construction site fencing and a solid gate for the entrance to the construction site in the investigated area.
Figure 7.
Colour representation of isophone bands after considering acoustically significant elements, including construction site fencing and a solid gate for the entrance to the construction site in the investigated area.
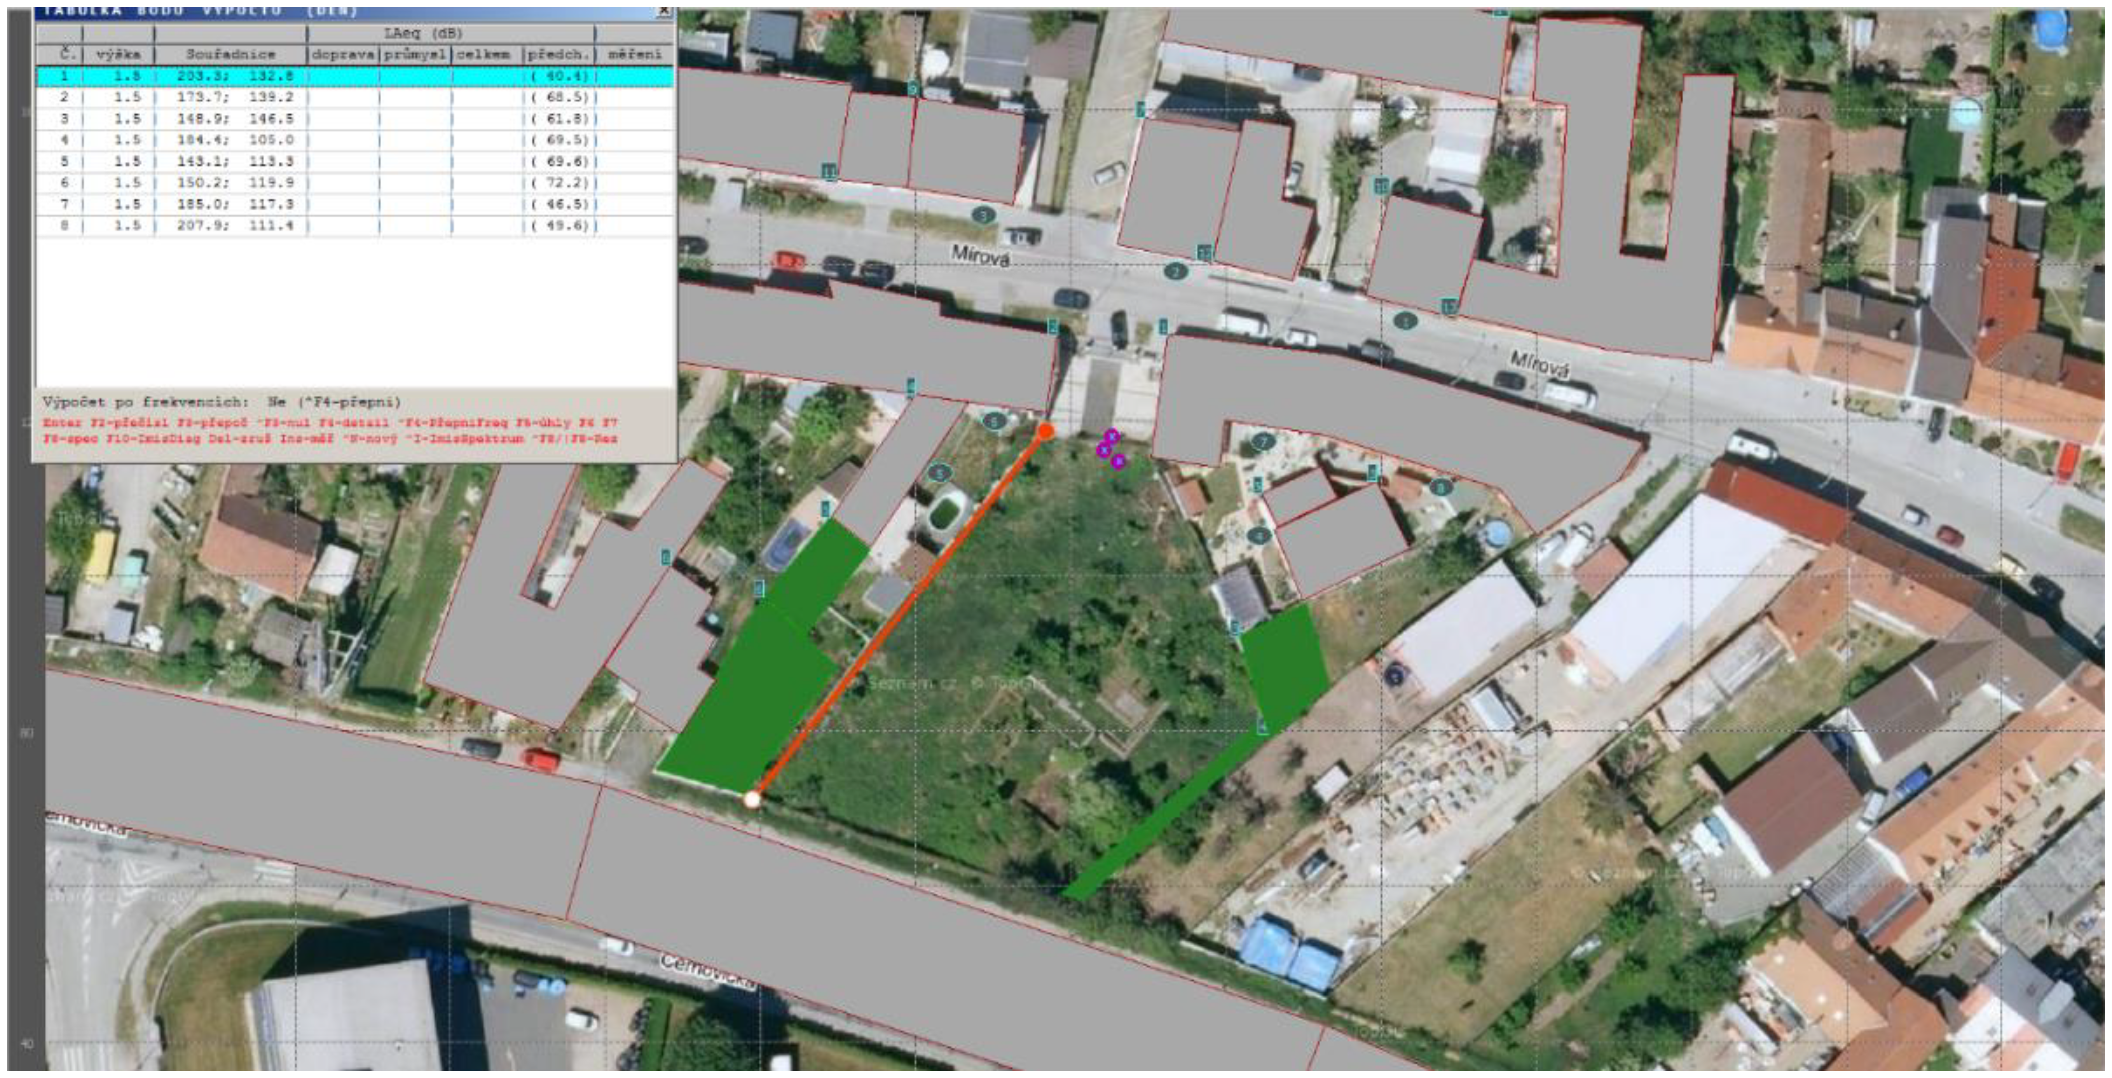
Figure 8.
Acoustically significant elements (without construction site fencing or a solid gate) for earthworks during the construction of connections in the investigated area, with a table of values for the simultaneous deployment of machines.
Figure 8.
Acoustically significant elements (without construction site fencing or a solid gate) for earthworks during the construction of connections in the investigated area, with a table of values for the simultaneous deployment of machines.
Figure 9.
Acoustically significant elements (without construction site fencing or a solid gate) for earthworks during the execution of connections in the investigated area, with a table of values.
Figure 9.
Acoustically significant elements (without construction site fencing or a solid gate) for earthworks during the execution of connections in the investigated area, with a table of values.
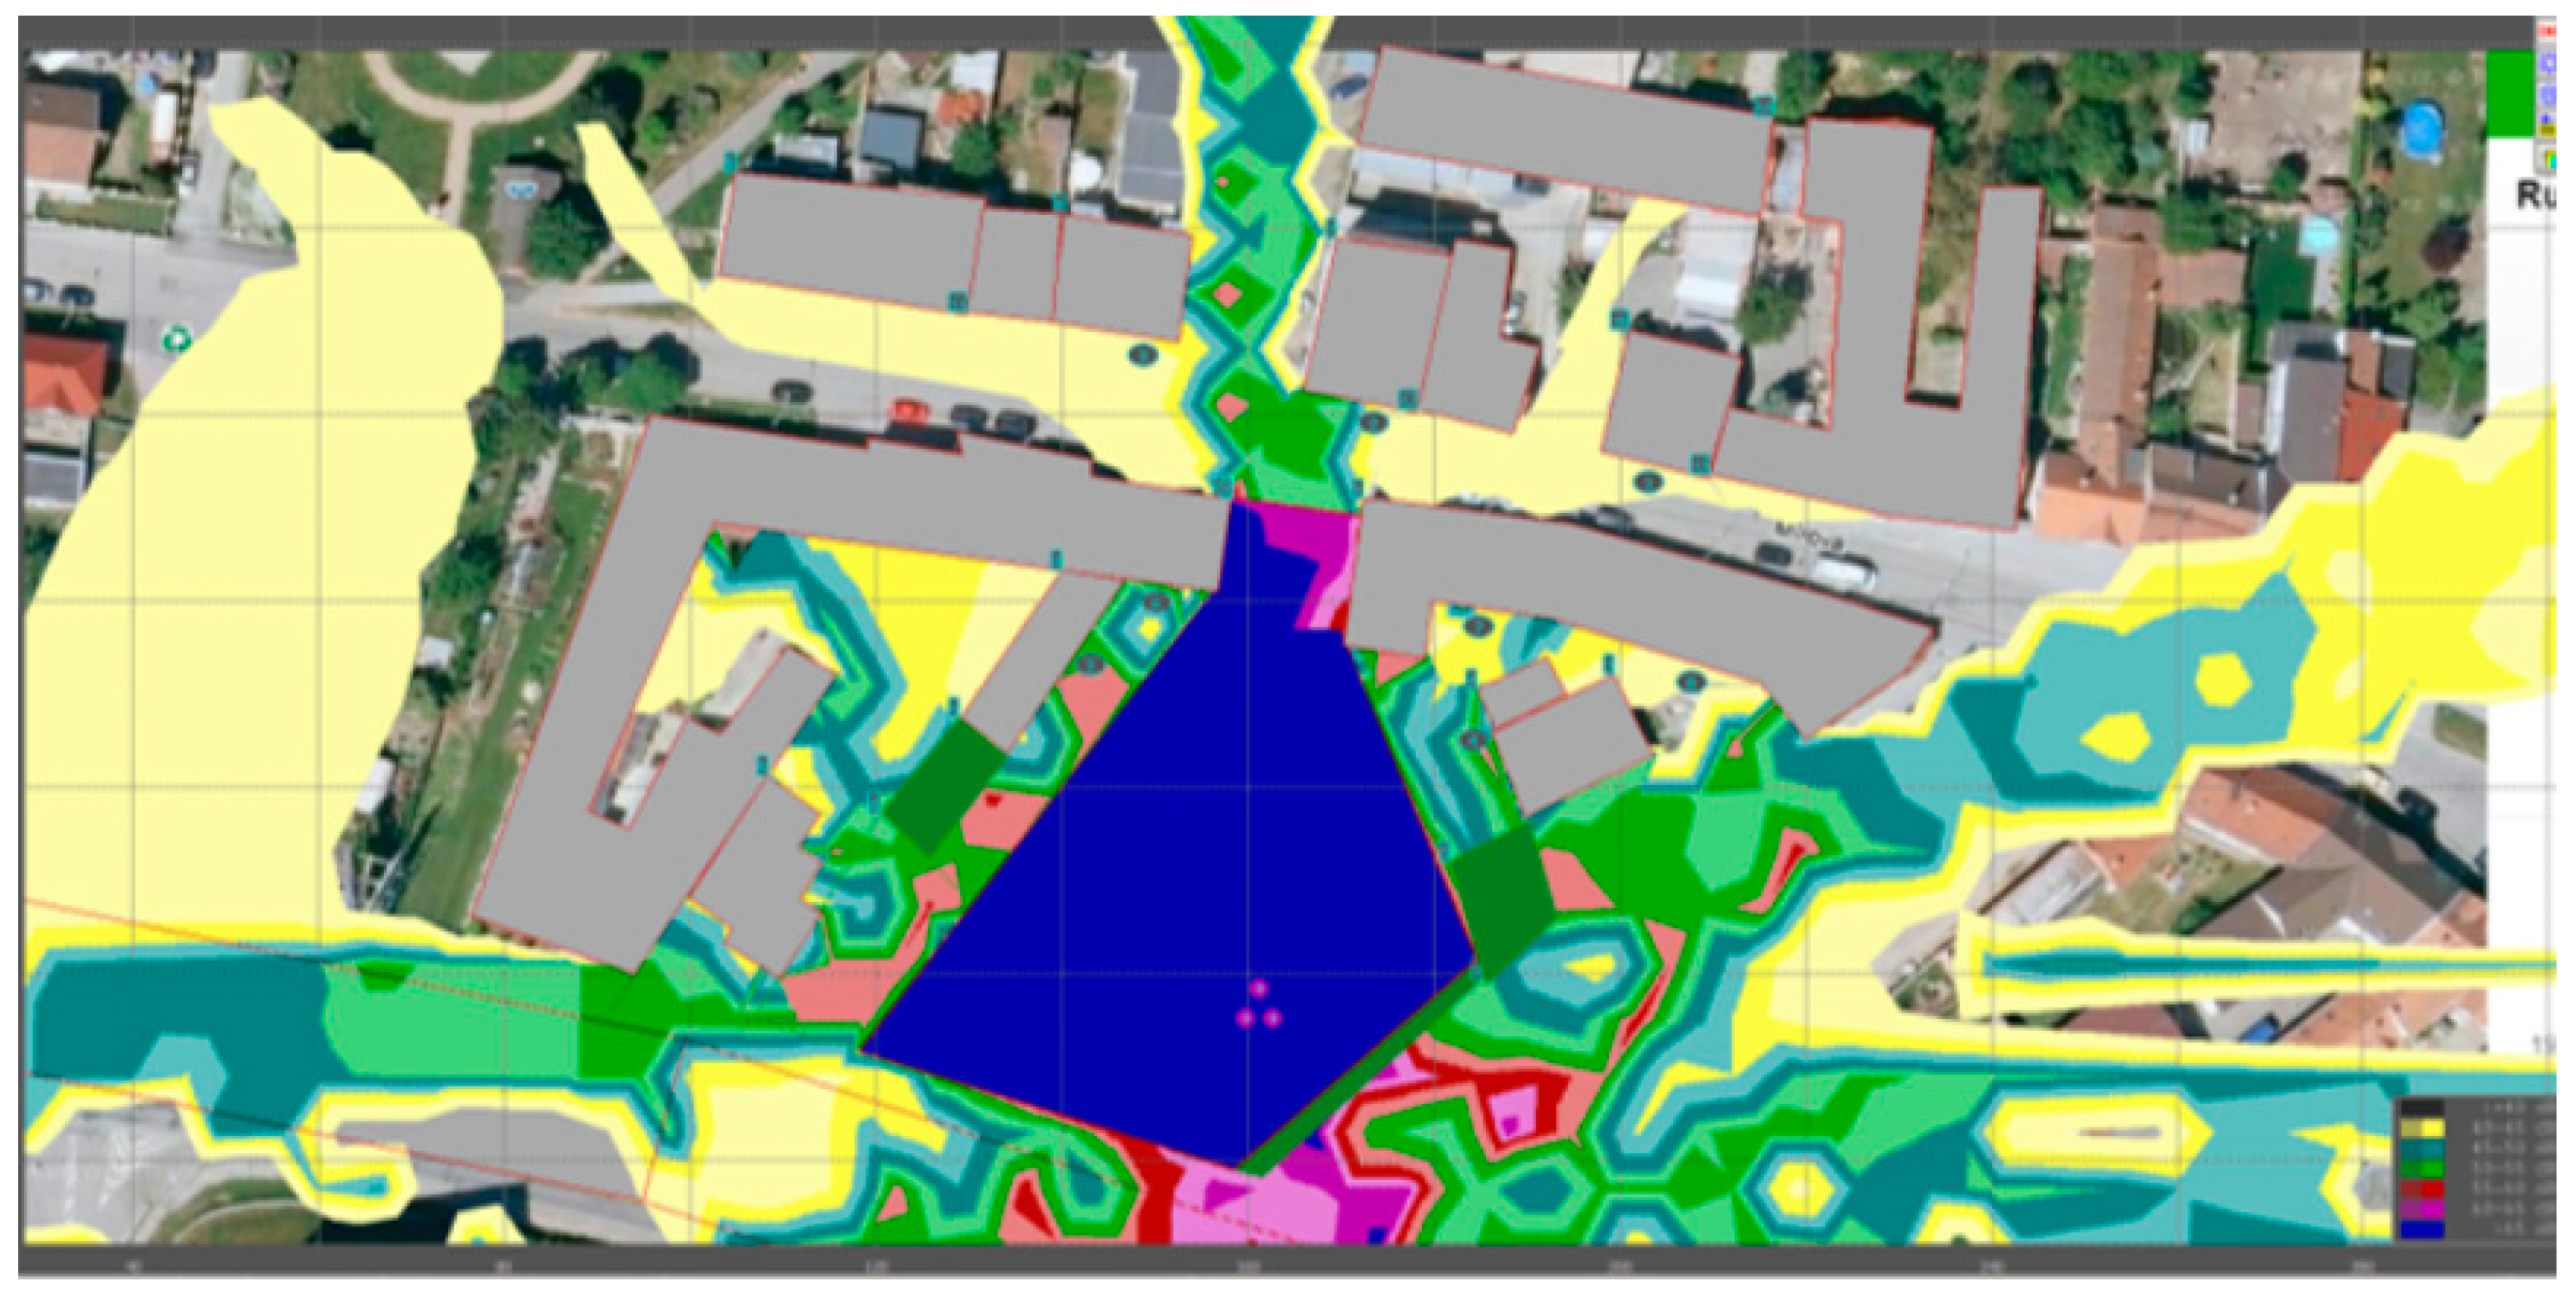
Figure 10.
Colour map of isophone bands after the consideration of acoustically significant elements (without construction site fencing or a solid gate) for earthworks in the investigated area.
Figure 10.
Colour map of isophone bands after the consideration of acoustically significant elements (without construction site fencing or a solid gate) for earthworks in the investigated area.
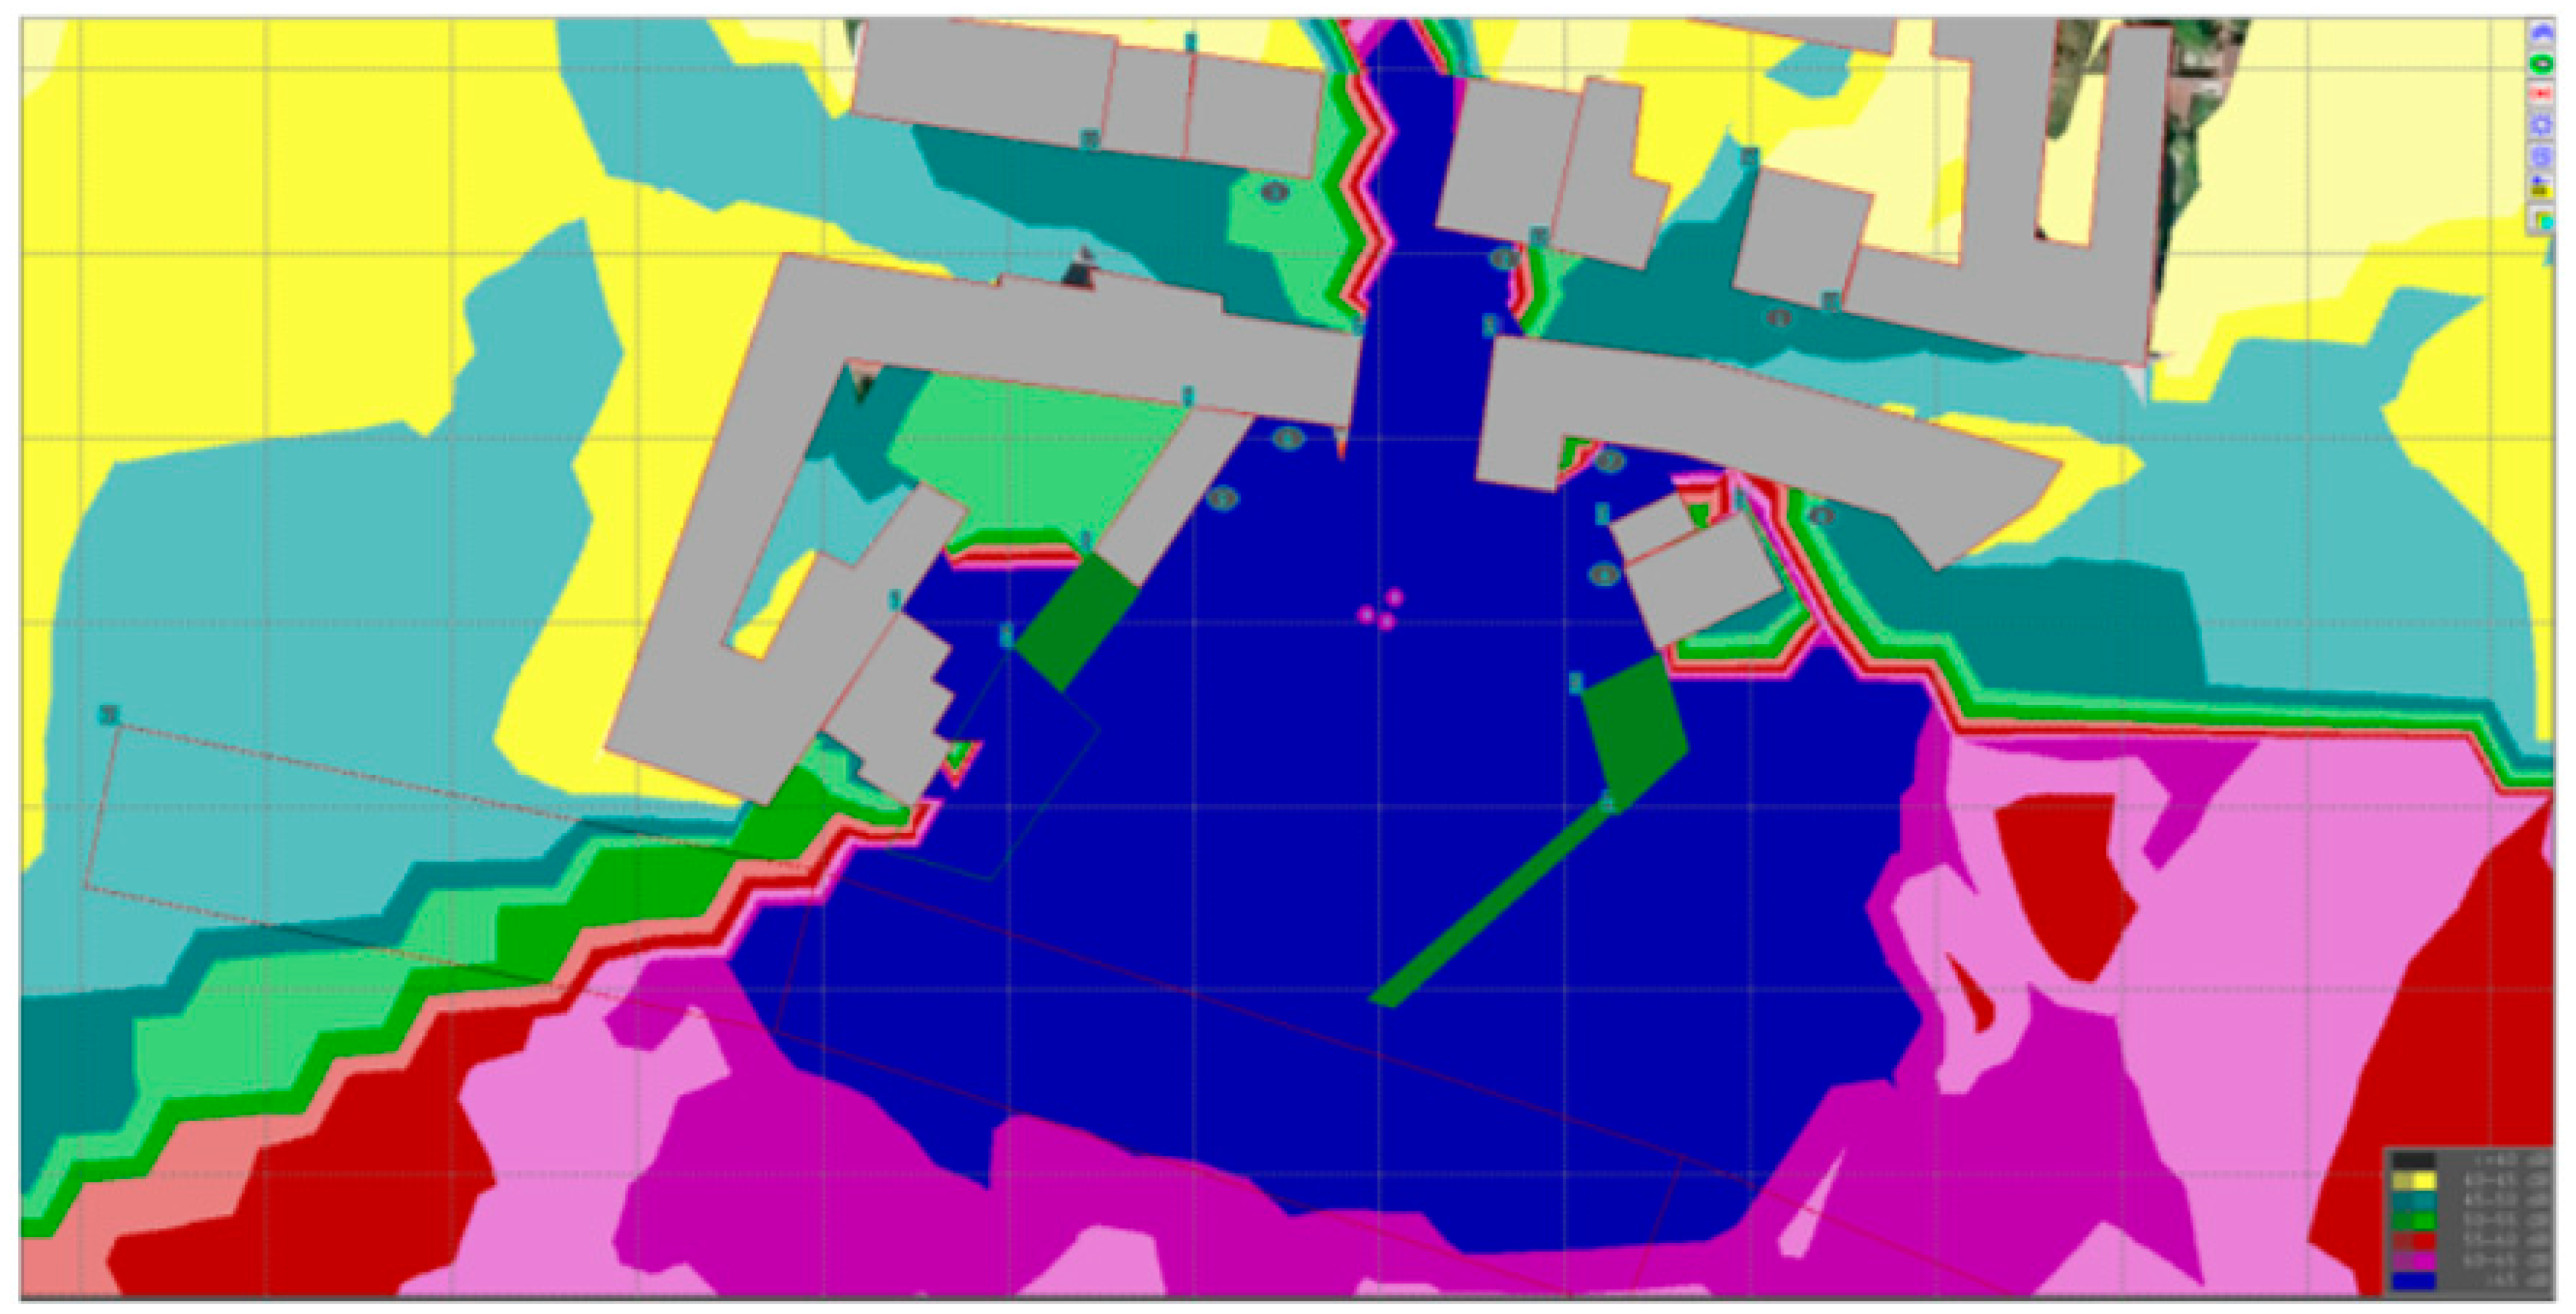
Figure 11.
Colour map of isophone bands after the consideration of acoustically significant elements with construction site fencing and a solid gate for earthworks in the investigated area.
Figure 11.
Colour map of isophone bands after the consideration of acoustically significant elements with construction site fencing and a solid gate for earthworks in the investigated area.
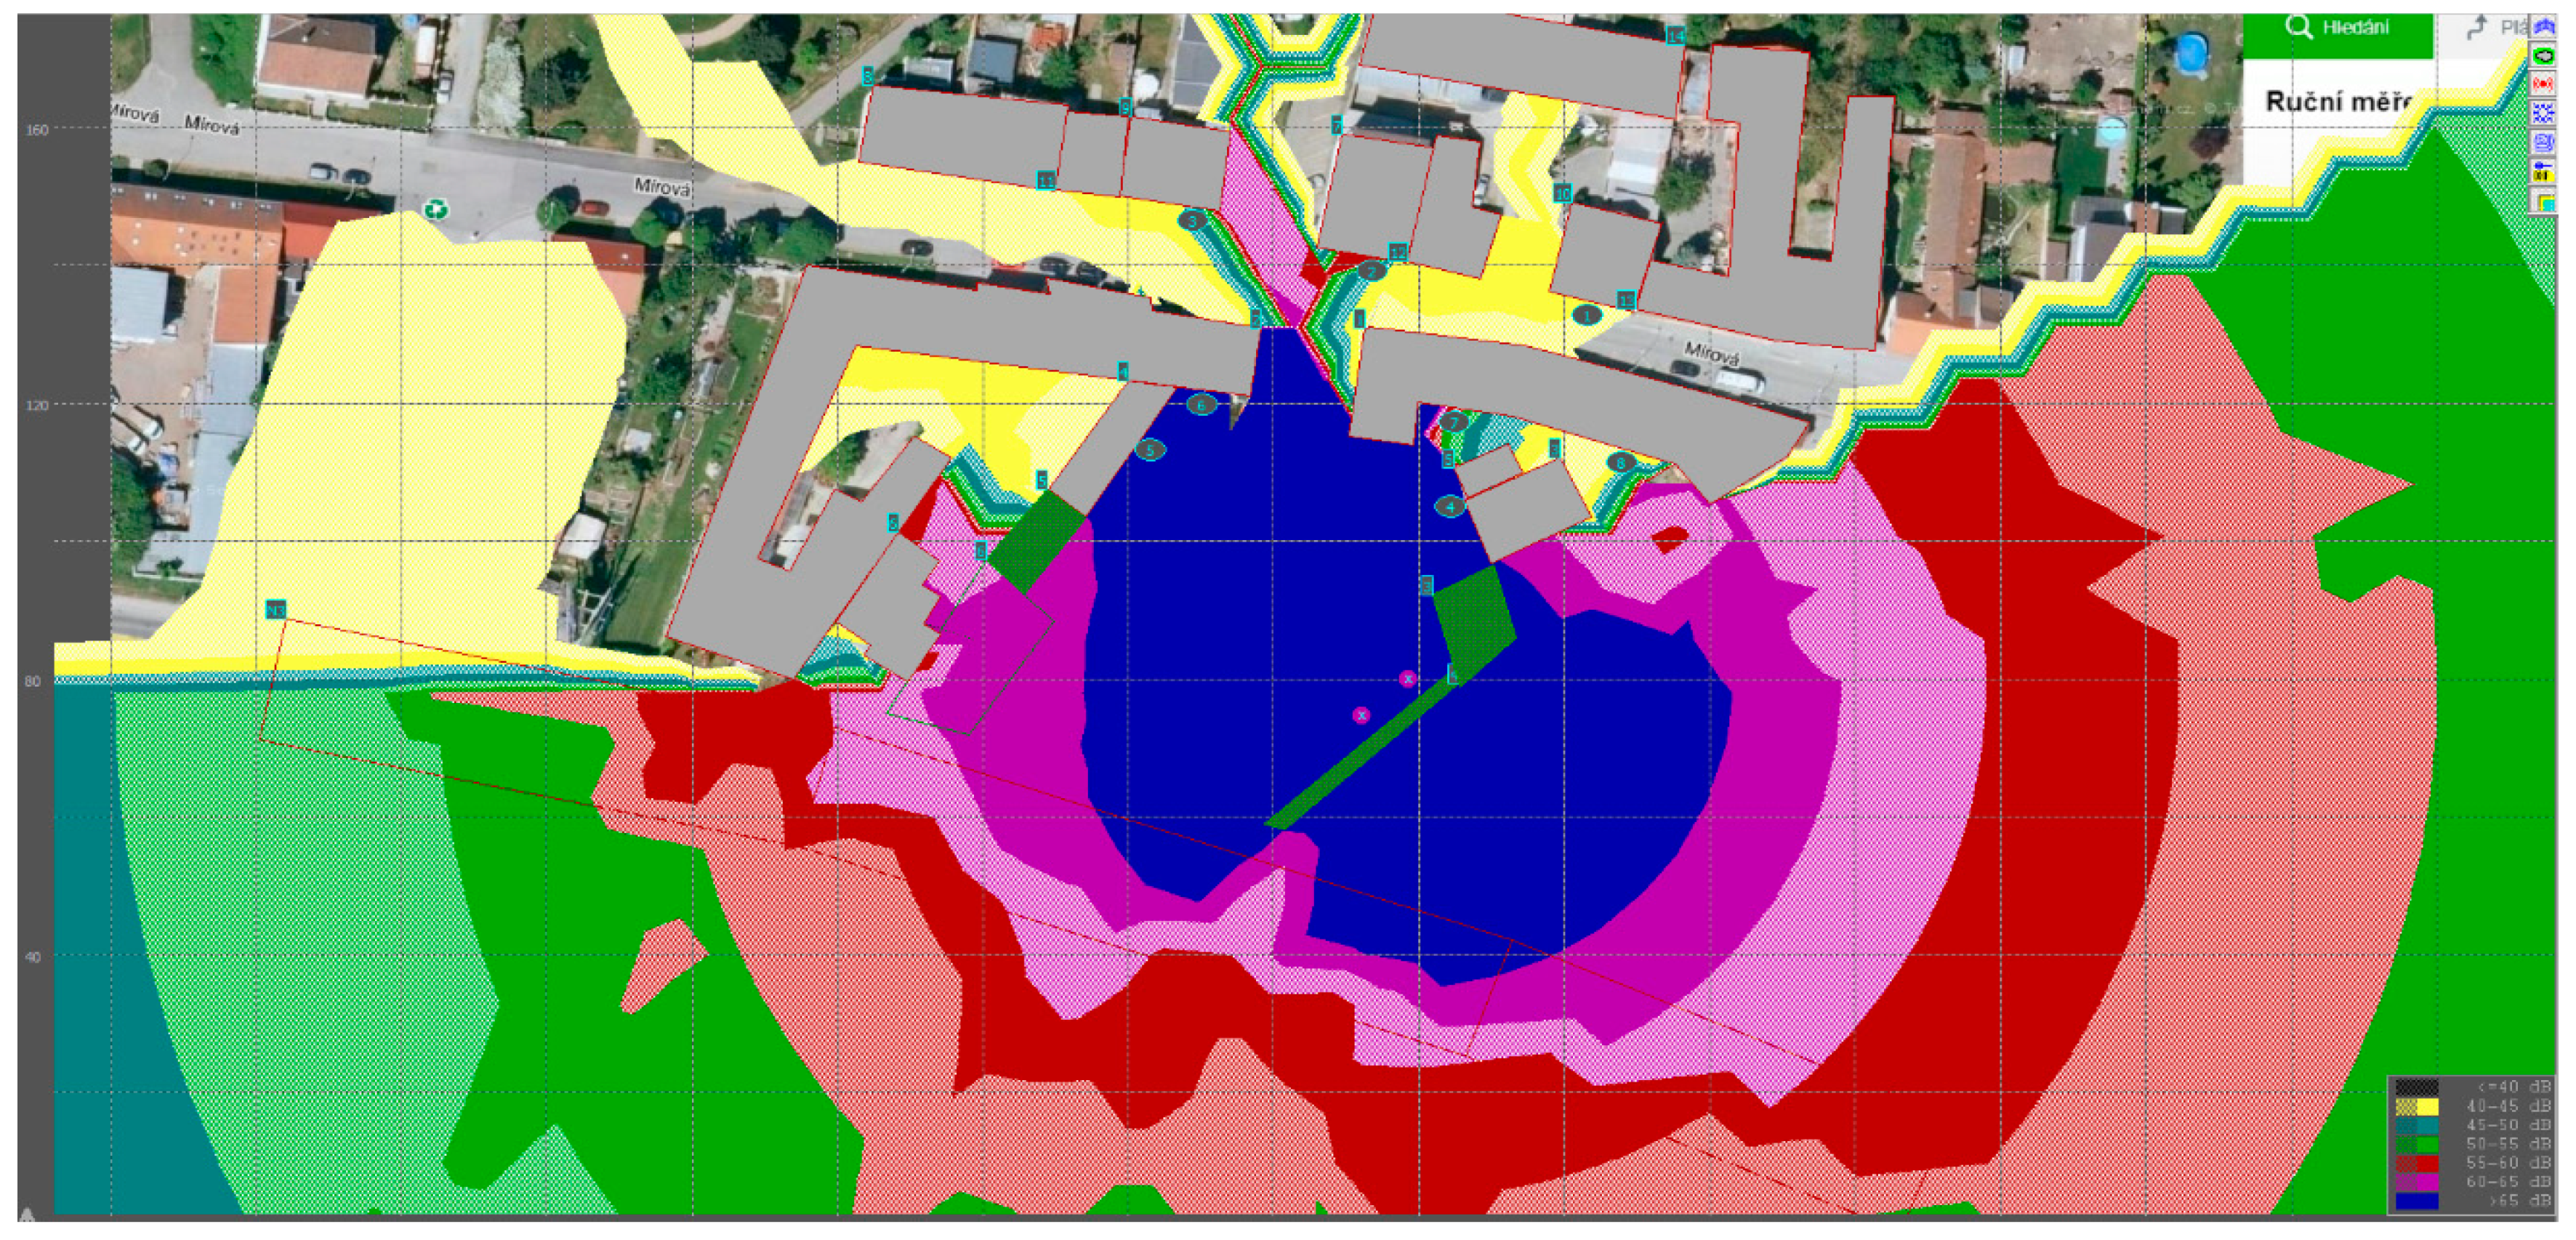
Figure 12.
Colour map of isophone bands after considering acoustically significant elements (without construction site fencing or a solid gate) for pile-driving work in the investigated area.
Figure 12.
Colour map of isophone bands after considering acoustically significant elements (without construction site fencing or a solid gate) for pile-driving work in the investigated area.
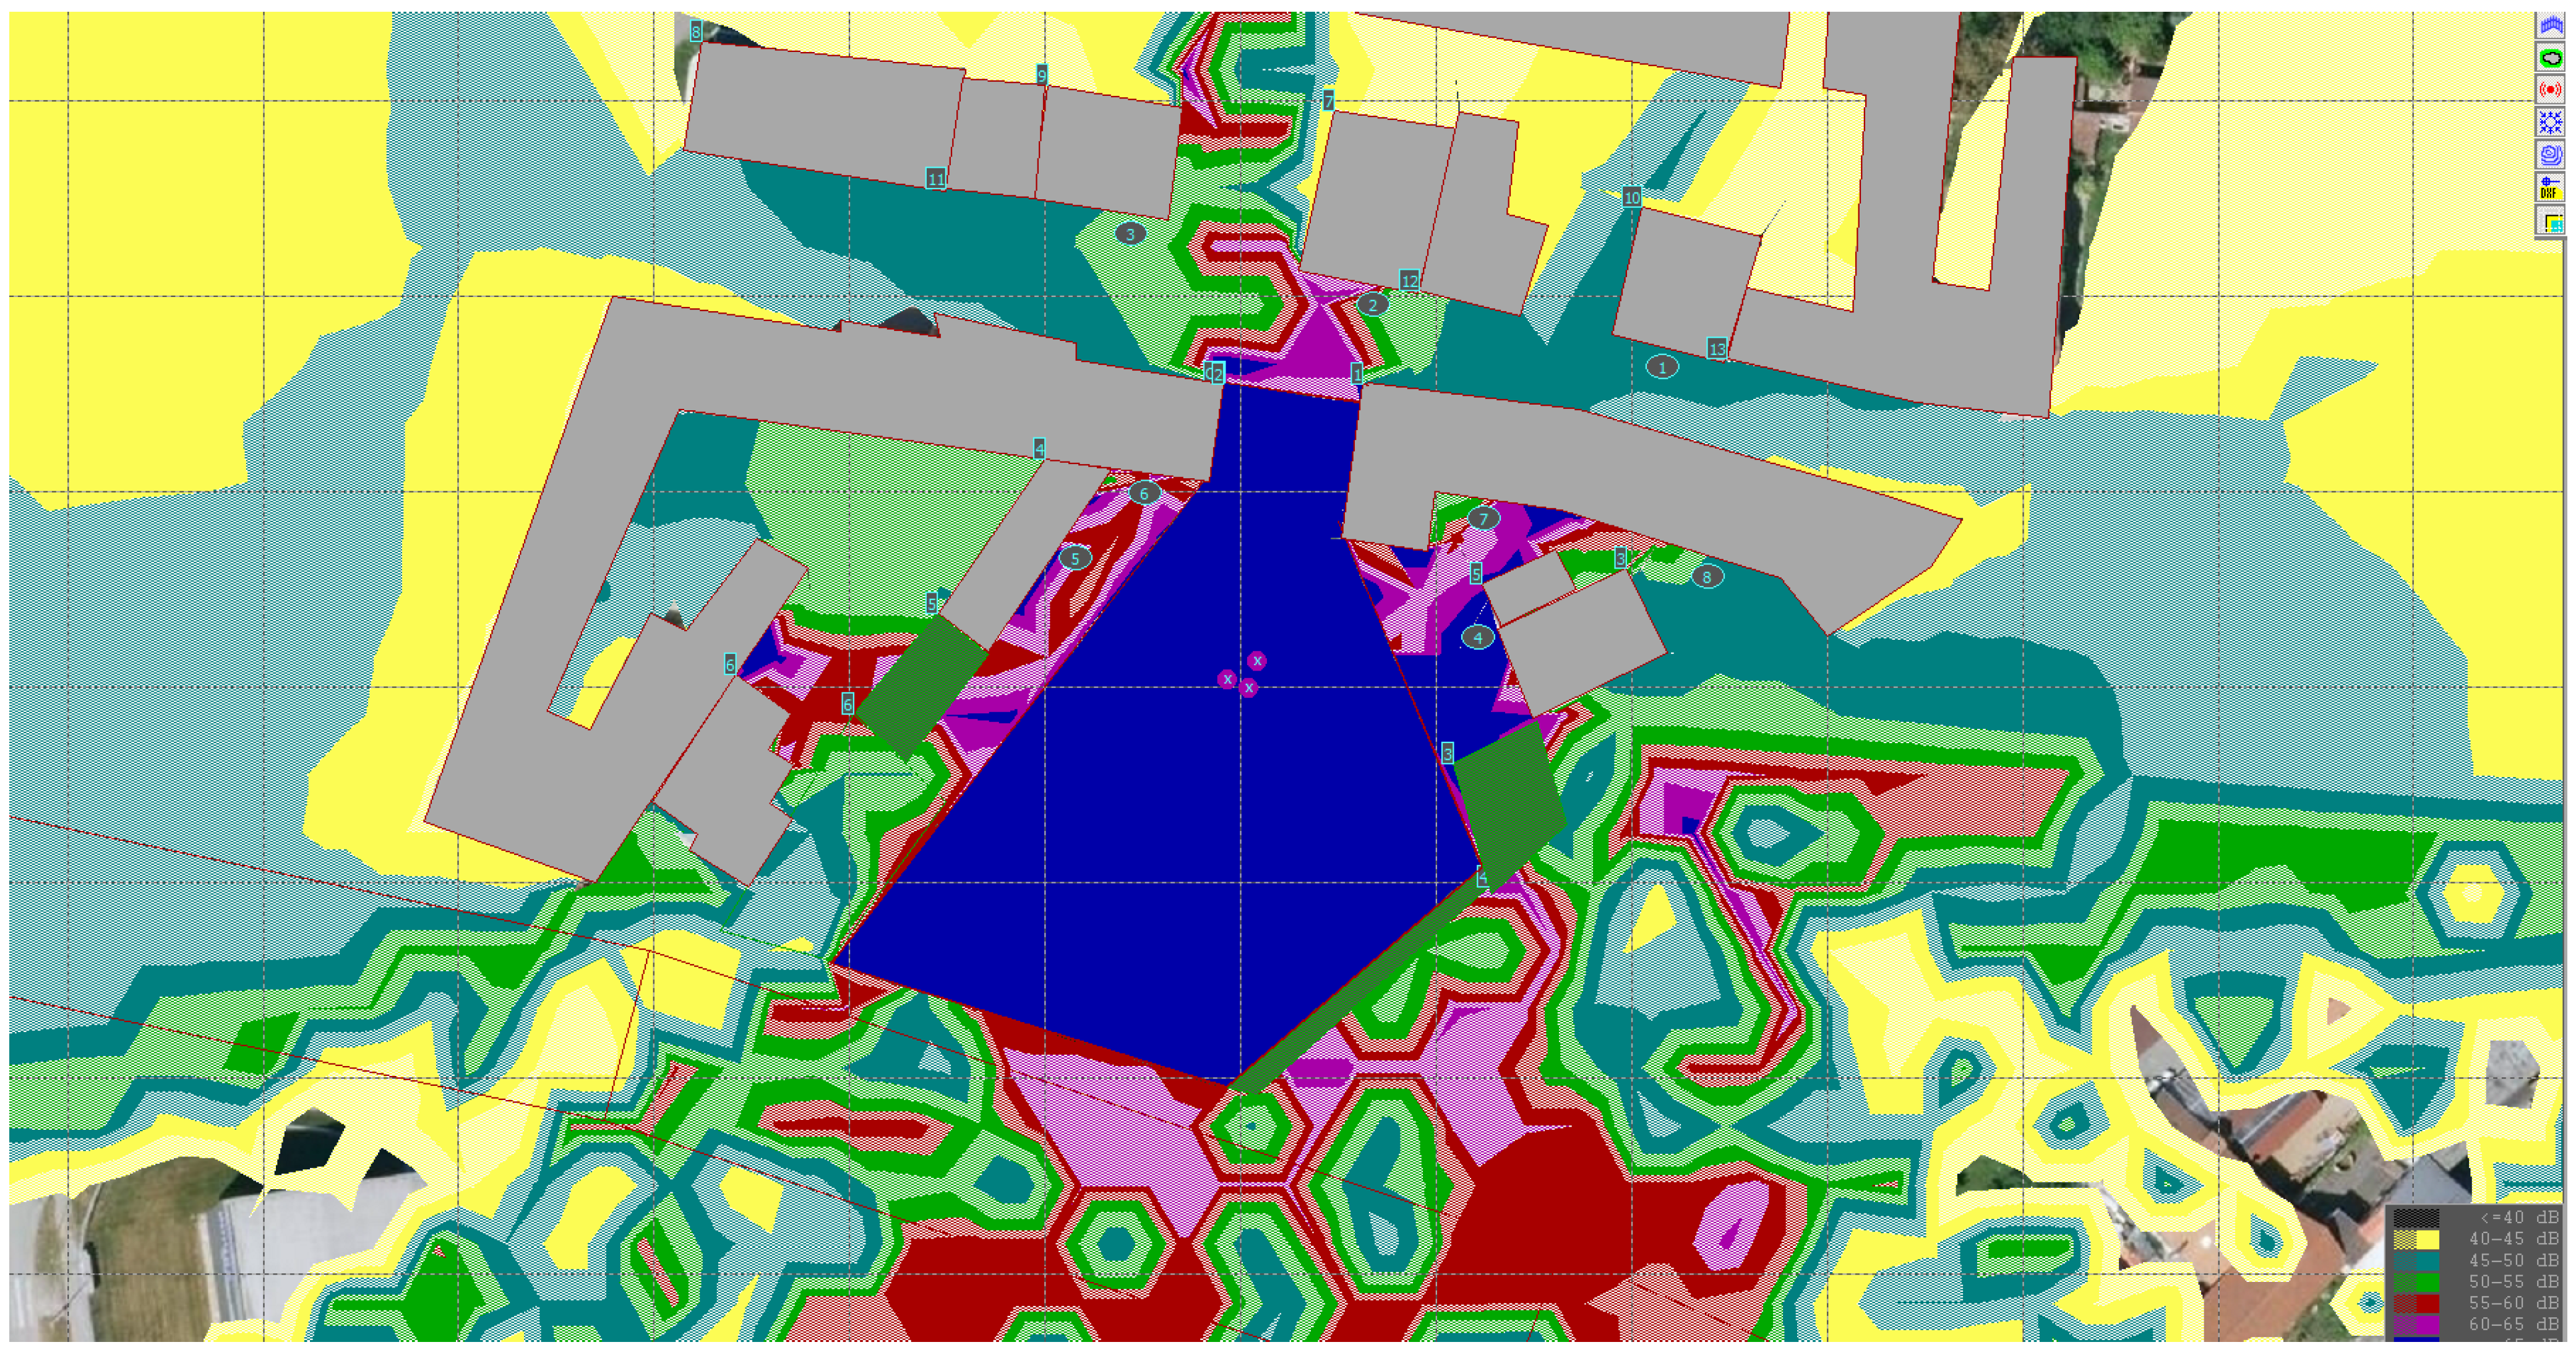
Figure 13.
Colour map of isophone bands after considering acoustically significant elements with construction site fencing and a solid gate for pile-driving work in the investigated area.
Figure 13.
Colour map of isophone bands after considering acoustically significant elements with construction site fencing and a solid gate for pile-driving work in the investigated area.
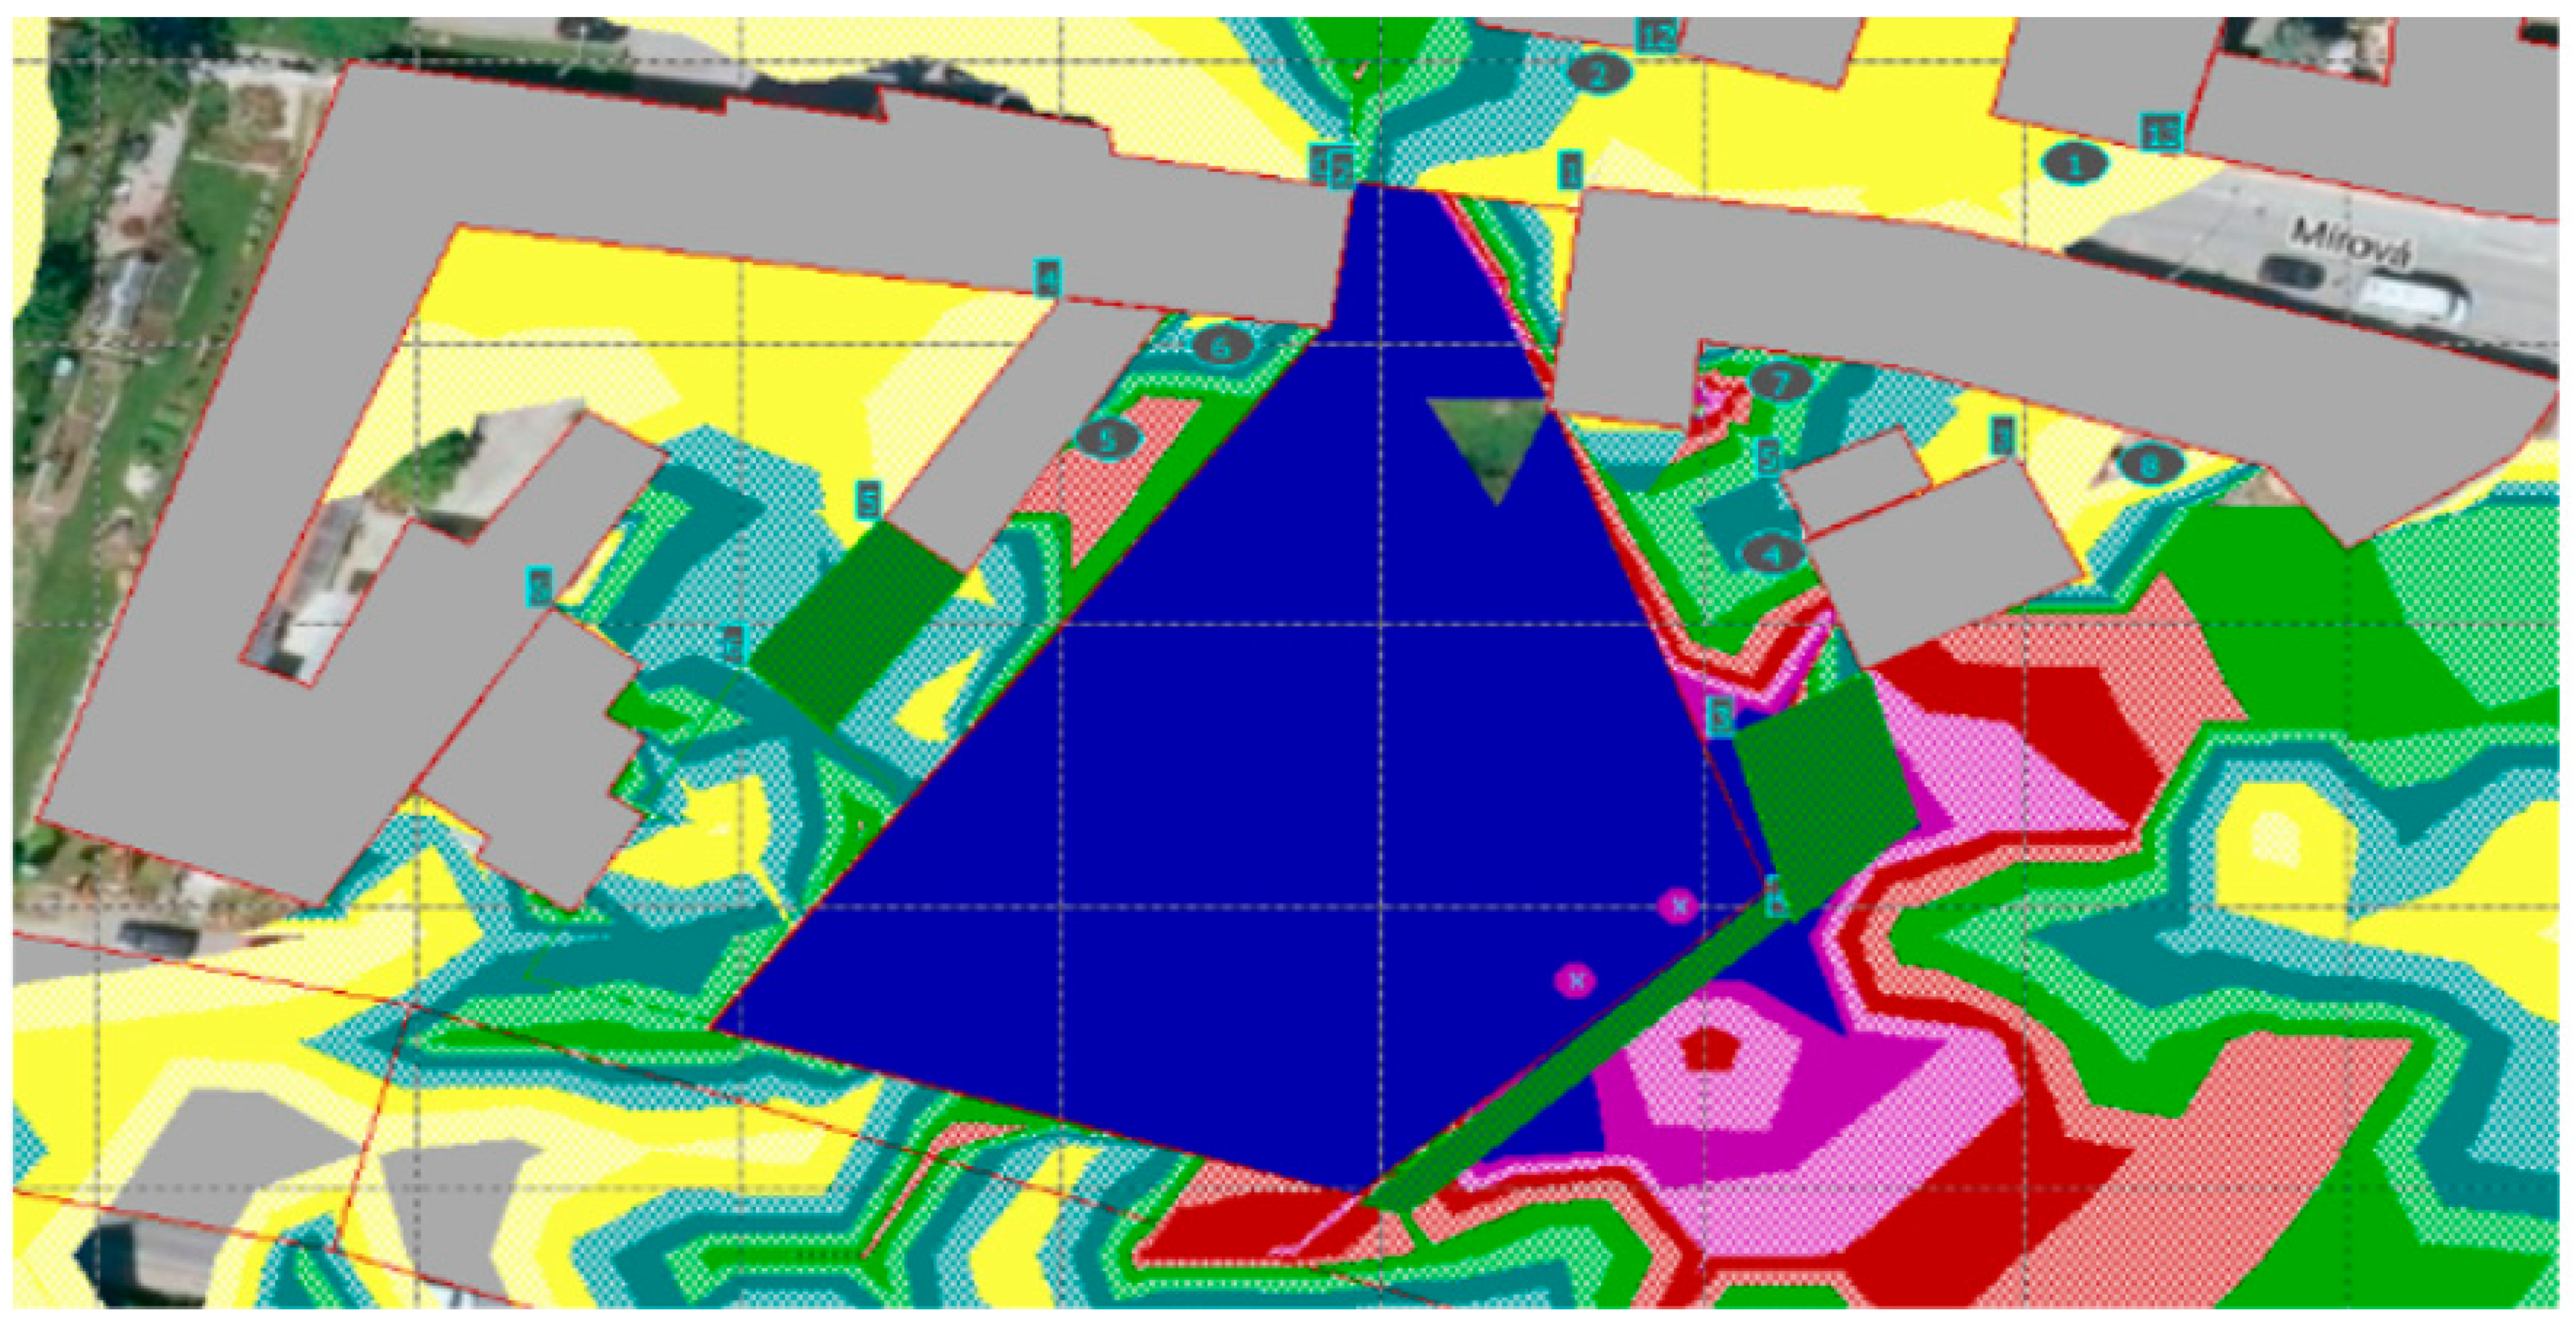
Figure 14.
Colour map of isophone bands after considering acoustically significant elements (without construction site fencing or a solid gate) for pile-driving work in the investigated area, with the positions of machines.
Figure 14.
Colour map of isophone bands after considering acoustically significant elements (without construction site fencing or a solid gate) for pile-driving work in the investigated area, with the positions of machines.
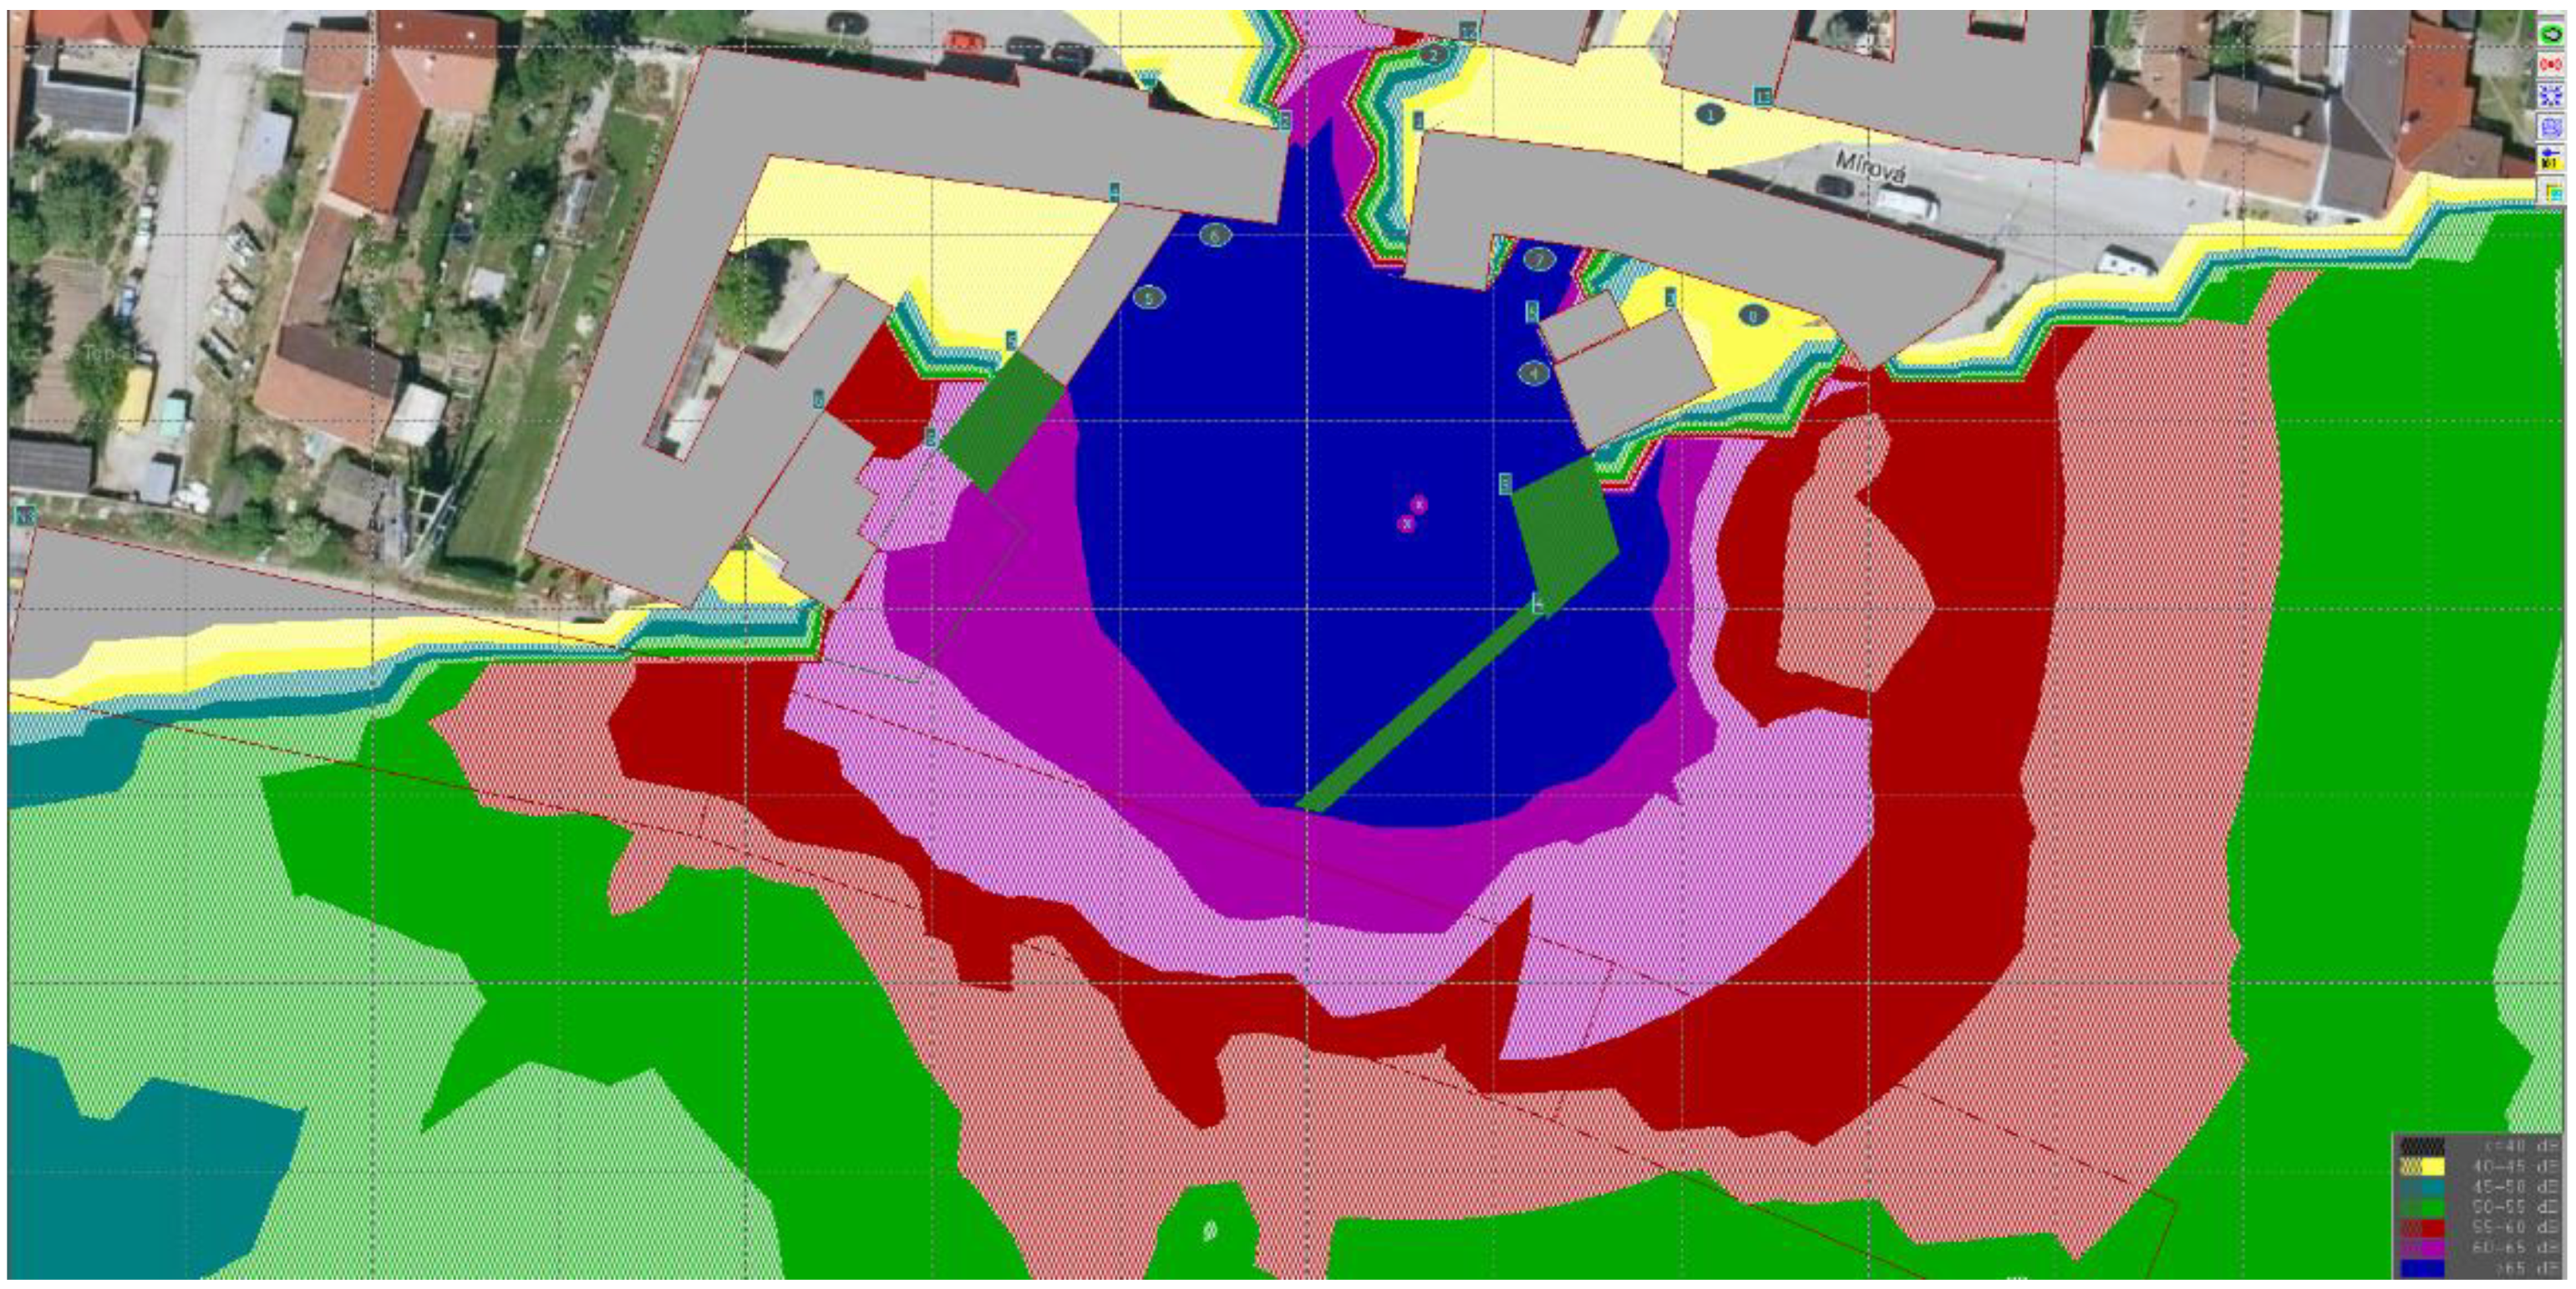
Figure 15.
Colour map of isophone bands after considering acoustically significant elements (without construction site fencing or a solid gate) for the concreting of foundations in the investigated area, with the position of machines inside the construction site.
Figure 15.
Colour map of isophone bands after considering acoustically significant elements (without construction site fencing or a solid gate) for the concreting of foundations in the investigated area, with the position of machines inside the construction site.
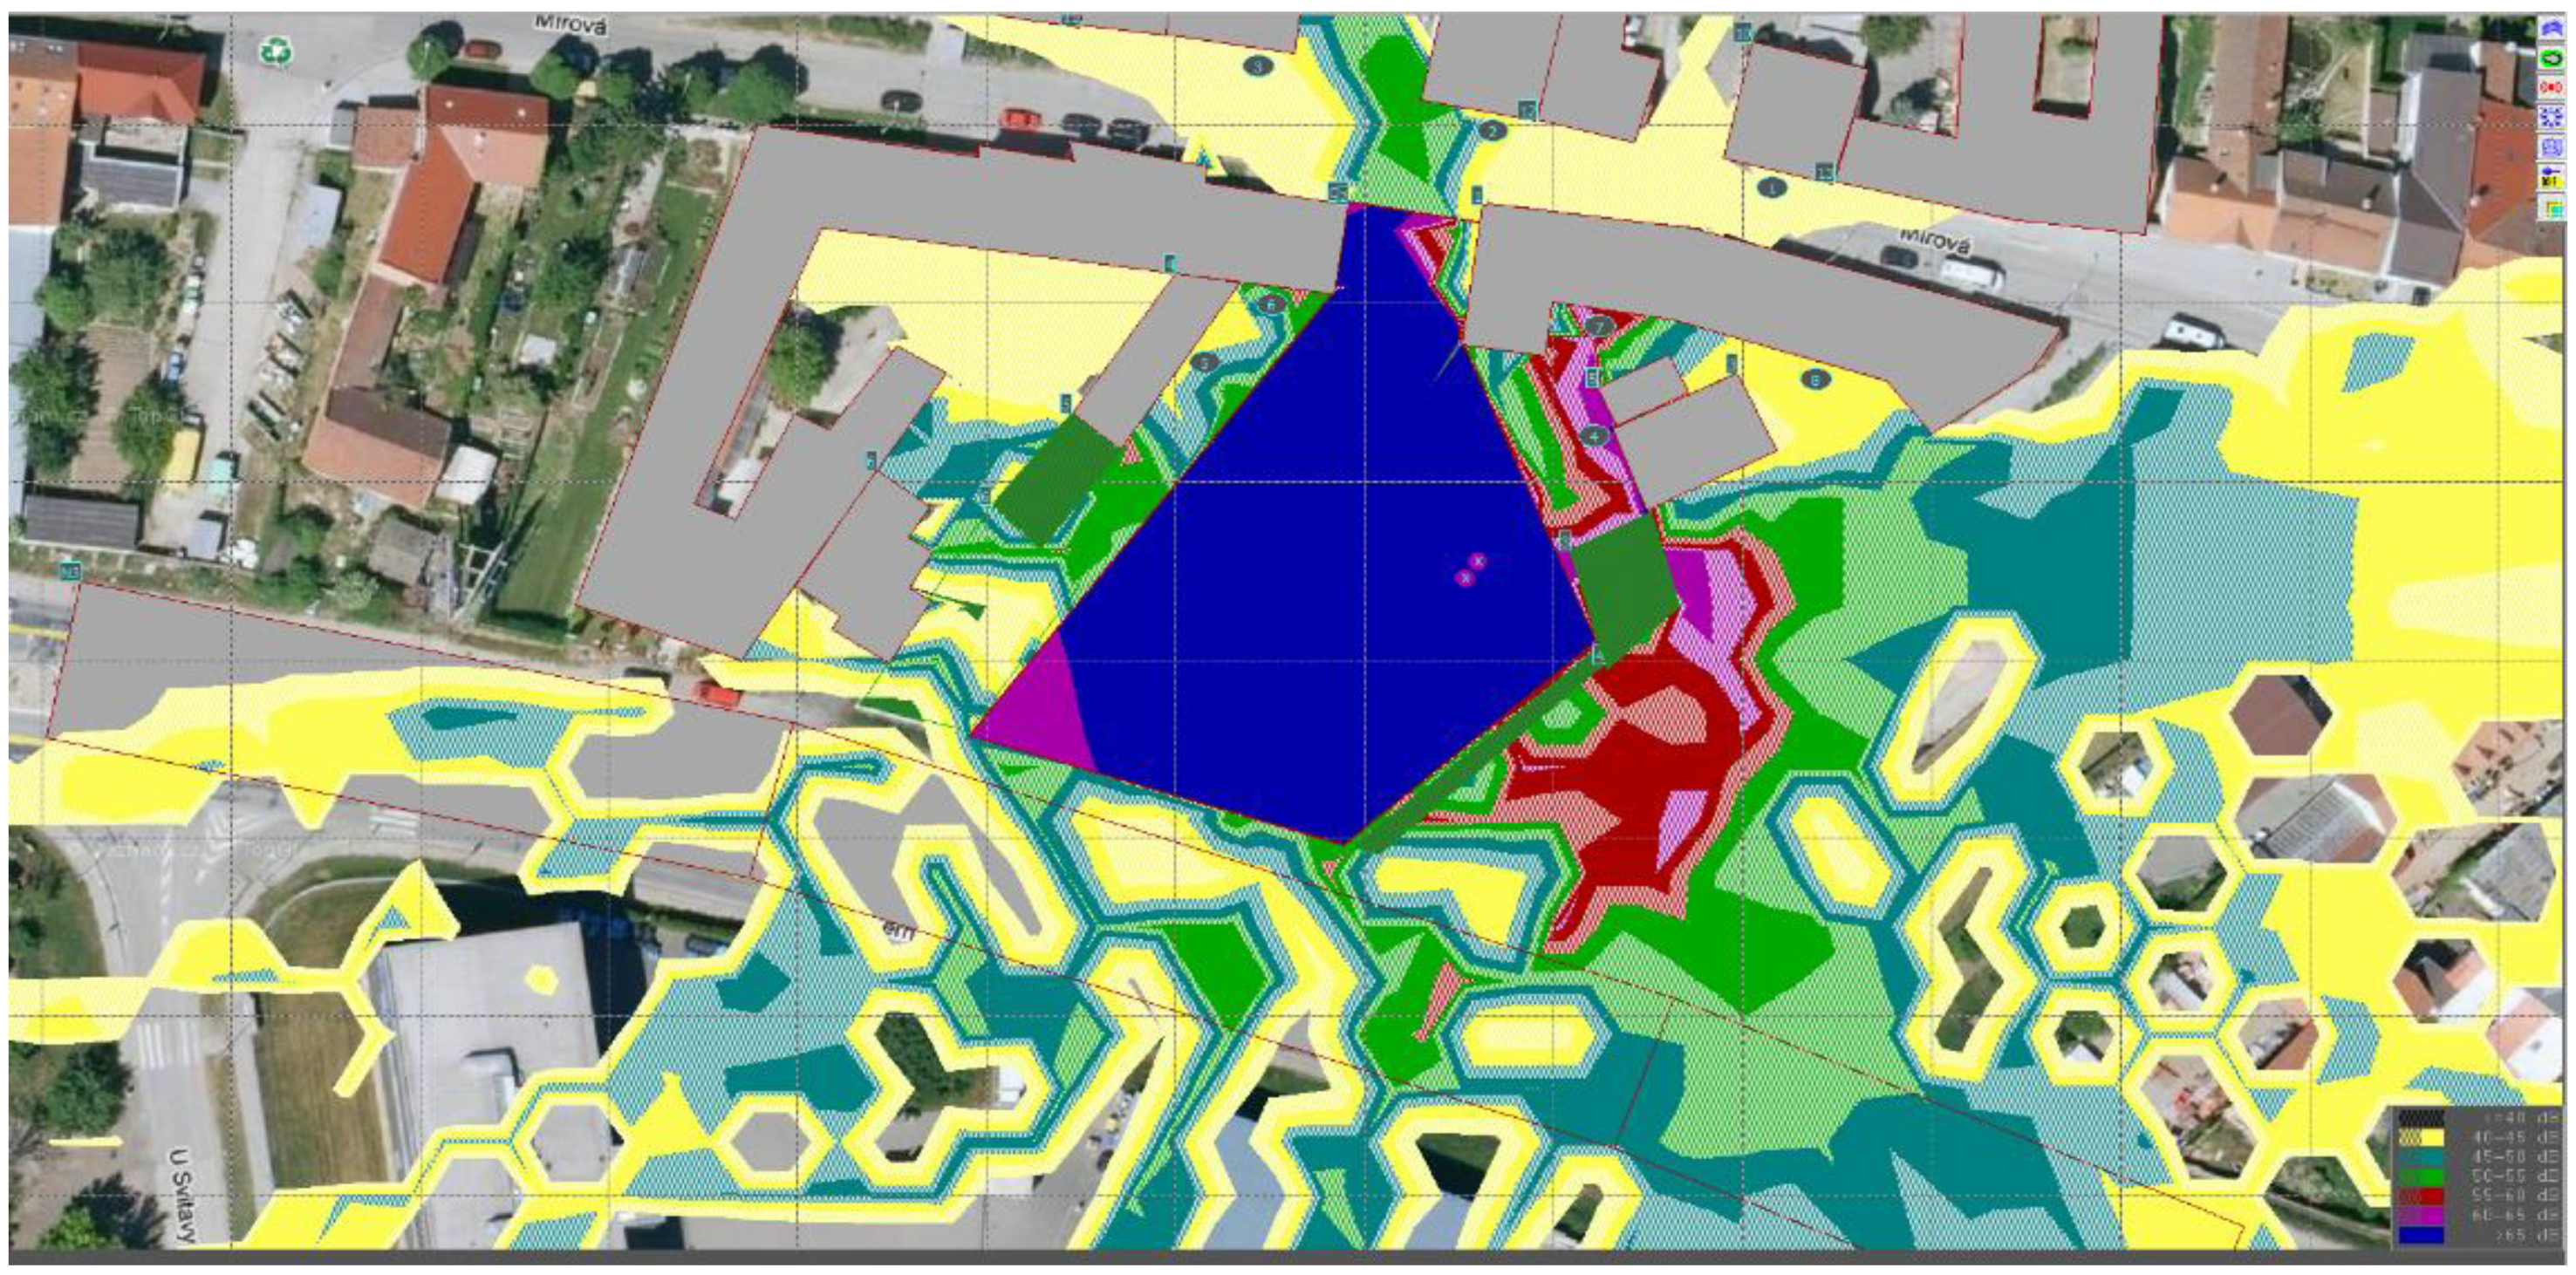
Figure 16.
Colour map of isophone bands after considering acoustically significant elements with construction site fencing and a solid gate for the concreting of foundations in the investigated area, with the position of machines inside the construction site.
Figure 16.
Colour map of isophone bands after considering acoustically significant elements with construction site fencing and a solid gate for the concreting of foundations in the investigated area, with the position of machines inside the construction site.
Figure 17.
Colour map of isophone bands after considering acoustically significant elements with construction site fencing and a solid gate for the concreting of foundations in the investigated area, with the position of machines inside the construction site.
Figure 17.
Colour map of isophone bands after considering acoustically significant elements with construction site fencing and a solid gate for the concreting of foundations in the investigated area, with the position of machines inside the construction site.
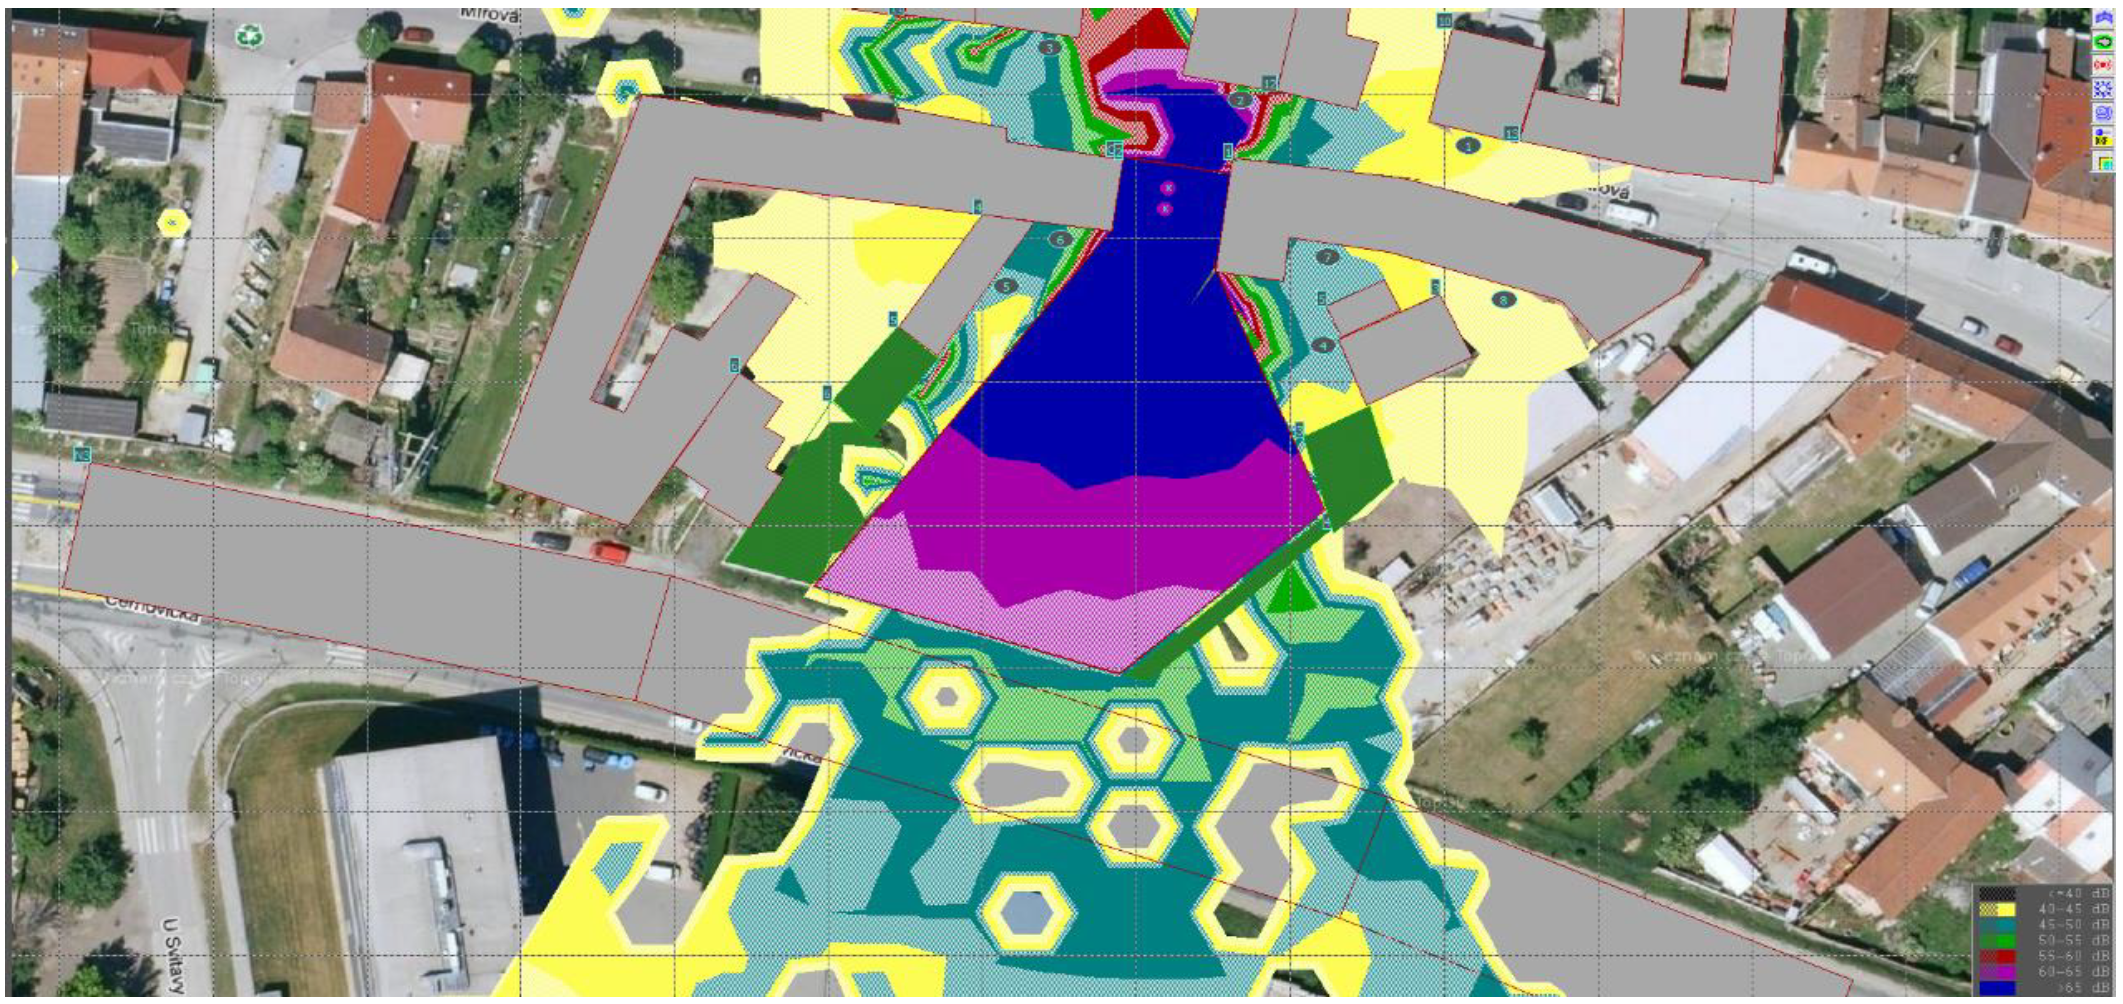
Figure 18.
Colour map of isophone bands after considering acoustically significant elements with construction site fencing and a solid gate for superstructure construction in the investigated area, with the position of machines inside the construction site.
Figure 18.
Colour map of isophone bands after considering acoustically significant elements with construction site fencing and a solid gate for superstructure construction in the investigated area, with the position of machines inside the construction site.
Figure 19.
Colour map of isophone bands after considering acoustically significant elements (without construction site fencing or a solid gate) for the final landscaping in the investigated area, with the deployment of both machines.
Figure 19.
Colour map of isophone bands after considering acoustically significant elements (without construction site fencing or a solid gate) for the final landscaping in the investigated area, with the deployment of both machines.
Figure 20.
Colour map of isophone bands after considering acoustically significant elements (without construction site fencing or a solid gate) for final landscaping in the investigated area, with the deployment of only the machine for the transfer and deposition of soil.
Figure 20.
Colour map of isophone bands after considering acoustically significant elements (without construction site fencing or a solid gate) for final landscaping in the investigated area, with the deployment of only the machine for the transfer and deposition of soil.
Figure 21.
Colour map of isophone bands after considering acoustically significant elements (without construction site fencing or a solid gate) for final landscaping in the area in question, with the deployment of only the compaction machine.
Figure 21.
Colour map of isophone bands after considering acoustically significant elements (without construction site fencing or a solid gate) for final landscaping in the area in question, with the deployment of only the compaction machine.
Figure 22.
Colour map of isophone bands after considering acoustically significant elements for final landscaping with construction site fencing and a solid gate in the investigated area.
Figure 22.
Colour map of isophone bands after considering acoustically significant elements for final landscaping with construction site fencing and a solid gate in the investigated area.
Table 1.
Corrections for the setting of hygiene noise limits in protected outdoor areas for noise from construction activities.
Table 1.
Corrections for the setting of hygiene noise limits in protected outdoor areas for noise from construction activities.
| Evaluated Period [h] | Correction [B] |
|---|
FROM 06:00
TILL 07:00 | +10 |
FROM 07:00
TILL 21:00 | +15 |
FROM 21:00
TILL 22:00 | +10 |
FROM 22:00
TILL 06:00 | +5 |
Table 2.
Expected sources of construction noise.
Table 2.
Expected sources of construction noise.
| | Sources of Noise | Sound Power Level (dB) |
|---|
| 1. | Trucks | 90 |
| 2. | Crawler excavators 12–40 tons | 103 |
| 3. | Skid-steer loaders | 101 |
| 4. | Crawler piling rig | 110 |
| 5. | Excavator with a demolition hammer
Suspended hydraulic hammers, ⌀ of the working tool up to 50 mm | 114 |
| 6. | Mobile crane | 95 |
| 7. | Construction lift | 93 |
| 8. | Vibrating roller | 106 |
| 9. | Concrete mixer truck | 101 |
| 10. | Crawler excavators (mini) 0.9–9 tons | 97 |
| 11. | Pump | 100 |
Table 3.
Expected sources of construction noise.
Table 3.
Expected sources of construction noise.
| | Sources of Noise | Sound Power Level (dB) |
|---|
| 1. | Trucks | 90 |
| 5. | Excavator with a demolition hammer
Suspended hydraulic hammers | 114 |
| 3. | Skid-steer loaders | 101 |
Table 4.
Table of calculated values of measured points for demolition work with the simultaneous deployment of machines.
Table 4.
Table of calculated values of measured points for demolition work with the simultaneous deployment of machines.
| No. | Height | Coordinates | LAeq (dB) |
|---|
| 1 | 1.5 | 203.3 | 132.8 | 52.4 |
| 2 | 1.5 | 173.7 | 139.2 | 60.1 |
| 3 | 1.5 | 148.9 | 146.5 | 54.1 |
| 4 | 1.5 | 184.4 | 105.0 | 81.4 |
| 5 | 1.5 | 143.1 | 113.3 | 78.7 |
| 6 | 1.5 | 150.2 | 119.9 | 78.9 |
| 7 | 1.5 | 185.0 | 117.3 | 78.3 |
| 8 | 1.5 | 207.9 | 111.4 | 53.3 |
Table 5.
Table of calculated values of measured points for demolition work, with the separate deployment of machines.
Table 5.
Table of calculated values of measured points for demolition work, with the separate deployment of machines.
| No. | Height | Coordinates | LAeq (dB) |
|---|
| Industry | Total | Previous |
|---|
| 1 | 1.5 | 203.3 | 132.8 | 52.1 | 52.1 | 52.4 |
| 2 | 1.5 | 173.7 | 139.2 | 53.0 | 53.0 | 60.1 |
| 3 | 1.5 | 148.9 | 146.5 | 53.2 | 53.2 | 54.1 |
| 4 | 1.5 | 184.4 | 105.0 | 81.3 | 81.3 | 81.4 |
| 5 | 1.5 | 143.1 | 113.3 | 78.3 | 78.3 | 78.7 |
| 6 | 1.5 | 150.2 | 119.9 | 78.5 | 78.5 | 78.9 |
| 7 | 1.5 | 185.0 | 117.3 | 78.2 | 78.2 | 78.3 |
| 8 | 1.5 | 207.9 | 111.4 | 52.9 | 52.9 | 53.3 |
Table 6.
Table of calculated values of measured points for demolition work after considering acoustically significant elements, including construction site fencing and a solid gate for the entrance to the construction site in the investigated area.
Table 6.
Table of calculated values of measured points for demolition work after considering acoustically significant elements, including construction site fencing and a solid gate for the entrance to the construction site in the investigated area.
| No. | Height | Coordinates | LAeq (dB) |
|---|
| Industry | Total | Previous |
|---|
| 1 | 1.5 | 203.3 | 132.8 | 52.1 | 52.1 | 52.1 |
| 2 | 1.5 | 173.7 | 139.2 | 53.0 | 53.0 | 53.0 |
| 3 | 1.5 | 148.9 | 146.5 | 53.2 | 53.2 | 53.2 |
| 4 | 1.5 | 184.4 | 105.0 | 58.4 | 58.4 | 81.3 |
| 5 | 1.5 | 143.1 | 113.3 | 68.5 | 68.5 | 78.3 |
| 6 | 1.5 | 150.2 | 119.9 | 55.0 | 55.0 | 78.5 |
| 7 | 1.5 | 185.0 | 117.3 | 56.2 | 56.2 | 78.2 |
| 8 | 1.5 | 207.9 | 111.4 | 52.9 | 52.9 | 52.9 |
Table 7.
Expected sources of construction noise.
Table 7.
Expected sources of construction noise.
| | Sources of Noise | Sound Power Level (dB) |
|---|
| 10. | Crawler excavators (mini) 0.9–9 tons | 97 |
| 3. | Skid-steer loaders | 101 |
| 1. | Trucks | 90 |
Table 8.
Table of calculated values of measured points for earthworks during the execution of connections in the investigated area, with the simultaneous deployment of machines.
Table 8.
Table of calculated values of measured points for earthworks during the execution of connections in the investigated area, with the simultaneous deployment of machines.
| No. | Height | Coordinates | LAeq (dB) |
|---|
| 1 | 1.5 | 203.3 | 132.8 | 40.4 |
| 2 | 1.5 | 173.7 | 139.2 | 68.5 |
| 3 | 1.5 | 148.9 | 146.5 | 61.8 |
| 4 | 1.5 | 184.4 | 105.0 | 69.5 |
| 5 | 1.5 | 143.1 | 113.3 | 69.6 |
| 6 | 1.5 | 150.2 | 119.9 | 72.2 |
| 7 | 1.5 | 185.0 | 117.3 | 46.5 |
| 8 | 1.5 | 207.9 | 111.4 | 49.6 |
Table 9.
Table of calculated values of measured points with the simultaneous deployment of machines shown as previous values; after the separation of excavation work from material removal, the values shown are only for excavations with an excavator.
Table 9.
Table of calculated values of measured points with the simultaneous deployment of machines shown as previous values; after the separation of excavation work from material removal, the values shown are only for excavations with an excavator.
| No. | Height | Coordinates | LAeq (dB) |
|---|
| Industry | Total | Previous |
|---|
| 1 | 1.5 | 203.3 | 132.8 | 38.6 | 38.6 | 40.4 |
| 2 | 1.5 | 173.7 | 139.2 | 67.0 | 67.0 | 68.5 |
| 3 | 1.5 | 148.9 | 146.5 | 61.0 | 61.0 | 61.8 |
| 4 | 1.5 | 184.4 | 105.0 | 68.1 | 68.1 | 69.5 |
| 5 | 1.5 | 143.1 | 113.3 | 67.1 | 67.1 | 69.6 |
| 6 | 1.5 | 150.2 | 119.9 | 70.1 | 70.1 | 72.2 |
| 7 | 1.5 | 185.0 | 117.3 | 44.9 | 44.9 | 46.5 |
| 8 | 1.5 | 207.9 | 111.4 | 48.1 | 48.1 | 49.6 |
Table 10.
Expected sources of construction noise.
Table 10.
Expected sources of construction noise.
| | Sources of Noise | Sound Power Level (dB) |
|---|
| 1. | Trucks | 90 |
| 2. | Crawler excavators 12–40 tons | 103 |
| 3. | Skid-steer loaders | 101 |
Table 11.
Table of points from the calculation of measured points for earthworks in the investigated area.
Table 11.
Table of points from the calculation of measured points for earthworks in the investigated area.
| No. | Height | Coordinates | LAeq (dB) |
|---|
| Industry | Total |
|---|
| 1 | 1.5 | 203.3 | 132.8 | 40.9 | 40.9 |
| 2 | 1.5 | 173.7 | 139.2 | 57.6 | 57.6 |
| 3 | 1.5 | 148.9 | 146.5 | 42.2 | 42.2 |
| 4 | 1.5 | 184.4 | 105.0 | 68.0 | 68.0 |
| 5 | 1.5 | 143.1 | 113.3 | 67.4 | 67.4 |
| 6 | 1.5 | 150.2 | 119.9 | 66.6 | 66.6 |
| 7 | 1.5 | 185.0 | 117.3 | 65.1 | 65.1 |
| 8 | 1.5 | 207.9 | 111.4 | 41.4 | 41.4 |
Table 12.
Table of calculated values of measured points for earthworks with construction site fencing and a solid gate in the investigated area.
Table 12.
Table of calculated values of measured points for earthworks with construction site fencing and a solid gate in the investigated area.
| No. | Height | Coordinates | LAeq (dB) |
|---|
| Industry | Total | Previous |
|---|
| 1 | 1.5 | 203.3 | 132.8 | 40.9 | 40.9 | 40.9 |
| 2 | 1.5 | 173.7 | 139.2 | 42.0 | 42.0 | 57.6 |
| 3 | 1.5 | 148.9 | 146.5 | 42.2 | 42.2 | 42.2 |
| 4 | 1.5 | 184.4 | 105.0 | 44.7 | 44.7 | 68.0 |
| 5 | 1.5 | 143.1 | 113.3 | 44.2 | 44.2 | 67.4 |
| 6 | 1.5 | 150.2 | 119.9 | 44.3 | 44.3 | 66.6 |
| 7 | 1.5 | 185.0 | 117.3 | 42.5 | 42.5 | 65.1 |
| 8 | 1.5 | 207.9 | 111.4 | 41.5 | 41.5 | 41.4 |
Table 13.
Expected sources of construction noise.
Table 13.
Expected sources of construction noise.
| | Sources of Noise | Sound Power Level (dB) |
|---|
| 1. | Trucks | 90 |
| 3. | Skid-steer loaders | 101 |
| 4. | Crawler piling rig | 110 |
Table 14.
Table of points from the calculation of measured points for earthworks without construction site fencing or a solid gate for pile-driving work in the investigated area.
Table 14.
Table of points from the calculation of measured points for earthworks without construction site fencing or a solid gate for pile-driving work in the investigated area.
| No. | Height | Coordinates | LAeq (dB) |
|---|
| Industry | Total | Previous |
|---|
| 1 | 1.5 | 203.3 | 132.8 | 48.6 | 48.6 | 48.9 |
| 2 | 1.5 | 173.7 | 139.2 | 71.8 | 71.8 | 62.8 |
| 3 | 1.5 | 148.9 | 146.5 | 50.2 | 50.2 | 50.2 |
| 4 | 1.5 | 184.4 | 105.0 | 77.2 | 77.2 | 66.7 |
| 5 | 1.5 | 143.1 | 113.3 | 77.6 | 77.6 | 56.6 |
| 6 | 1.5 | 150.2 | 119.9 | 77.7 | 77.7 | 54.6 |
| 7 | 1.5 | 185.0 | 117.3 | 73.2 | 73.2 | 58.2 |
| 8 | 1.5 | 207.9 | 111.4 | 49.1 | 49.1 | 48.8 |
Table 15.
Table of points from the calculation of measured points for earthworks with construction site fencing and a solid gate in the investigated area.
Table 15.
Table of points from the calculation of measured points for earthworks with construction site fencing and a solid gate in the investigated area.
| No. | Height | Coordinates | LAeq (dB) |
|---|
| Industry | Total |
|---|
| 1 | 1.5 | 203.3 | 132.8 | 48.9 | 48.9 |
| 2 | 1.5 | 173.7 | 139.2 | 62.8 | 62.8 |
| 3 | 1.5 | 148.9 | 146.5 | 50.2 | 50.2 |
| 4 | 1.5 | 184.4 | 105.0 | 66.7 | 66.7 |
| 5 | 1.5 | 143.1 | 113.3 | 56.6 | 56.6 |
| 6 | 1.5 | 150.2 | 119.9 | 54.6 | 54.6 |
| 7 | 1.5 | 185.0 | 117.3 | 58.2 | 58.2 |
| 8 | 1.5 | 207.9 | 111.4 | 48.8 | 48.8 |
Table 16.
Table of points from the calculation of measured points for pile-driving work without construction site fencing or a solid gate for pile-driving work in the investigated area, with the positions of machines.
Table 16.
Table of points from the calculation of measured points for pile-driving work without construction site fencing or a solid gate for pile-driving work in the investigated area, with the positions of machines.
| No. | Height | Coordinates | LAeq (dB) |
|---|
| Industry | Total | Previous |
|---|
| 1 | 1.5 | 203.3 | 132.8 | 45.4 | 54.4 | 48.6 |
| 2 | 1.5 | 173.7 | 139.2 | 67.3 | 67.3 | 71.8 |
| 3 | 1.5 | 148.9 | 146.5 | 47.8 | 47.8 | 50.2 |
| 4 | 1.5 | 184.4 | 105.0 | 69.9 | 69.9 | 77.2 |
| 5 | 1.5 | 143.1 | 113.3 | 73.0 | 73.0 | 77.6 |
| 6 | 1.5 | 150.2 | 119.9 | 72.4 | 72.4 | 77.7 |
| 7 | 1.5 | 185.0 | 117.3 | 67.1 | 67.1 | 73.2 |
| 8 | 1.5 | 207.9 | 111.4 | 45.7 | 45.7 | 49.1 |
Table 17.
Expected sources of construction noise.
Table 17.
Expected sources of construction noise.
| | Sources of Noise | Sound Power Level (dB) |
|---|
| 9. | Concrete mixer truck | 101 |
| 11. | Pump | 100 |
Table 18.
Table of points from the calculation of measured points for pile-driving work without construction site fencing or a solid gate in the investigated area, with the position of machines inside the construction site.
Table 18.
Table of points from the calculation of measured points for pile-driving work without construction site fencing or a solid gate in the investigated area, with the position of machines inside the construction site.
| No. | Height | Coordinates | LAeq (dB) |
|---|
| Industry | Total |
|---|
| 1 | 1.5 | 203.3 | 132.8 | 41.5 | 41.5 |
| 2 | 1.5 | 173.7 | 139.2 | 42.1 | 42.1 |
| 3 | 1.5 | 148.9 | 146.5 | 42.3 | 71.3 |
| 4 | 1.5 | 184.4 | 105.0 | 71.3 | 66.9 |
| 5 | 1.5 | 143.1 | 113.3 | 66.9 | 66.9 |
| 6 | 1.5 | 150.2 | 119.9 | 66.8 | 66.8 |
| 7 | 1.5 | 185.0 | 117.3 | 67.3 | 67.3 |
| 8 | 1.5 | 207.9 | 111.4 | 43.0 | 43.0 |
Table 19.
Table of points from the calculation of measured points for the concreting of foundations with construction site fencing and a solid gate in the investigated area, with the position of machines inside the construction site.
Table 19.
Table of points from the calculation of measured points for the concreting of foundations with construction site fencing and a solid gate in the investigated area, with the position of machines inside the construction site.
| No. | Height | Coordinates | LAeq (dB) |
|---|
| Industry | Total | Previous |
|---|
| 1 | 1.5 | 203.3 | 132.8 | 41.5 | 41.5 | 41.5 |
| 2 | 1.5 | 173.7 | 139.2 | 42.1 | 42.1 | 42.1 |
| 3 | 1.5 | 148.9 | 146.5 | 42.3 | 42.3 | 42.3 |
| 4 | 1.5 | 184.4 | 105.0 | 61.5 | 61.5 | 71.3 |
| 5 | 1.5 | 143.1 | 113.3 | 56.7 | 56.7 | 66.9 |
| 6 | 1.5 | 150.2 | 119.9 | 56.6 | 56.6 | 66.8 |
| 7 | 1.5 | 185.0 | 117.3 | 59.2 | 59.2 | 67.3 |
| 8 | 1.5 | 207.9 | 111.4 | 43.1 | 43.1 | 43.0 |
Table 20.
Table of points from the calculation of measured points for the concreting of foundations with construction site fencing and a solid gate in the investigated area, with the position of machines inside the construction site.
Table 20.
Table of points from the calculation of measured points for the concreting of foundations with construction site fencing and a solid gate in the investigated area, with the position of machines inside the construction site.
| No. | Height | Coordinates | LAeq (dB) |
|---|
| Industry | Total | Previous |
|---|
| 1 | 1.5 | 203.3 | 132.8 | 43.4 | 43.4 | 41.5 |
| 2 | 1.5 | 173.7 | 139.2 | 65.0 | 65.0 | 42.1 |
| 3 | 1.5 | 148.9 | 146.5 | 47.5 | 47.5 | 42.3 |
| 4 | 1.5 | 184.4 | 105.0 | 46.2 | 46.2 | 61.5 |
| 5 | 1.5 | 143.1 | 113.3 | 61.8 | 61.8 | 56.7 |
| 6 | 1.5 | 150.2 | 119.9 | 49.9 | 49.9 | 56.6 |
| 7 | 1.5 | 185.0 | 117.3 | 46.7 | 46.7 | 59.2 |
| 8 | 1.5 | 207.9 | 111.4 | 42.1 | 42.1 | 43.1 |
Table 21.
Expected sources of construction noise.
Table 21.
Expected sources of construction noise.
| | Sources of Noise | Sound Power Level (dB) |
|---|
| 6. | Mobile crane | 95 |
| 7. | Construction lift | 93 |
Table 22.
Table of points from the calculation of measured points for superstructure construction with construction site fencing and a solid gate in the investigated area, with the positions of machines inside the construction site.
Table 22.
Table of points from the calculation of measured points for superstructure construction with construction site fencing and a solid gate in the investigated area, with the positions of machines inside the construction site.
| No. | Height | Coordinates | LAeq (dB) |
|---|
| Industry | Total |
|---|
| 1 | 1.5 | 203.3 | 132.8 | 40.8 | 40.8 |
| 2 | 1.5 | 173.7 | 139.2 | 53.8 | 53.8 |
| 3 | 1.5 | 148.9 | 146.5 | 44.0 | 44.0 |
| 4 | 1.5 | 184.4 | 105.0 | 58.5 | 58.5 |
| 5 | 1.5 | 143.1 | 113.3 | 64.3 | 64.3 |
| 6 | 1.5 | 150.2 | 119.9 | 52.0 | 52.0 |
| 7 | 1.5 | 185.0 | 117.3 | 45.0 | 45.0 |
| 8 | 1.5 | 207.9 | 111.4 | 41.7 | 41.7 |
Table 23.
Expected sources of construction noise.
Table 23.
Expected sources of construction noise.
| | Sources of Noise | Sound Power Level (dB) |
|---|
| 8. | Vibrating roller | 106 |
| 10. | Crawler excavators (mini) 0.9–9 tons | 97 |
Table 24.
Table of points from the calculation of measured points for final landscaping without construction site fencing or a solid gate for the investigated area, with the deployment of both machines.
Table 24.
Table of points from the calculation of measured points for final landscaping without construction site fencing or a solid gate for the investigated area, with the deployment of both machines.
| No. | Height | Coordinates | LAeq (dB) |
|---|
| Industry | Total | Previous |
|---|
| 1 | 1.5 | 203.3 | 132.8 | 40.7 | 40.7 | 40.8 |
| 2 | 1.5 | 173.7 | 139.2 | 58.1 | 58.1 | 65.6 |
| 3 | 1.5 | 148.9 | 146.5 | 44.0 | 44.0 | 57.9 |
| 4 | 1.5 | 184.4 | 105.0 | 70.4 | 70.4 | 68.9 |
| 5 | 1.5 | 143.1 | 113.3 | 67.2 | 67.2 | 74.1 |
| 6 | 1.5 | 150.2 | 119.9 | 67.4 | 67.4 | 74.2 |
| 7 | 1.5 | 185.0 | 117.3 | 68.3 | 68.3 | 45.0 |
| 8 | 1.5 | 207.9 | 111.4 | 43.1 | 43.1 | 41.7 |
Table 25.
Table of points from the calculation of measured points for final landscaping with construction site fencing and a solid gate in the investigated area.
Table 25.
Table of points from the calculation of measured points for final landscaping with construction site fencing and a solid gate in the investigated area.
| No. | Height | Coordinates | LAeq (dB) |
|---|
| Industry | Total | Previous |
|---|
| 1 | 1.5 | 203.3 | 132.8 | 42.9 | 42.9 | 40.7 |
| 2 | 1.5 | 173.7 | 139.2 | 43.7 | 43.7 | 58.1 |
| 3 | 1.5 | 148.9 | 146.5 | 44.0 | 44.0 | 44.0 |
| 4 | 1.5 | 184.4 | 105.0 | 66.8 | 66.8 | 70.4 |
| 5 | 1.5 | 143.1 | 113.3 | 56.7 | 56.7 | 67.2 |
| 6 | 1.5 | 150.2 | 119.9 | 44.1 | 44.1 | 67.4 |
| 7 | 1.5 | 185.0 | 117.3 | 44.2 | 44.2 | 68.3 |
| 8 | 1.5 | 207.9 | 111.4 | 37.1 | 37.1 | 43.1 |
Table 26.
Working time with the machine during the work shift.
Table 26.
Working time with the machine during the work shift.
| Calculation Number | Duration of Work during the Day (Minutes) |
|---|
| | Required | Without Active Measures | With Active Measures |
|---|
| 1 | 480 100% | 60 12.50% | 420 87.50% |
| 2 | 480 100% | 180 37.50% | 180 37.50% |
| 3 | 480 100% | 390 81.25% | 480 100.00% |
| 4 | 480 100% | 60 12.50% | 450 93.75% |
| 5 | 480 100% | 210 43.75% | 480 100.00% |
| 6 | 480 100% | 480 100.00% | 480 100.00% |
| 7 | 480 100% | 110 22.92% | 240 50.00% |
| TOTAL | 100% | 44.35% | 81.25% |


