Abstract
In the present study, the thermodynamic parameters of Polylactic Acid (PLA) under conditions of thermal degradation were determined. The PLA material, previously sampled and characterized, was analyzed by dynamic thermogravimetry (TG) at heating rates of 5, 10 and 15 °C min−1 with a nitrogen flow of 20 mL min−1 from a temperature of 25 to 900 °C. The data were treated using isoconversional kinetic models to obtain the activation energy and the pre-exponential factor of each model. To fit the DTG curves, the Arrhenius equation was used applying the Contraction Sphere reaction model: two-dimensional phase limit reaction (R2). The thermodynamic parameters such as enthalpy, Gibbs free energy and entropy were determined from the kinetic parameters of suitable models for each heating rate after statistical validation and comparison with other studies. The results showed that as the heating rate increases, the degradation temperature also increases, while the activation energy, enthalpy and pre-exponential factor decrease. According to the value of ∆G (171.65 kJ mol−1), PLA has a significant potential to be used as a raw material to produce bioenergy/biofuels by pyrolysis.
1. Introduction
According to the European Association of Plastic Materials Producers [1], the production of plastics in the world reached 359 million tons in 2018. One of the reasons for this high use is due to their great versatility, which makes them the preferred option to be used in a bewildering range of consumer goods. With the growth of the human population and development activities, the consumption of these materials is also increasing at an accelerated rate, which has led to them be considered a latent environmental problem, being one of the largest contributors to urban solid waste worldwide [2].
The production of polymers from renewable resources as a substitute of polymers of petrochemical origin has increased significantly in recent years [3]. One of the most popular biodegradable polymers is the Polylactic Acid (PLA), represented by the chemical formula (C3H4O2)n. PLA can be produced from renewable non-toxic raw materials. In addition, PLA has aroused a large amount of interest not only due to being a renewable material but because of its biocompatibility, biodegradability, mechanical properties, thermoplastic processability and low environmental impact, which make it a versatile option for use in biomedicine and tissue engineering as an alternative to conventional polymers [4]. In recent years, additive construction or 3D printing has increased for the manufacture of many technological components. This construction procedure has and will have a great industrial impact. There are many 3D printing procedures and, among them, the best known is called Fused Deposition Modeling (FDM), in which a thermoplastic such as PLA is used in both amorphous and crystalline states, due to its optimal behavior in the process of impression. In addition, PLA is generally used for the manufacture of automated analytical devices such as lab-on-a-chip platforms due to the proven potential of this renewable and biodegradable aliphatic polyester (PLA) to replace petrochemical-based polymers in industrial applications.
Currently, the study of PLA is focusing on its processing, since its main problem is thermal stability, which has been reported as a complex issue when subjected to different recycling techniques such as pyrolysis [5]. In this sense, a promising solution to describe its behavior, as well as to determine the thermal properties of this material, is through thermogravimetry (TG). TG is a widely used technique to study different polymeric materials and to determine the reaction order, activation energy, frequency factor and the rate of thermal decomposition that a given material undergoes [6,7]. PLA presents a different activation energy with respect to conventional thermoplastics due to its particular structure that determines its properties, as seen in several studies using isoconversional kinetic models for non-isothermal TG data [8,9,10,11]. This difference depends on several factors: (1) polymer preparation method; (2) molecular weight of the polymer; (3) operational conditions such as sample weight, particle size, heating rate, mass flow rate, type of gas used and sample-holder thermal contact; (4) mathematical treatment of TG data according to different methods (integral, differential and special) [12]. The data of TG analyses are also used to estimate thermodynamic parameters such as enthalpy, Gibbs free energy and entropy from kinetic models, which are of importance for the analysis of mixtures and the energy required for the thermal degradation process and the waste treatment of this plastics type by chemical recycling, which help to decrease its environmental impact [13]. Thus, according to the information summarized so far, the objective of the present work is to obtain and examine the changes in the thermodynamic parameters of PLA under conditions of thermal degradation by applying a non-isothermal TG method at three different heating rates. In addition, this study covers a kinetic analysis of the thermal degradation process of PLA.
2. Methodology
2.1. Determination of Properties and Equipment
The PLA samples to be characterized come from the remains of a laser printing company and were collected during a common production day. These samples are in the form of pellets resulting from the residues obtained after the 3D printing process as uncured resin after cleaning with isopropyl alcohol, as well as the residues obtained after the curing process by means of visible ultraviolet radiation. The properties of this material were obtained as follows. The density of the PLA was determined by volume shift and the heat capacity by the mixing method using an adiabatic calorimeter (Calorimeter PHYWE 04401.00). The main components of the PLA structure were identified by FT-IR spectroscopy (Perkin–Elmer Frontier spectrometer) in the wave number comprised between 4000 and 600 cm−1 with a resolution of 4 cm−1. To determine the kinetics of the reaction, thermogravimetric analysis (TGA) was performed using the Mettler Toledo STAR System at three heating rates, 5, 10 and 15 °C min−1, with an inert nitrogen atmosphere at a flow of 20 mL min−1 and a temperature program from 25 to 900 °C. The loss of mass in relation to the reaction time was studied using TGA curves and their first derivative (DTG).
2.2. TGA Data Processing
In the thermal degradation of polymers, the conversion must be determined from the weight loss rate, showing the plastic’s behavior when heated [14]:
where α is the conversion, wi, w and wf are the initial mass, instantaneous mass and final mass of the sample recorded by the TGA instrument. The reaction rate is influenced by 2 variables, the temperature (T) and the degree of conversion (α) [10,15]. The combination of the generalized form of the kinetic equation and the Arrhenius’s law results in kinetic models that follow this form:
where E is the apparent activation energy (J/mol), A is apparent pre-exponential factor (1/s), β is the linear heating rate, R is ideal gas constant and 8.314 (J/mol K) and T are the absolute temperature (K). The mathematical manipulation of the last equation leads to the determination of the kinetic triplets (E, A and f (α)) by fitting the TGA degradation data.
2.2.1. Isoconversional Kinetic Models
Isoconversional methods are a powerful and very reliable tool for calculating kinetic parameters. The kinetic models detailed below were based on previous studies of thermal degradation for virgin PLA and, in certain cases, processed PLA [10,12,16].
Friedman Method (FR)
FR is a differential kinetic model presented by Friedman [17], who proposes (Equation (3)) the use of the logarithm of the conversion rate dα/dT as a reciprocal function of temperature, applied directly to the previous Equation (2):
Kissinger-Akahira-Sunose Method (KAS)
KAS is an integral kinetic model that results from an integral fit of Equation (2). The method in question is based on the Coats–Redfern approximation [18], and its standard kinetic equation can be written as follows:
Flynn-Wall-Ozawa (FWO) Method
The FWO method is an integral kinetic model derived from the isoconversional method of Flynn and Wall [19] and Ozawa [20]. This method considers the general kinetic equation and uses the Doyle approximation [21], resulting in:
2.2.2. Reaction Model
The reaction model f(α) is the parameter that determines the reaction mechanism most consistent with the results of thermal degradation. The geometric models of solid-state reactions are based on the nucleation and growth processes of the nuclei of the product by advancing the interface. Some studies [10,16] suggest the use of the contraction area model (R2) for PLA, taking into account two modelling considerations: (1) the Solid particle has a cylindrical shape and (2) the geometric contraction modelling assumes that nucleation occurs rapidly at the surface of the solid and the reaction is controlled by the resulting reaction interface progressing towards the center. Taking into account these considerations for PLA, we proceeded to work with this reaction model.
To determine the kinetic parameters of the material, we worked with a range of degrees of advance α in such a way that the linear fit is adequate to perform the analysis of the TGA data.
The linear area of α was determined by plotting dα/dt or β dα/dT as a function of α. If you want to obtain a good linear fit, it is recommended to work with a range of α lower than the maximum point (this range generally ranges from 0.4–0.6), because, in this range, the slope of the curve tends to be constant [22]. Notice that this range coincides with the beginning of the degradation reaction of several thermoplastics, and therefore it is very useful to determine the kinetic parameters of the material [23].
2.2.3. Statistical Adjustment and Validation of Kinetic Models
The adjustment of the experimental values of each model was carried out using the least squares method. The manipulated variables were the pre-exponential factor (A) and the activation energy (E), taking into account as a condition that the degradation temperature must be the same both in the experimental data and in the proposed model.
2.3. Thermodynamic Properties
The Gibbs free energy, the enthalpy and the entropy changes can be estimated by applying the proper equations. The thermodynamic parameters of the heated material determine the feasibility and spontaneity of the thermal degradation process.
2.3.1. Enthalpy
It is the thermodynamic property that represents the total heat content of a system at constant pressure when the only work done is pressure–volume. For pyrolysis, enthalpy means the total energy consumed by the material for its conversion into various products:
2.3.2. Gibbs Free Energy
Gibbs free energy is also known as free enthalpy, and it represents the total increase in energy of the system for the formation of the activated complex (radical formation from the PLA polymer) and is obtained from the following equation:
where ΔG is the Gibbs free energy and KB and h are the Boltzmann and the Plank constants, respectively.
2.3.3. Entropy
The entropy indicates the degree of disorder of the material. A negative entropy variation shows that the degree of disorder of the products produced by the dissociations of the bonds is lower than that of the initial reactants. In addition, a very low entropy value indicates that only certain physical and chemical changes occur in the material [24]. Therefore, if the enthalpy is low, the entropy must have a high negative value to favor the reaction. This indicates that the evolution of the reaction will not only depend on energy (enthalpy), since it will also depend on the molecular configuration that is reached (changes in entropy).
3. Results and Discussion
3.1. Characterization of the PLA Sample
3.1.1. Density and Specific Heat
The average density of the experiments was 1.2545 g mL−1. This value is in the range established by Farah et al. [25], who point out that the density of PLA ranges between 1.24–1.26 g mL−1. The PLA experimental average specific heat value at 100 °C was 1936 J kg−1 °C−1, very close to that cited in the literature, and it was 1955 J kg−1 °C−1 at the same working temperature [25].
3.1.2. Mechanical Properties
PLA (Biopolymer Ingeo 4032D) used in this research is a product of NatureWorks LLC (Minnetonka, MN, USA) [26], which is a thermoplastic resin derived from renewable resources that presents a racemic mixture with L/D ratios from 24:1 to 32:1 (<5% D-PLA) with a melting tempera-ture (Tm) of 210 °C and a glass transition temperature (Tg) of 57 °C. In addition, its mechanical properties include a tensile modulus of 500 kpsi and a tensile elongation 6.0%, which have been determined using the ASTM D882 method.
3.1.3. FT-IR Analysis
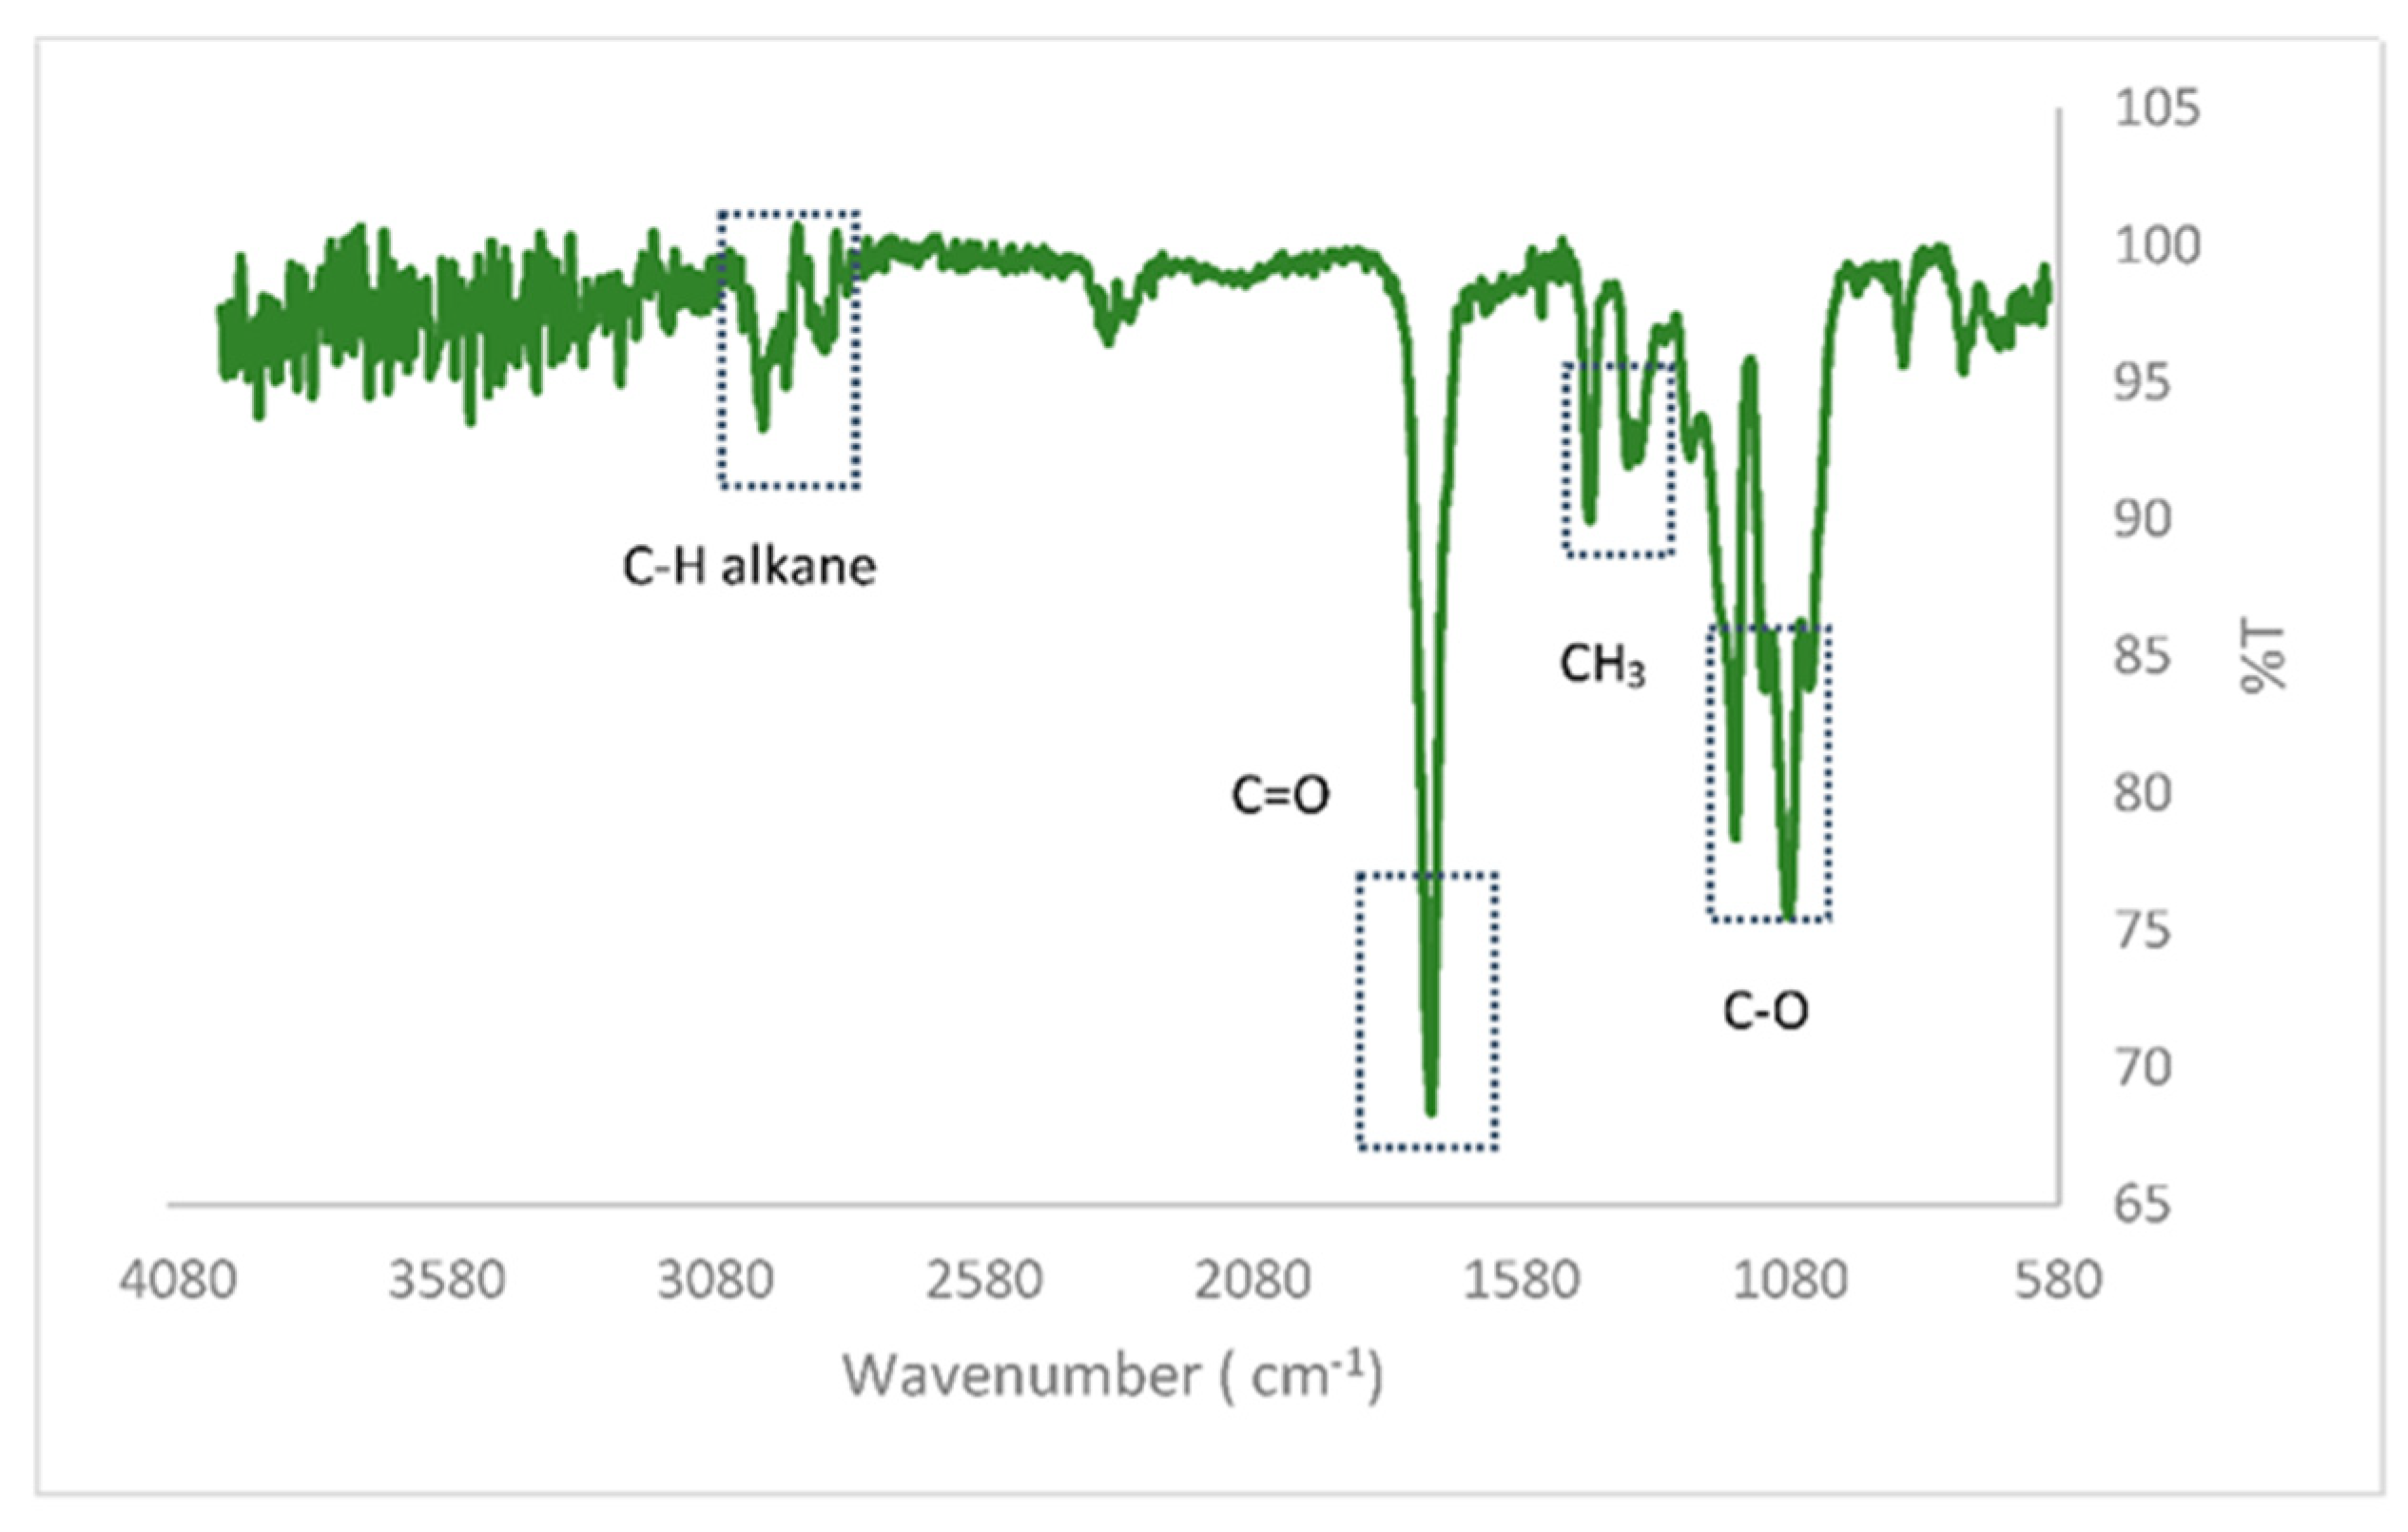
On the other hand, an FTIR analysis has been carried out for the chemical characterization of the PLA commonly used in 3D printing. PLA is composed of three main peaks: C–H, C=O and C-O. Spectra between 1050 and 1205 cm−1 are attributed to asymmetric and symmetric stretching vibrations of the C–O carboxylic acid group. The stretching vibrations of the carbonyl C=O are observed at 1755 cm−1, which presents a significant similarity to that obtained by Choksi and Desai [27]. The peaks at 2992 cm−1 and 1448 cm−1 correspond to the stretching vibrations of the C-H alkane and the C-H bending alkane of the methyl group, respectively. When comparing the bands that appear in this spectrum with the FTIR corresponding to PLA in the literature [28], it was found that this analyzed polymer is similar to L,D-PLA as shown in Figure 1.
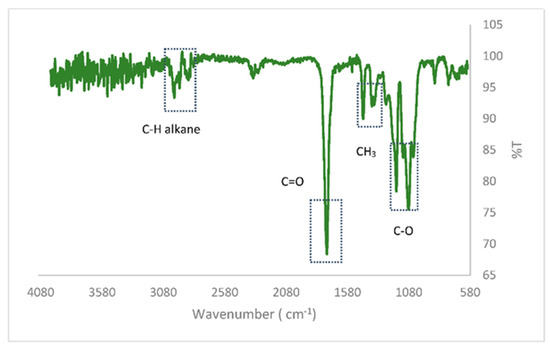
Figure 1.
Thermogravimetric Analysis of the PLA sample.
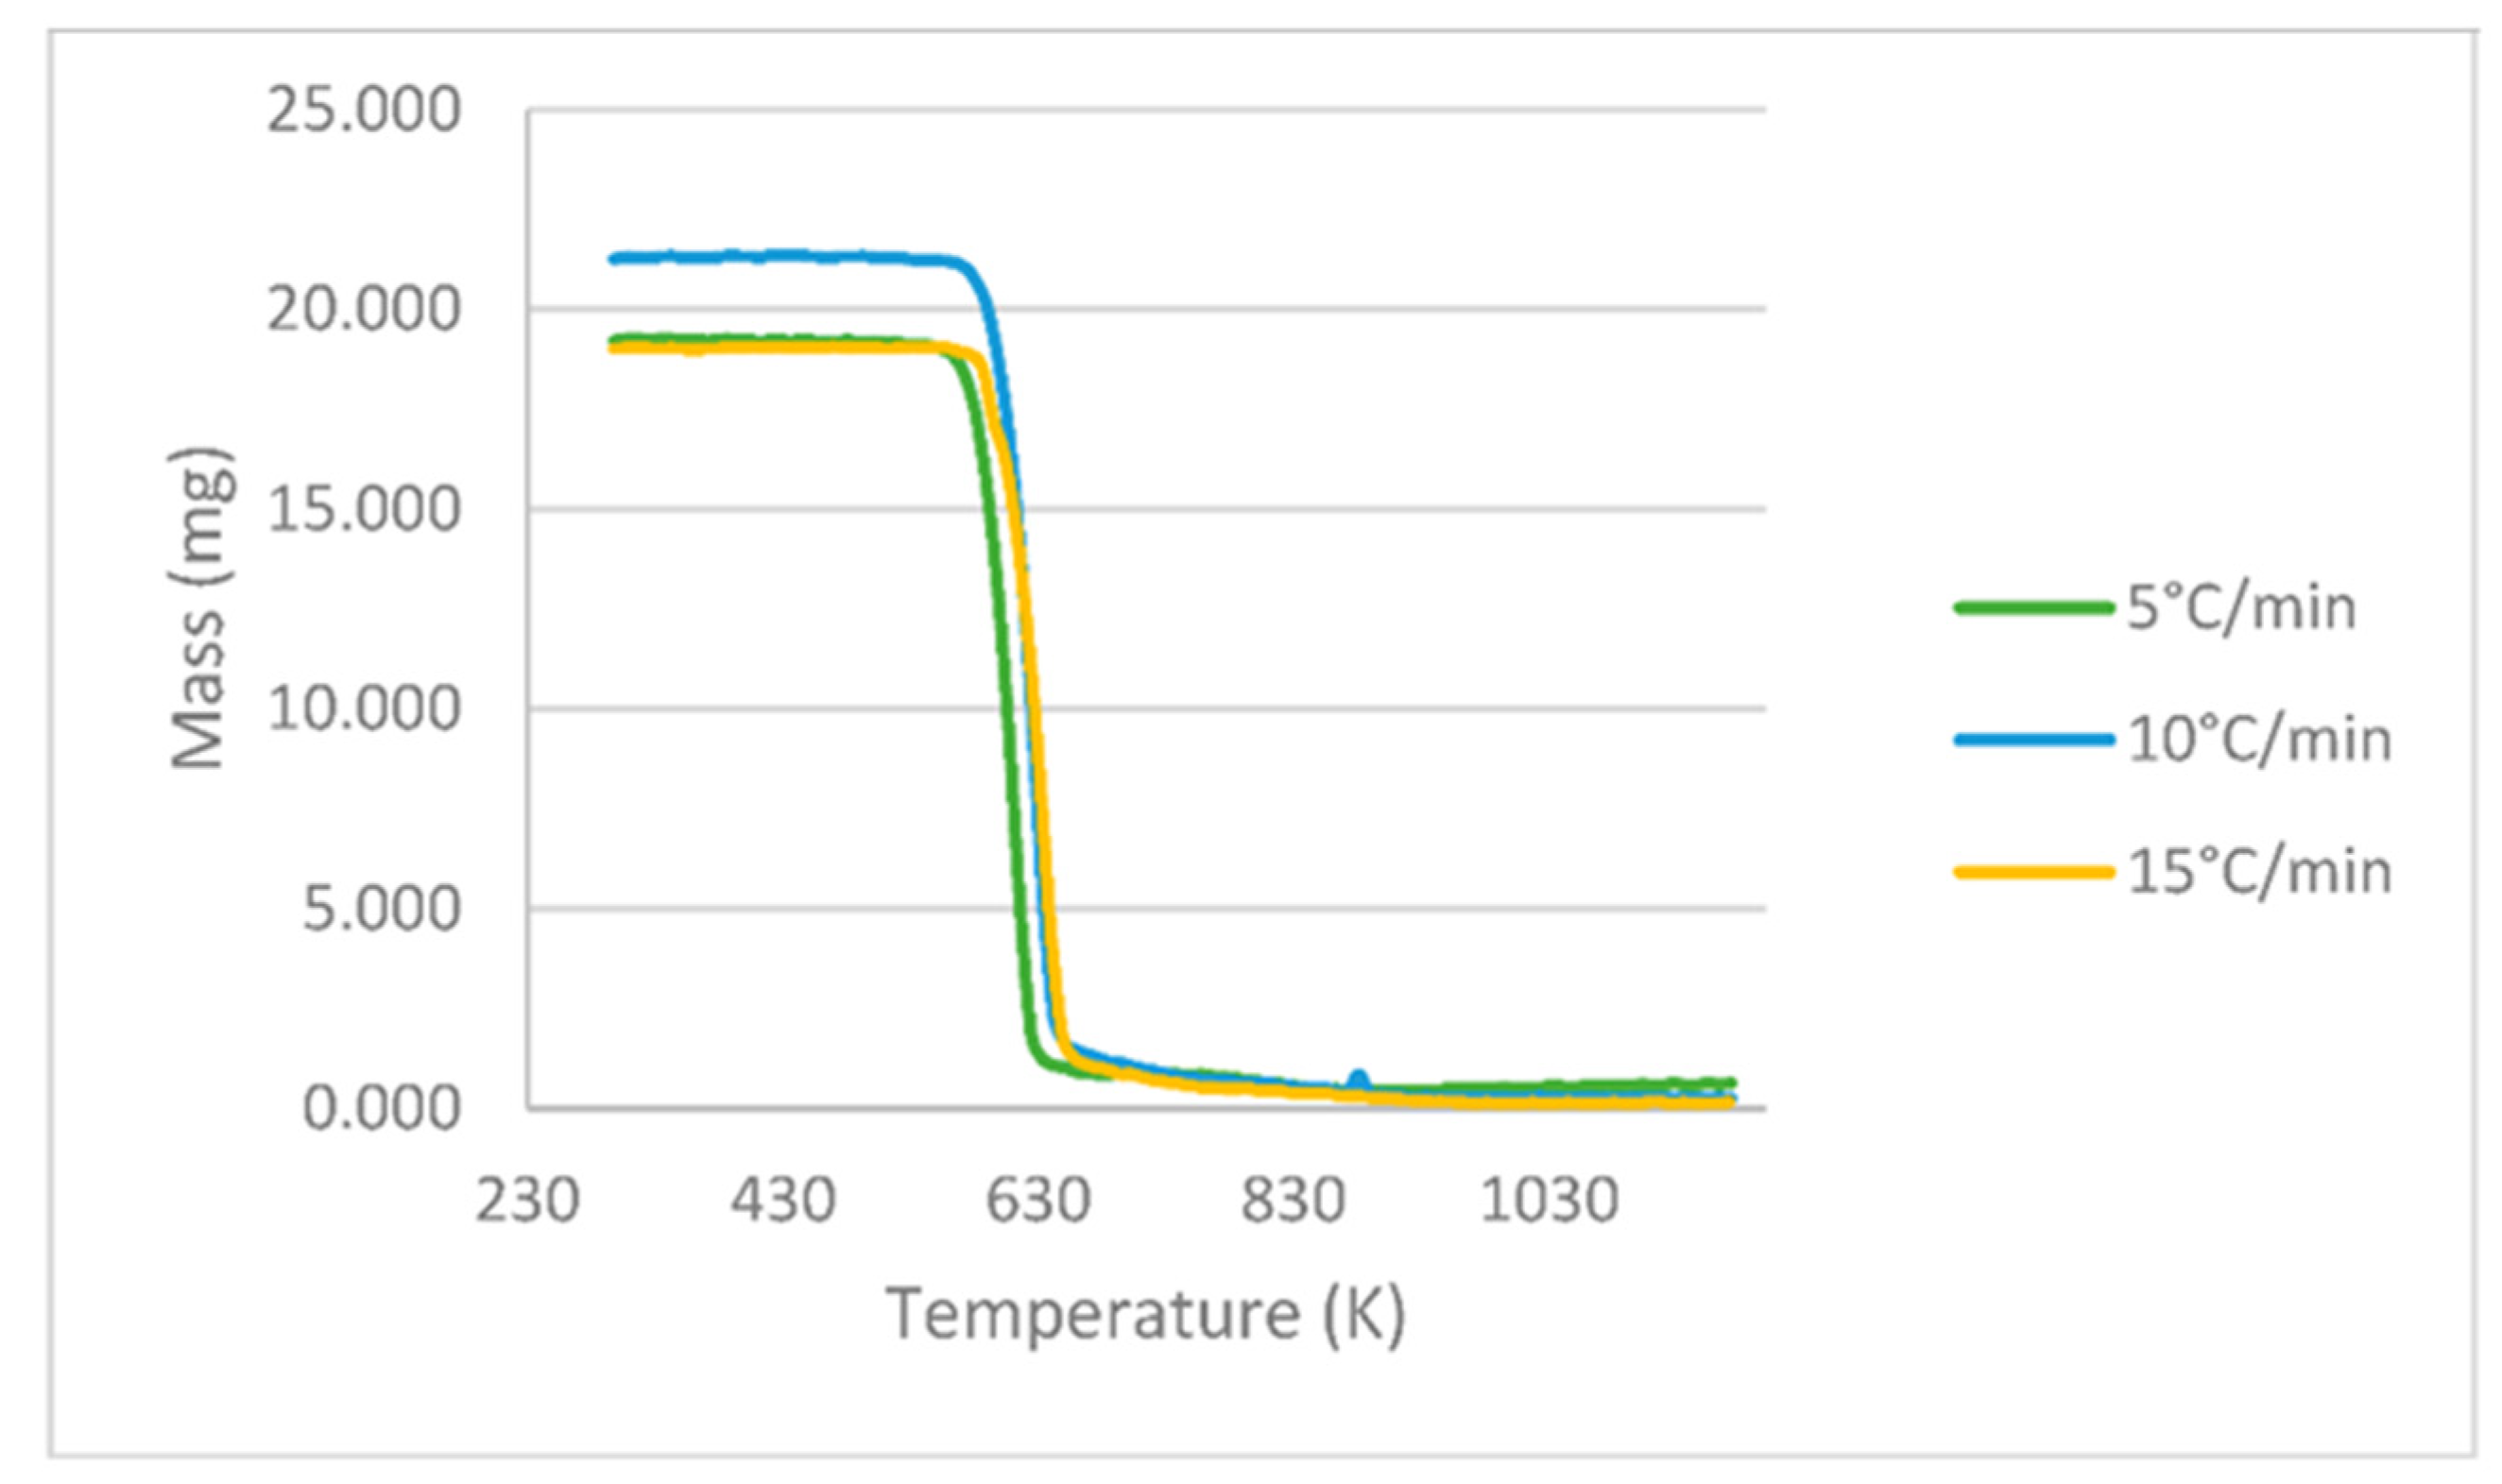
The results obtained in the TGA experiments consist of 200 points showing the variation in the PLA mass loss as a function of temperature at the heating rates 5, 10 and 15 °C min−1, as shown in Figure 2. The initial weight of the sample for the case at 15 °C min−1 was slightly higher.

Figure 2.
PLA TGA curves at different heating rates of 5, 10 and 15 °C min−1.
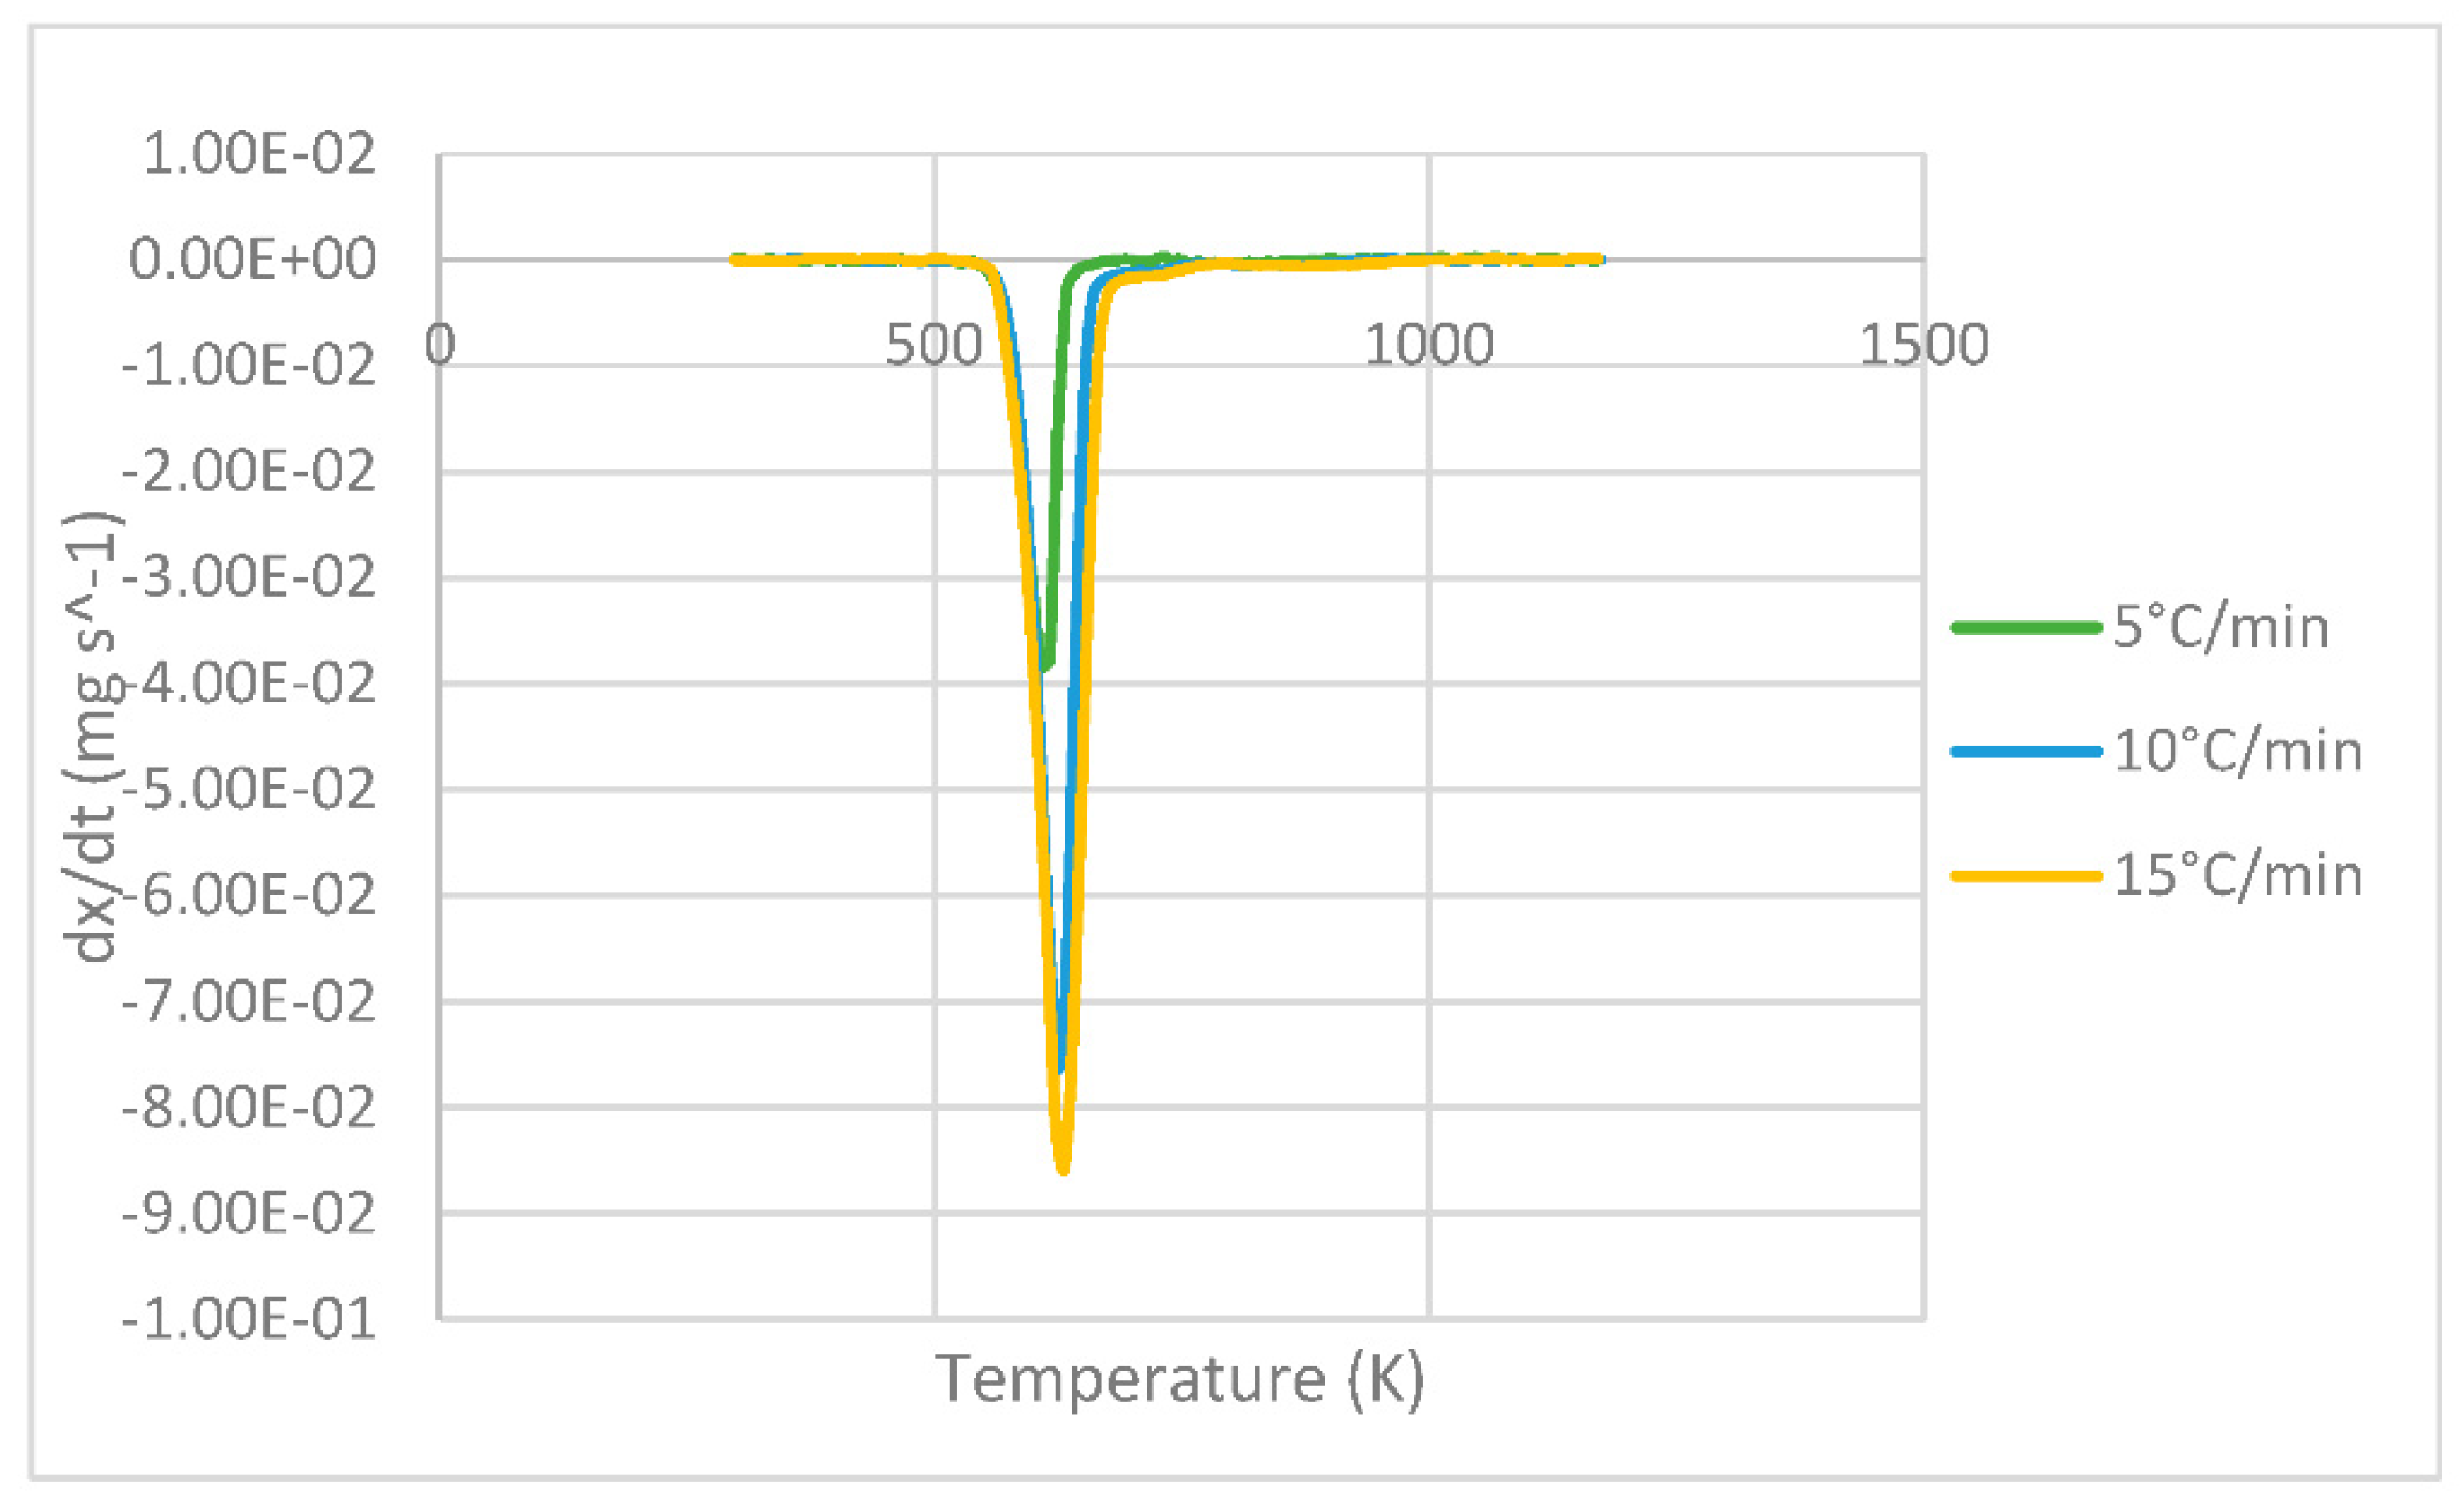
The DTG curves representing the derivative of the mass loss versus temperature are shown in Figure 3. At each heating, the maximum peak temperature can be seen where the greatest degradation of the sample occurs, resulting in 607, 624 and 631 K for 5, 10 and 15 °C min−1, respectively, whose values are analogous to those presented by Das & Tiwari in their study [10].
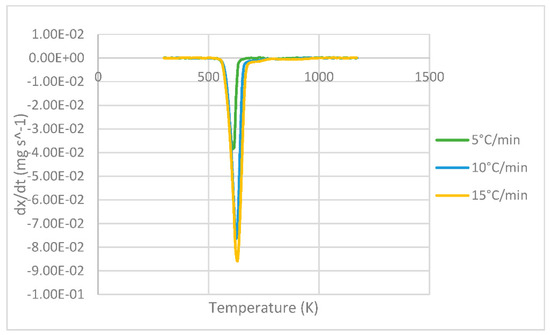
Figure 3.
DTG curves of PLA at different heating rates of 5, 10 and 15 °C min−1.
3.2. Kinetic Parameters of the FR, KAS and FWO Models
Table 1 shows the obtained kinetic parameters (activated energy and preexponential factor) using the different isoconversional kinetic models presented in Section 2.2.1. Regardless of the model, the kinetic parameters E and A decrease with an increasing heating rate; on the other hand, the reverse is true for the maximum degradation temperature (Tm), since the lower the heating rate, the lower the temperature at which the sample exhibits greater degradation. Figure 4, Figure 5, Figure 6, below, show a comparison at each heating rate of the experimental DTG curves versus the DTG curves of the isoconversional kinetic models proposed.

Table 1.
Kinetic parameters of PLA.
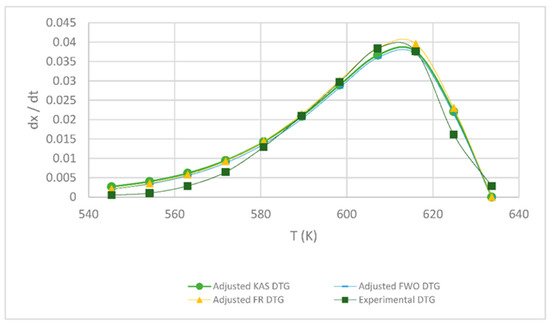
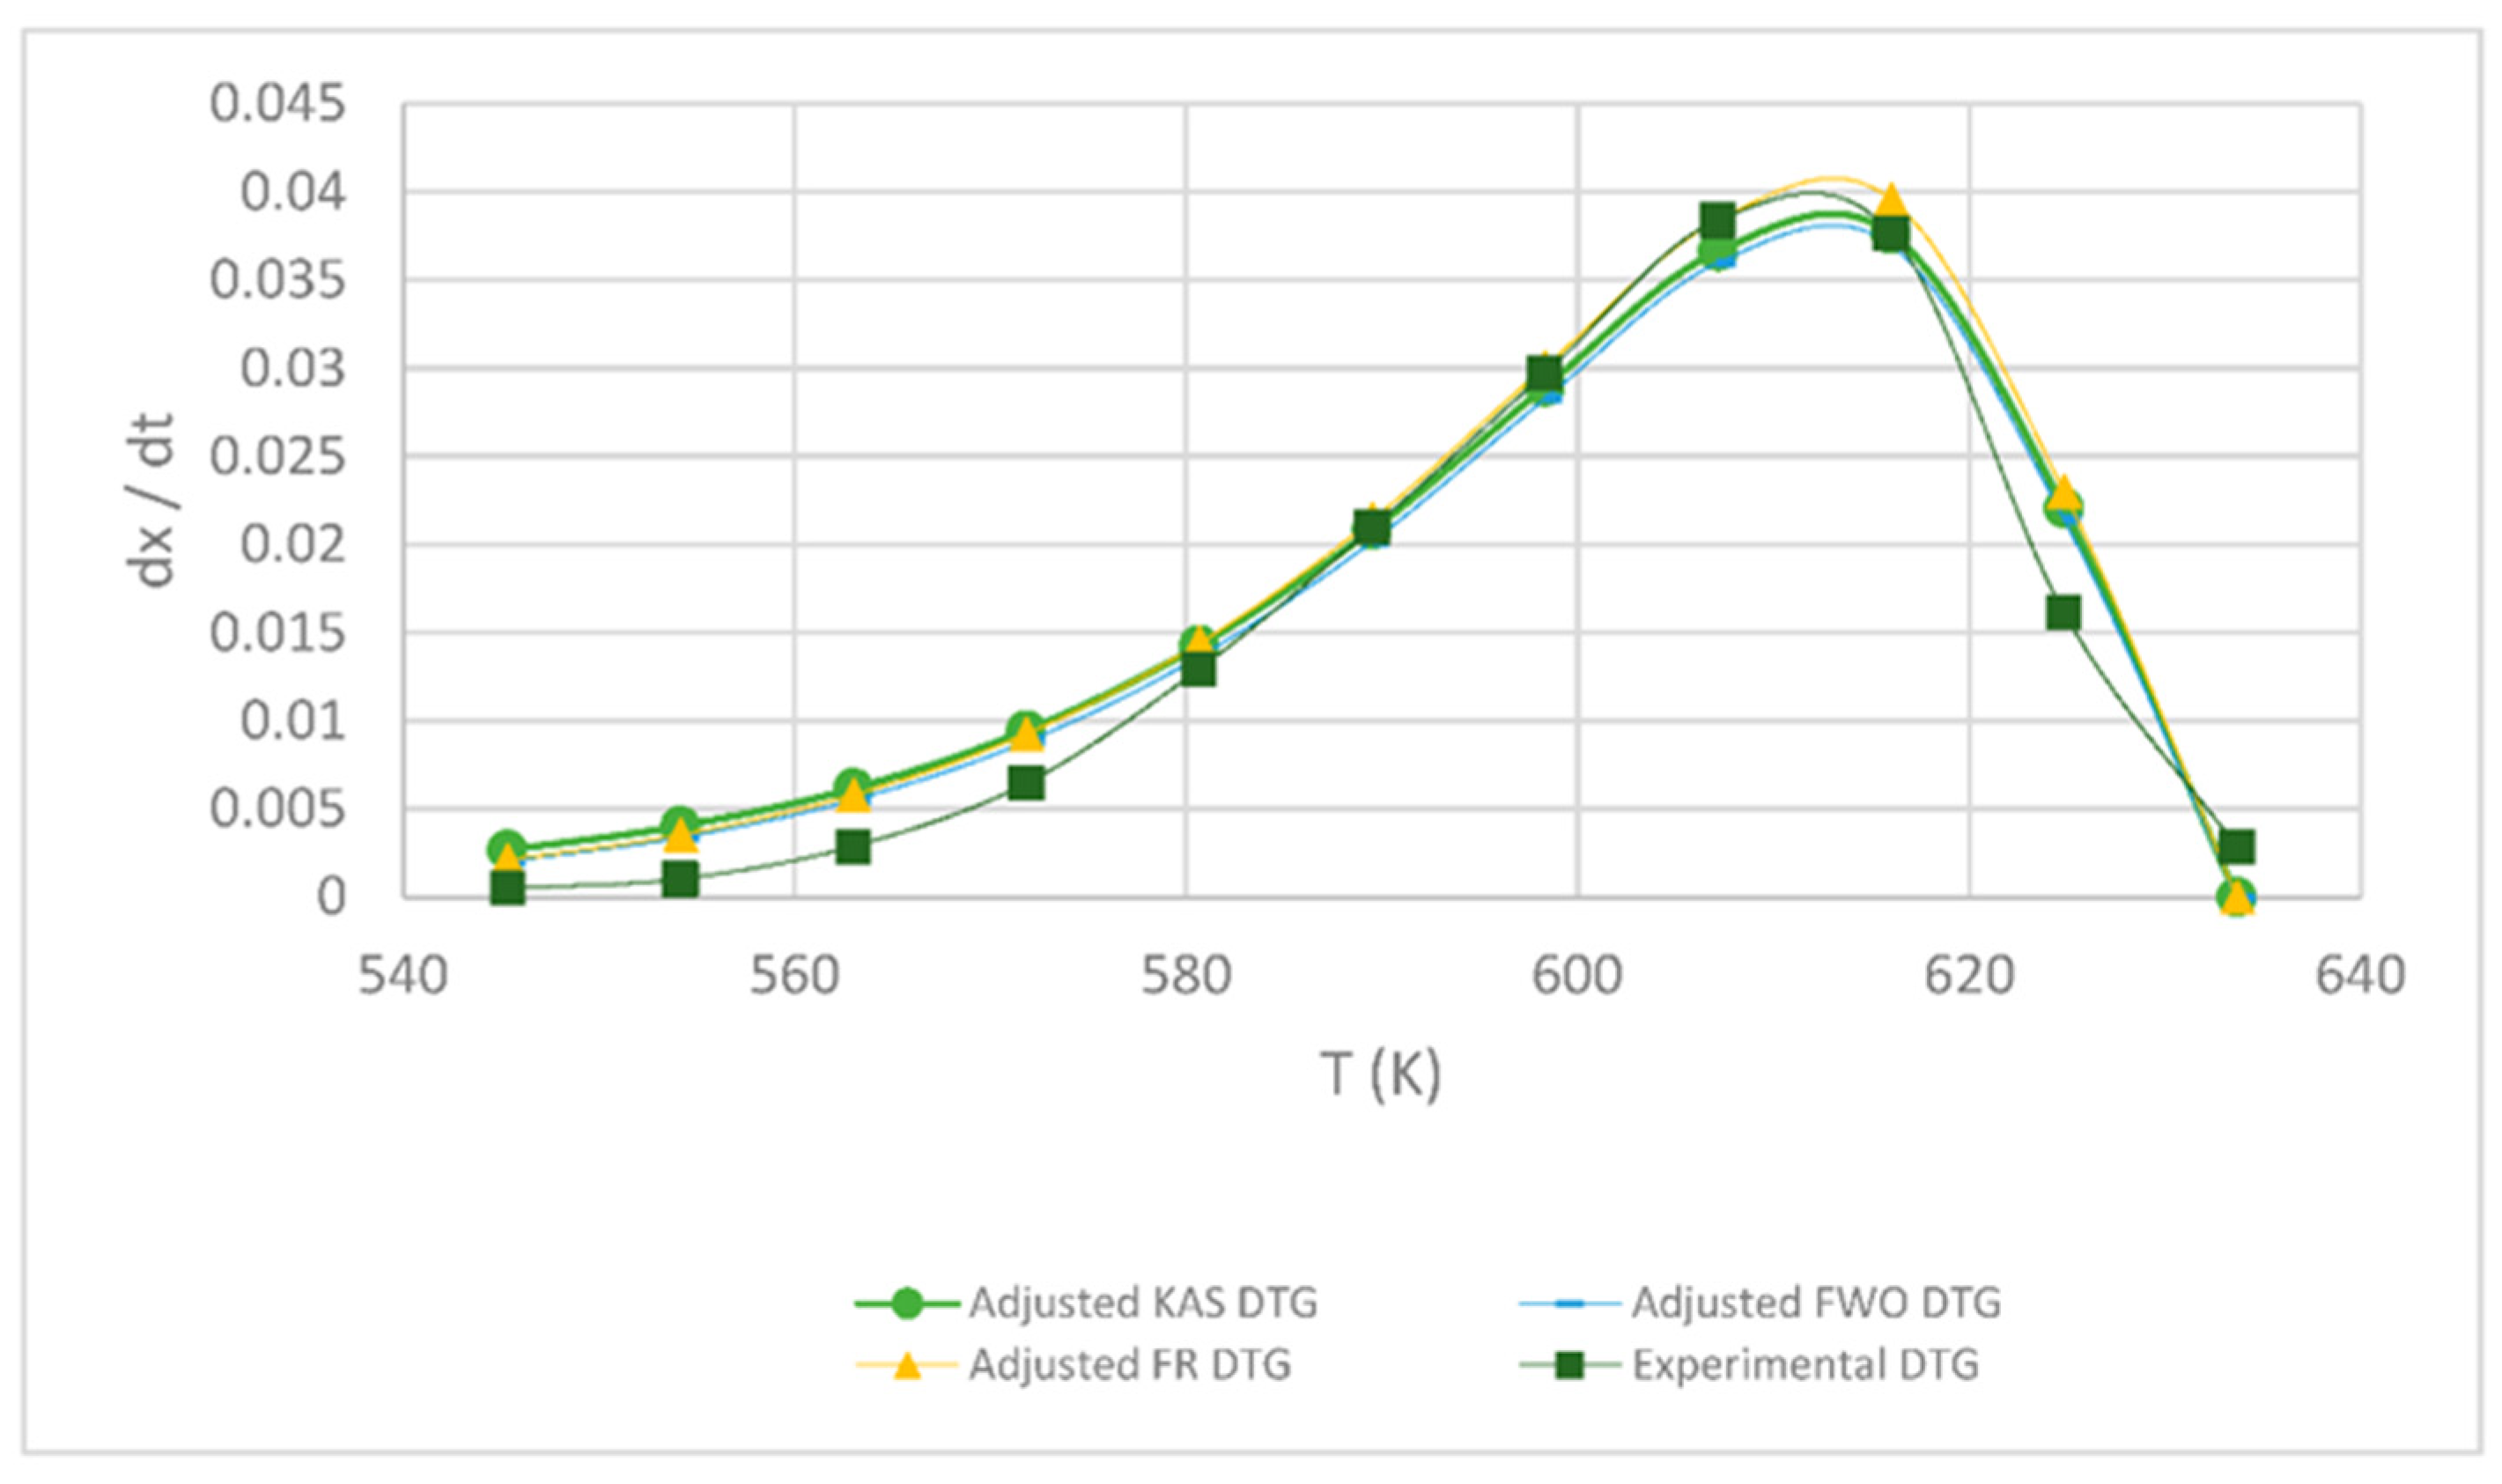
Figure 4.
Comparison of the FR, KAS and FWO models at 5 °C min−1.
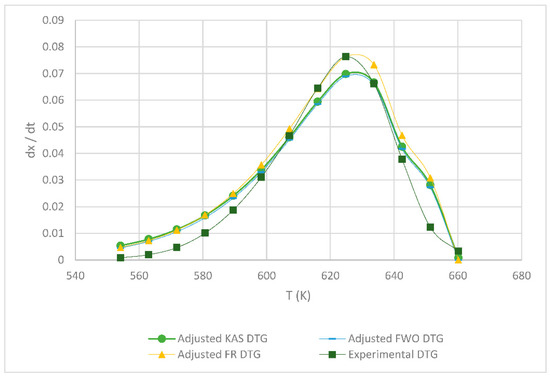
Figure 5.
Comparison of the FR, KAS and FWO models at 10 °C min−1.
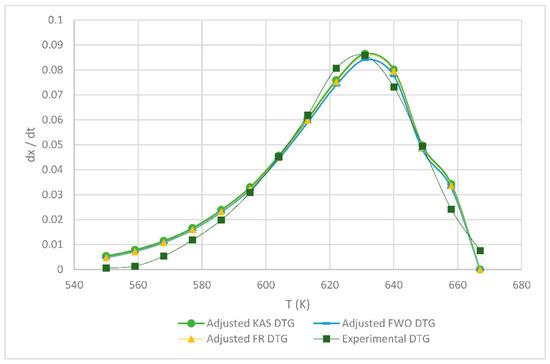
Figure 6.
Comparison of the FR, KAS and FWO models at 15 °C min−1.
In Figure 4 and Figure 5, it is seen that the FR model curves are above those of KAS and FWO models and slightly below the experimental one. This occurs due to the different values obtained from the least squares method applied to each model. The closer to zero that the value is, the closer it is to the experimental value model. Additionally, it can be observed that, as the heating rate increases, the curve shifts to the right at a higher temperature due to thermal diffusion. Based on the correlation of the experimental and calculated data, the KAS and FWO models are the ones that fit the best with a value very close to 100% correlation, at the rate of 5 and 15 °C min−1. These models included the temperature as adjusting parameter, to analyze the heating rate in the thermal degradation process. The present results are very close to those of the study by Valapa et al. [16]. The small difference that exists could be due to the fact that Valapa et al. worked with virgin PLA (activation energy 170 kJ/mol), while, in the present investigation, PLA was used that was thermally treated for its molding (activation energy 146 kJ/mol), showing lower activation energy due to its processing. The results at the rate of 15 °C min−1 were within the same range as in Das & Tiwari, peak temperature 642 K and activated energy 113 kJ/mol [10]. According to Das & Tiwari, the KAS model is chosen due to the good agreement between the results obtained with this model and the experimental values; additionally, when using the maximum degradation temperature, this model allows for the calculation of thermodynamic parameters. However, it is important to mention that the three models are acceptable for the kinetic study of PLA since they presented just small variations with respect to experimental data, with the FR model being the simplest one compared to the KAS and FWO models which use a larger number of parameters.
3.3. Thermodynamic Properties of PLA
The thermodynamic properties calculated for each heating rate were determined using the kinetic parameters obtained above and the equations presented in Section 2.3. The change in enthalpy, Gibbs free energy and entropy are shown in Table 2.
Table 2.
Thermodynamic properties of PLA at different heating rates.
In Table 2, it can be observed that there is just a little change (5–6 kJ mol−1) between enthalpy and activation energy at the same heating rate, showing quite similar values. A lower activation energy helps the formation of a general activated complex because the TG curve shows a single degradation peak, which indicates that the process is carried out in a single step, that is, a single general reaction is assumed despite the fact that there are a number of reactions; hence, a single activated complex exists. The difference between the values of ∆H and E confirm that the formation of the products can be carried out by providing 5 kJ mol−1 of additional energy [29]. The entropies present negative values, indicating that the degree of disorder of the products formed through dissociation of bonds is lower than that of the reactants. The low ∆S at the rate of 15 °C min−1 means that the material only undergoes some physical and chemical changes, until it reaches a state close to its thermodynamic equilibrium. PLA has little reactivity and it takes a long time to form an activated complex. On the other hand, a high ∆S means that the reactivity will be high, and it will take less time to form the activated complex; this happens when the heating rate is lower. On the contrary, the positive values of the Gibbs free energies indicate that the process requires a contribution of energy for it to occur (non-spontaneous process), taking into account that ∆G means a total increase in the energy of the system for the formation of the activated complex [30]. The sample at the rate of 15 °C min−1 presents an activation energy and an enthalpy slightly lower than the other heating rates. However, the difference in the Gibbs free energies was not significant.
4. Conclusions
The kinetic study carried out for the PLA concludes that the three isoconversional kinetic models used in the present work are valid since they present a high correlation coefficient. These isoconversional models can capture the reaction mechanism as the reaction kinetics progress. However, the KAS model was chosen because it has a slightly higher correlation coefficient than the other two models, which also considers the maximum degradation temperature.
The heating rate directly influences the speed and mechanism that follows the thermal degradation. Regardless of the kinetic model used, at high heating rates, the maximum degradation temperature of the polymer will be higher while the reaction energy (activation energy and enthalpy) and the pre-exponential factor will be lower. The ∆G value of PLA at a rate of 5 °C per minute (170.58 kJ mol−1) is slightly lower; therefore, at this heating ramp, the plastic presents the easiest degradation compared to the other tested heating rates. Therefore, with the main kinetic parameters obtained governing the reaction undergone in the pyrolytic reactor, the stability of the PLA thermal degradation can be predicted.
Author Contributions
Conceptualization, P.P.; methodology, M.M. and P.P.; software, M.M. and P.P.; validation M.M. and P.P. and D.B.; formal analysis, D.B. and P.P.; investigation, M.M., P.P. and D.B.; resources, M.M., P.P. and D.B.; data curation, M.M., P.P. and D.B.; writing—original draft preparation, P.P.; writing—review and editing, P.P. and J.C.B.; visualization, P.P.; supervision, P.P. and J.C.B.; funding acquisition, P.P. All authors have read and agreed to the published version of the manuscript.
Funding
This research received no external funding.
Institutional Review Board Statement
Not applicable.
Informed Consent Statement
Not applicable.
Data Availability Statement
Data is contained within this article.
Conflicts of Interest
The authors declare no conflict of interest.
References
- Plastics Europe. Plastics—The Facts 2018. An Analysis of European Plastics Production, Demand and Waste Data. Available online: https://www.plasticseurope.org; Plásticos–Situación en 2019. Plastic Europe. 2019. Available online: https://www.plasticseurope.org/es/resources/publications/2511-plasticos-situacion-en-201 (accessed on 1 September 2021).
- Plavec, R.; Hlaváčiková, S.; Omaníková, L.; Feranc, J.; Vanovčanová, Z.; Tomanová, K.; Bočkaj, J.; Kruželák, J.; Medlenová, E.; Gálisová, I.; et al. Recycling possibilities of bioplastics based on PLA/PHB blends. Polym. Test. 2020, 92, 106880. [Google Scholar] [CrossRef]
- Xiang, S.; Feng, L.D.; Bian, X.C.; Li, G.; Chen, X.S. Evaluation of PLA content in PLA/PBAT blends using TGA. Polym. Test. 2020, 81, 106211. [Google Scholar] [CrossRef]
- Fan, Y.; Nishida, H.; Hoshihara, S.; Shirai, Y.; Tokiwa, Y.; Endo, T. Pyrolysis kinetics of poly(l-lactide) with carboxyl and calcium salt end structures. Polym. Degrad. Stab. 2003, 79, 547–562. [Google Scholar] [CrossRef]
- Jin, Z.; Yin, L.; Chen, D.; Jia, Y.; Yuan, J.; Hu, Y. Co-pyrolysis characteristics of typical components of waste plastics in a falling film pyrolysis reactor. Chin. J. Chem. Eng. 2018, 26, 2176–2184. [Google Scholar] [CrossRef]
- Matias, Á.A.; Lima, M.S.; Pereira, J.; Pereira, P.; Barros, R.; Coelho, J.F.; Serra, A.C. Use of recycled polypropylene/poly(ethylene terephthalate) blends to manufacture water pipes: An industrial scale study. Waste Manag. 2020, 101, 250–258. [Google Scholar] [CrossRef] [PubMed]
- Singh, G.; Tyagi, V.; Singh, P.; Pandey, A. Estimation of thermodynamic characteristics for comprehensive dairy food processing plant: An energetic and exergetic approach. Energy 2020, 194, 116799. [Google Scholar] [CrossRef]
- Badia, J.; Blasco, L.S.; Moriana, R.; Ribes-Greus, A. Thermal analysis applied to the characterization of degradation in soil of polylactide: II. On the thermal stability and thermal decomposition kinetics. Polym. Degrad. Stab. 2010, 95, 2192–2199. [Google Scholar] [CrossRef]
- Brems, A.; Baeyens, J.; Beerlandt, J.; Dewil, R. Thermogravimetric pyrolysis of waste polyethylene-terephthalate and polystyrene: A critical assessment of kinetics modelling. Resour. Conserv. Recycl. 2011, 55, 772–781. [Google Scholar] [CrossRef]
- Das, P.; Tiwari, P. Thermal degradation kinetics of plastics and model selection. Thermochim. Acta 2017, 654, 191–202. [Google Scholar] [CrossRef]
- Xu, F.; Wang, B.; Yang, D.; Hao, J.; Qiao, Y.; Tian, Y. Thermal degradation of typical plastics under high heating rate conditions by TG-FTIR: Pyrolysis behaviors and kinetic analysis. Energy Convers. Manag. 2018, 171, 1106–1115. [Google Scholar] [CrossRef]
- Carrasco, F.; Pérez-Maqueda, L.; Sánchez-Jiménez, P.; Perejón, A.; Santana, O.; Maspoch, M. Enhanced general analytical equation for the kinetics of the thermal degradation of poly(lactic acid) driven by random scission. Polym. Test. 2013, 32, 937–945. [Google Scholar] [CrossRef]
- Duque, J.V.F.; Martins, M.F.; Debenest, G.; Orlando, M.T.D. The influence of the recycling stress history on LDPE waste pyrolysis. Polym. Test. 2020, 86, 106460. [Google Scholar] [CrossRef]
- María, L.; Ríos, A.; Victoria, P.; Muñoz, C.; Manuel, J.; Giraldo, C.; Gaviria, G.H.; Felipe, A.; González, R. Modelos cinéticos de degradación térmica de polímeros: Una revisión. Rev. Ing. Univ. De Medellín 2013, 12, 113–130. [Google Scholar] [CrossRef] [Green Version]
- Khedri, S.; Elyasi, S. Kinetic analysis for thermal cracking of HDPE: A new isoconversional approach. Polym. Degrad. Stab. 2016, 129, 306–318. [Google Scholar] [CrossRef]
- Valapa, R.; Pugazhenthi, G.; Katiyar, V. Thermal degradation kinetics of sucrose palmitate reinforced poly(lactic acid) biocomposites. Int. J. Biol. Macromol. 2014, 65, 275–283. [Google Scholar] [CrossRef] [PubMed]
- Friedman, H.L. Kinetics of thermal degradation of char-forming plastics from thermogravimetry. Application to a phenolic plastic. J. Polym. Sci. Part C 1964, 6, 183–195. [Google Scholar] [CrossRef]
- Coats, A.W.; Redfern, J.P. Kinetic Parameters from Thermogravimetric Data. Nat. Cell Biol. 1964, 201, 68–69. [Google Scholar] [CrossRef]
- Flynn, J.H.; Wall, L.A. A quick, direct method for the determination of activation energy from thermogravimetric data. J. Polym. Sci. Part B Polym. Lett. 1966, 4, 323–328. [Google Scholar] [CrossRef]
- Ozawa, T. A New Method of Analyzing Thermogravimetric Data. Bull. Chem. Soc. Jpn. 1965, 38, 1881–1886. [Google Scholar] [CrossRef] [Green Version]
- Doyle, C.D. Kinetic analysis of thermogravimetric data. J. Appl. Polym. Sci. 1961, 5, 285–292. [Google Scholar] [CrossRef]
- Palmay, P.; Jaramillo-Uvidia, R.N.; Medina, C. Estudio cinético de la descomposición térmica del polietileno de alta densidad (HDPE) posconsumo a diferentes tasas de calentamiento. FIGEMPA Investig. y Desarro. 2021, 11, 61–68. [Google Scholar] [CrossRef]
- Kassargy, C.; Awad, S.; Burnens, G.; Kahine, K.; Tazerout, M. Experimental study of catalytic pyrolysis of polyethylene and polypropylene over USY zeolite and separation to gasoline and diesel-like fuels. J. Anal. Appl. Pyrolysis 2017, 127, 31–37. [Google Scholar] [CrossRef]
- Arjanggi, R.D.; Kansedo, J. Recent advancement and prospective of waste plastics as biodiesel additives: A review. J. Energy Inst. 2020, 93, 934–952. [Google Scholar] [CrossRef]
- Farah, S.; Anderson, D.G.; Langer, R. Physical and mechanical properties of PLA, and their functions in widespread applications—A comprehensive review. Adv. Drug Deliv. Rev. 2016, 107, 367–392. [Google Scholar] [CrossRef] [Green Version]
- NatureWorks|Home. Available online: https://www.natureworksllc.com/ (accessed on 12 October 2021).
- Choksi, N.; Desai, H. Synthesis of Biodegradable Polylactic Acid Polymer by Using Lactic Acid Monomer. Int. J. Appl. Chem. 2017, 13, 377–384. Available online: http://www.ripublication.com (accessed on 6 September 2021).
- Jumat, M.A.; Chevallier, P.; Mantovani, D.; Copes, F.; Razak, S.I.A.; Saidin, S. Three-dimensional printed biodegradable poly(l-lactic acid)/(poly(d-lactic acid) scaffold as an intervention of biomedical substitute. Polym. Technol. Mater. 2021, 60, 1005–1015. [Google Scholar] [CrossRef]
- Mehmood, M.A.; Ye, G.; Luo, H.; Liu, C.; Malik, S.; Afzal, I.; Xu, J.; Ahmad, M.S. Pyrolysis and kinetic analyses of Camel grass (Cymbopogon schoenanthus) for bioenergy. Bioresour. Technol. 2017, 228, 18–24. [Google Scholar] [CrossRef] [PubMed]
- Kim, Y.S.; Kim, Y.S.; Kim, S.H. Investigation of Thermodynamic Parameters in the Thermal Decomposition of Plastic Waste−Waste Lube Oil Compounds. Environ. Sci. Technol. 2010, 44, 5313–5317. [Google Scholar] [CrossRef]


Publisher’s Note: MDPI stays neutral with regard to jurisdictional claims in published maps and institutional affiliations. |
© 2021 by the authors. Licensee MDPI, Basel, Switzerland. This article is an open access article distributed under the terms and conditions of the Creative Commons Attribution (CC BY) license (https://creativecommons.org/licenses/by/4.0/).