Abstract
This paper presents an analysis and optimization of an isolated hybrid renewable power system to operate in the Alrashda village in the Dakhla Oasis, which is situated in the New Valley Governorate in Egypt. The proposed hybrid system is designed to integrate a biomass system with a photovoltaic (PV), wind turbine (WT) and battery storage system (Bat). Four different cases are proposed and compared for analyzing and optimizing. The first case is a configuration of PV and WT with a biomass system and battery bank. The second case is the integration of PV with a biomass system and battery bank. The third case is WT integrated with biomass and a battery bank, and the fourth case is a conventional PV, WT, and battery bank as the main storage unit. The optimization is designed to reduce component oversizing and ensure the dependable control of power supplies with the objective function of reducing the levelized cost of energy and loss of power supply probability. Four optimization algorithms, namely Heap-based optimizer (HBO), Franklin’s and Coulomb’s algorithm (CFA), the Sooty Tern Optimization Algorithm (STOA), and Grey Wolf Optimizer (GWO) are utilized and compared with each other to ensure that all load demand is met at the lowest energy cost (COE) for the proposed hybrid system. The obtained results revealed that the HBO has achieved the best optimal solution for the suggested hybrid system for case one and two, with the minimum COE 0.121171 and 0.1311804 $/kWh, respectively, and with net present cost () of $3,559,143 and $3,853,160, respectively. Conversely, STOA has achieved the best optimal solution for case three and four, with a COE of 0.105673 and 0.332497 $/kWh, and an NPC of $3,103,938 and $9,766,441, respectively.
1. Introduction
The world’s need is increasing every day to reduce dependence on the use of fossil fuels, so finding means, solutions, and alternatives for how to produce the required energy has become of paramount importance. Thus, the push to develop and produce renewable energy globally increases every year, and many countries have managed to develop renewable energy projects based on solar and wind energy on a large scale. This progress is essential to the plan to replace renewable energy sources that depend on fossil fuels and establish a solid foundation for a sustainable society [1].
Off-grid power generation is a viable option for supplying electricity to small communities in developing countries that do not have enough money to spend on a continuous connection to the public electric grid, and places that are very remote and cannot be easily connected to the grid due to their distance from basic infrastructure. In such circumstances, the utilization of renewable energies can help these places develop more quickly [2]. The most common methods of generating renewable energy are solar and wind energy solutions. However, it often depends on the area to decide which resources will be used to get the best results. This could include hydropower and/or biomass energy as additional means of producing renewable energy. Hybrid Renewable Energy System stations are generally characterized as a combination of two or more various power sources to supply the electrical power required for the loads, and can be a mixture of either traditional and renewable sources, or only renewable sources [3].
An off-grid power generation system causes reliability issues because of an unavailability of electricity backup from the utility grid. Moreover, solar and wind energy’s variable nature causes non-linear and erratic energy production, which leads to a power mismatch where the load requirements of the consumer are not satisfied by the capacity production [4]. To overcome this, a hybrid renewable energy system is used with an energy backup unit to meet consumer demand. Where the energy storage system consists of fuel cells (FCs), batteries (Bats), etc., thereby the wind and solar energy complimentary characteristics are integrated with the energy storage system backup unit to make the system credible and sustainable [5].
Several researchers have introduced popular software-based, classical, and metaheuristic techniques for the unit sizing of hybrid renewable systems. One of the most known of these software programs used for the optimization process is the Multiple Energy Sources Hybrid Optimization Model (HOMER). The authors in [6] utilized the HOMER simulation to study the performance of six different configurations of hybrid systems based on a photovoltaic (PV)/wind turbine (WT)/FC/Bat model. This research paper aims to look at the energy production potential and creation of hydrogen using solar and wind power resources in various regions throughout Saudi Arabia, including Dhahran, Riyadh, Jeddah, Abha, and Yanbu. The results revealed that integrating PV/WT/Bat storage bank is the optimal option for achieving the lowest energy cost (COE) with 0.609 $/kWh in the Yanbu area. Ref. [7] investigated a design of a hybrid stand-alone renewable energy model for the Azad National Institute of Technology, Bhopal in the Indian state of Madhya Pradesh using 5 kW PV, 5 kW biomass gasifier generator and a 5 kW fuel cell. The HOMER program was employed for obtaining the optimized results, where the COE of the proposed power system has been found to be 15.064 Rs/kWh and total net present cost (T) Rs. 5189003. Authors in [8] introduced a techno-economic analysis and optimum analysis planning of different configurations of a hybrid renewable energy system based on PV/WT/ diesel generator (DG)/Bat, and converter to meet up with the electric load requirements for a rural area in Dongola, Sudan. This was achieved by studying various layouts of the suggested hybrid system to explore the optimal solution for the lowest and greenhouse gas emissions using the HOMER program. The results evidenced that the construction of the PV/WT/DG/Bat converter unit achieved the best performances for both the T with 24.16 M$ and COE with 0.387 $/kWh.
Ajlan et al. [9] examined the feasibility of introducing a micro-grid hybrid system using five alternative energy scenarios (DG-only, PV/DG, WT/DG, PV/WT and PV/WT/DG) for a rural community in the Shafar village, Hajjah province, Yemen. From an environmental and economic standpoint, the results obtained from the HOMER software showed that PV/WT/DG scenario was the optimal hybrid system in emission reduction with 70%, system cost reduction with 45%, and high system reliability. Dufo-López et al. [10] formulated a new multi-objective evolutionary algorithm (MOEA) to identify the best feasible way of a stand-alone hybrid power system based on PV/WT/DG/Bat/converter to satisfy the required load in the Tindouf area, Algeria. The main objective functions of this suggested system are to reduce the NPC and maximize both Human Development Index (HDI), as well as job creation (JC).
Antonio et al. [11] evaluated an optimal configuration analysis using HOMER software for an off-grid hybrid system based on PV/BG/hydrokinetic turbines/Bats bank located in Southern Ecuador. Mehran et al. [12] applied the multi-objective crow search algorithm for optimum sizing and the techno-economic analysis of a hybrid system consisting of PV/DG/FCs and batteries. Suresh et al. [13] developed the multi-objective improved genetic algorithm to find the optimal sizing of an off-grid hybrid model for rural areas by considering the minimization of the COE. This proposed system was based on PV/WT/DG/Bat components. Kharrich et al. [14] discussed improving a hybrid system consisting of PV/WT/DG/Bat in the Dakhla area in Morocco by considering the minimization of the NPC. This optimization problem is based on using a novel Equilibrium Optimizer (EO), and the obtained results of this optimizer were compared with the results obtained from the use of the Harris Hawks optimizer (HHO), Artificial Electric Field optimizer (AEFO) Algorithm, GWO Algorithm, and Sooty Tern Optimization Algorithm (STOA).
Ramli et al. [15] developed a multi-objective self-adaptive differential evolution (MOSaDE) technique for the optimal scheduling of a microgrid system composed of PV/WT/DG/Bat for Yanbu, Saudi Arabia. This optimization technique has been used to analyze the COE, LPSP, and the Renewable Factor (RF) simultaneously. Ashraf et al. [16] presented the PV/WT/DG hybrid system as the optimal configuration for providing the required loads with least minimum COE, the total emissions generated, and maximum LPSP in the Gobi Desert in China. The optimized design of the proposed hybrid system is based on a new Elephant Herding Optimization (EHO) algorithm. Diab et al. [17] formed an optimal grid system to reduce the energy cost while satisfying the operational constraints by using a Modified Farmland Fertility Algorithm (MFFA), while the hybrid system is a combination of PV, WT, and FC units as a case study for Ataka region in Egypt.
Geleta et al. [18] proposed and analyzed an optimized sizing of PV/WT/Bat bank hybrid system as the optimal configuration for supplying the needed load with the least COE. The GWO algorithm is the proposed technique used for solving the optimization problem. Shakti and Subhash [19] studied an optimized sizing of an off-grid PV/biomass system compared to grid-connected PV/biomass system. The assessment of various viewpoints of multiple technical and economic performance were made using two optimization techniques, the Artificial Bee Colony (ABC) optimization technique and HOMER software. The results showed that the grid-connected model outperformed the off grid model in terms of cost. Bukar et al. [20], determined the optimal hybrid energy system composed of PV/WT/DG/Bat that would fulfill the load required to reliably supply residential housing in Yobe State, Nigeria, based on reducing the COE and LPSP. Optimization of the suggested hybrid power system was done using the grasshopper optimization algorithm (GOA) and the obtained results were compared with the results obtained from CS, PSO algorithms.
Heydari and Askarzadeh [21], evaluated an approach for optimal sizing of an off grid hybrid system based on PV/biomass in Bardsir, Iran, with objectives of minimizing and the LPSP. This research is focused on utilizing the harmony search (HS) optimization algorithm on modeling the optimal hybrid system. Sarkar et al. [22] analyzed the operational behavior of an optimized hybrid micro-grid consists of PV/WT/biomass/Bat storage unit using the HOMER program to supply the required load of the investigated area in India with least COE, and to ensure zero LPSP. Li et al. [23] addressed the issue of techno-economic optimal design of stand-alone PV/WT/Biomass/Bat hybrid model utilizing HOMER program for a town in West China.
Ghosh et al. [24] discussed the optimal sizing and cost reduction solution for a micro-grid hybrid system that both includes PV and biomass. The dragonfly algorithm has been applied to simulate and perform this optimization analysis and the results have been compared with the obtained results from the ABC method. Eteiba et al. [25] evaluated the effect of four optimization techniques (Flower Pollination Algorithm (FPA), the HS, ABC, and the Fire-fly Algorithm (FA)) to determine the optimal sizing of an off-grid hybrid PV/biomass/Bat storage system while utilizing the minimization of as the fitness function for the suggested optimization methods. Sawle et al. [26] presented different optimization strategies based on GA, BFPSO, PSO and Teaching-Learning-Based Optimization (TLBO) to construct an optimal PV/WT/Biomass/Bat hybrid system with different objectives which are COE, LPSP, RF, Particular matter (PM), HDI, JC, and GHG. According to the results, the TLBO technique is an effective tool for dealing with all problem objectives and providing the best solution. Alshammari and Asumadu [27] discussed the optimization of an off-grid hybrid system consisting of PV/WT/biomass/Bat units to supply customers’ electrical demands in a cost-effective, efficient, and reliable manner. To determine the optimal solution, two optimization methods were used (HS and PSO techniques). The major objectives of this work are as follows:
- The paper contains the study of four scenarios of a stand-alone hybrid system utilizing real-time meteorological data for a remote area located in the New Valley Governorate of Egypt called Alrashda village in Dakhla Oasis. The first system scenario is PV/WT/Biomass/Bat, the second is PV/Biomass/Bat, the third is WT/Biomass/Bat, and the fourth one is PV/WT/Bat.
- Studying a new optimization algorithm, which is the Heap-based optimizer (HBO) technique, while make a comparison with a three recent types of optimization methods namely, Franklin’s and Coulomb’s algorithm (CFA), the Sooty Tern Optimization Algorithm (STOA), and Grey Wolf Optimizer (GWO).
- The study includes exploiting the capabilities of the proposed algorithms to optimize and minimize COE with increasing the reliability and efficiency of the suggested hybrid systems, and performs different sensitivity analyses on an optimal design to predict the upcoming system implementation.
The suggested work is structured as follows: Section 2 explains the modeling of the suggested system units. Section 3 discusses the description of the studied area. Section 4 discusses the formulation of the optimization problem. Section 5 discusses a brief explanation of the optimization methodology of HBO, CFA, GWO, and STOA. Section 6 presents the results of the optimal sizing for the stand-alone hybrid power system. Finally, the conclusions are provided in Section 7.
2. Modeling of the Proposed System
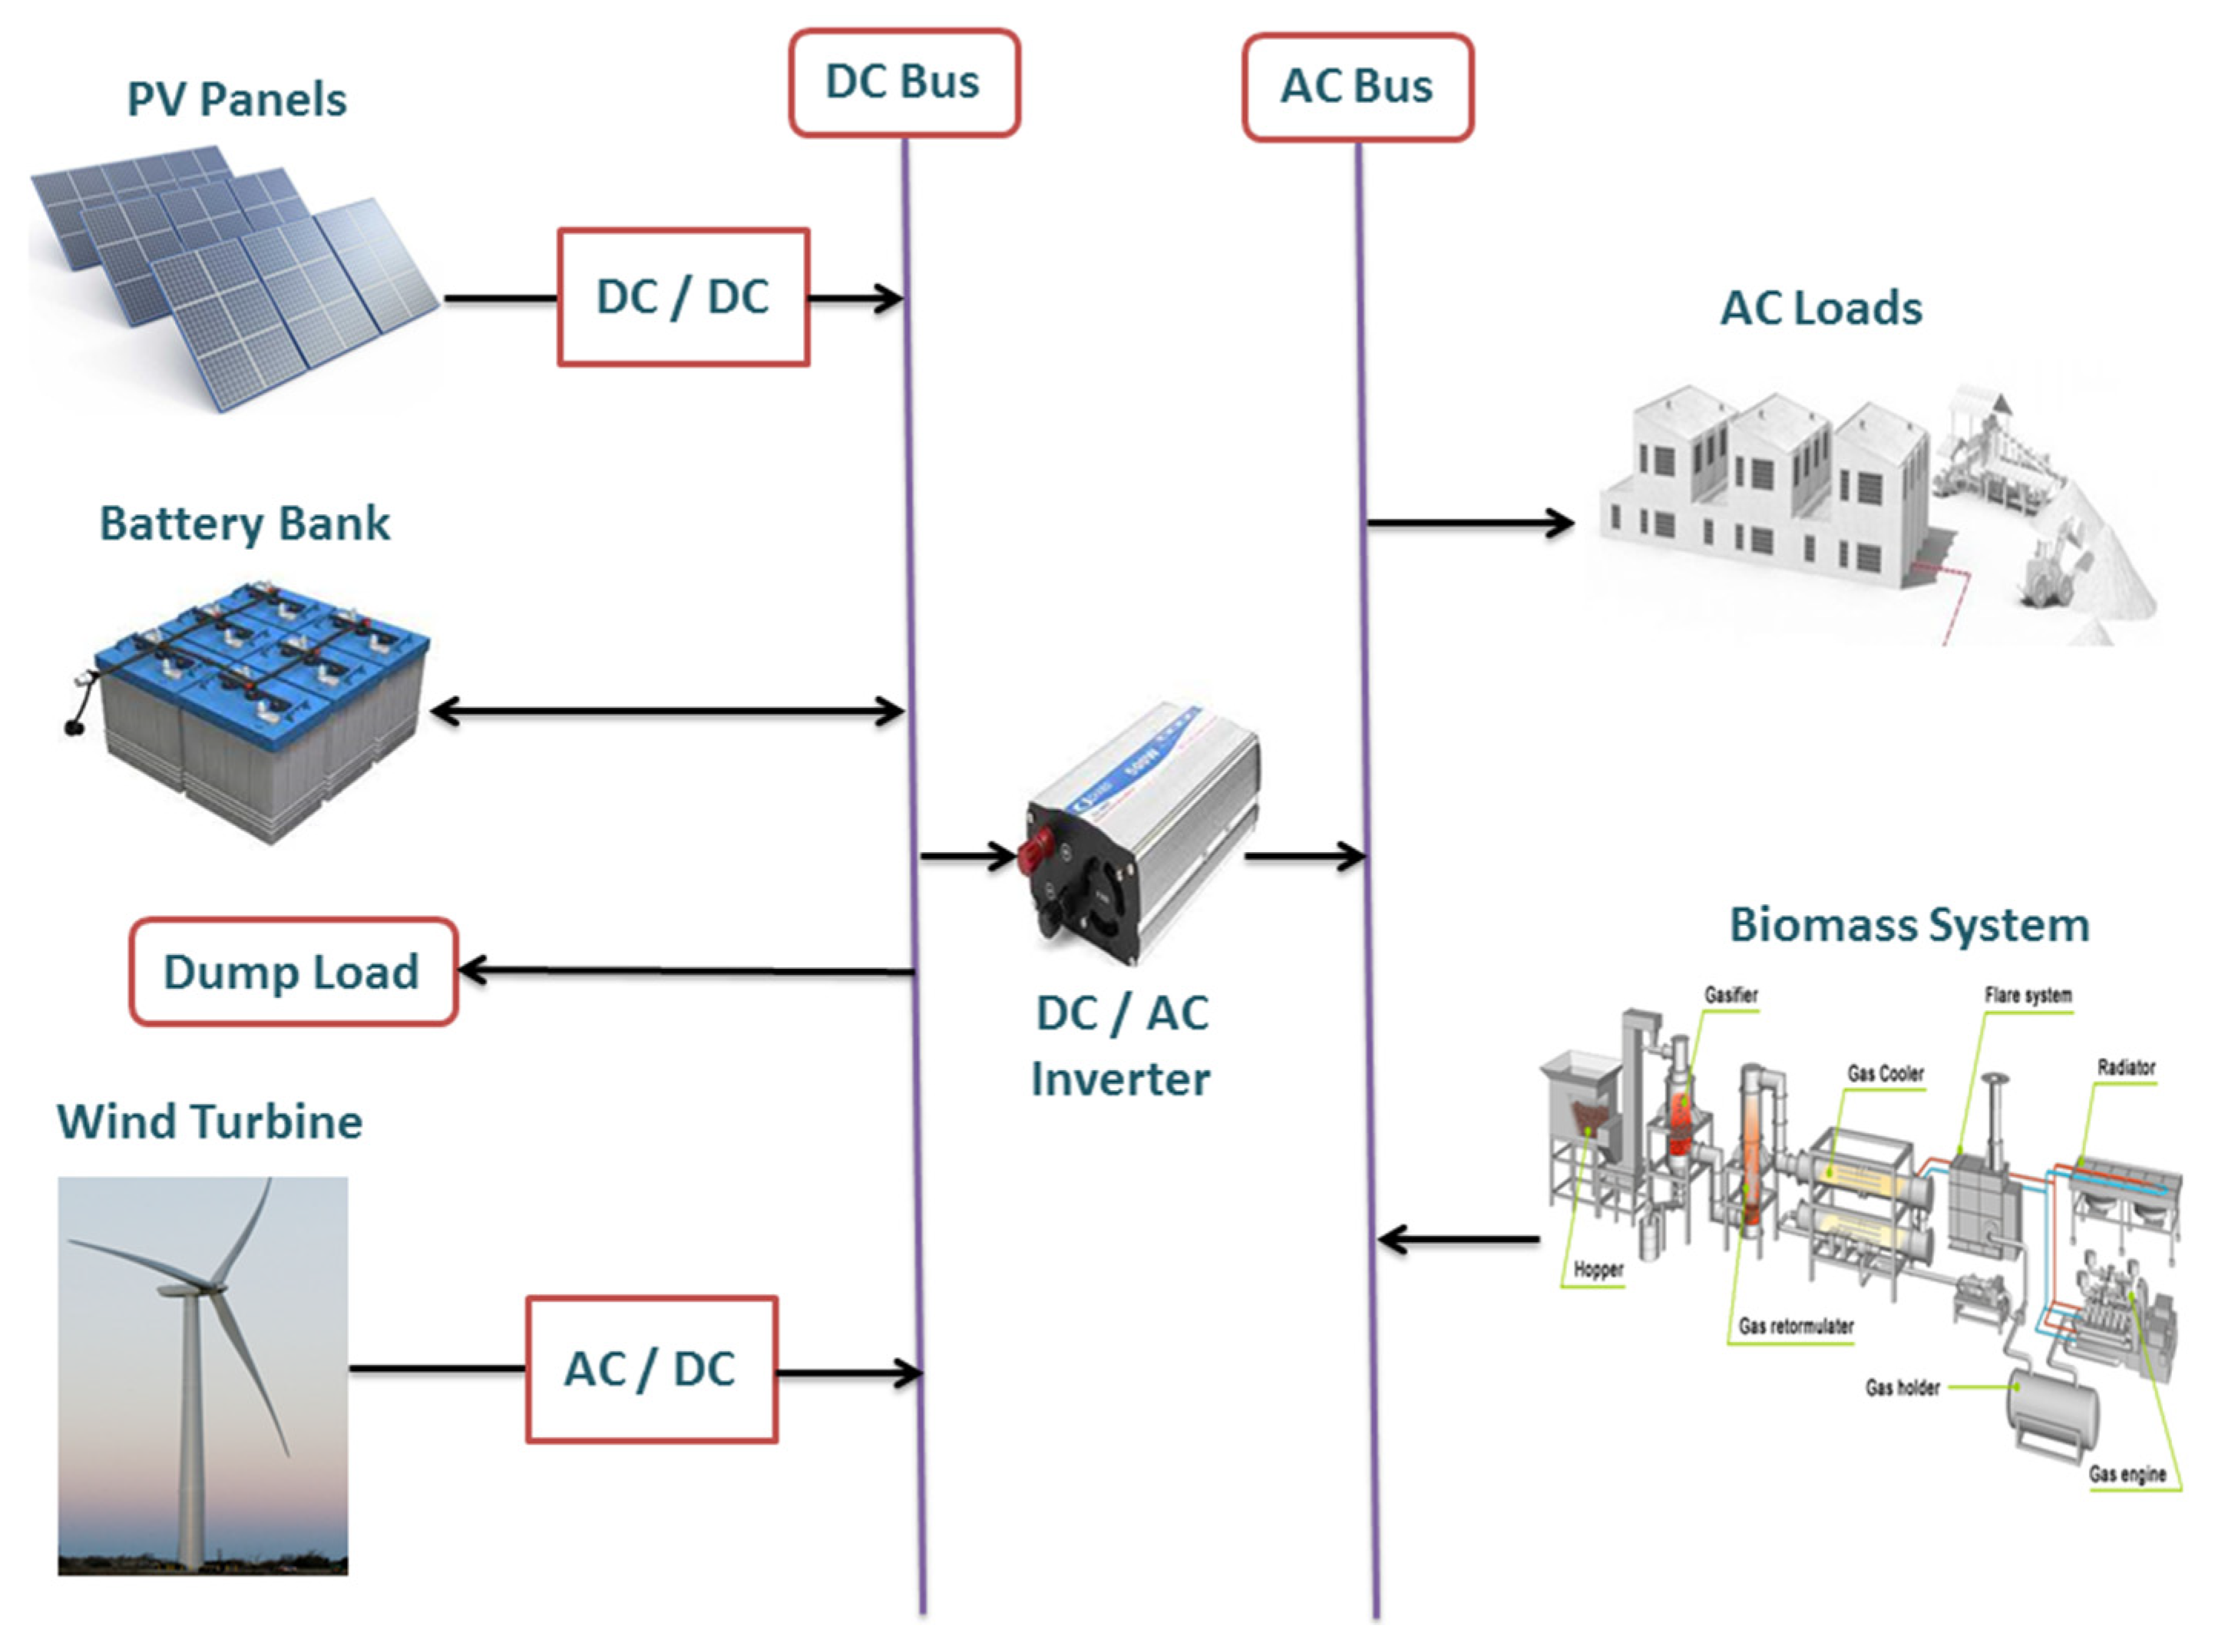
The stand-alone hybrid system considered in this paper consists of PV/WT/Biomass/Bat units. The layout of the suggested hybrid model is illustrated in Figure 1. This section explains in detail the description of the major system units and the optimization methodology of the suggested hybrid model.

Figure 1.
The architecture of the proposed stand-alone hybrid system.
2.1. Photovoltaic System (PV)
A simplified model based into account ambient temperature and solar irradiation is employed in this study to compute the energy generated by the PV panels , as indicated in the equation below [28,29].
where, indicates the rated power of the PV panel at standard test condition (STC) [kW], is the intensity of solar radiation at time (t), denote the intensity of solar radiation at standard conditions [1000 W/], is the number of PV units, is the PV module temperature coefficient [%/], is the wiring efficiency, is the PV module efficiency, is the cell temperature under at normal operating conditions, denote the ambient temperature (°C), denote the cell temperature under standard operating conditions (°C). The technical specifications of the PV panel modeling are shown in Table 1.

Table 1.
The main parameters of the selected photovoltaic model [30].
2.2. Wind Turbine
Every month, NASA supplies data on wind speed, which has been utilized as input data for this study (NASA, 2020). The following mathematical formulas are employed to calculate the wind turbine output based on a comprehensive literature review [2,31].
In which, , , , and are WT speed at time t, WT speeds cut-in, WT speeds cut-off wind speed, and rated speed respectively. denotes the number of WTs modules, is the WT efficiency, and is the rated power of the WT (kW).
Wind speed increases with height above ground level, and the wind turbine hub’s height has also a major impact on wind speed, which affects power generation, according to the below power law equation [13]:
where, represents the WT speed (m/s) at the new height (m), is the WT speed (m/s) at the original turbine hub height (m), and denotes the WT friction coefficient.
According to the International Electro technical Committee (IEC), the value of the coefficient of friction in the case of normal wind conditions is 0.20 and in the case of intensive wind conditions is 0.11. The technical specifications of the selected WT modeling are presented in Table 2.
Table 2.
The main parameters of the selected wind turbine model [30].
2.3. Biomass System
Biomass comprises of the stored chemical energy from solar energy, so biomass can be used for heating by direct burning or transformed through many operations into liquid fuels and renewable gases [32,33]. One of the major aspects in determining the type of technology used to generate biomass energy is the type of biomass to be used and the type of fuel to be produced from the conversion process [34].
In this work, biomass gasification is the conversion process used which is a pyrolysis process in which the raw materials of biomass are heated in closed and pressurized vessels, the output gaseous fuel by this process is usually called the producer gas [35].
In this study, sugarcane bagasse was used as a raw material for biomass to feed a small-scale downdraft gasifier, as the cane crop is one of the agricultural crops available in the New Valley city. The biomass generator was utilized as the primary generator to satisfy the electrical load requirement beside the PV and WT systems, the technical characteristics of the biomass system are illustrated in Table 3. The hourly generated power from the biomass system can be expressed according to the following mathematical formula [25,27];
where, is the biomass raw material rate per hour (kg/h), indicates the higher heat value of the biomass raw material, denotes the efficiency of the gasifier reactor (75%), and represents a factor for converting units from kJ to kWh (27.78 ).
Table 3.
The main parameters characteristics of the biomass system.
The load ratio of the considered biomass generator is set to operate at no less than 30% ( = 30%) of its rated capacity to avoid running at much lower demands, while its maximum load is 80% ( = 80%) of its rated capacity. The generator output power () can be described according to the following constraints [25,27,36];
Based on the previous mathematical expressions, is the average fuel consumption per hour, and () is the annual energy output which can be computed as following;
where, is the number of generators.
2.4. Battery Bank Model
The battery bank serving as a backup system of storing energy in the event that the renewable sources are unable to deliver the needed power. The hourly total power generated by the PV, WTs, and biomass system is obtained based on the below equation [19,25];
The technical specifications of the battery bank model are illustrated in Table 4. The following equations explain the energy production and consumption of the battery system from time t–1 to time t [30,38];
Table 4.
The main parameters characteristics of the batter bank.
In which, and indicate the battery charging and discharging efficiencies, respectively, is self-discharge rate, and is the battery state of charge. denotes the inverter efficiency.
2.5. Bi-Directional Converter Model
A bidirectional transducer is adopted to maintain power flow between DC and AC components. There are two kinds of power conversion devices in a power system, the inverter which converts DC current to AC current and the rectifier which converts AC current to DC current. The technical characteristics of the inverter model are presented in Table 5. The hourly input power of the inverter can be expressed as below [16];
Table 5.
The main parameters characteristics of the inverter.
In which, represents the inverter efficiency.
3. Description of the Studied Area
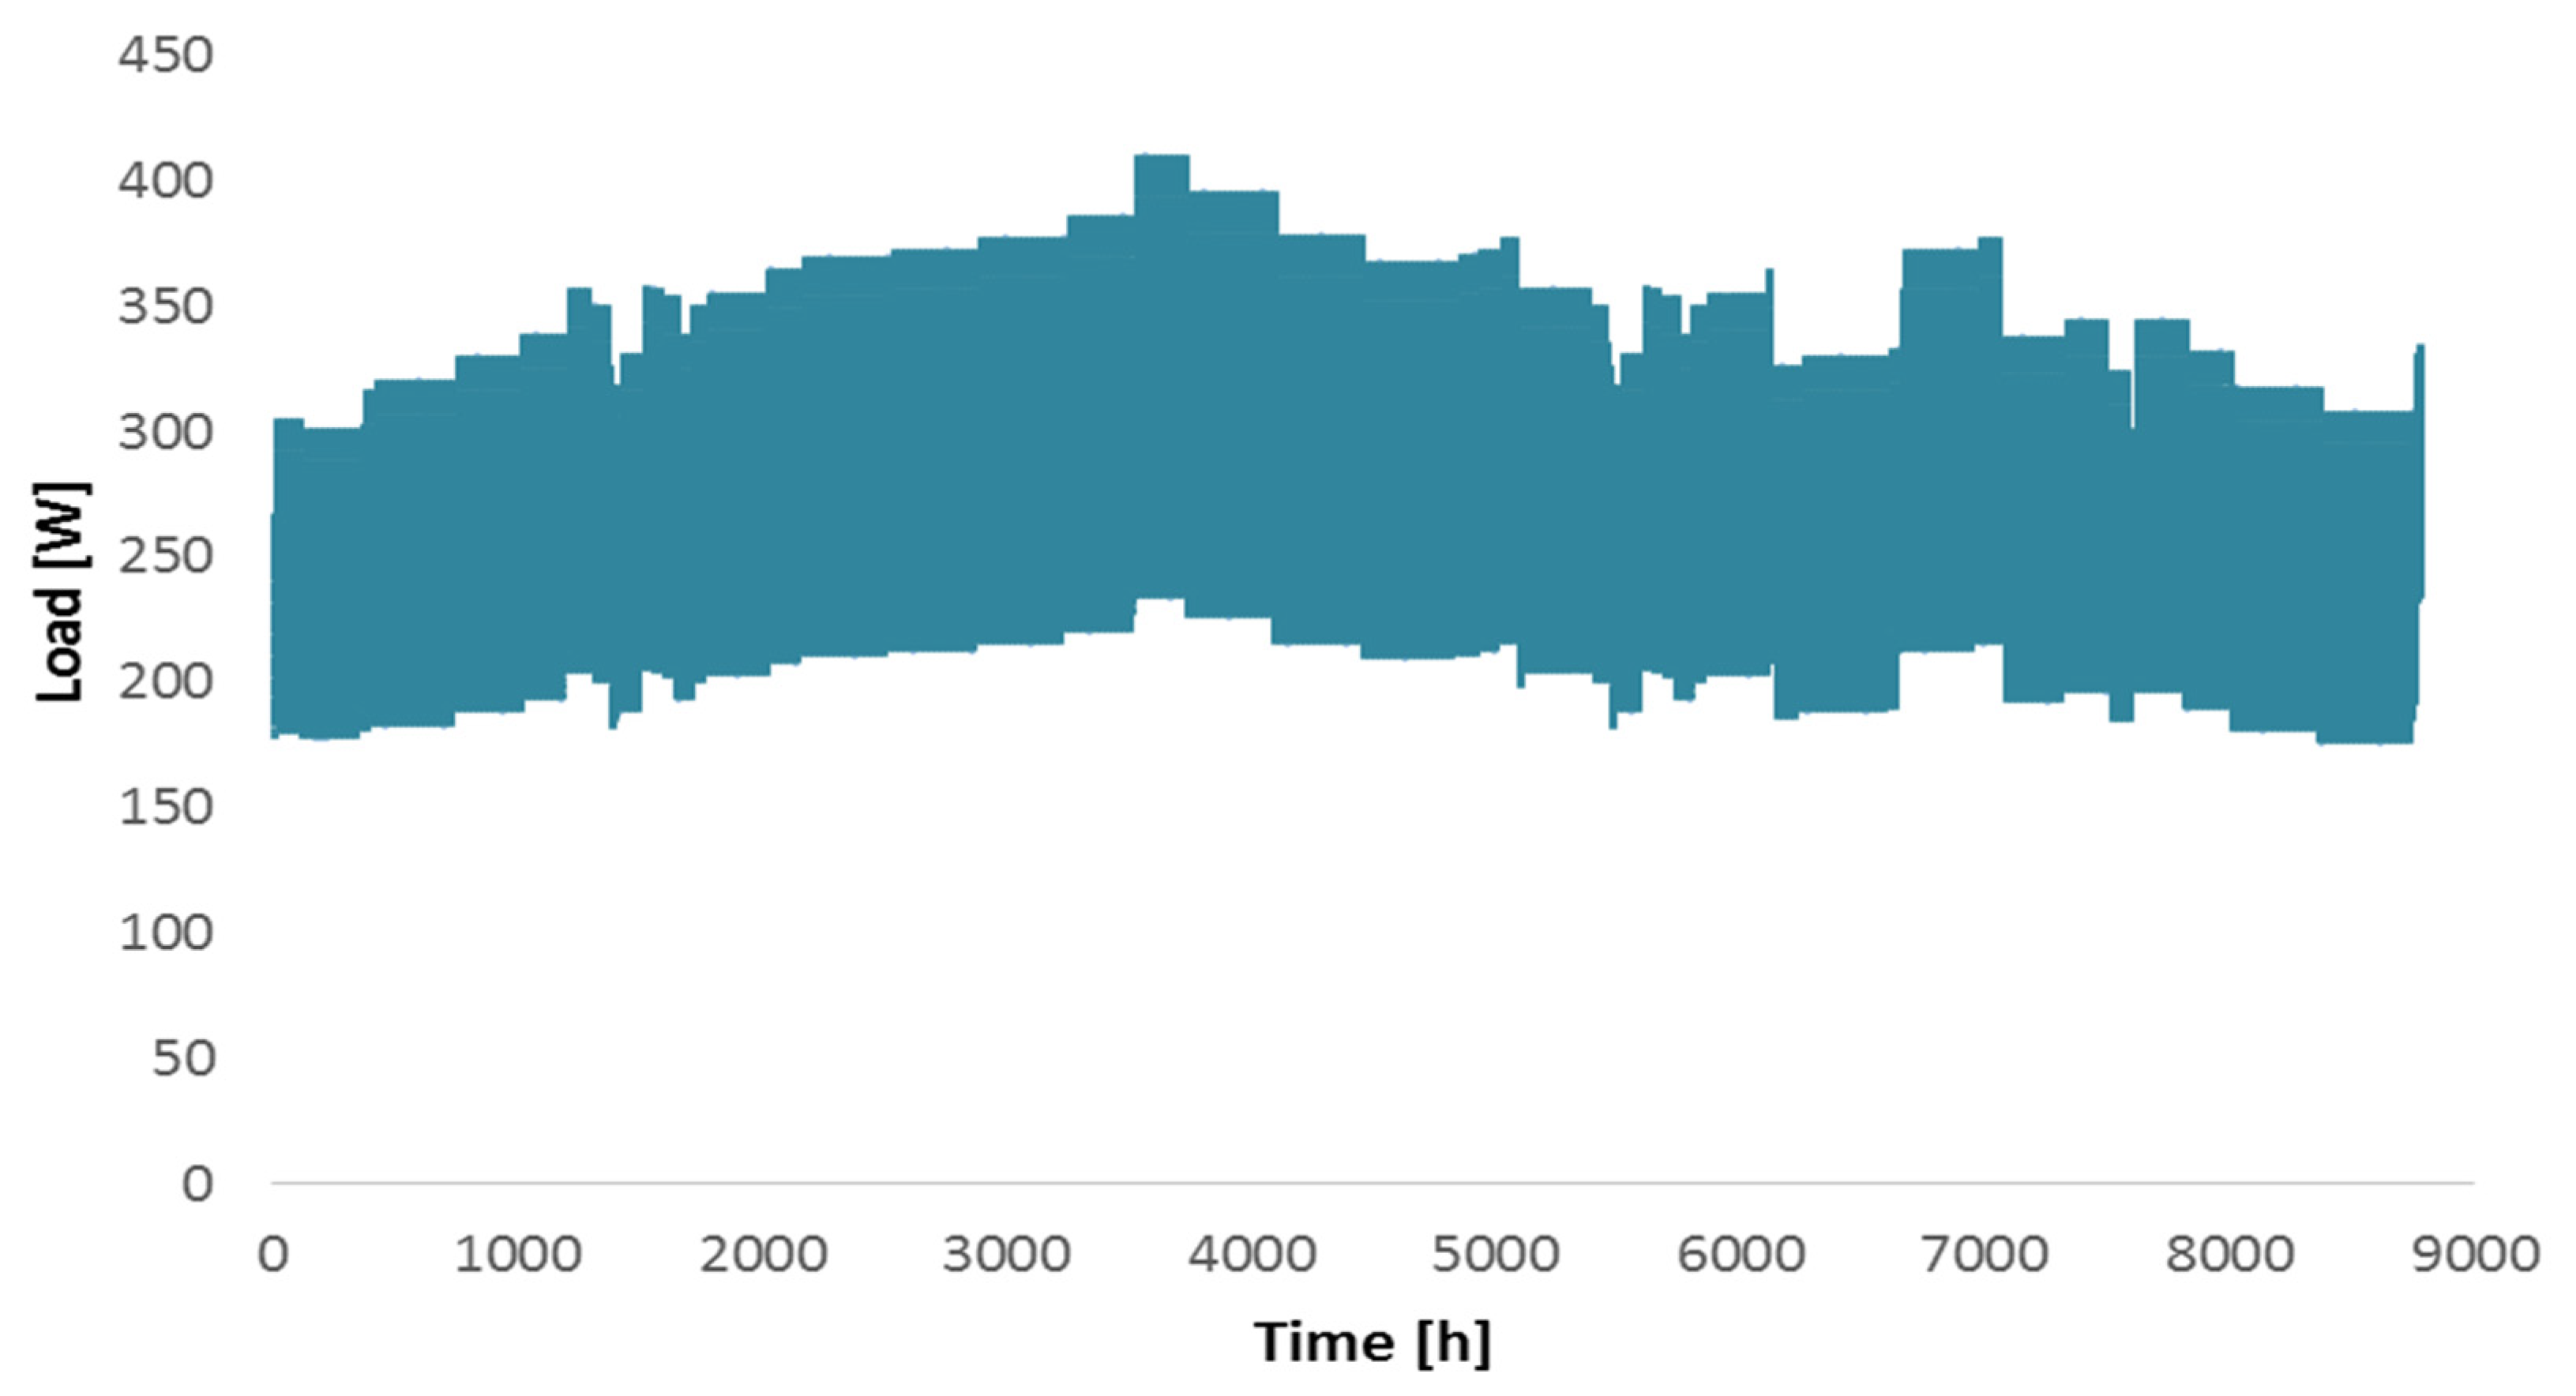
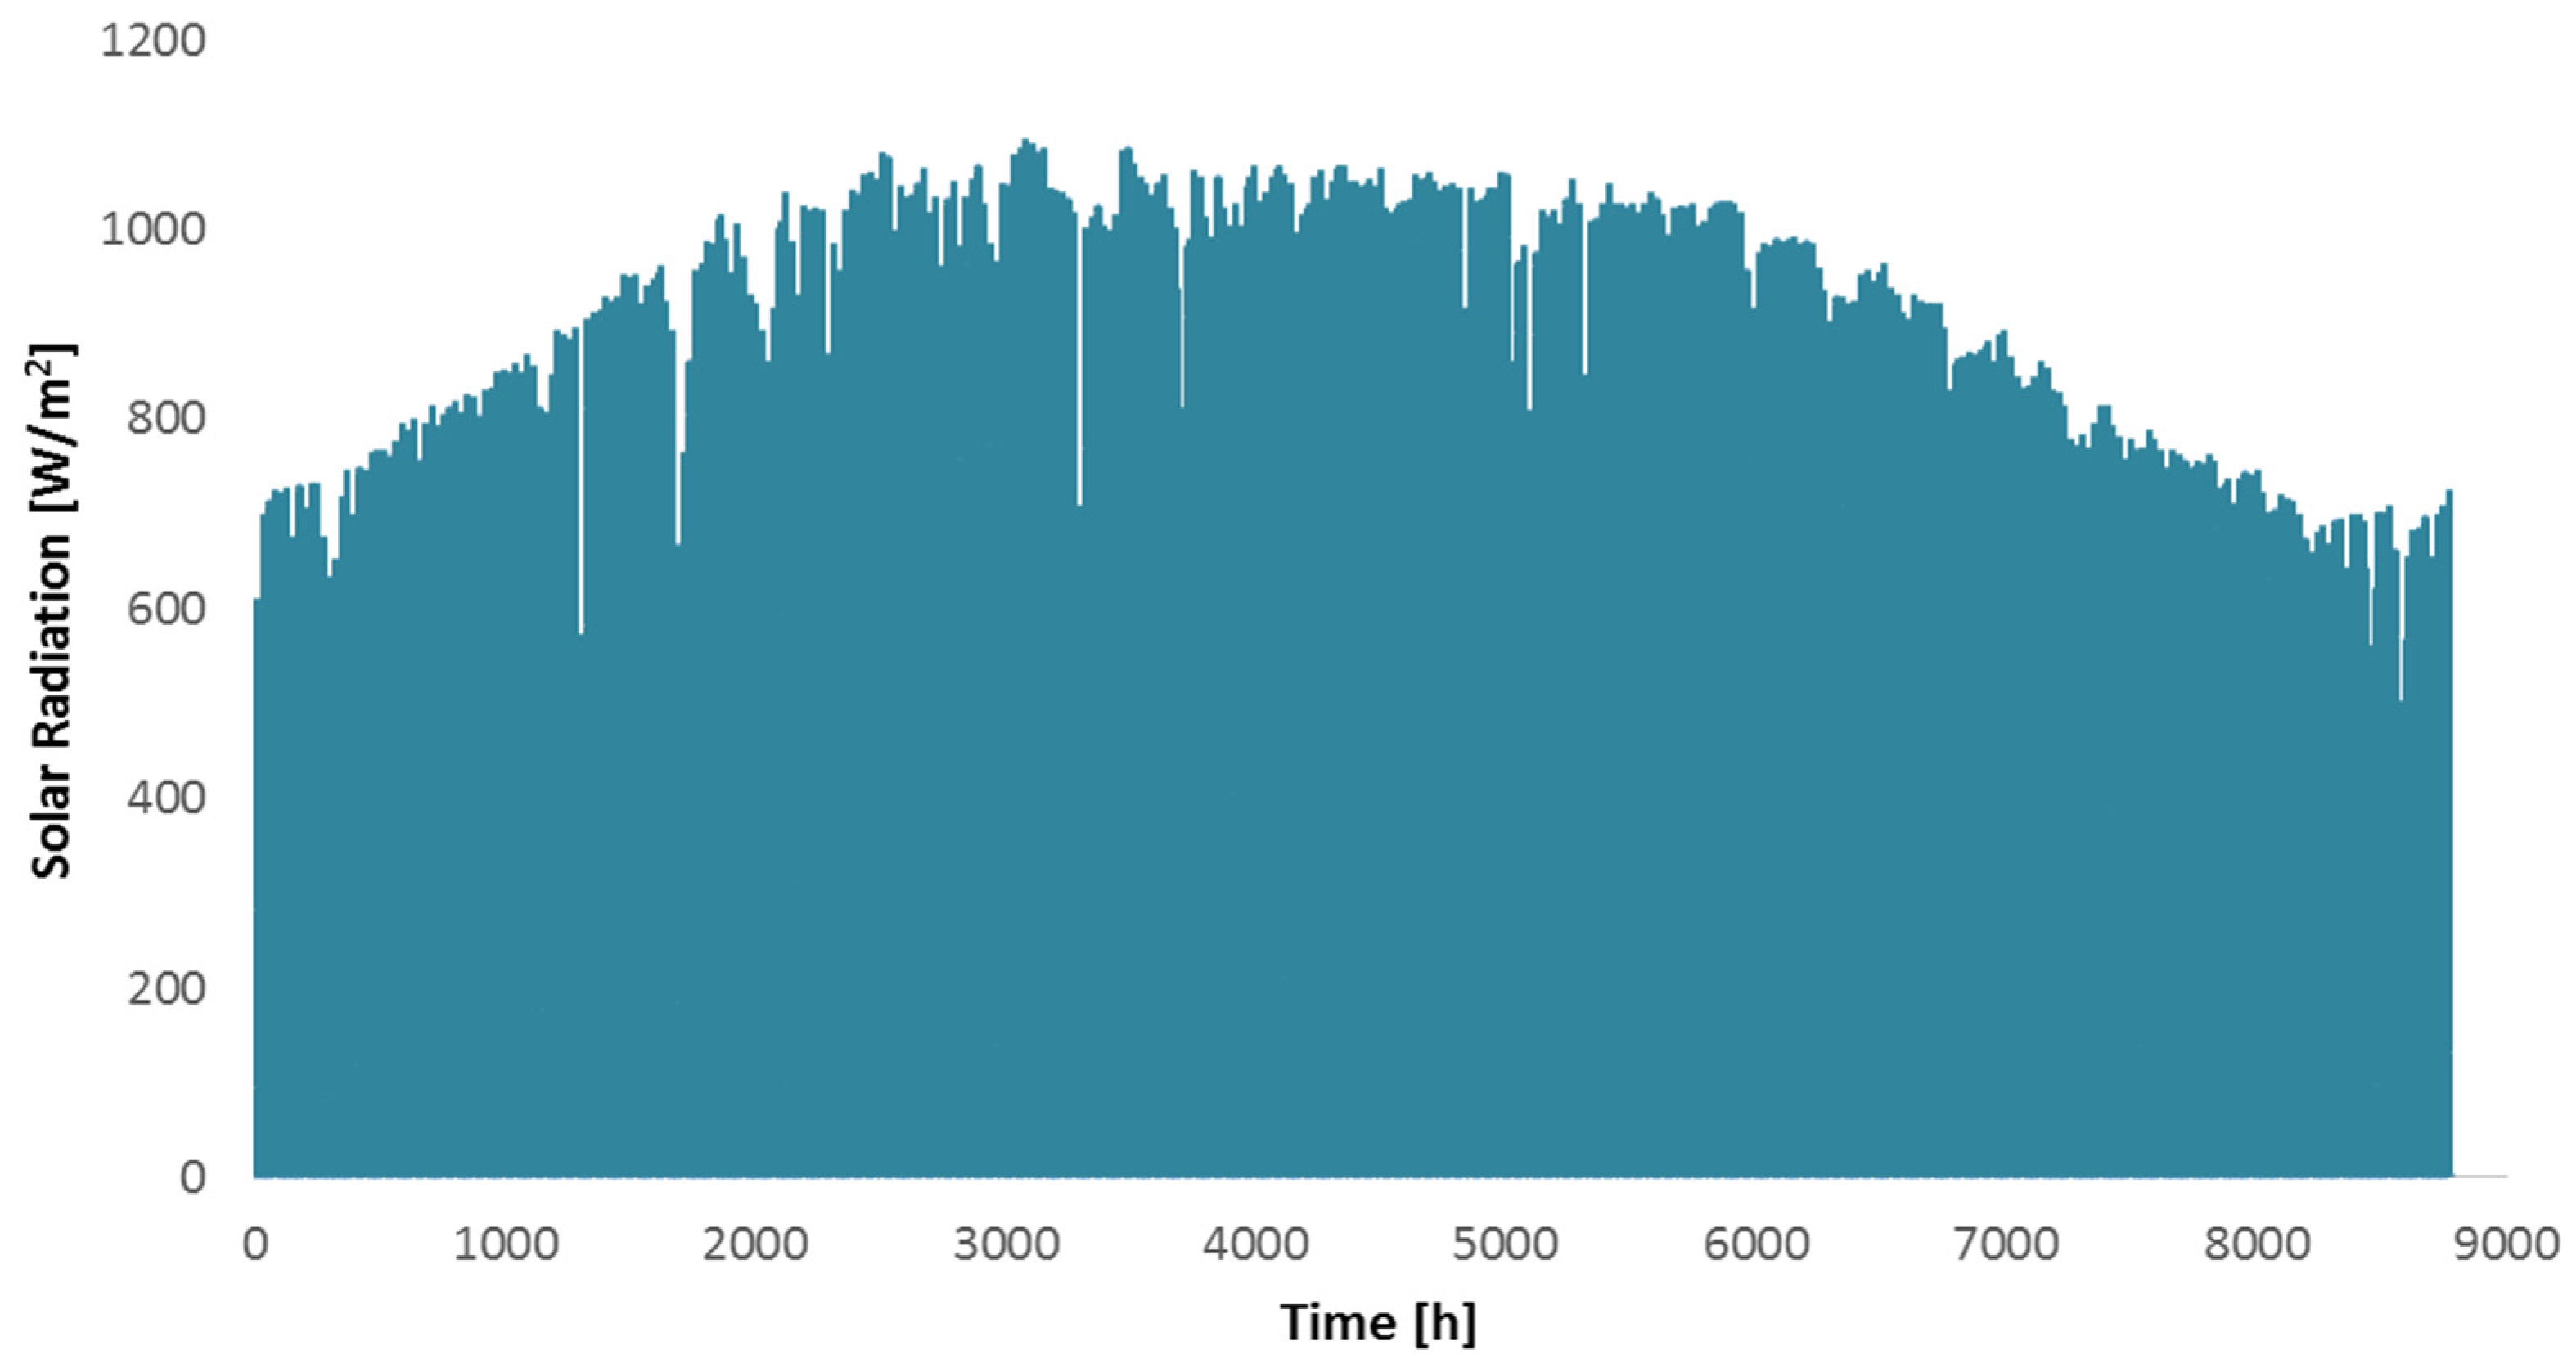
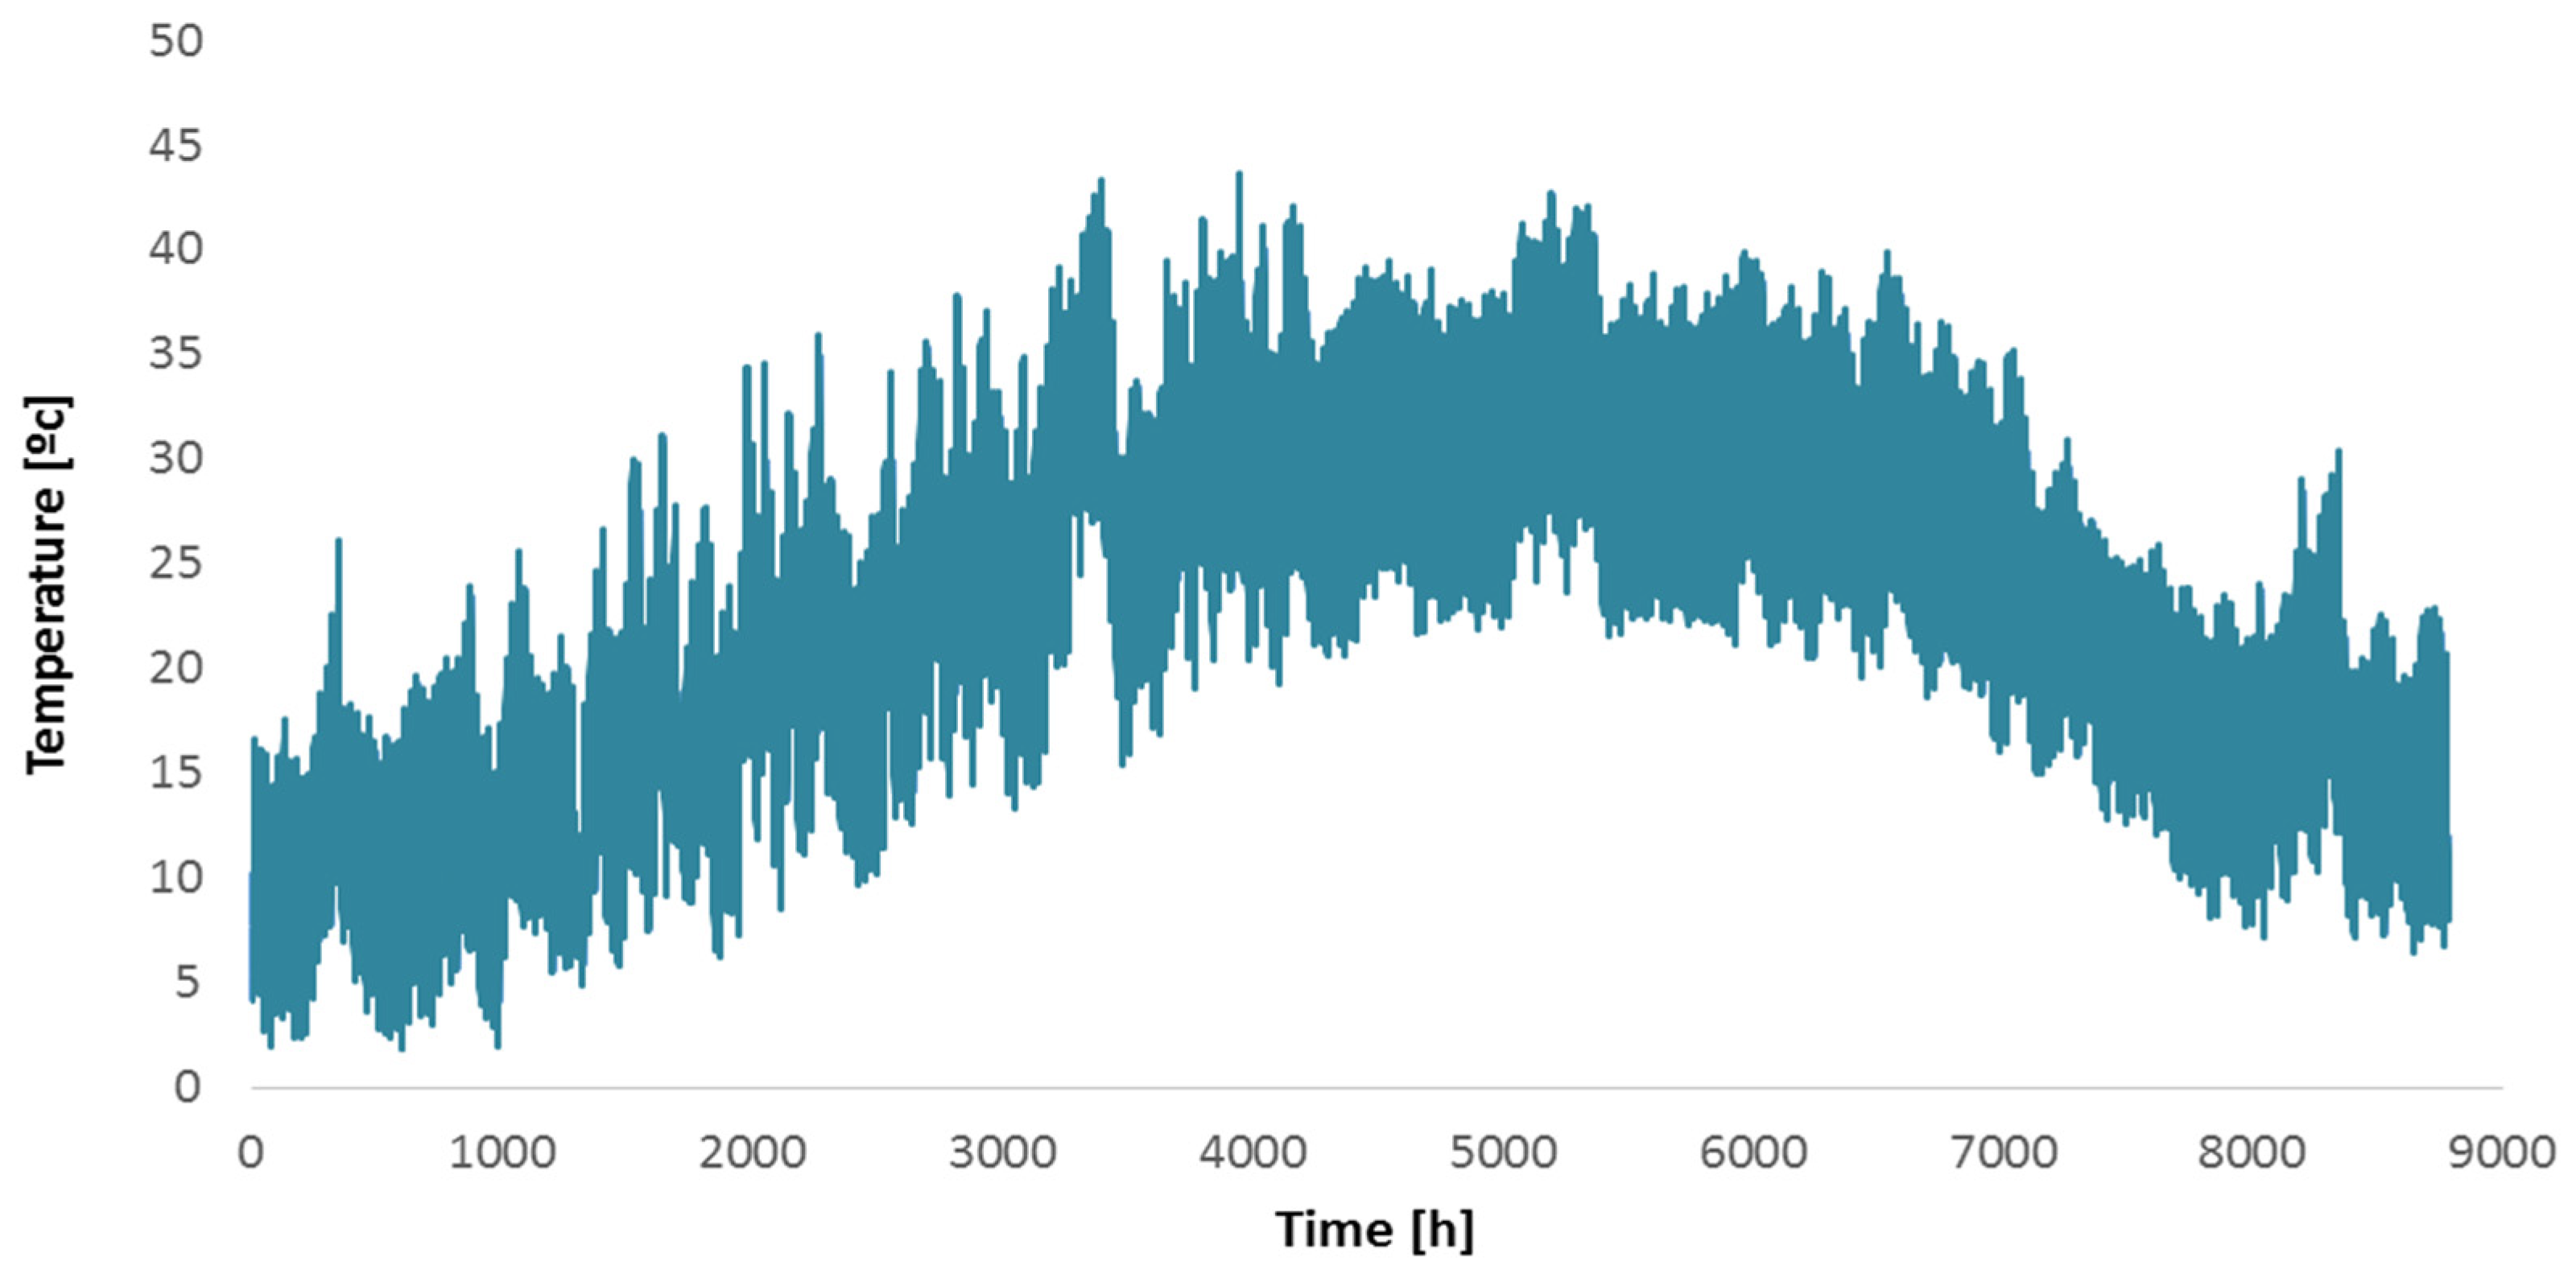
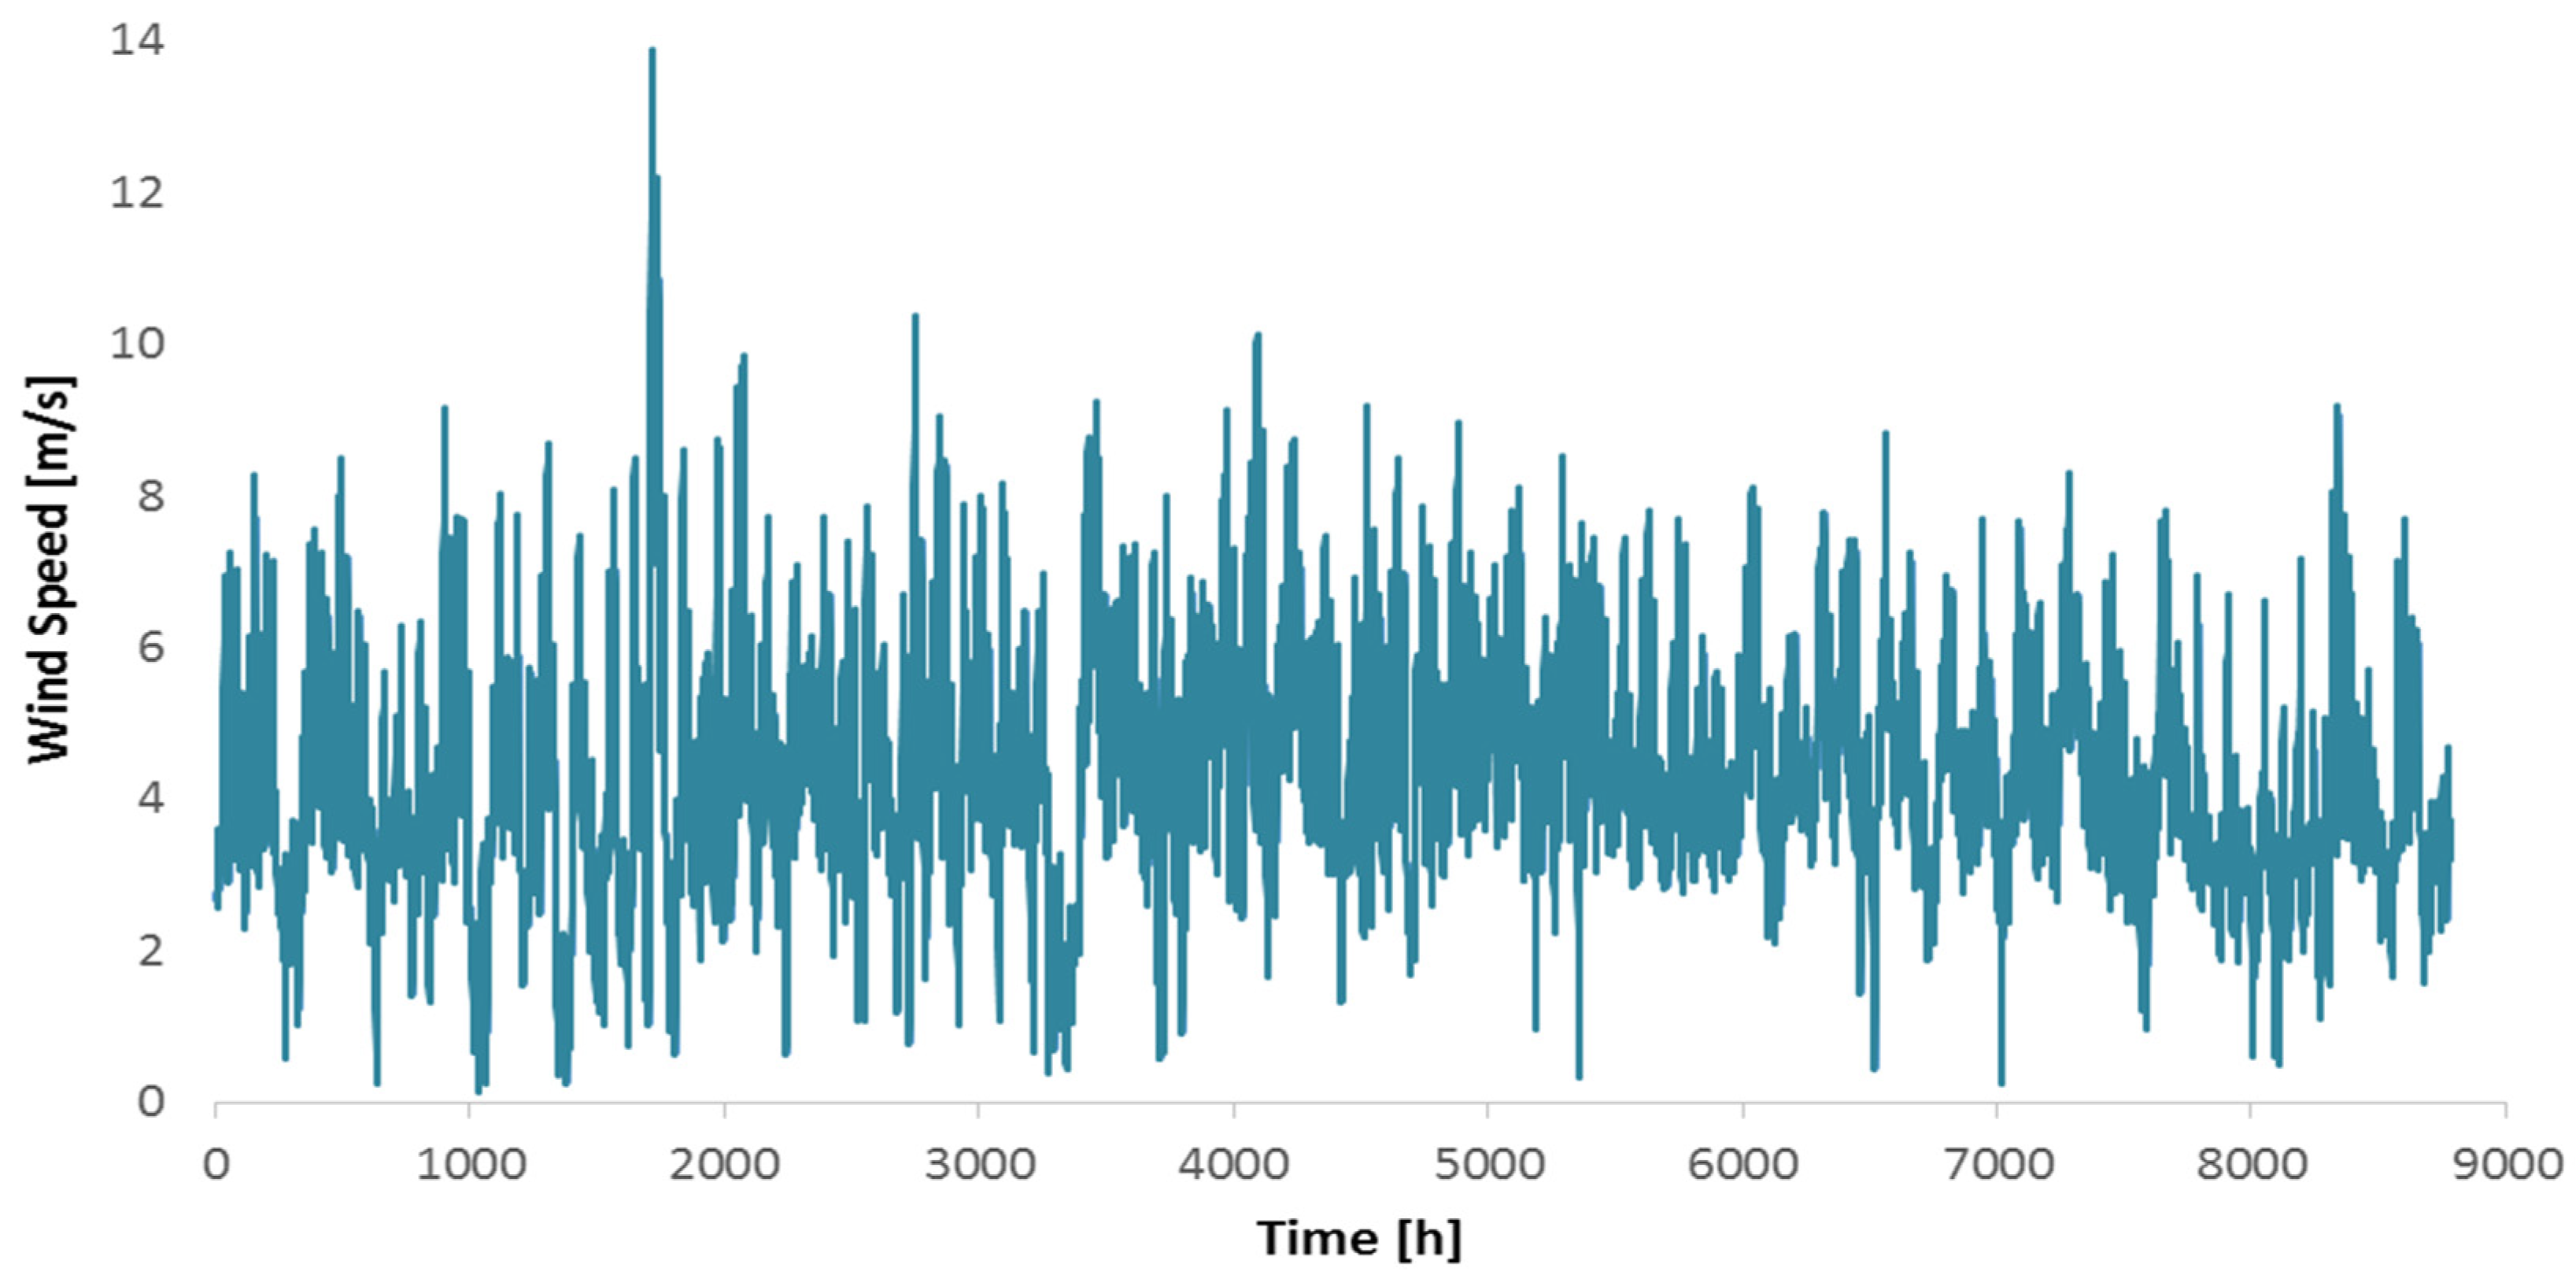
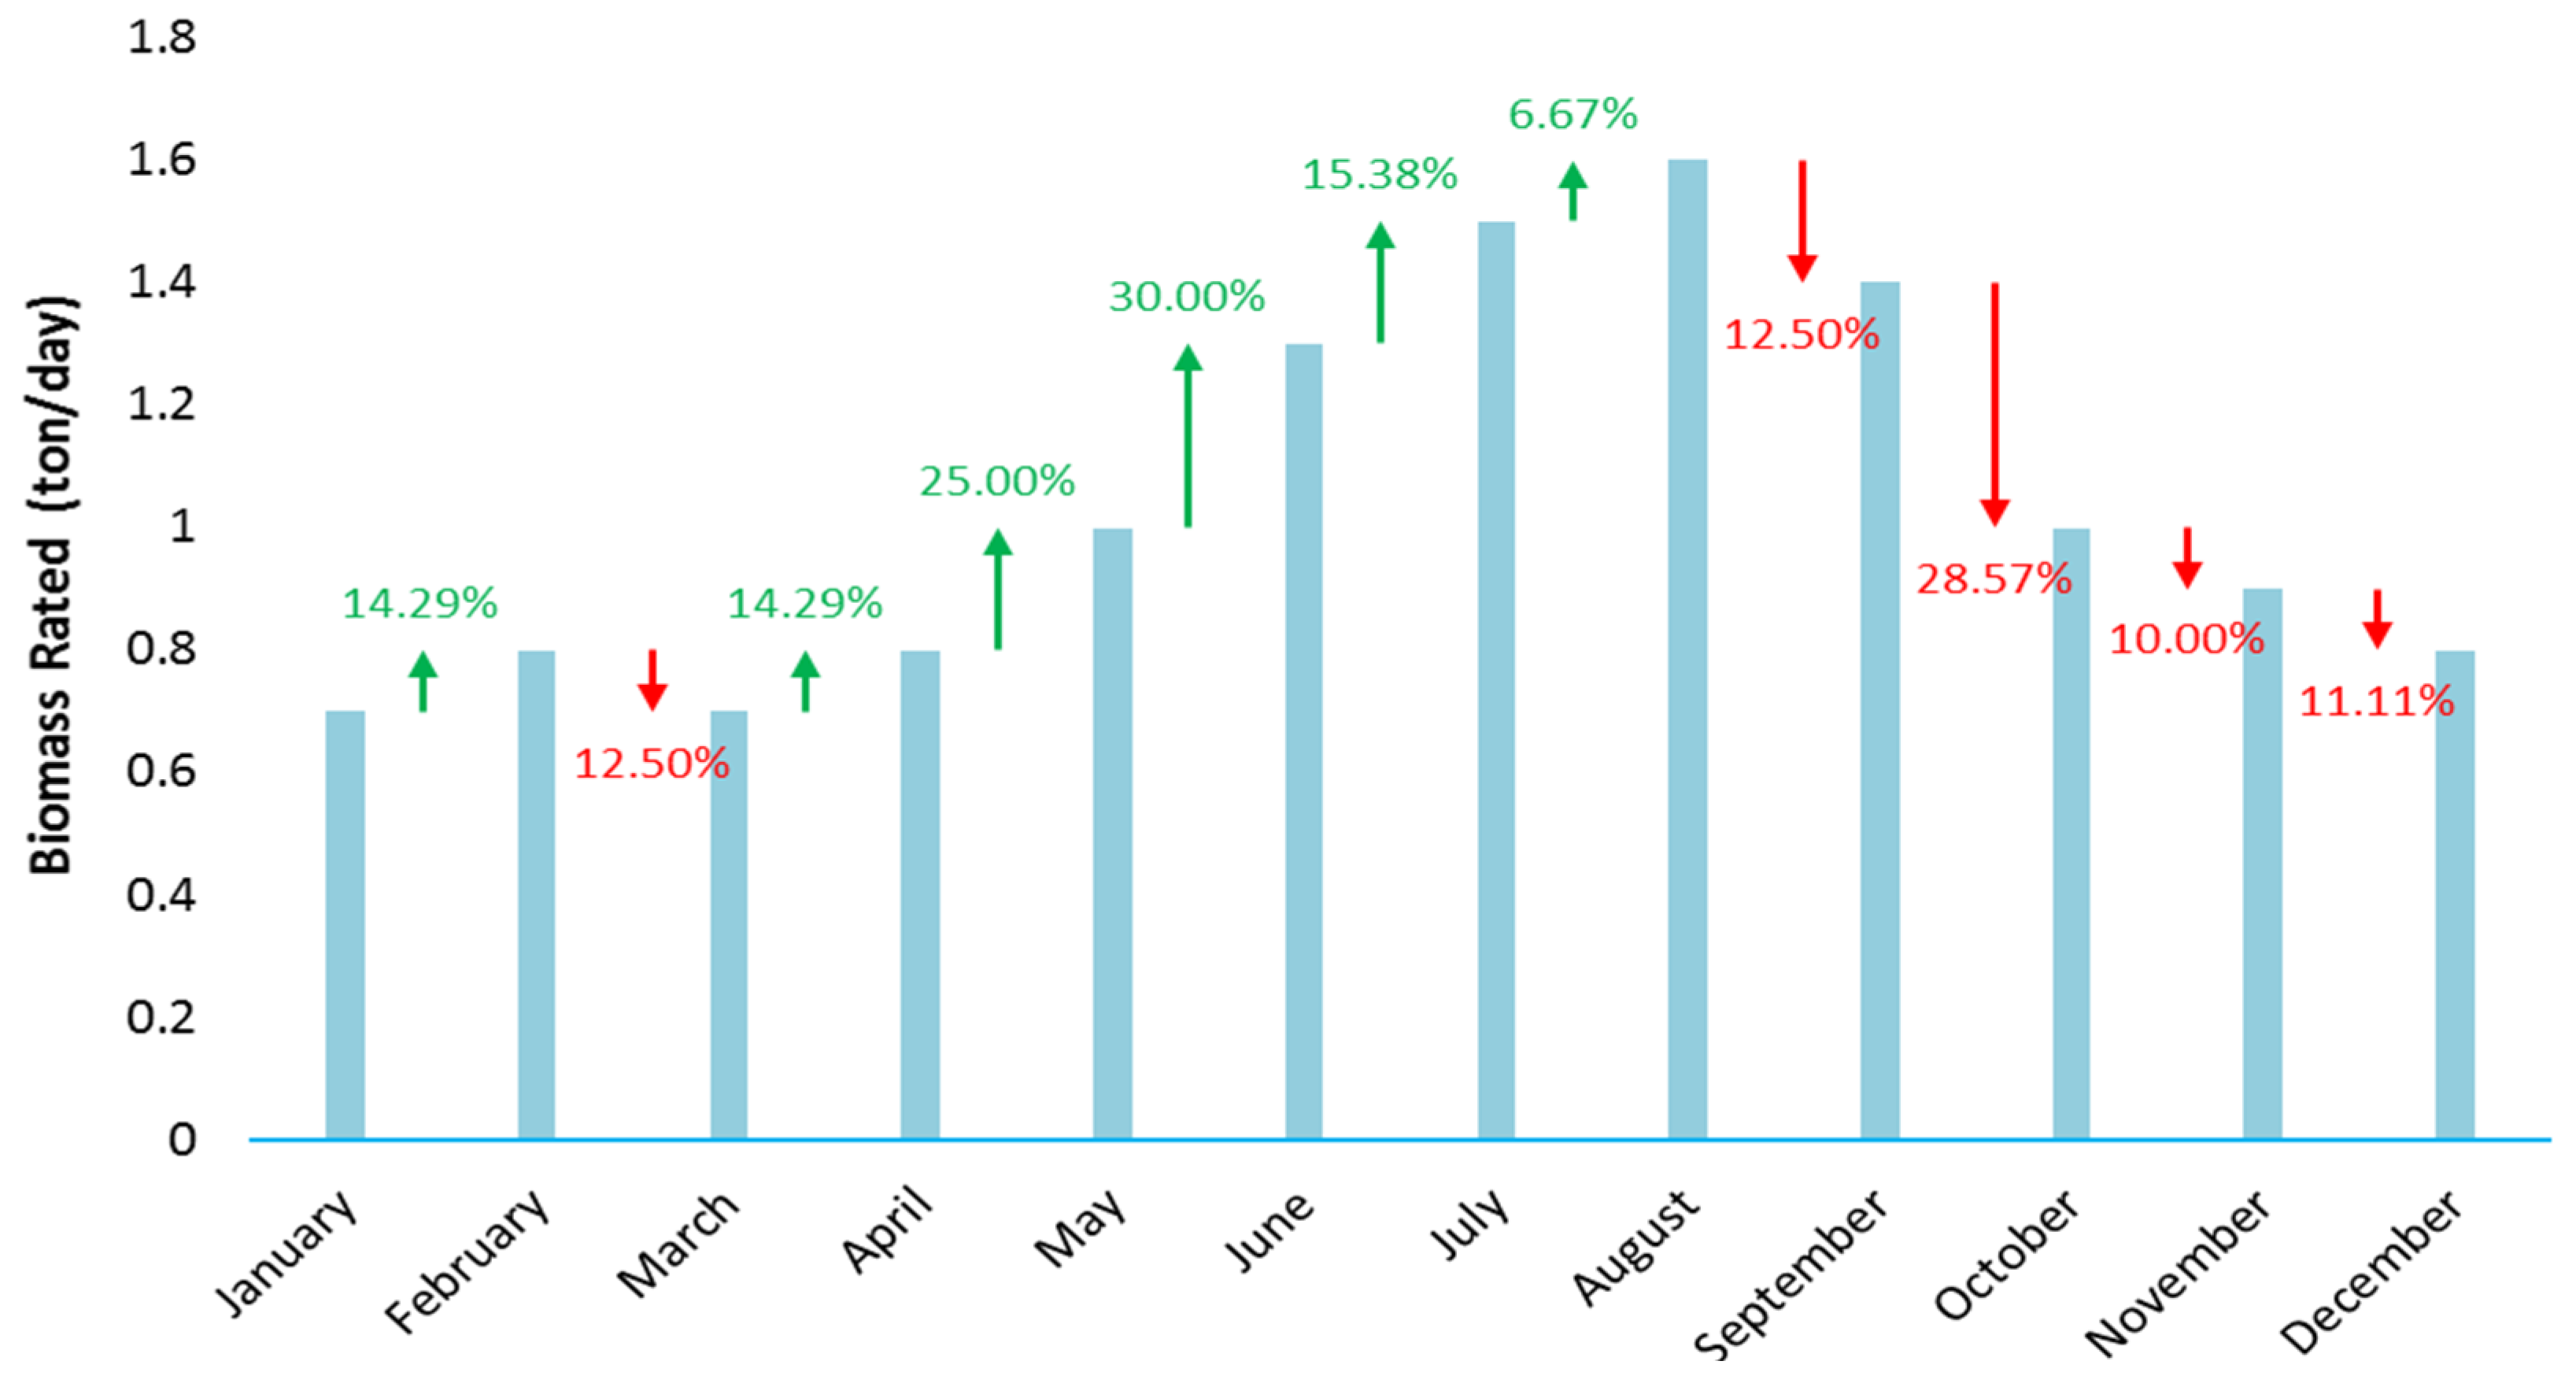
The considered area for this study is Alrashda village, which is located 10 km northwest of Mut town, the administrative center of the Dakhla Oasis in the New Valley Governorate in Egypt, at 28.938° east longitude, 25.576° north latitude, and an altitude of 243 m. The reason of choosing this village because of its comparatively high solar, wind, and biomass energy potential. The proposed mathematical model is used for designing a small scale stand-alone hybrid system to feed a range of loads which are represented in residential loads, where the peak loads are occurred during the summer and in the evening period from 19:00 to 23:00 p.m. In Figure 2, the profile of the proposed loads during a year is depicted, which shows that the average residential load of the village has reached about 260 kW, with a maximum load of 410 kW. Figure 3, Figure 4 and Figure 5 illustrate the plot of hourly data of the solar radiation, temperature, and wind speed which are obtained from the NASA Surface Meteorology and Solar Energy website for 20 years for the selected area. Figure 3 presents the short-wave solar irradiance of the studied area during a year, where the yearly radiation rate is between 2.45 kWh//day to 10.94 kWh//day, with the average yearly radiation on this site’s horizontal surface is around 6.89 kWh//day, while the yearly ambient temperature of the selected site is indicated in Figure 4, which showed that the maximum ambient temperature can be reached, is 40°. Figure 5 illustrates the annual wind speed for the selected location with a maximum wind speed of about 13.9 m/s and an average in the range from 8.71 m/s to 9.89 m/s. As previously mentioned, the biomass feedstock used in this study was the sugarcane bagasse. The sugar cane crop is considered one of the strategic crops in Egypt, where the harvest period begins during January of each year and extends until May. The amount of biomass feedstock available at the selected site was assumed to have a variable values over the year, the monthly biomass consumption rate is presented in Figure 6, with an average of one ton/day.

Figure 2.
Load profile of the studied area.

Figure 3.
The annual short-wave solar irradiance of the studied area.

Figure 4.
The yearly ambient temperature of the studied area.

Figure 5.
The yearly wind speed of the studied area.

Figure 6.
The biomass consumption of the studied area.
4. Optimization Problem
The primary aim of this work is to indicate the capacity to optimize the suggested stand-alone hybrid power system in order to provide a guaranteed supply of power at the lowest feasible cost. In this section, the economic and cost analysis, the main objective function, the optimization constraints, and system management strategy are discussed.
4.1. Economic and Cost Analysis
The COE for a specific system is an economic evaluation of the system’s costs and of the associated cost in its lifespan. The COE is a function of the , it actually helps to select the lowest energy prices from different feasible hybrid configurations, which means the least overall investment cost in a renewable power system plant, after fulfilling the energy dependability limitations. While the represents the current value of the capital investment and operating costs over the lifespan. The and the COE in ($/kWh) can be computed as follows [3,30]:
where, is the total annual cost of the proposed hybrid system, and is the capital recovery factor, which is a ratio for the current cash value calculation and it can be estimated over a lifespan of years ( = 25 years) and an interest rate ( = 6%). and are modeled as:
where, is the annual cost of each unit, is the total annualized cost of each unit, is the operation and maintenance cost of each unit, is the replacement cost for each unit, and is the annual fuel cost of the biomass unite which is computed by applying the following formula [25,27]:
where, is biomass fuel cost, and is the total feedstock consumption of the generator (kg/year).
4.2. Objective Function
The aim is to create the optimal combination of units for the hybrid renewable energy system to achieve maximum energy supply. To achieve this aim, the COE is minimized, high power supply reliability is maintained, the LPSP is minimized, excess power () absorption is reduced dummy load () to reduce the total system costs. To calculate this objective functions, the following formulas are applied:
where, is the weight factor value of each objective function, represents the control variables of the optimization problem that must be optimized using the studied optimization algorithms, and LPS(t) is the loss of power supply at any time.
4.3. Constraints
The optimization procedure is based on the following limitations and on the upper and lower limit of the following decision variables;
where, is the maximum number of PV, and represent the maximum number of WTs units, based on the maximum load and rated power of PV/wind unit, which set to be 410 (410 kW/1 kW) and 13 (410 kW/30 kW), respectively. is the maximum number of generator units which set to be 8 (410 kW/50 kW), is the maximum number of batteries which is set to be 1000.
4.4. System Management Strategy
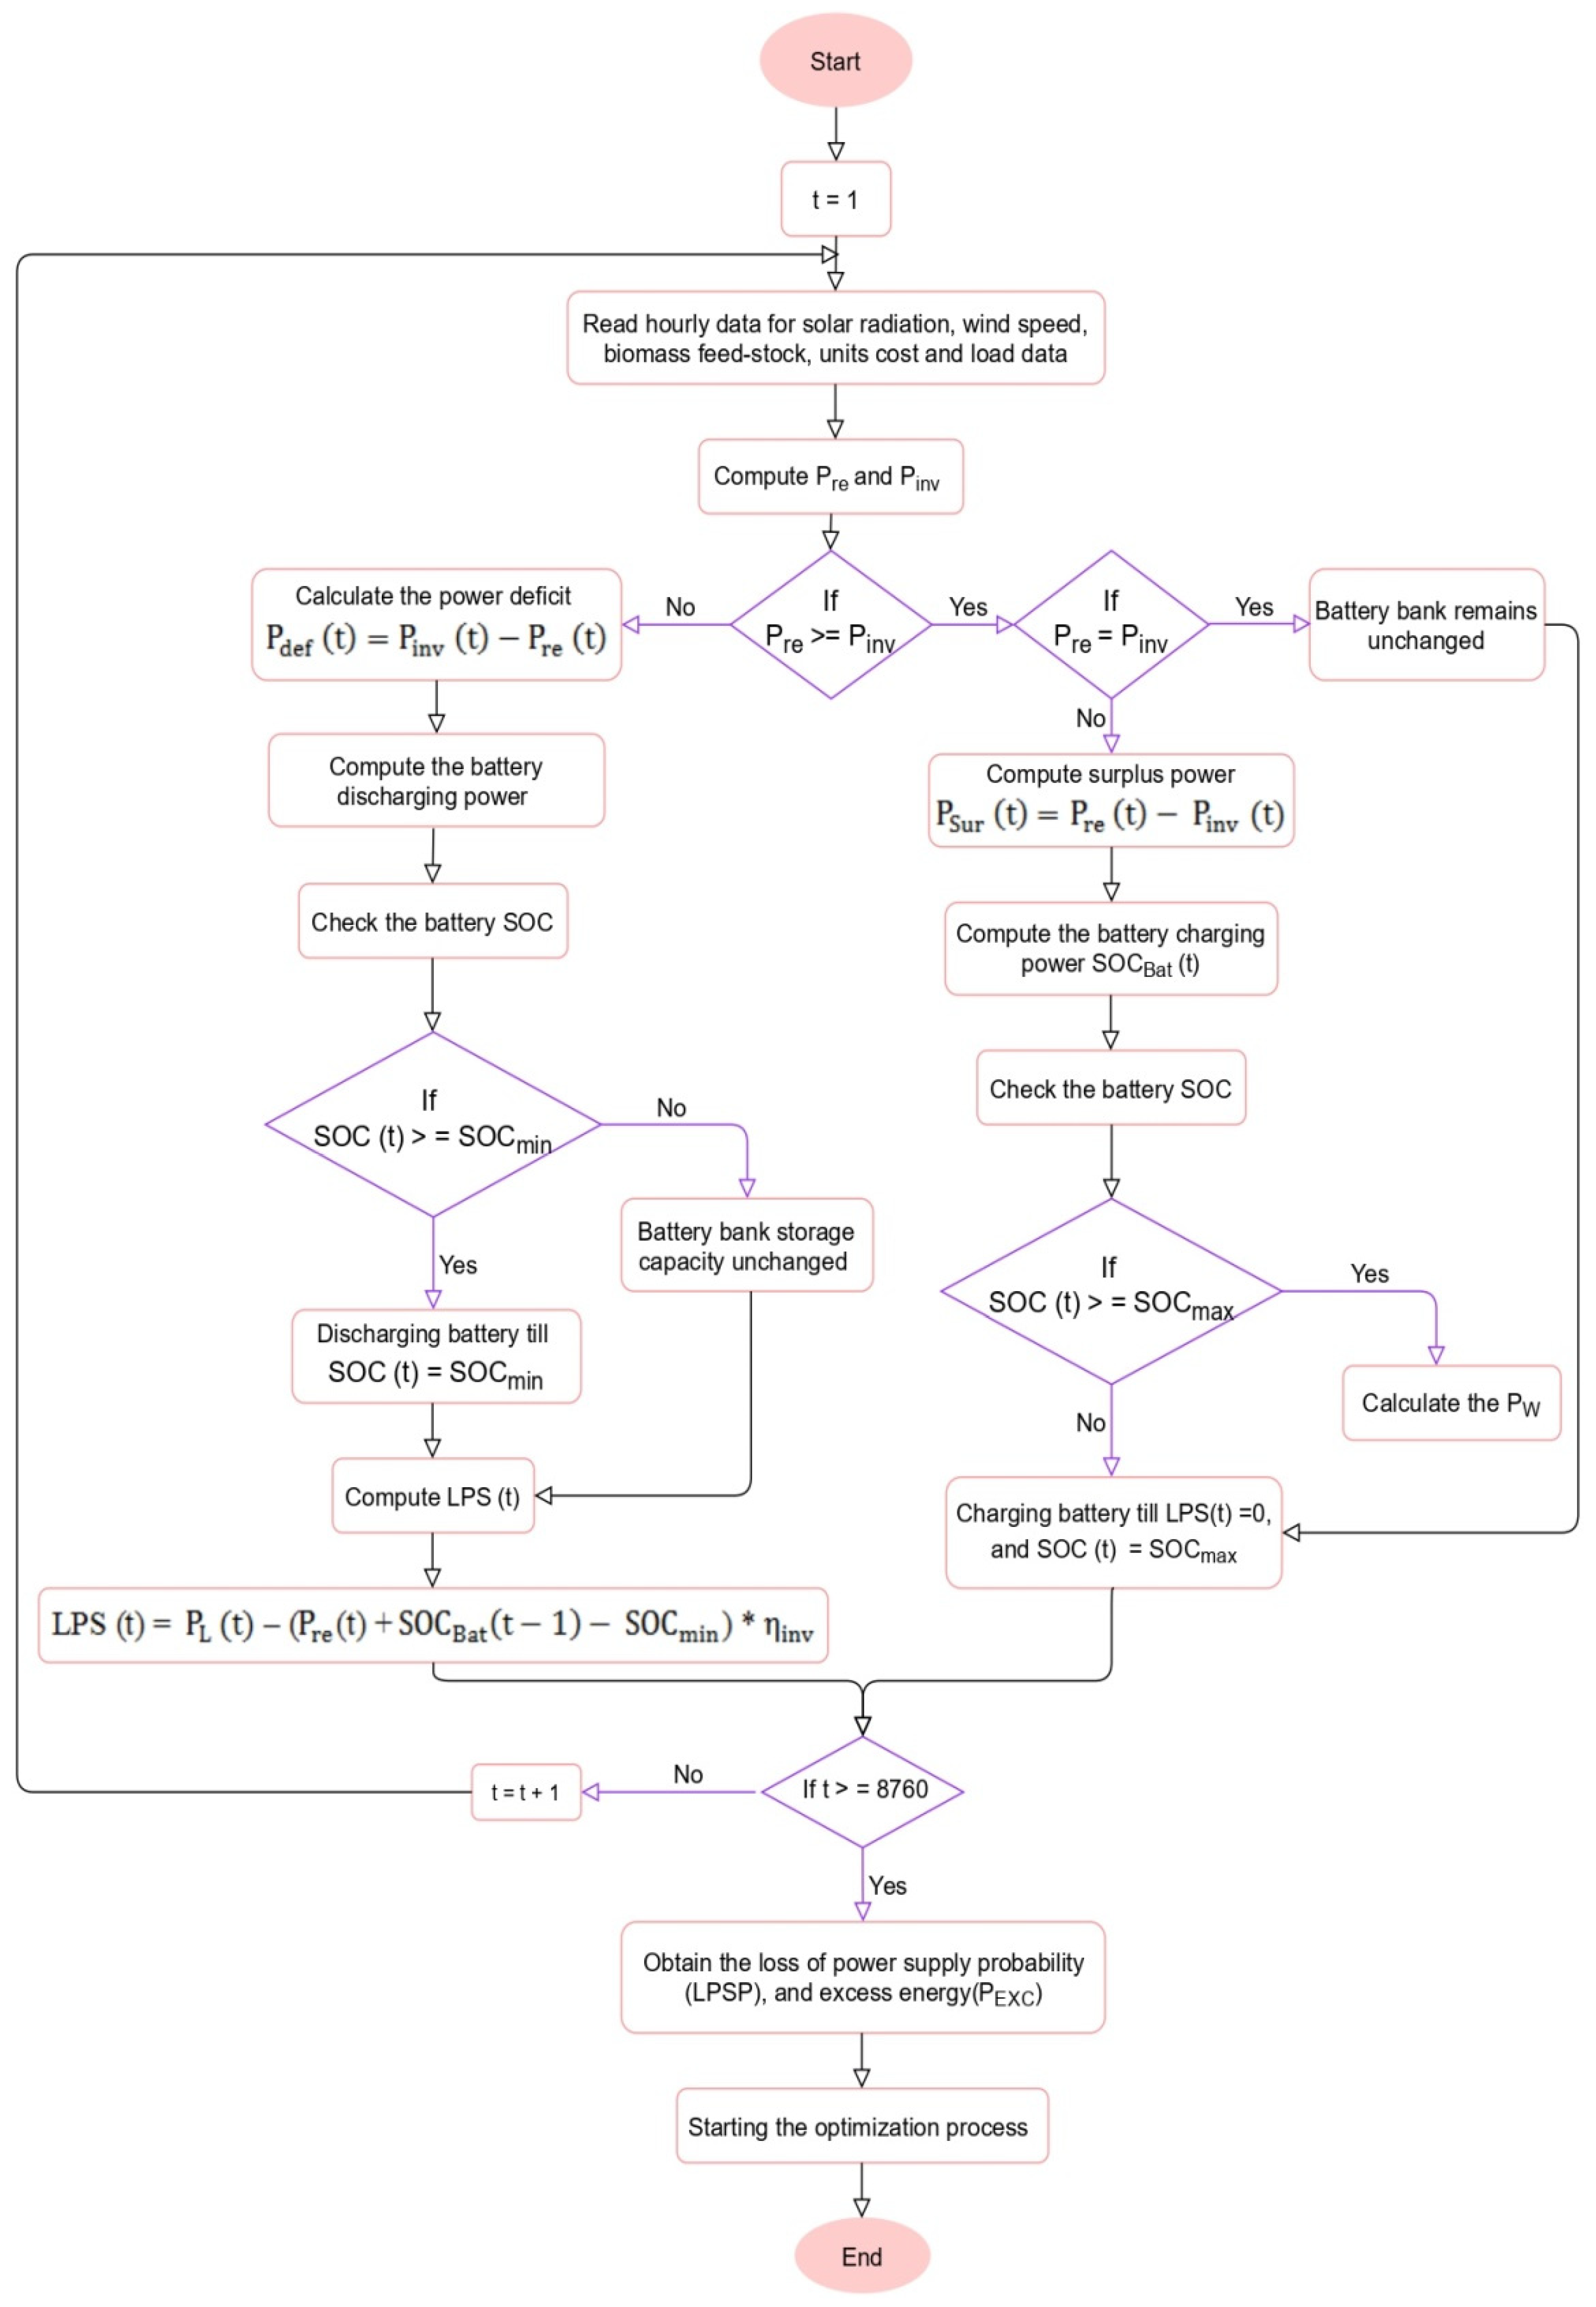
The methodology provided in this work aims to optimize the combination of PV, WT, biomass generators as the main power sources, and batteries which work to keep the energy supply continuous to the loads and enhancing the power supply, which reduces the costs of LPSP and . The flowchart explaining the operational strategy of the proposed hybrid system is presented in Figure 7, while the operating management methodology can be stated according to the following steps:

Figure 7.
Flowchart of the operating management methodology.
- Initially, the charge (SOC) state of the battery bank remains unchanged when meets the charge requirement ((t) = (t)), and the loss in power supplies is zero (LPS (t) = 0) during this time interval.
- When the system’s generation of exceeds the load demand ((t) > (t)), and the battery system’s SOC is less than the maximum permissible charging limit for that interval, then the battery is charged with the surplus power () until it reaches its highest limit, is computed according to the following formula:
- When the maximum charge limit of the battery is reached, the storage system charging status remains unmodified and identical to the previous charge state = ), while the surplus energy remaining is treated as waste energy () that can be discharged into the dummy load.
The energy stored in the battery bank shall be used to satisfy the load demand if the generated from the proposed system cannot meet the load need and if the battery storage system charge is higher than a minimum permissible limit (t) < (t) and > ).
5. Optimization Techniques
To find the solution of optimal sizing problem, four optimization algorithms with the highest efficiency have been utilized.
5.1. HBO
A new meta-heuristic optimization technique based on human-behavior called Heap-based optimizer (HBO) has been created by Qamar Askari in [40]. The HBO technique is based on the hierarchy of corporate rank (CRH) and the interplay of individuals in this hierarchy, HBO’s mathematical model is based on three phases: interplay between employees and their direct manager, interplay amongst coworkers, and employee self-contribution. Unlike numerous of previous meta-heuristics algorithms, the relative fitness of search agents is used to organize them in a hierarchy, and the notion of minimum or maximum heap is used to allow interplay between them while maintaining their relative difference. Furthermore, a factor termed Gamma (γ) is established to help the algorithm avoid premature convergence without compromising the exploitation capability by allowing it to escape local optima. The pseudo-code of the HBO technique is indicated in Algorithm 1.
To prove the efficiency and performance of the HBO technique, it has been tested and compared with seven well-known algorithms and 97 diverse test functions involving 29 CEC-BC-2017 functions. The exploitative and explorative behavior of HBO has assessed from the obtained results of using 24 unimodal and 44 multimodal functions. Experiments and the Friedman mean rank test reveal that HBO outperforms and takes first place.
| Algorithm 1. HBO [40] |
| 1. Initialize general parameters, N, D, , and (, ) |
| 2. Generate a random population P of N search agents |
| 3. Building the heap |
| 4. Algorithm 1; Heapify_Up (i) |
| 5. Input: i (the index of the node we are trying to heapify) |
| 6. Assuming that the rest of the nodes fulfill the heap property |
| 7. while i ≠ root and heap[i].key < heap[parent (i)].key do |
| 8. swap(heap[i], heap[parent (i)]) |
| 9. i ← parent (i) |
| 10. end |
| 11. Algorithm 2; Build_Heap (P, N) |
| 12. Input: P, N |
| 13. for i ← 1 to N do |
| 14. heap[i].value ← i |
| 15. heap[i].key ← f (Xi) |
| 16. Heapify_Up (i) |
| 17. end |
| 18. Update Search agents positions repeatedly |
| 19. Algorithm 3; HBO_Main_Body |
| 20. for t ← 1 to Tmax do |
| 21. Compute γ, p1, p2 |
| 22. for I ← N down to 2 do |
| 23. i ← heap[I].value |
| 24. bi ← heap[parent (I)].value |
| 25. ci ← heap[colleague(I)].value |
| 26. ← |
| 27. ← |
| 28. for k ← 1 to D do |
| 29. p ← rand () |
| 30. ← update (t) |
| 31. end |
| 32. if f() < f((t)) then |
| 33. (t + 1) ←(t) |
| 34. end |
| 35. Heapify_Up (I) |
| 36. end |
| 37. end |
| 38. return |
5.2. CFA
A meta-heuristic optimization algorithm called Franklin’s and Coulomb’s algorithm (CFA) has been created by Ghasemi et al. [41], is based on the theories of the Coulomb’s and Franklin’s law. For optimal outcomes, the CFA employs two separate theories. First is the Coulomb’s Law, which is based on the attraction and repulsion of electrons. This phenomenon governs the interaction of two independent point charges separated by a certain distance. Second is the Franklin’s Law, which is based on that every item has an equal quantity of positive and negative charges, according to this law. CFA’s mathematical model is based on four steps: Initialization, Attraction/repulsion, Probabilistic ionization, and Probabilistic contact. The pseudo-code of the CFA technique is indicated in Algorithm 2.
| Algorithm 2. CFA [41] |
| 1. Generate the initial point charges (population) |
| 2. Initialize parameters |
| 3. Initial fitness evaluation of whole population |
| 4. While criteria not satisfied do |
| 5. for (i = 1: N) do |
| 6. The attraction/repulsion phase is applied for point charges of objects. |
| 7. Evaluate the fitness values. |
| 8. The probabilistic ionization phase is applied for elementary charges (control variables) of point charge and fitness evaluation. |
| 9. The probabilistic contact phase is applied for objects. |
| 10. Selection of the best solution. |
| 11. end for |
| 12. end while |
5.3. STOA
A novel bio-inspired optimization algorithm called Sooty Tern Optimization Algorithm (STOA) has been created by Dhiman and Kaur [42] to address the constraints of the industrial issues. The movement and attacking habits of the sea bird sooty tern in nature are the key motivations for modeling the STOA technique. STOA was validated using 44 benchmark test functions and compared it with nine well-known optimization techniques in terms of performance. The results of CEC 2005 and CEC 2015 standard test functions prove that the STOA is capable of addressing difficult and high dimensionality bound constrained actual situations. The pseudo-code of the STOA technique is indicated in Algorithm 3.
| Algorithm 3. STOA [42] |
| 1. Initialize the population within the limits |
| 2. Initialize parameters DA and CB |
| 3. Evaluate the fitness of whole population |
| 4. Best search agent → Xbest |
| 5. While (it < Maxit) |
| 6. for (i = 1: N) do |
| 7. Update the position of the current search agent |
| 8. end for |
| 9. Initialize parameters DA and CB |
| 10. Evaluate the fitness of whole population |
| 11. Update Xbest |
| 12. it = it +1 |
| 13. end while |
| 14. return Xbest |
5.4. GWO
The GWO has been proposed by Mirjalili et al. [43], it’s a heuristic optimization technique created to find a candidate solution from a large solution space without requiring any explicit input parameters. Such qualities are ideal for dealing with nonlinear issues, such as controller parameter tweaking. Grey wolves’ natural behavior and social structure in seeking prey served as inspiration for GWO. There is a hierarchical framework that governs each wolf pack. The alpha wolf, who heads the entire group, is the most formidable. In the absence of the alpha wolf, the second strongest wolf, called as the beta wolf, assumes leadership. The weaker wolves are the delta and omega wolves. The pseudo-code of the GWO technique is indicated in Algorithm 4.
| Algorithm 4. GWO [43] |
| 1. Initialize the grey wolf population within the limits |
| 2. Initialize parameters a, A, and C |
| 3. Evaluate the fitness of whole population |
| 4. Xα = the best search agent |
| 5. Xβ = the second best search agent |
| 6. Xδ = the third best search agent |
| 7. While (it < Maxit) |
| 8. for (i = 1: N) do |
| 9. Update the position of the current search agent |
| 10. end for |
| 11. Update a, A, and C |
| 12. Evaluate the fitness of whole population |
| 13. Update Xα, Xβ, and Xδ |
| 14. end while |
| 15. return Xα |
6. Results and Discussion
In this work, a novel HBO technique is suggested to determine the optimal sizing of four alternatives off-grid hybrid system scenarios based on PV, WT, biomass, and battery units. These four scenarios of the hybrid system are namely PV/WT/biomass/Bat, PV/biomass/Bat, WT/biomass/Bat, and PV/WT/Bat. In order to validate the effectiveness of this HBO as a way to provide optimal reliability and least cost, the results achieved by the suggested algorithms are compared with other recent optimization techniques CFA, GWO and STOA. The control parameters used in the optimization process for each algorithm are listed in Appendix A.
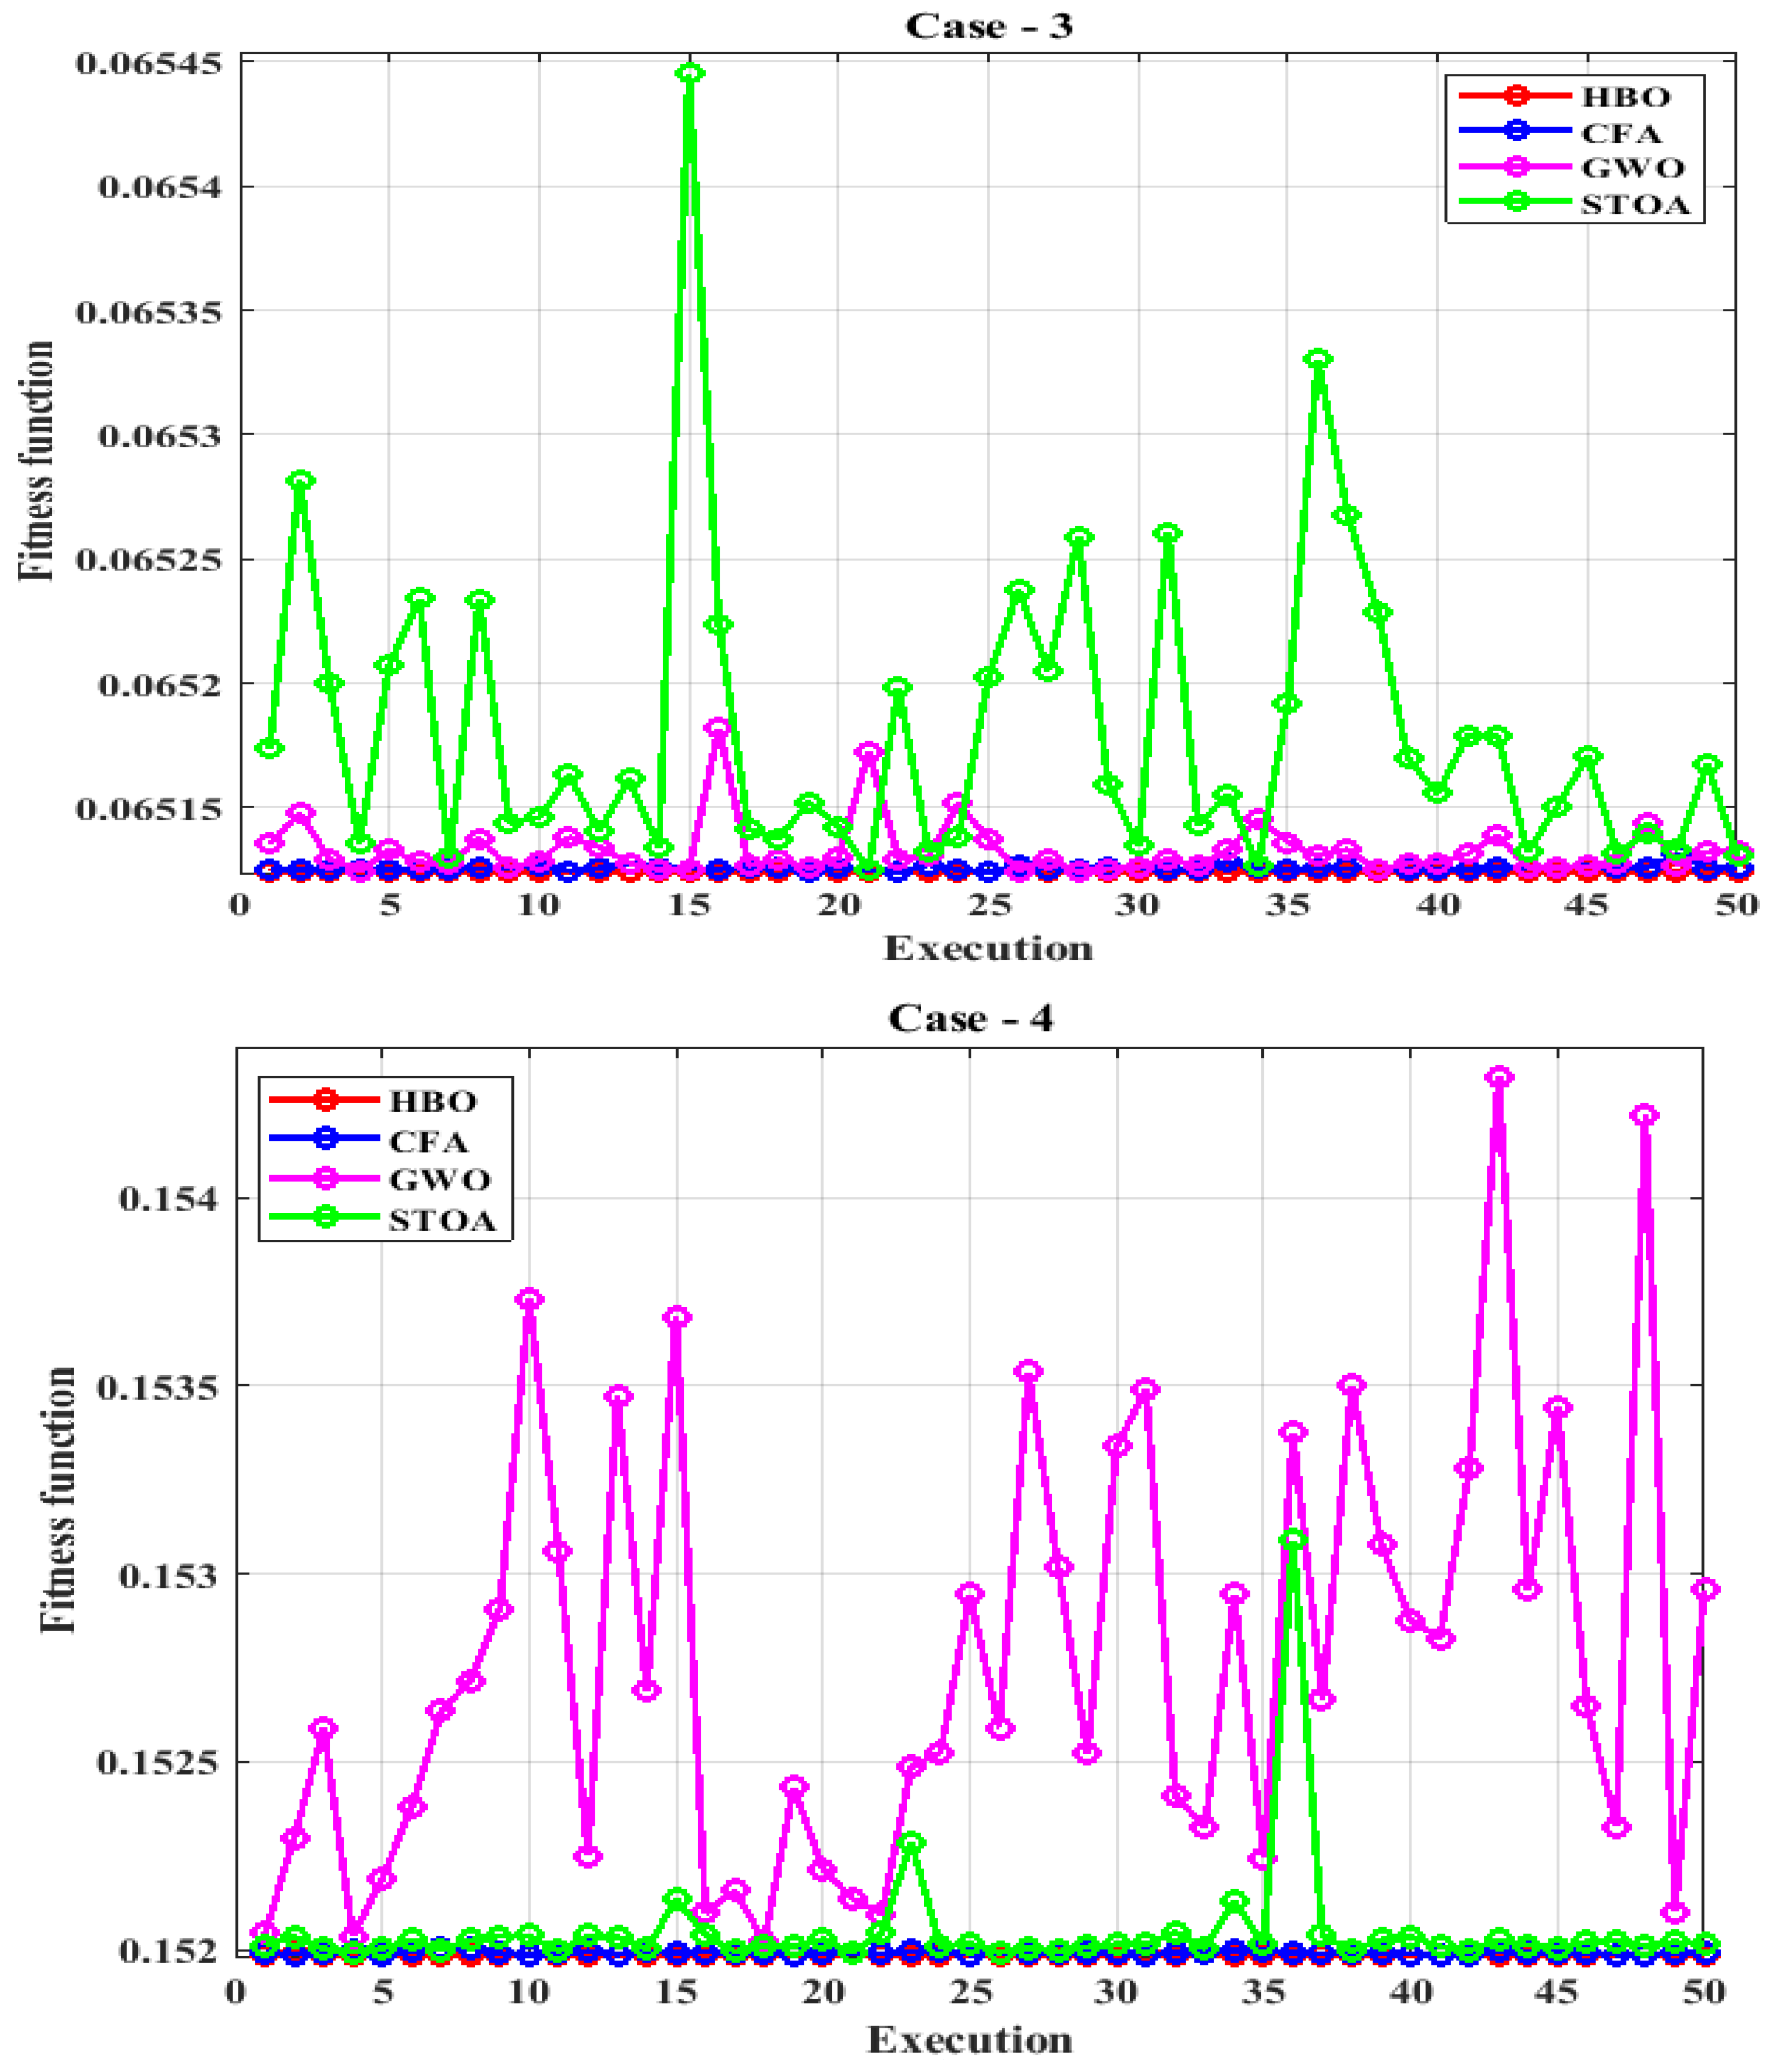
Figure 8 presents the graphic form of the final values of the target function over the 50 executes for the four analyzed configurations scenarios utilizing the optimization techniques namely, HBO, CFA, GWO, and STOA. It can be noted that, the fitness values for the suggested HBO method in the four system cases were within a limited range, which demonstrated the stability of the suggested technique over the other techniques. Therefore, parametric and nonparametric metric values are superior using the HBO method compared to the rest of the optimization techniques.
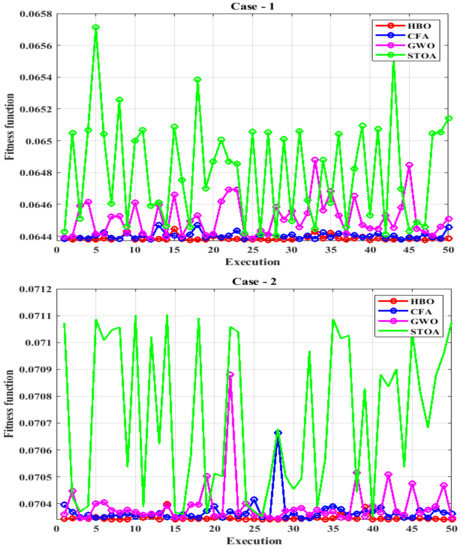

Figure 8.
End values of the fitness function for 50 executions using HBO, CFA, GWO, and STOA methods: case-1: PV/WT/Biomass/Bat system, case-2: PV/Biomass/Bat system, case-3: WT/Biomass/Bat system, case-4: PV/WT/Bat system.
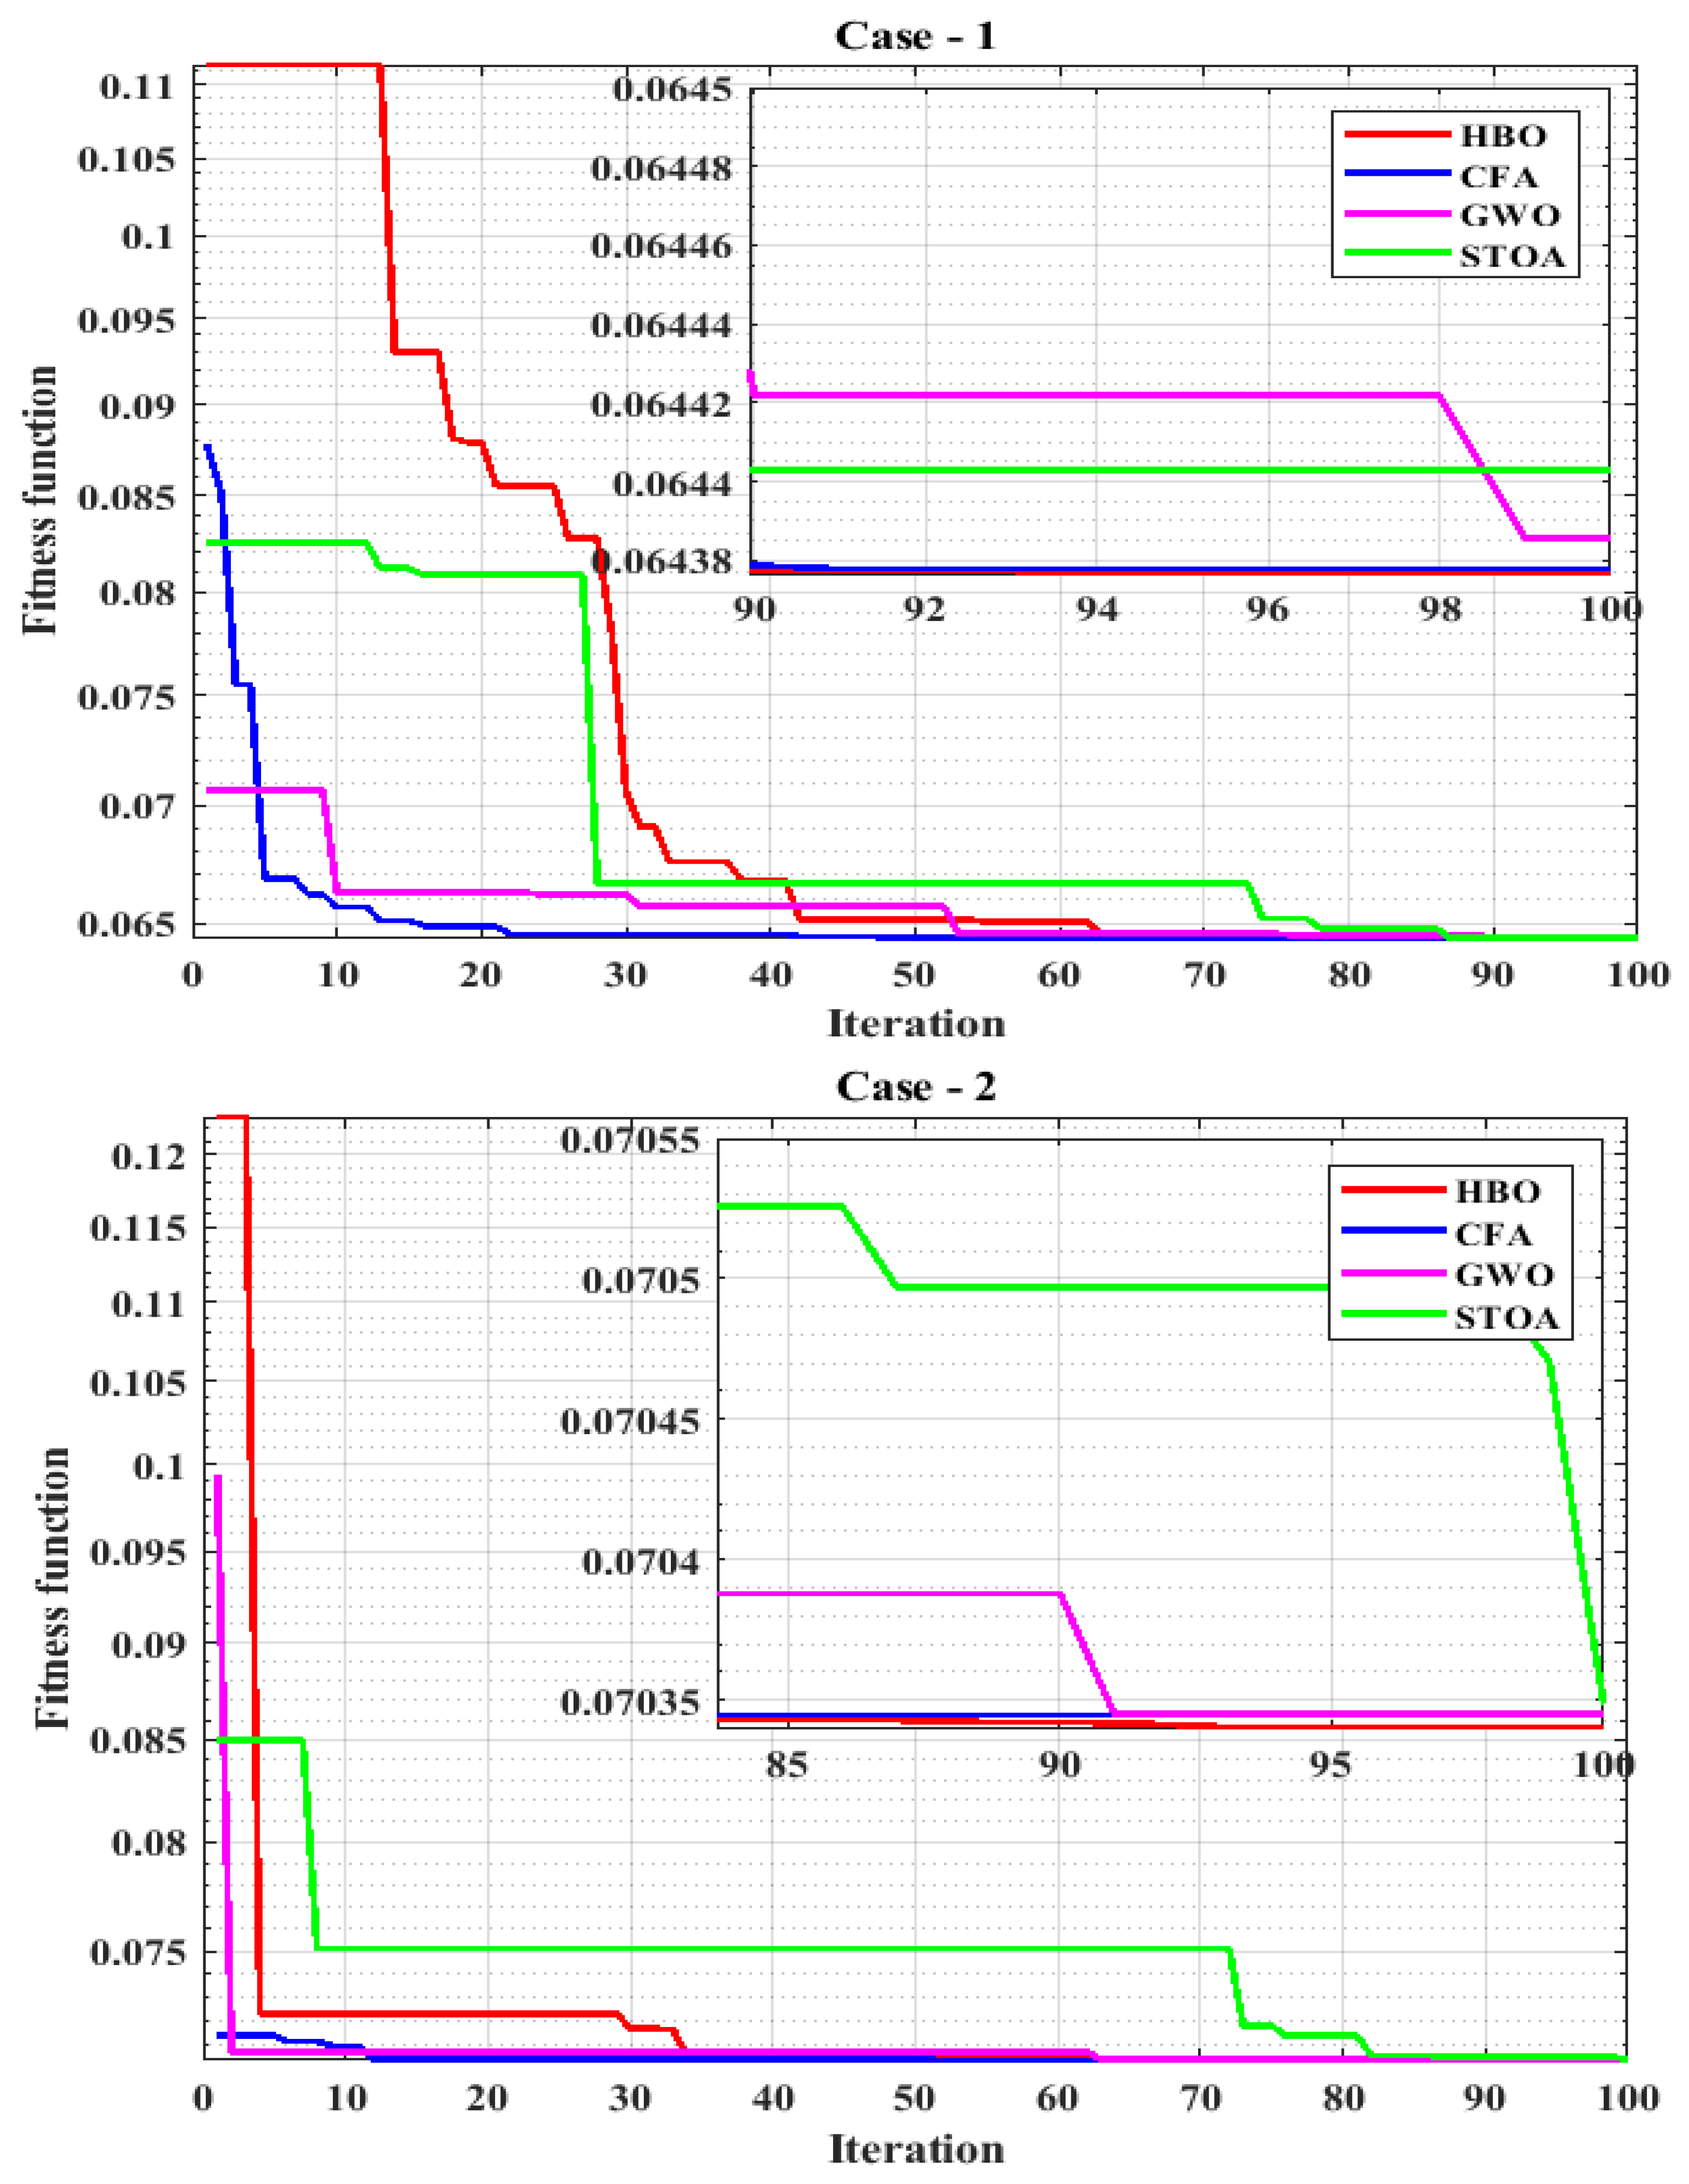
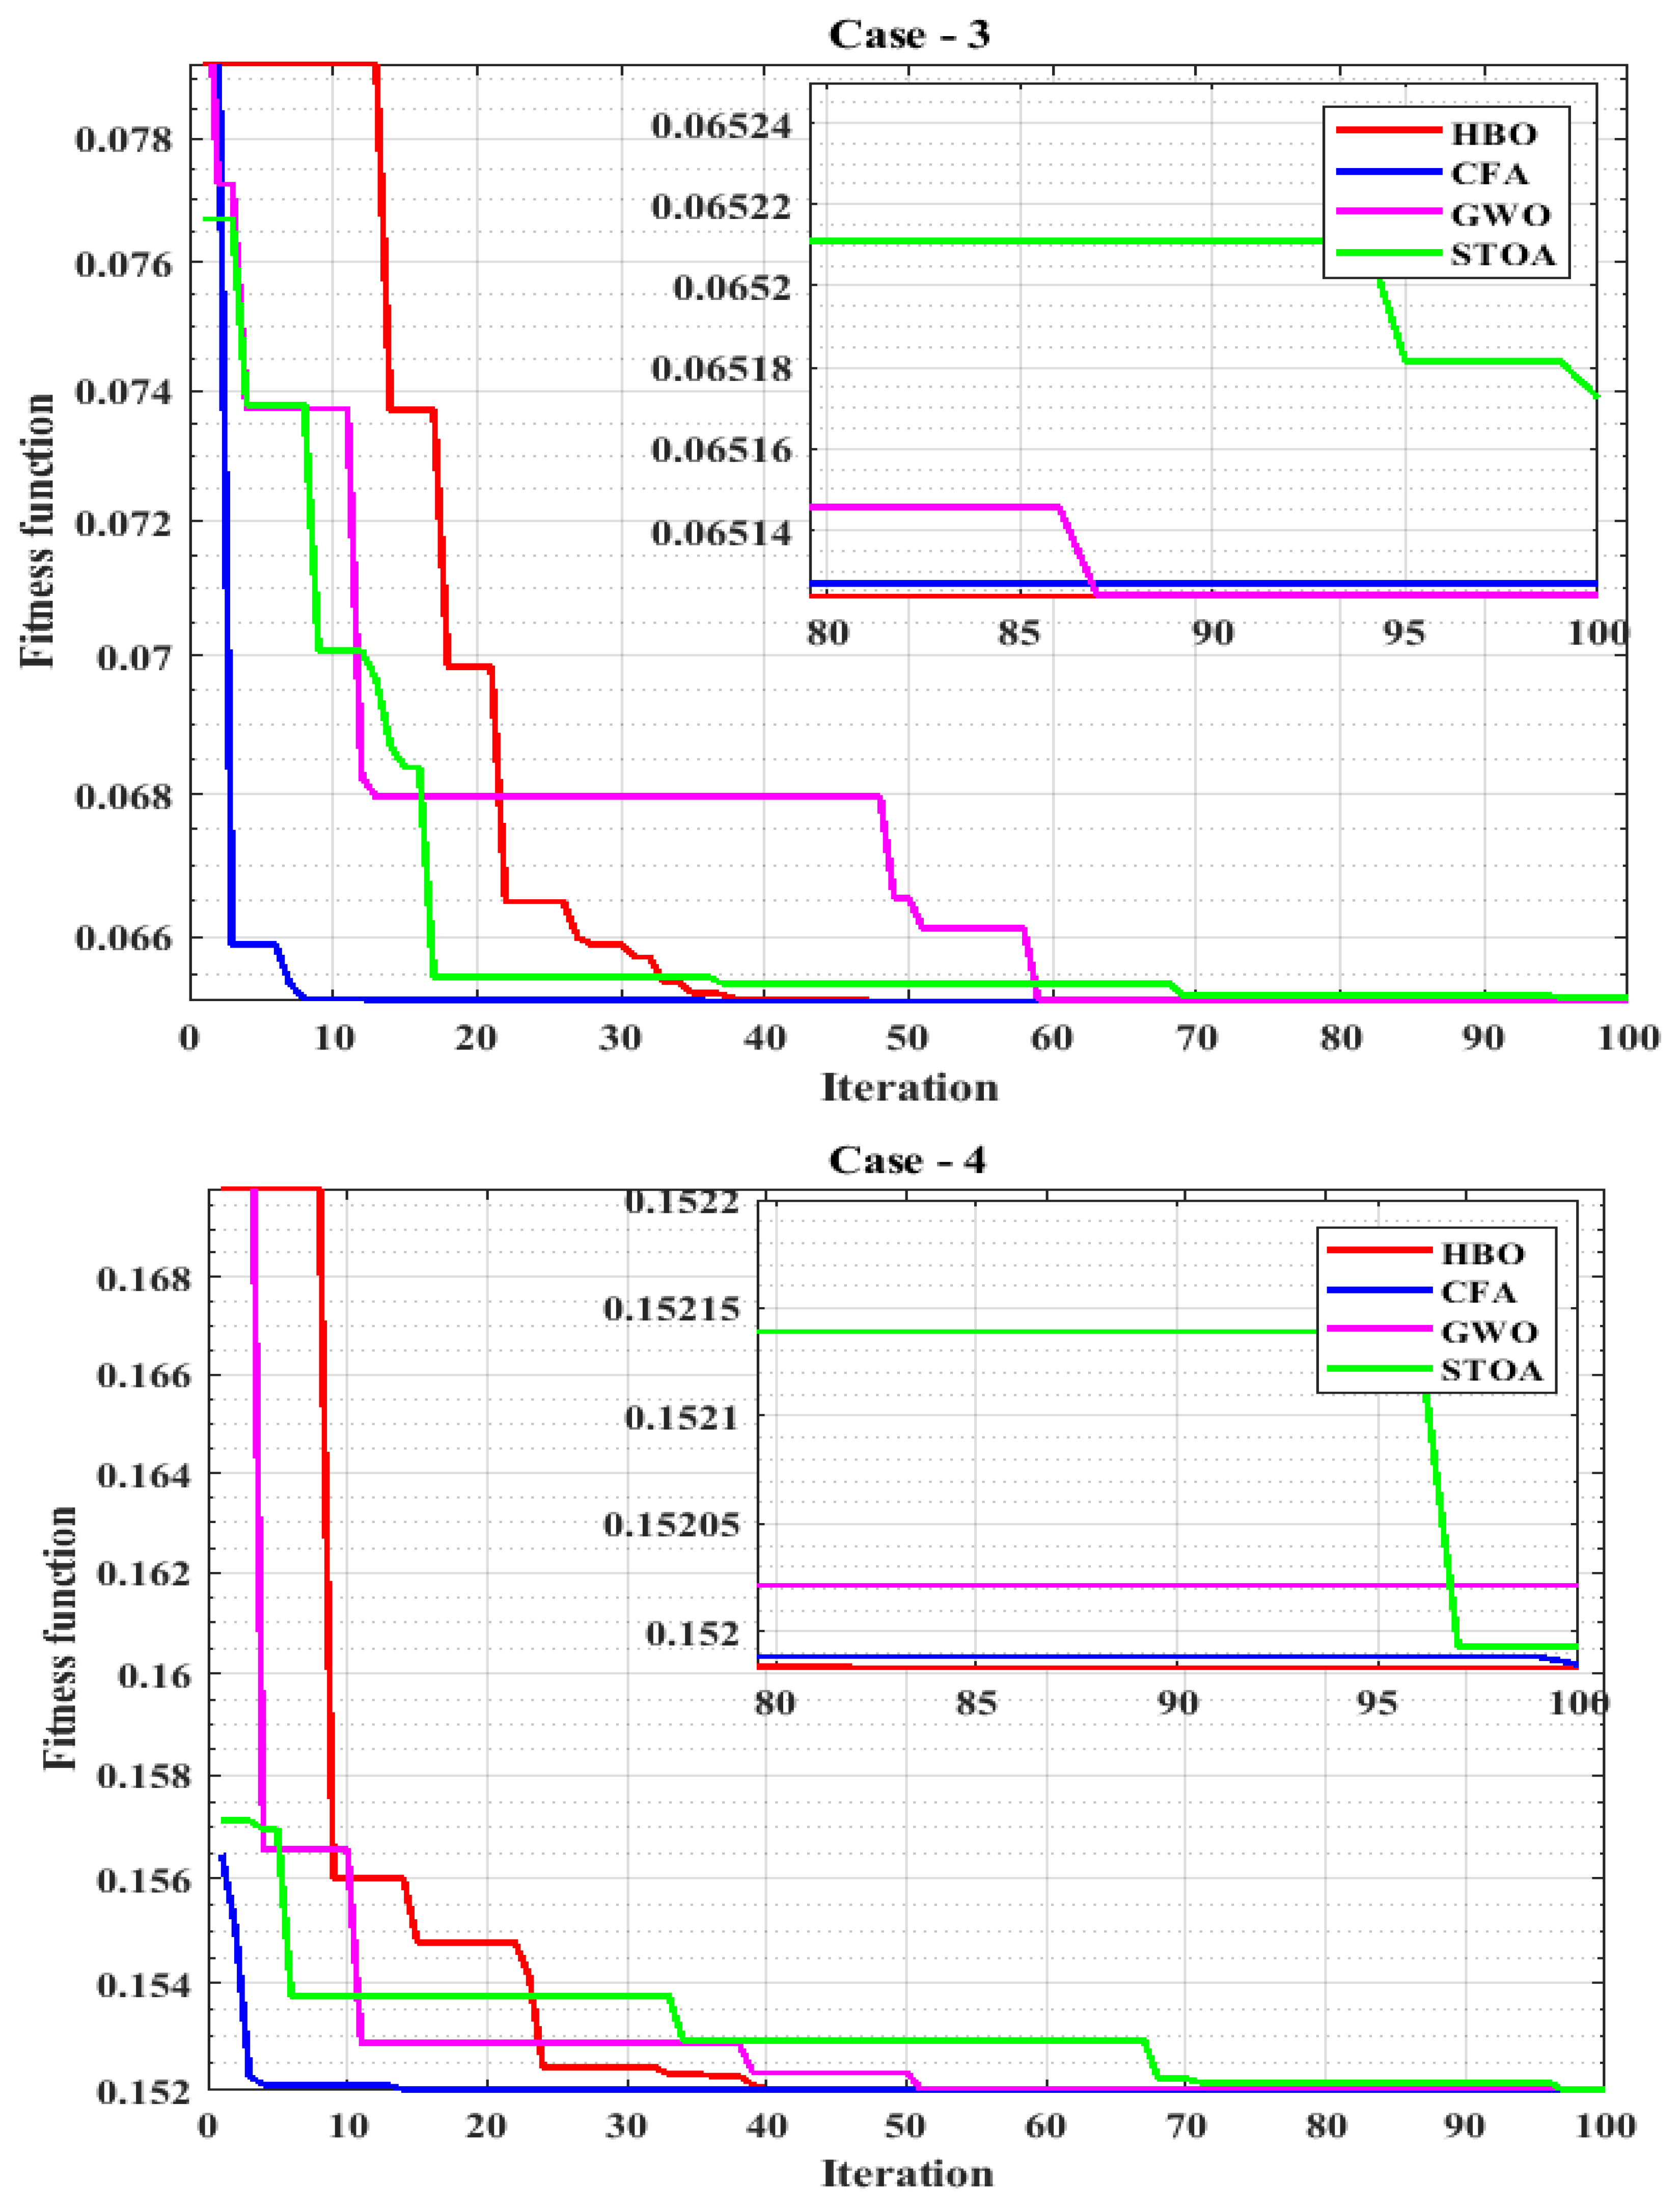
Figure 9 displays the best optimal solution convergence curve for each scenario utilizing HBO, CFA, GWO, and STOA. For Case (1), the best solution achieved by using HBO technique which is 0.0643767 after 27 iterations, followed by CFA technique with 0.06437783 after 44 iterations. For Case (2), the best solution achieved by using HBO technique which is 0.0703404 after 49 iterations, followed by best solution achieved by CFA technique with 0.07034462 after 32 iterations. For Case (3), the best solution achieved by using HBO technique with 0.0705909 after 41 iterations, followed by best solution achieved by CFA technique with 0.0651240320 after 39 iterations. Finally for Case (4), the best solution achieved by using HBO technique with 0.151991724 after 41 iterations, followed by best solution achieved by CFA technique with 0.152001799 after 58 iterations. It can be noticed that the HBO method provides a good convergence characteristic over the other optimization algorithms CFA, GWO, and STOA in all suggested cases.
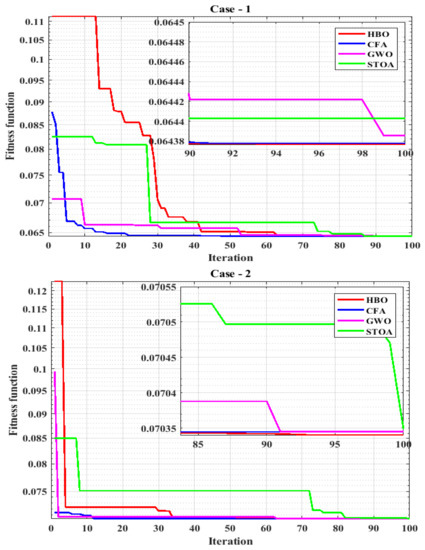

Figure 9.
The Convergence curves for 100 iterations using HBO, CFA, GWO, and STOA methods: case-1: PV/WT/Biomass/Bat system, case-2: PV/Biomass/Bat system, case-3: WT/Biomass/Bat system, case-4: PV/WT/Bat system.
Table 6, Table 7, Table 8 and Table 9 illustrate the results of the optimization properties for the four system scenarios proposed, which is based on many factors including the best value of the objective function, the decision variables (, , and ), the COE, LPSP, and of the suggested optimization algorithms (HBO, CFA, GWO and STOA).
Table 6.
The optimization properties for the proposed hybrid system based on using HBO, CFA, GWO and STOA for an isolated PV/WT/Biomass/Bat.
Table 7.
The optimization properties for the proposed hybrid system based on using HBO, CFA, GWO and STOA for an isolated PV/Biomass/Bat.
Table 8.
The optimization properties for the proposed hybrid system based on using HBO, CFA, GWO and STOA for an isolated WT/Biomass/Bat.
Table 9.
The optimization properties for the proposed hybrid system based on using HBO, CFA, GWO and STOA for an isolated PV/WT/Bat.
In Table 6, for the PV, WT, Biomass, and Bat system, the results indicate that the HBO has the best configuration by using 15 PV panels, 1 WTs, 2 biomass generators, and 400 batteries, achieving the least COE, and with 0.121171$/kWh and $ 3,559,143, respectively. In Table 7, for the second system case based on PV, Biomass, and Bat, the results prove that the HBO has the best configuration by using 17 PV panels, 2 biomass generators, and 447 batteries, achieving the least COE, and with 0.1311804$/kWh and $ 3,853,160, respectively.
While Table 8, for the WT, Biomass, and Bat system, the results prove that the STOA has the best configuration by using 1 WT, 2 biomass generators, and 375 batteries, achieving the least COE, and with 0.1056732 $/kWh and $ 3,103,938, respectively. In Table 9, for the fourth system case based on PV, WT, and Bat, the results illustrate that the STOA has the best configuration by using 170 PV panels, 88 WTs, and 983 batteries, achieving the least COE, and with 0.3324975$/kWh and $ 9,766,441, respectively.
By comparing the COE and NPC of the four suggested cases, it finds that Case-3 achieved the lowest COE and NPC, followed by the Case-1. Although the third scenario which based on WT/biomass/Bat units produces the minimum value of COE and NPC, but it is not the optimal and efficient system for use. As the design of this case is based on batteries and biomass generators only, which have the highest yearly sharing of the capital cost, operating and maintenance cost. While the first scenario which is consists of PV/WT/biomass/Bat units considered an appropriate solution with minimal investment cost for the suggested case study area.
Parametric and non-parametric statistical measurements were performed for a more accurate comparison between the four optimization methods (HBO, CFA, GWO and STOA) on the basis of the acquired values of the objective function across a hundred individual runs for all analyzed cases. Parametric measurements comprise the lower value (Min.), maximum value (Max.) and mean of the target function, whereas the non-parametric measurements contain the median, relative error (RA), mean absolute error (MAE), standard deviation (SD), and efficiency. The efficiency here referred to the ratio of the lower value to the mean value of the goal function. For all four system scenarios, the results for statistical metrics for HBO, CFA, GWO, and STOA are shown in Table 10. On the basis of the results obtained, the proposed HBO in each case proved the best sensitivity and stability results compared to other optimization methods.
Table 10.
The statistical performance of the studied optimization algorithms for the four system cases.
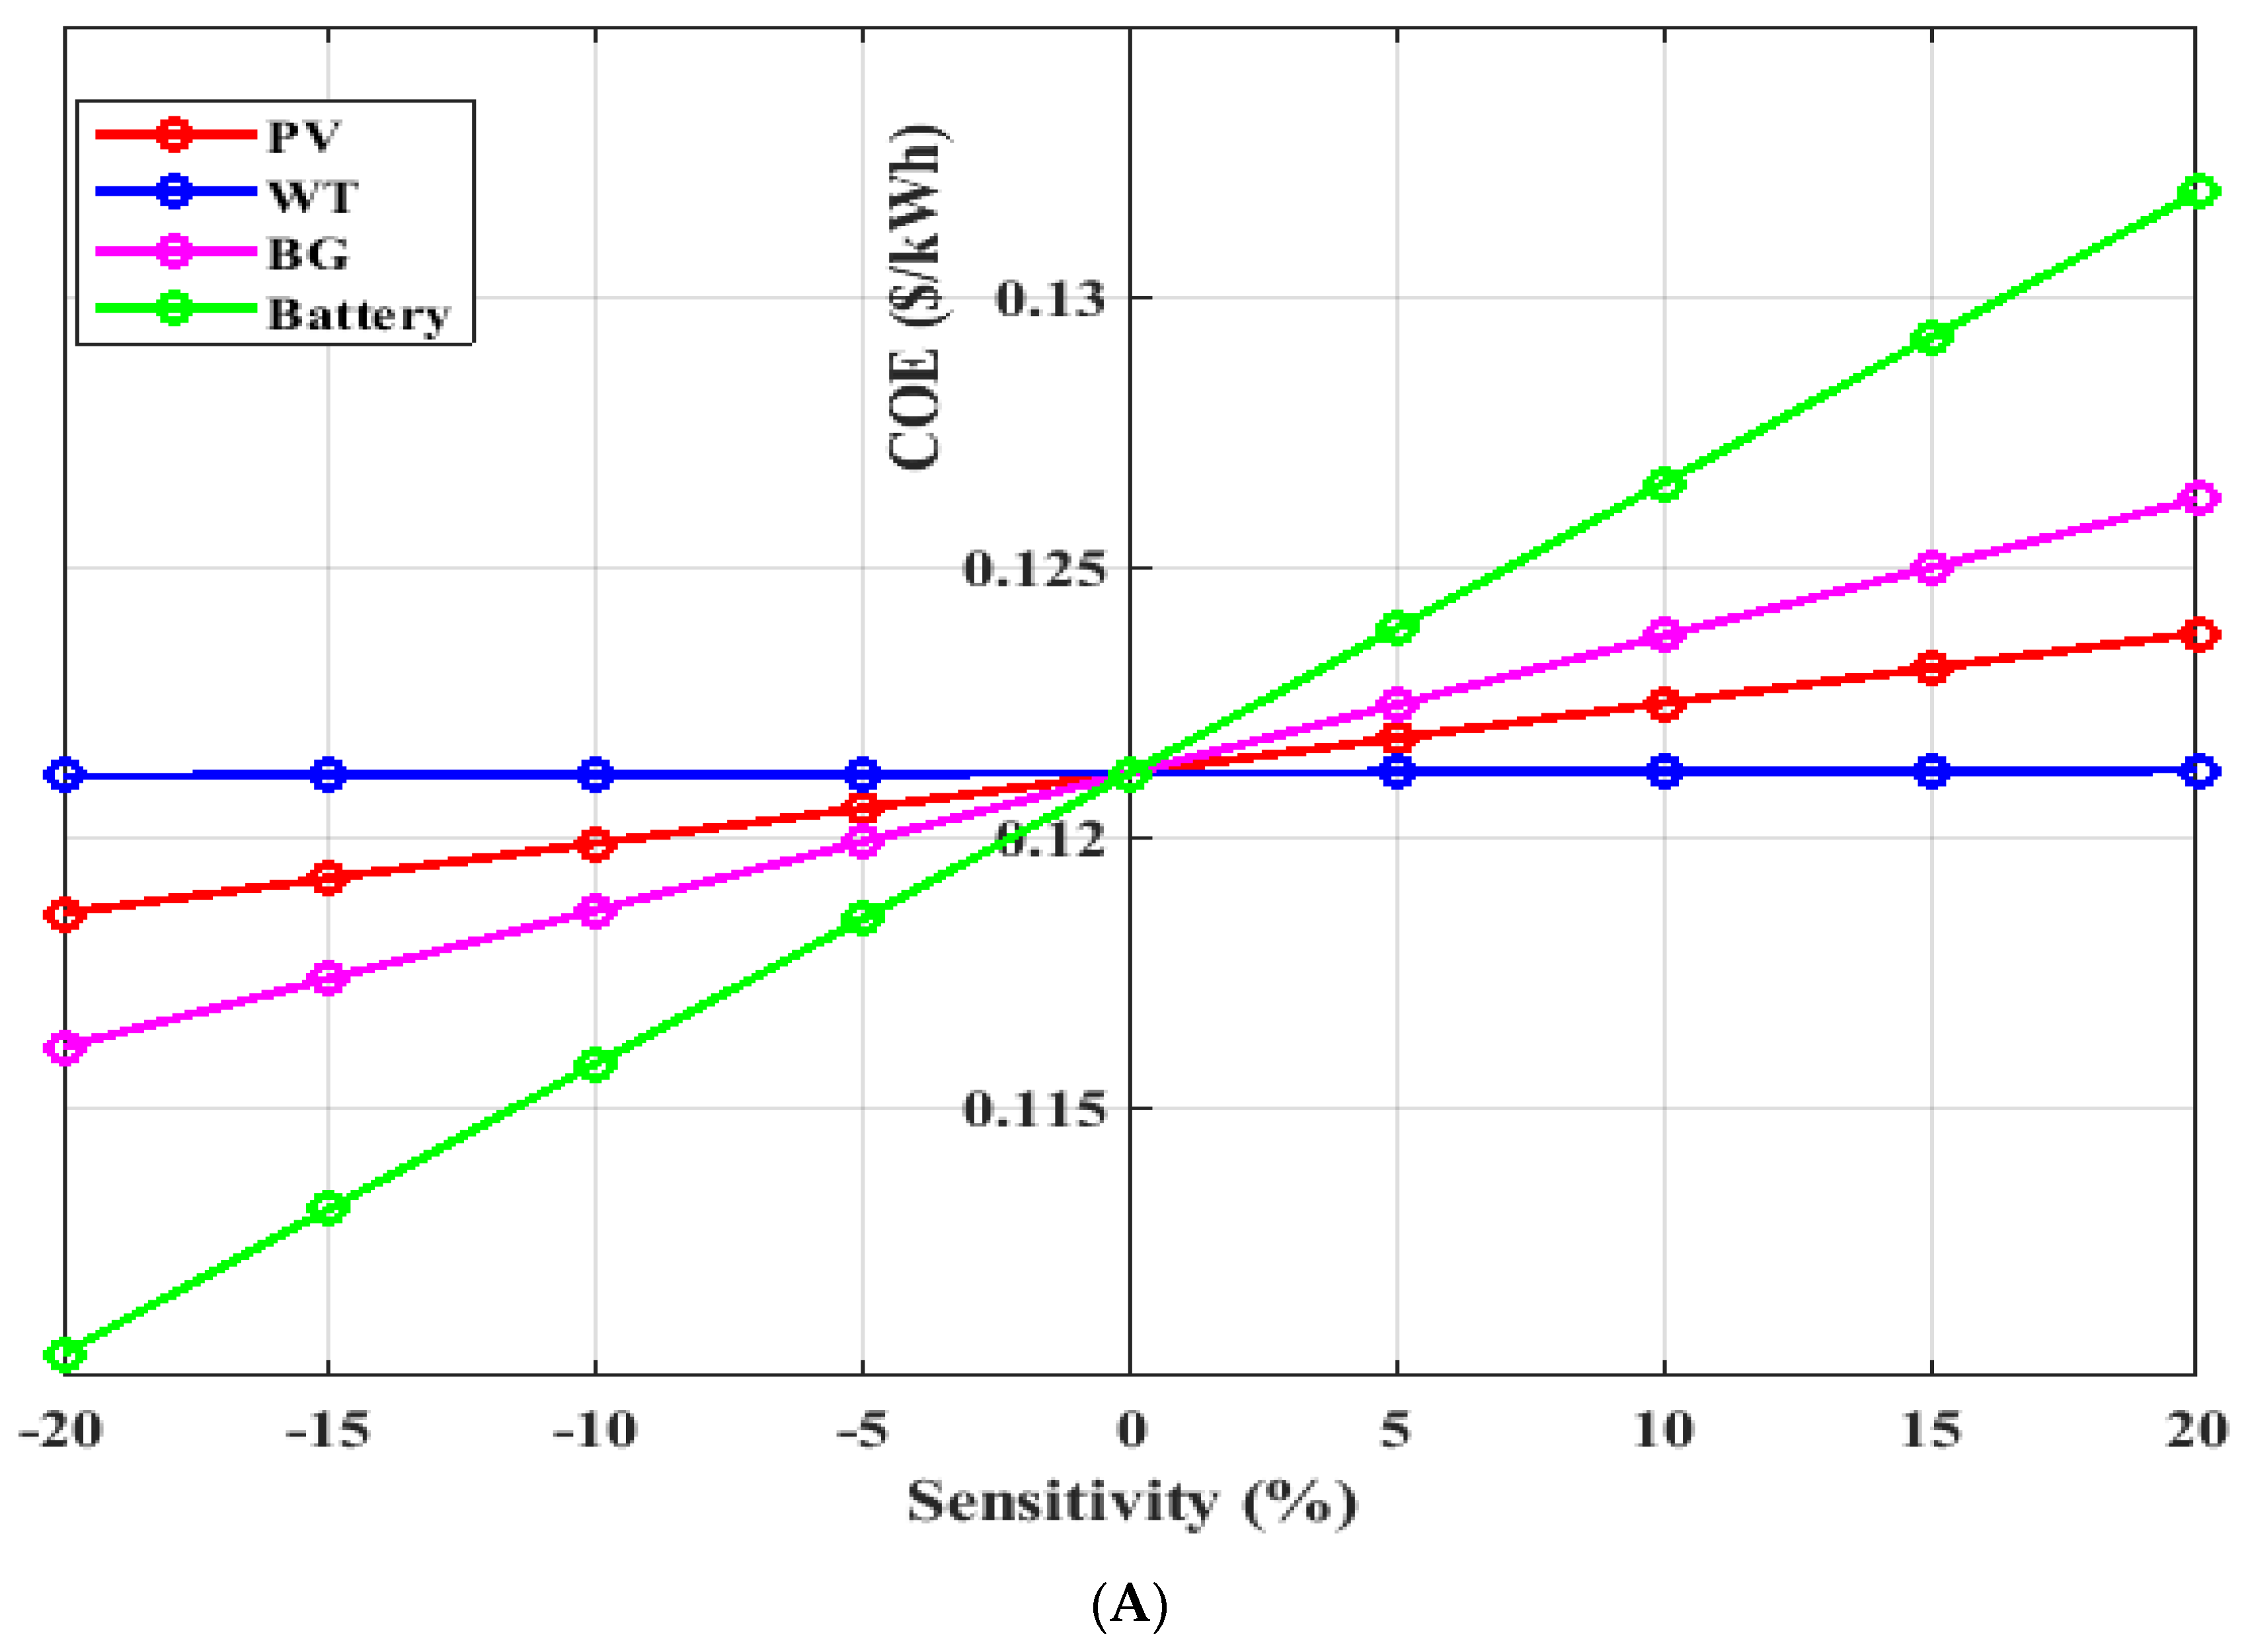
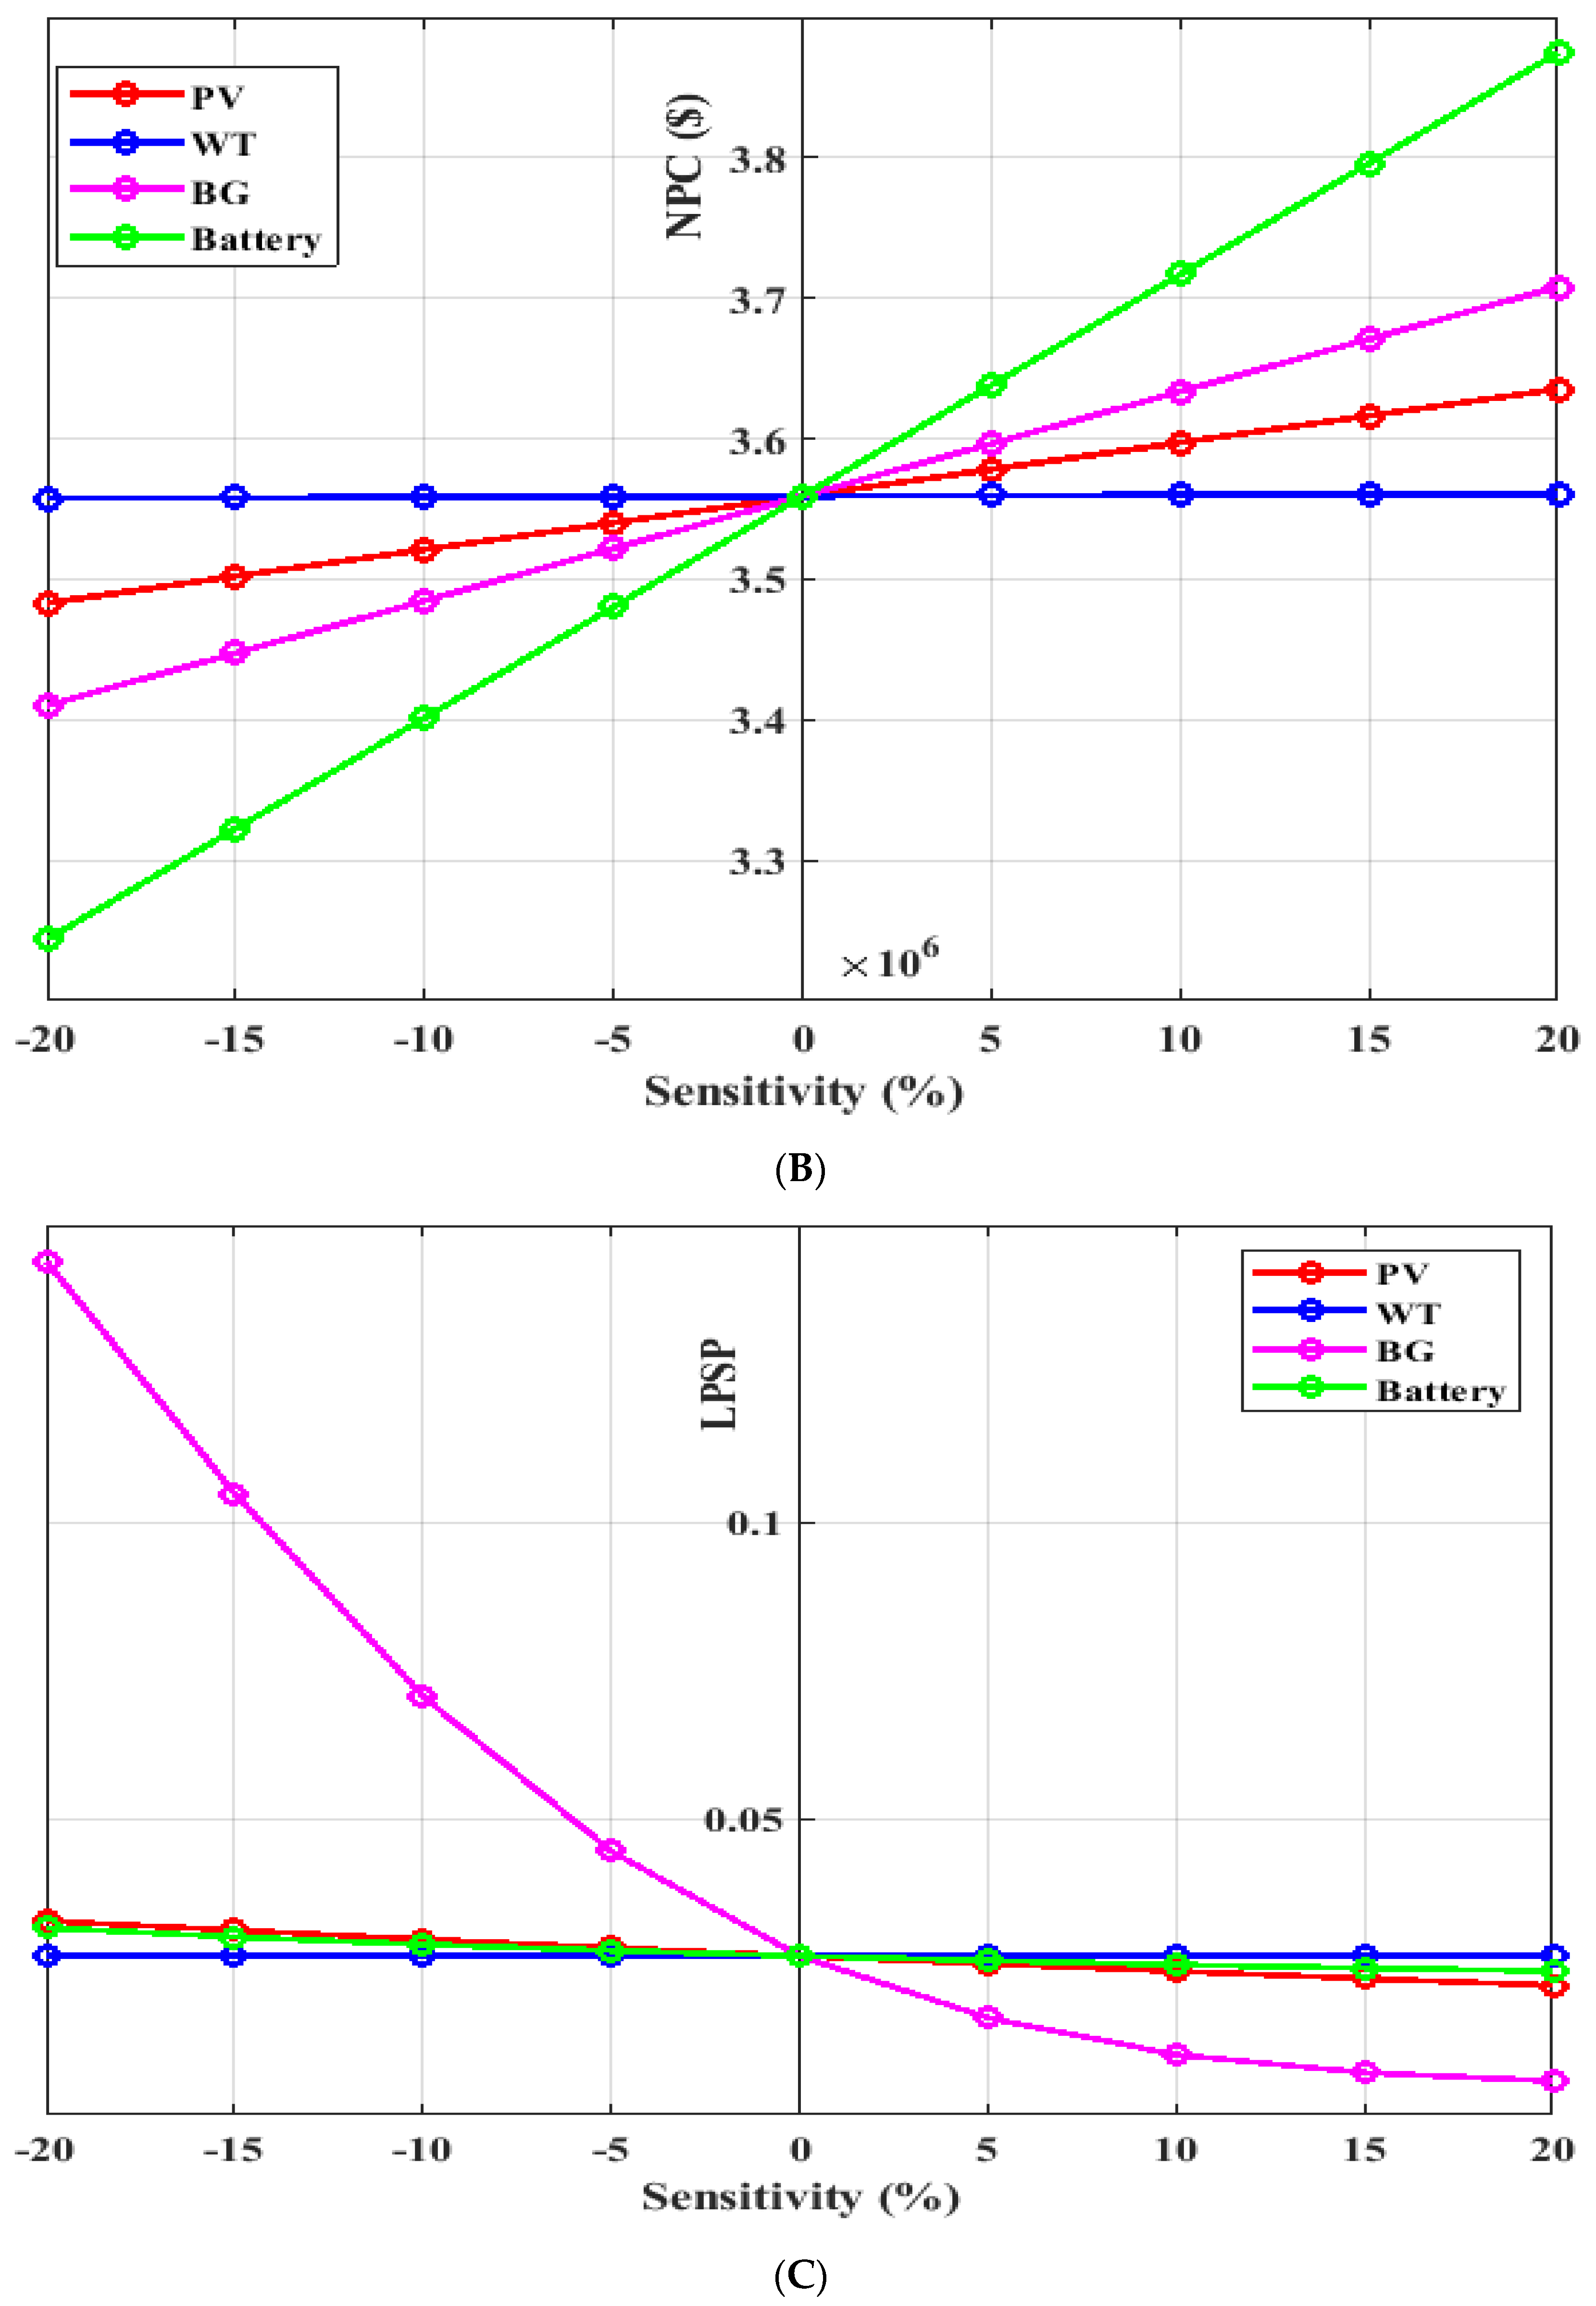
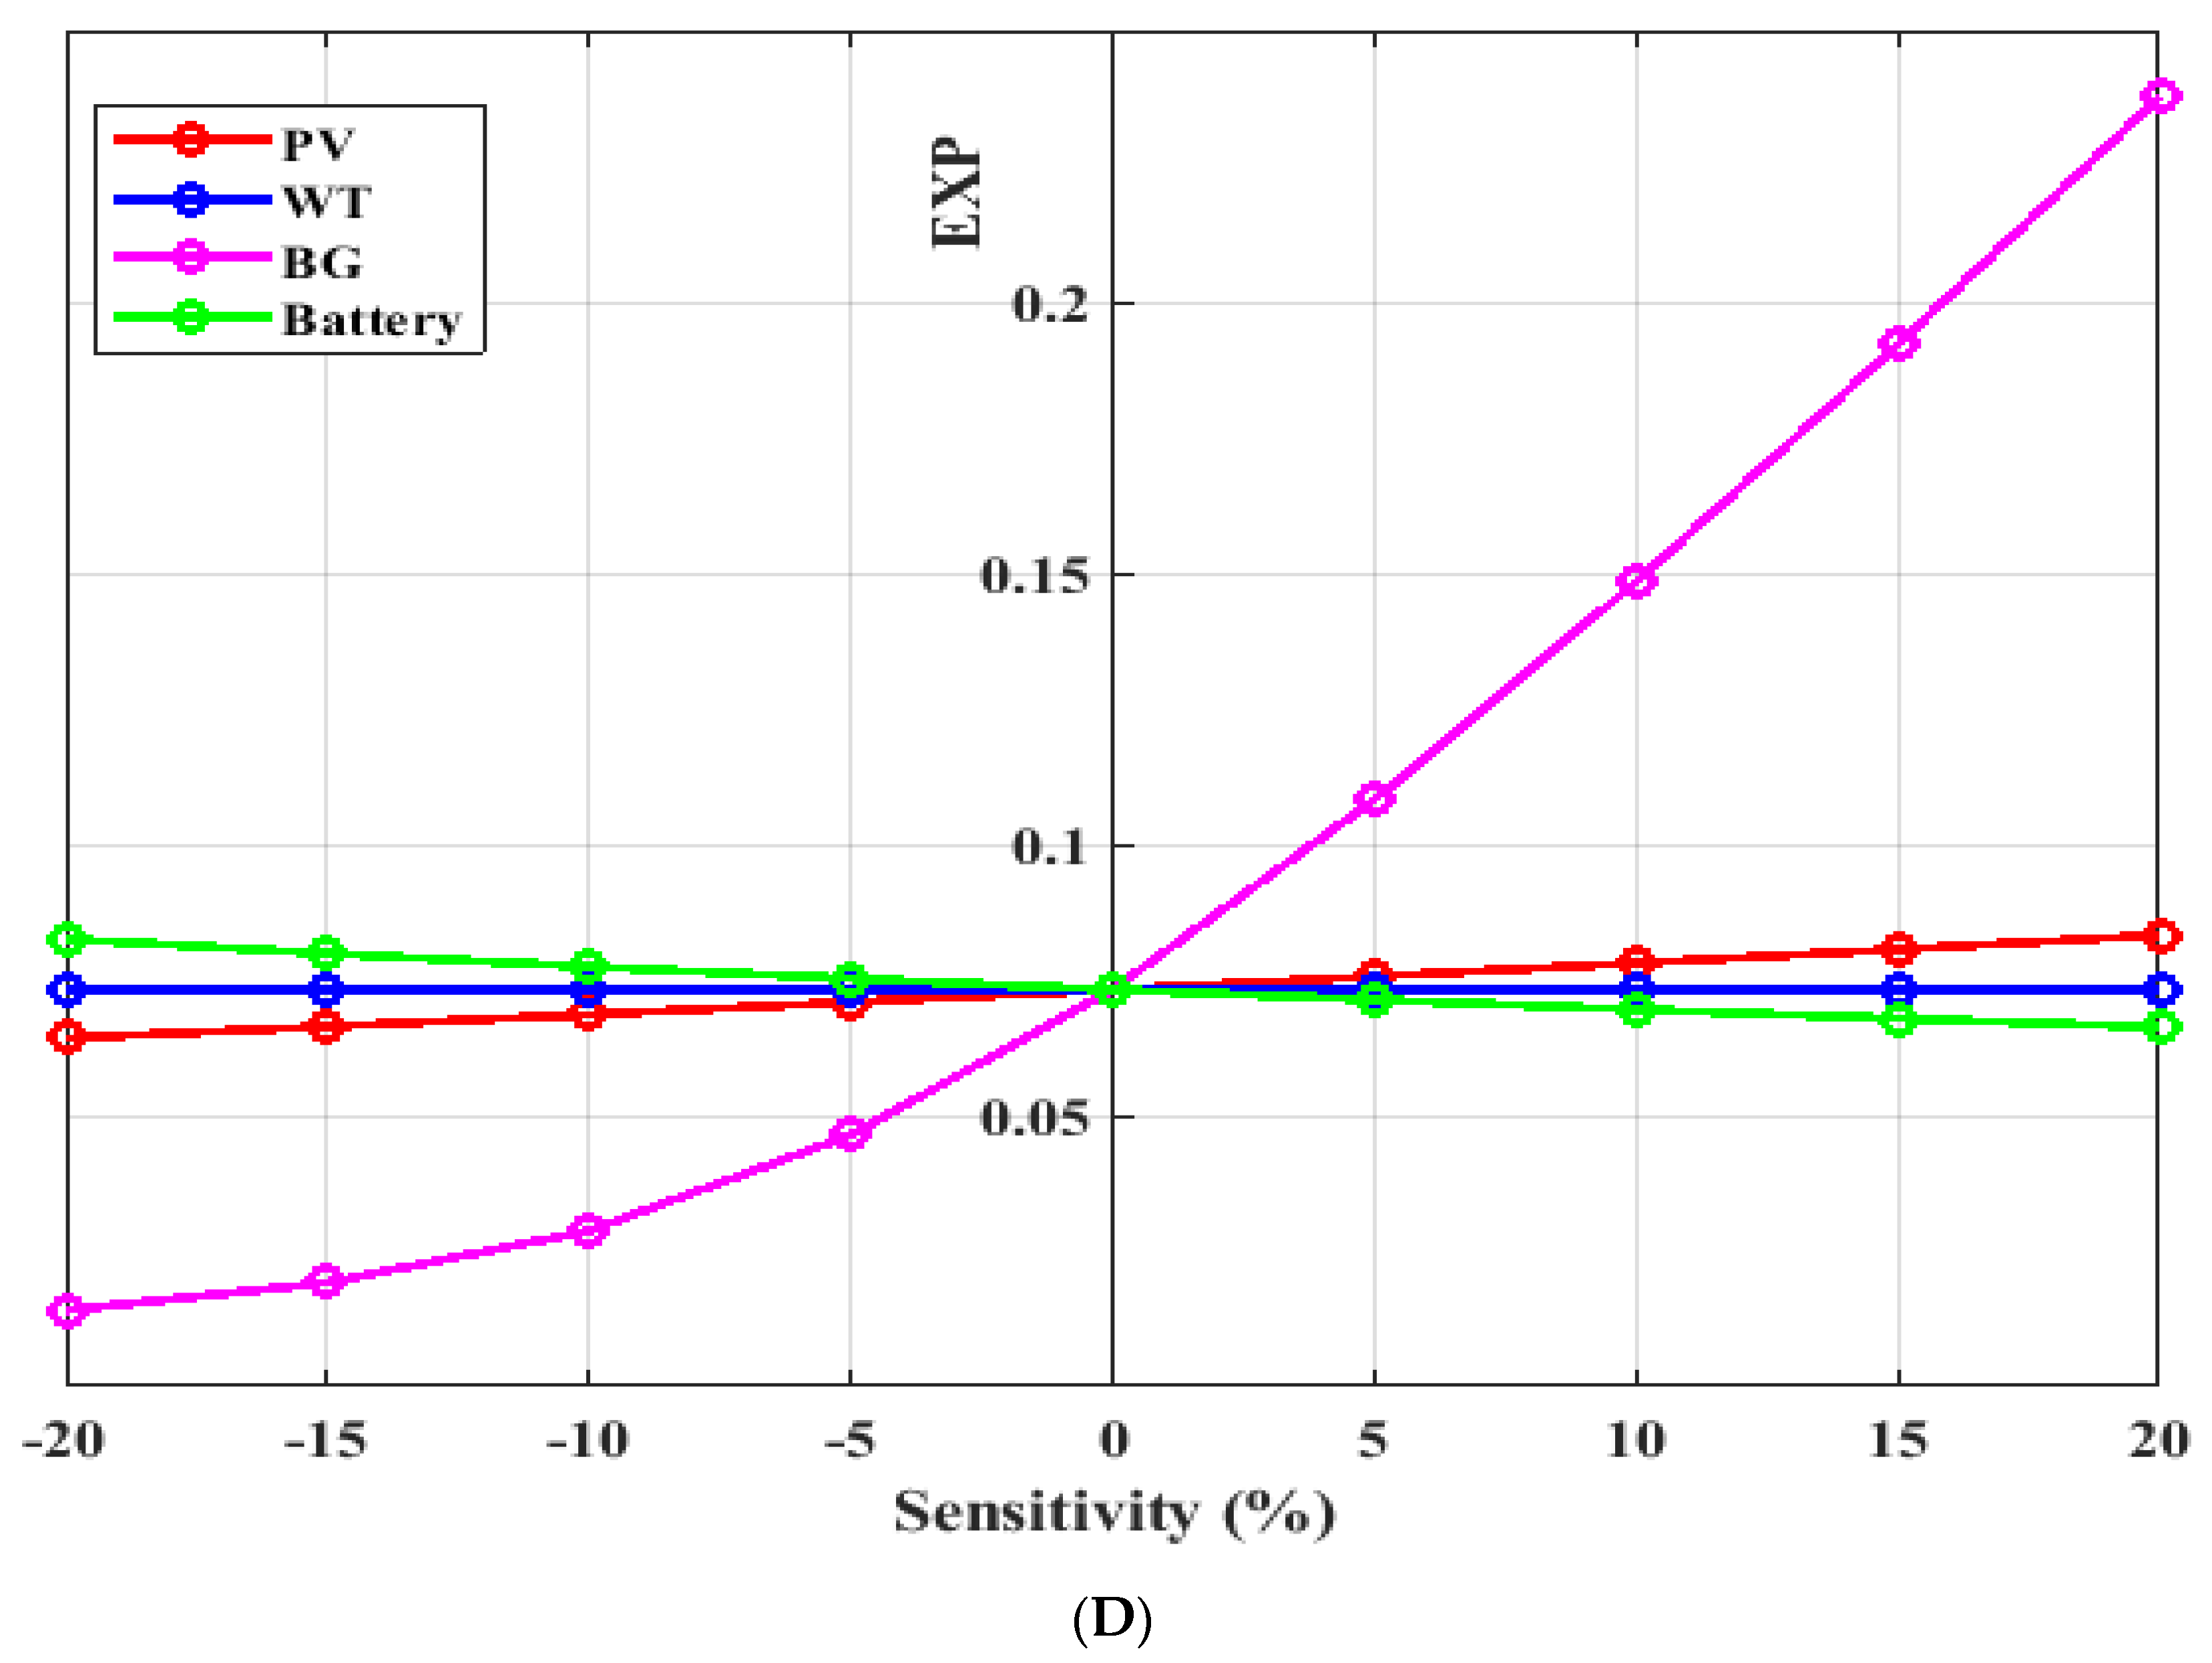
Figure 10, illustrate the sensitivity analysis of studying the impact of the variation of the decision parameters on the stand-alone system objective functions, (a) COE, (b) NPC, (c) LPSP, (d) EXP. Where “0” on the x-axis refers to the nominal values of the sensitivity factors.
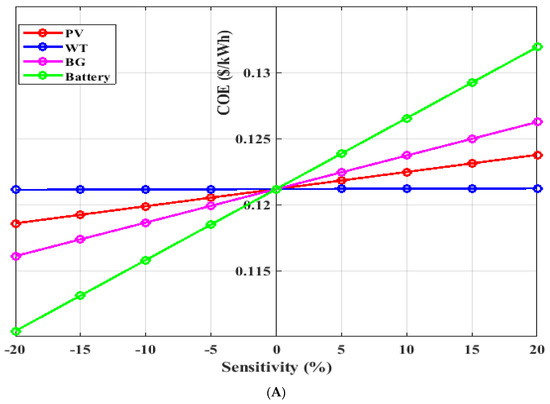
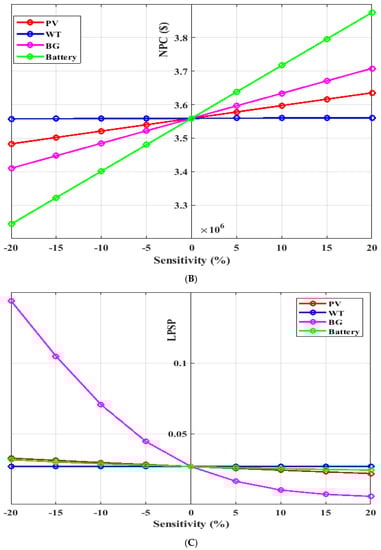

Figure 10.
Sensitivity analysis of studying the influence of sizing parameters variation on the stand-alone system variables, (a) COE, (b) NPC, (c) LPSP, (d) EXP. (A) The influence of sizing change on the energy cost. (B) The influence of sizing change on the NPC. (C) The influence of sizing variation on the LPSP. (D) The influence of sizing variation on an excess of energy.
Figure 10A,B illustrate the effect on the COE and the NPC. As it can be noted that, at lower values of the specified parameters, both COE and NPC drop when the number of each PV panels, biomass generators, and batteries decreased. While, at a higher parameter values, the COE and NPC raise with increasing the number of each PV panels, biomass generators, and batteries. For the number of wind turbines, it can be noted that both the COE and NPC are nearly constant with the variation of the wind turbines number.
Figure 10C,D indicates that the chosen parameters has an effect on the system parameters, especially the number of the biomass generators.
Table 11, illustrate the yearly expenses breakdown of the hybrid system units and in turns show the system’s NPC. The reader can notice that, for all suggested system cases the battery storage system has the highest yearly sharing of the capital cost compared to other system units. While the Biomass system has the highest operating and maintenance cost compared with other generating units in the suggested hybrid power system.
Table 11.
The contribution of the yearly cost of the system regarding the type of cost which includes the yearly interest of capital cost, operating and maintenance costs, and annual replacement cost.
7. Conclusions
This study offered a new meta-heuristic optimization method, called the Heap-based optimizer (HBO) technique, for design four different scenarios of a stand-alone hybrid power model based on PV, WT, Biomass system, and battery storage unit. The major objective function is minimizing the COE with increasing the reliability LPSP, which fulfils the required load of an isolated society in Alrashda village, Dakhla Oasis in the New Valley Governorate, Egypt. The operation of the suggested off-grid system relies on the meteorological data of wind speed, radiation and temperature per hour which obtained from NASA Surface Meteorology and Solar Energy website for 20 years for the selected region. The result obtained by the proposed methodology HBO which is based on utilizing MATLAB software was compared with other optimization methods CFA, GWO, STOA techniques.
The simulation results clearly showed that the suggested optimization method HBO is an effective method in identifying the optimal capacities of the generating and energy storage units and ensured good execution in the different scenarios of proposed the hybrid system. The results from the analyses presented in this study show the following:
- ✓
- The obtained results indicated that the HBO technique showed the optimal convergence between the investigated algorithms in reaching the best solution.
- ✓
- The HBO method has achieved the best optimal solution for Case-1 scenario. This case is a combination of PV/WT/biomass/Bat units, the best optimal solution has achieved after 27 iterations with the minimal COE of 0.121171 $/kWh, NPC of $ 3,559,143, and LPSP of 0.026789, followed by the results obtained from the CFA technique with the minimal COE of 0.1213225 $/kWh, NPC of $ 3,563,603, and LPSP of 0.0267184 after 44 iterations, followed by the results obtained from GWO, and STOA methods
- ✓
- The HBO technique has achieved the best optimal solution for Case-2 scenario. This case is consisted of PV/biomass/Bat units, the best optimal solution has achieved after 49 iterations with the minimal COE of 0.1311804 $/kWh, NPC of $3,853,160, and LPSP of 0.0298557, followed by the results obtained from the CFA method with the minimal COE of 0.1315446 $/kWh, NPC of $3,863,857, and LPSP of 0.0291707 after 32 iterations, followed by the results obtained from GWO, and STOA techniques.
- ✓
- Based on the results of parametric and non-parametric statistical measurements performed for a more accurate comparison of the four optimization methods, the proposed HBO in all studied cases showed the best results compared to other optimization methods.
- ✓
- STOA has achieved the best optimal solution for Case-3, and Case-4 with COE of 0.105673 and 0.332497 $/kWh, and NPC of $3,103,938 and $9,766,441, respectively.
- ✓
- By comparing the NPC of the four suggested cases, it finds that Case-3 achieved the lowest NPC, followed by the Case-1. Although the third scenario which based on WT/biomass/Bat units is the least NPC, but it is not the optimal and efficient system for use. As the design of this case is based on batteries and biomass generators only, which have the highest yearly sharing of the capital cost, operating and maintenance cost.
- ✓
- The hybrid power system which is consists of PV/WT/biomass/Bat units would be an appropriate solution with minimal investment cost for rural communities, small industries, isolated wells and isolated farming areas where grid access is too costly or even impossible.
Author Contributions
Conceptualization, H.A.E.-S., S.K. and H.S.; Data curation, H.A.E.-S., S.K., A.M.E. and F.J.; Formal analysis, S.K., H.S., A.M.E. and F.J.; Investigation, H.A.E.-S., S.K., H.S. and F.J.; Methodology, H.A.E.-S., S.K. and H.S.; Project administration, M.T.-V.; Resources, S.K., H.S., M.T.-V., A.M.E. and F.J.; Software, S.K., H.S. and M.T.-V.; Supervision, S.K., M.T.-V. and F.J.; Validation, S.K., H.S., M.T.-V. and A.M.E.; Visualization, M.T.-V. and F.J.; Writing—original draft, H.A.E.-S., S.K. and H.S.; Writing—review & editing, M.T.-V., A.M.E. and F.J. All authors have read and agreed to the published version of the manuscript.
Funding
The authors thank the support of the National Research and Development Agency of Chile (ANID), ANID/Fondap/15110019.
Institutional Review Board Statement
Not applicable.
Informed Consent Statement
Not applicable.
Data Availability Statement
Not applicable.
Conflicts of Interest
The authors declare no conflict of interest.
Appendix A
- HBO: Search agents number () = 20, Maximum number of iterations () = 100, and dimension size () = 4.
- CFA: = 20, T = 50, and dimension size = 4.
- GWO: = 20, = 100, = 4, and a linearly decreased from 2 to 0.
- STOA: = 20, = 100, =4, and a linearly decreased from 2 to 0.
References
- Ellabban, O.; Abu-Rub, H.; Blaabjerg, F. Renewable energy resources: Current status, future prospects and their enabling technology. Renew. Sustain. Energy Rev. 2014, 39, 748–764. [Google Scholar] [CrossRef]
- Sultan, H.M.; Menesy, A.S.; Kamel, S.; Korashy, A.; Almohaimeed, S.A.; Abdel-Akher, M. An improved artificial ecosystem optimization algorithm for optimal configuration of a hybrid PV/WT/FC energy system. Alex. Eng. J. 2021, 60, 1001–1025. [Google Scholar] [CrossRef]
- Abd El-Sattar, H.; Sultan, H.M.; Kamel, S.; Menesy, A.S.; Rahmann, C. Optimal Design of Hybrid Stand-alone Microgrids Using Tunicate Swarm Algorithm. In Proceedings of the 2021 IEEE International Conference on Automation/XXIV Congress of the Chilean Association of Automatic Control (ICA-ACCA), Valparaíso, Chile, 22–26 March 2021; pp. 1–6. [Google Scholar]
- Zhao, H.; Wu, Q.; Hu, S.; Xu, H.; Rasmussen, C.N. Review of energy storage system for wind power integration support. Appl. Energy 2015, 137, 545–553. [Google Scholar] [CrossRef]
- Khan, A.; Javaid, N. Optimal sizing of a stand-alone photovoltaic, wind turbine and fuel cell systems. Comput. Electr. Eng. 2020, 85, 106682. [Google Scholar] [CrossRef]
- Al-Sharafi, A.; Sahin, A.Z.; Ayar, T.; Yilbas, B.S. Techno-economic analysis and optimization of solar and wind energy systems for power generation and hydrogen production in Saudi Arabia. Renew. Sustain. Energy Rev. 2017, 69, 33–49. [Google Scholar] [CrossRef]
- Singh, A.; Baredar, P. Techno-economic assessment of a solar PV, fuel cell, and biomass gasifier hybrid energy system. Energy Reports 2016, 2, 254–260. [Google Scholar] [CrossRef] [Green Version]
- Elkadeem, M.R.; Wang, S.; Sharshir, S.W.; Atia, E.G. Feasibility analysis and techno-economic design of grid-isolated hybrid renewable energy system for electrification of agriculture and irrigation area: A case study in Dongola, Sudan. Energy Convers. Manag. 2019, 196, 1453–1478. [Google Scholar] [CrossRef]
- Ajlan, A.; Tan, C.W.; Abdilahi, A.M. Assessment of environmental and economic perspectives for renewable-based hybrid power system in Yemen. Renew. Sustain. Energy Rev. 2017, 75, 559–570. [Google Scholar] [CrossRef]
- Dufo-López, R.; Cristóbal-Monreal, I.R.; Yusta, J.M. Optimisation of PV-wind-diesel-battery stand-alone systems to minimise cost and maximise human development index and job creation. Renew. Energy 2016, 94, 280–293. [Google Scholar] [CrossRef]
- Cano, A.; Arévalo, P.; Jurado, F. Energy analysis and techno-economic assessment of a hybrid PV/HKT/BAT system using biomass gasifier: Cuenca-Ecuador case study. Energy 2020, 202, 117727. [Google Scholar] [CrossRef]
- Jamshidi, M.; Askarzadeh, A. Techno-economic analysis and size optimization of an off-grid hybrid photovoltaic, fuel cell and diesel generator system. Sustain. Cities Soc. 2019, 44, 310–320. [Google Scholar] [CrossRef]
- Suresh, M.; Meenakumari, R. An improved genetic algorithm-based optimal sizing of solar photovoltaic/wind turbine generator/diesel generator/battery connected hybrid energy systems for standalone applications. Int. J. Ambient Energy 2021, 42, 1136–1143. [Google Scholar] [CrossRef]
- Kharrich, M.; Kamel, S.; Abdeen, M.; Mohammed, O.H.; Akherraz, M.; Khurshaid, T.; Rhee, S.B. Developed approach based on equilibrium optimizer for optimal design of hybrid PV/Wind/Diesel/Battery Microgrid in Dakhla, Morocco. IEEE Access 2021, 9, 13655–13670. [Google Scholar] [CrossRef]
- Ramli, M.A.M.; Bouchekara, H.R.E.H.; Alghamdi, A.S. Optimal sizing of PV/wind/diesel hybrid microgrid system using multi-objective self-adaptive differential evolution algorithm. Renew. Energy 2018, 121, 400–411. [Google Scholar] [CrossRef]
- Ashraf, M.A.; Liu, Z.; Alizadeh, A.; Nojavan, S.; Jermsittiparsert, K.; Zhang, D. Designing an optimized configuration for a hybrid PV/Diesel/Battery Energy System based on metaheuristics: A case study on Gobi Desert. J. Clean. Prod. 2020, 270, 122467. [Google Scholar] [CrossRef]
- Zaki Diab, A.A.; El-Ajmi, S.I.; Sultan, H.M.; Hassan, Y.B. Modified farmland fertility optimization algorithm for optimal design of a grid-connected hybrid renewable energy system with fuel cell storage: Case study of Ataka, Egypt. Int. J. Adv. Comput. Sci. Appl. 2019, 10, 119–132. [Google Scholar]
- Geleta, D.K.; Manshahia, M.S.; Vasant, P.; Banik, A. Grey wolf optimizer for optimal sizing of hybrid wind and solar renewable energy system. Comput. Intell. 2020, 1–30. [Google Scholar] [CrossRef]
- Singh, S.; Kaushik, S.C. Optimal sizing of grid integrated hybrid PV-biomass energy system using artificial bee colony algorithm. IET Renew. Power Gener. 2016, 10, 642–650. [Google Scholar] [CrossRef]
- Bukar, A.L.; Tan, C.W.; Lau, K.Y. Optimal sizing of an autonomous photovoltaic/wind/battery/diesel generator microgrid using grasshopper optimization algorithm. Sol. Energy 2019, 188, 685–696. [Google Scholar] [CrossRef]
- Heydari, A.; Askarzadeh, A. Optimization of a biomass-based photovoltaic power plant for an off-grid application subject to loss of power supply probability concept. Appl. Energy 2016, 165, 601–611. [Google Scholar] [CrossRef]
- Sarkar, T.; Bhattacharjee, A.; Samanta, H.; Bhattacharya, K.; Saha, H. Optimal design and implementation of solar PV-wind-biogas-VRFB storage integrated smart hybrid microgrid for ensuring zero loss of power supply probability. Energy Convers. Manag. 2019, 191, 102–118. [Google Scholar] [CrossRef]
- Li, J.; Liu, P.; Li, Z. Optimal design and techno-economic analysis of a solar-wind-biomass off-grid hybrid power system for remote rural electrification: A case study of west China. Energy 2020, 208, 118387. [Google Scholar] [CrossRef]
- Ghosh, S.; Karar, V. Assimilation of optimal sized hybrid photovoltaic-biomass system by dragonfly algorithm with grid. Energies 2018, 11, 1892. [Google Scholar] [CrossRef] [Green Version]
- Eteiba, M.B.; Barakat, S.; Samy, M.M.; Wahba, W.I. Optimization of an off-grid PV/Biomass hybrid system with different battery technologies. Sustain. Cities Soc. 2018, 40, 713–727. [Google Scholar] [CrossRef]
- Sawle, Y.; Gupta, S.C.; Bohre, A.K. Socio-techno-economic design of hybrid renewable energy system using optimization techniques. Renew. Energy 2018, 119, 459–472. [Google Scholar] [CrossRef]
- Alshammari, N.; Asumadu, J. Optimum unit sizing of hybrid renewable energy system utilizing harmony search, Jaya and particle swarm optimization algorithms. Sustain. Cities Soc. 2020, 60, 102255. [Google Scholar] [CrossRef]
- Sultan, H.M.; Kuznetsov, O.N.; Menesy, A.S.; Kamel, S. Optimal Configuration of a Grid-Connected Hybrid PV/Wind/Hydro-Pumped Storage Power System Based on a Novel Optimization Algorithm. In Proceedings of the 2020 International Youth Conference on Radio Electronics, Electrical and Power Engineering (REEPE), Moscow, Russia, 12–14 March 2020. [Google Scholar] [CrossRef]
- Jung, W.; Jeong, J.; Kim, J.; Chang, D. Optimization of hybrid off-grid system consisting of renewables and Li-ion batteries. J. Power Sources 2020, 451, 227754. [Google Scholar] [CrossRef]
- Diab, A.A.Z.; Sultan, H.M.; Mohamed, I.S.; Kuznetsov, O.N.; Do, T.D. Application of Different Optimization Algorithms for Optimal Sizing of PV/Wind/Diesel/Battery Storage Stand-Alone Hybrid Microgrid. IEEE Access 2019, 7, 119223–119245. [Google Scholar] [CrossRef]
- Sawle, Y.; Gupta, S.C.; Bohre, A.K. Review of hybrid renewable energy systems with comparative analysis of off-grid hybrid system. Renew. Sustain. Energy Rev. 2018, 81, 2217–2235. [Google Scholar] [CrossRef]
- El-Sattar, H.A.; Kamel, S.; Tawfik, M.A.; Vera, D.; Jurado, F. Modeling and Simulation of Corn Stover Gasifier and Micro-turbine for Power Generation. Waste Biomass Valorization 2018, 10, 1–14. [Google Scholar] [CrossRef]
- El-Sattar, H.A.; Kamel, S.; Tawfik, M.A.; Vera, D. Modeling of a Downdraft Gasifier Combined with Externally Fired Gas Turbine using rice straw for generating electricity in Egypt. In Proceedings of the 2016 Eighteenth International Middle East Power Systems Conference (MEPCON), Cairo, Egypt, 27–29 December 2016; pp. 747–752. [Google Scholar]
- El-Sattar, H.A.; Kamel, S.; Vera, D.; Jurado, F. Tri-generation biomass system based on externally fired gas turbine, organic rankine cycle and absorption chiller. J. Clean. Prod. 2020, 260, 121068. [Google Scholar] [CrossRef]
- El-Sattar, H.A.; Kamel, S.; Jurado, F. Fixed bed gasification of corn stover biomass fuel: Egypt as a case study. Biofuels Bioprod. Biorefining 2020, 14, 7–19. [Google Scholar] [CrossRef]
- Samy, M.M.; Barakat, S.H. biomass and fuel cells Multi-objective optimization of hybrid renewable energy system based on biomass and fuel cells. Int. J. Energy Res. 2021, 45, 8214–8230. [Google Scholar] [CrossRef]
- Alturki, F.A.; Awwad, E.M. Sizing and Cost Minimization of Standalone Hybrid WT/PV/Biomass/Pump-Hydro Storage-Based Energy Systems. Energies 2021, 14, 489. [Google Scholar] [CrossRef]
- Diab, A.A.Z.; Sultan, H.M.; Kuznetsov, O.N. Optimal sizing of hybrid solar/wind/hydroelectric pumped storage energy system in Egypt based on different meta-heuristic techniques. Environ. Sci. Pollut. Res. 2020, 27, 32318–32340. [Google Scholar] [CrossRef] [PubMed]
- Hossain, M.S.; Jahid, A.; Islam, K.Z.; Rahman, M.F. Solar PV and Biomass Resources-Based Sustainable Energy Supply for Off-Grid Cellular Base Stations. IEEE Access 2020, 8, 53817–53840. [Google Scholar] [CrossRef]
- Askari, Q.; Saeed, M.; Younas, I. Heap-based optimizer inspired by corporate rank hierarchy for global optimization. Expert Syst. Appl. 2020, 161, 113702. [Google Scholar] [CrossRef]
- Ghasemi, M.; Ghavidel, S.; Aghaei, J.; Akbari, E.; Li, L. CFA optimizer: A new and powerful algorithm inspired by Franklin’s and Coulomb’s laws theory for solving the economic load dispatch problems. Int. Trans. Electr. Energy Syst. 2018, 28, 1–30. [Google Scholar] [CrossRef] [Green Version]
- Dhiman, G.; Kumar, V. Seagull optimization algorithm: Theory and its applications for large-scale industrial engineering problems. Knowl.-Based Syst. 2019, 165, 169–196. [Google Scholar] [CrossRef]
- Mirjalili, S.; Mirjalili, S.M.; Lewis, A. Grey Wolf Optimizer. Adv. Eng. Softw. 2014, 69, 46–61. [Google Scholar] [CrossRef] [Green Version]

Publisher’s Note: MDPI stays neutral with regard to jurisdictional claims in published maps and institutional affiliations. |
© 2021 by the authors. Licensee MDPI, Basel, Switzerland. This article is an open access article distributed under the terms and conditions of the Creative Commons Attribution (CC BY) license (https://creativecommons.org/licenses/by/4.0/).