1. Introduction
Cancer is one of the leading causes of mortality, and anatomical and functional imaging is of vital importance for diagnosis, treatment planning, and treatment response, which has become standard in clinical protocols for many different oncological disease types. However, qualitative analyses are not always sufficient to reveal disease characteristics and to make a treatment decision or final diagnosis with the utmost confidence. To date, interest has emerged in characterizing tumor heterogeneity and phenotypes based on innovative image-based biomarkers related to the pathological, genomic, proteomic, and clinical data. Recent advances in computational power and the use of automated algorithms have generated a new area of research termed radiomics [
1,
2] that can be applied on imaging data sets such as computed tomography (CT) [
3,
4], positron emission tomography (PET) [
5,
6], and magnetic resonance imaging (MRI) [
7,
8]. It is based on the extraction of a large variety of biomarkers from images in order to improve diagnosis and treatment response prediction, and thus potentially allow for the personalization of cancer treatments. The fundamental hypothesis of radiomics is that much more information is presented in medical images than what visual assessment can understand, and therefore, the pathophysiological information of tumors can be captured using image biomarkers. In computer vision and image processing, a biomarker is an information about the content of an image and can be renamed as feature. Specifically, these features express properties regarding the shape, histogram, and texture of the images. Shape features are based on the surface reconstruction whereas first-order metrics are obtained from the histogram that describes the distribution of voxel intensities in the image. Information about inter-voxel relationships within the image can be interpreted using higher-order statistics based on texture analysis. As a result, quantitative analysis based on these features is considered one of the key findings in clinical studies for cancer detection, diagnosis and therapy assessment, resulting in improved decision support systems. Nevertheless, their clinical application may be challenging. A major obstacle is that the “robustness” of the extracted radiomics features is unclear. Robustness is understood as the level of variability of features as a result of perturbations, such as image co-registration. In other words, an essential ingredient to establish novel quantitative imaging biomarkers in clinical practice is to quantify and ascertain the consistency of radiomics features.
Recently, many researchers have focused on gaining a deeper understanding of feature robustness. However, most studies used phantoms, and consequently, it is difficult to ensure that their results could be applied to imaging studies of real patients [
9]. Furthermore, standardizing the parameters during image acquisition in clinical settings is a challenge. To date, there are various studies on the robustness of radiomics features due to various factors, such as the impact of voxel size resampling and interpolation, image perturbation, different slice thickness, etc. [
10,
11,
12], and many works have discussed the potential uncertainty of feature extraction, i.e., [
13].
In PET imaging, some standardized semi-quantitative measurements are usually extracted and used in clinical practice, such as the standardized uptake value (SUV), and the metabolically active tumor volume (MTV) [
14]. Tixier et al. [
15] investigated the reproducibility of SUV, intensity histogram features, intensity-size zone features, and co-occurrence matrices features. The results showed that these features were insensitive to the discretization range. Hatt et al. [
16] investigated the robustness of PET based heterogeneity textural features with respect to the delineation of volumes and partial volume effects correction. These features were significantly affected by the differences in the volume delineation. The authors further reported that local features, e.g., entropy and heterogeneity, were more robust when compared to regional features, e.g., intensity variability and size-zone variability. To the best of our knowledge, no studies have analyzed the robustness of PET radiomics features in a real patients’ dataset after the co-registration with MRI.
We hypothesize that image co-registration can change the voxel intensity relationships between neighboring voxels which in turn changes the feature values. Furthermore, the volume shape is likely to differ from the original one, changing the shape based feature values, such as the sphericity, compactness, convexity, etc. [
17]. In practice, we expected that the image co-registration would introduce further uncertainty to radiomics studies. Specifically, we consider PET images, and we assess the variation in PET radiomics features after the co-registration with T1-weighted MRI, and FLAIR MR images obtained using the same acquisition protocols and the same scanners. MRI is generally used for standard clinical care of patients with brain tumors (i.e., diagnoses, monitor tumor progression, and treatment response assessment) but the clinical role of PET in the management of these patients has evolved considerably in recent years. Consequently, MRI and PET are applied to diagnose and classify brain tumors before surgery, to plan and manage intraoperative phase, to monitor and evaluate response to treatment, and to understand the effects of treatment on the patient’s brain.
A recent radiomics study [
18] suggests that [18F]-Fluorodeoxiglucose (FDG) PET-based radiomics is a reliable non-invasive method to distinguish lymphoma and glioblastoma. Specifically, thirteen features were selected for the differential diagnosis of lymphoma and glioblastoma. The same research group [
19] affirms that the radiomics signature based on FDG-PET is a promising method for the non-invasive measurement of glioma proliferative activity and facilitates the prediction of patient prognoses. Nevertheless, although FDG is considered the best oncology radio-tracer in PET, it shows a high-glucose metabolism in normal brain tissue, which hinders the identification of a low- or intermediate-grade tumor with similar or less activity. For this reason, an alternative radio-tracer, [11C]- Methionine (MET), is studied since it provides a high detection rate of focal lesions in the central nervous system [
20]. Particularly, [11C]-MET reflects amino acid transport in tumor which demonstrates a higher efficiency compared to [18F]-FDG in delineating the tumor extent, especially in the low-grade gliomas. The uptake of amino acid in a normal brain is relatively low as compared to those with gliomas since cancers need to consume more methionine for extensive proliferation and survival, while normal cells do not [
21]. For this reason, it is important to incorporate MET-PET imaging in addition to MRI to provide specific information for defining the target volume for the radio-surgical treatment in patients with recurrent brain tumors to optimize target identification for infiltrating or ill-defined brain lesions.
Considering MET-PET radiomics studies, Stefano, et al. [
5] were able to select a sub-panel of three features (namely asphericity, low-intensity run emphasis, and complexity) with valuable association with patient outcome (sensitivity, 81.23%; specificity, 73.97%; accuracy, 78.27%). Hotta et al. [
22] developed a radiomics model to differentiate recurrent brain tumor from radiation necrosis based on MET-PET in a mixed cohort of 41 patients with brain metastasis or glioma. A random forest classifier was trained to separate radiation necrosis from recurrent brain tumor. The implemented radiomics model obtained an area under the receiver operating characteristic curve (AUC) of 0.98 (specificity, 94%; sensitivity, 90%). Papp at al. [
23] considered machine-learning-driven survival models for glioma built on in vivo MET-PET characteristics, ex vivo characteristics, and patient characteristics with an AUC of 0.9. However, many technical challenges still remain, including image co-registration, such that PET radiomics can effectively contribute to personalized medicine [
24].
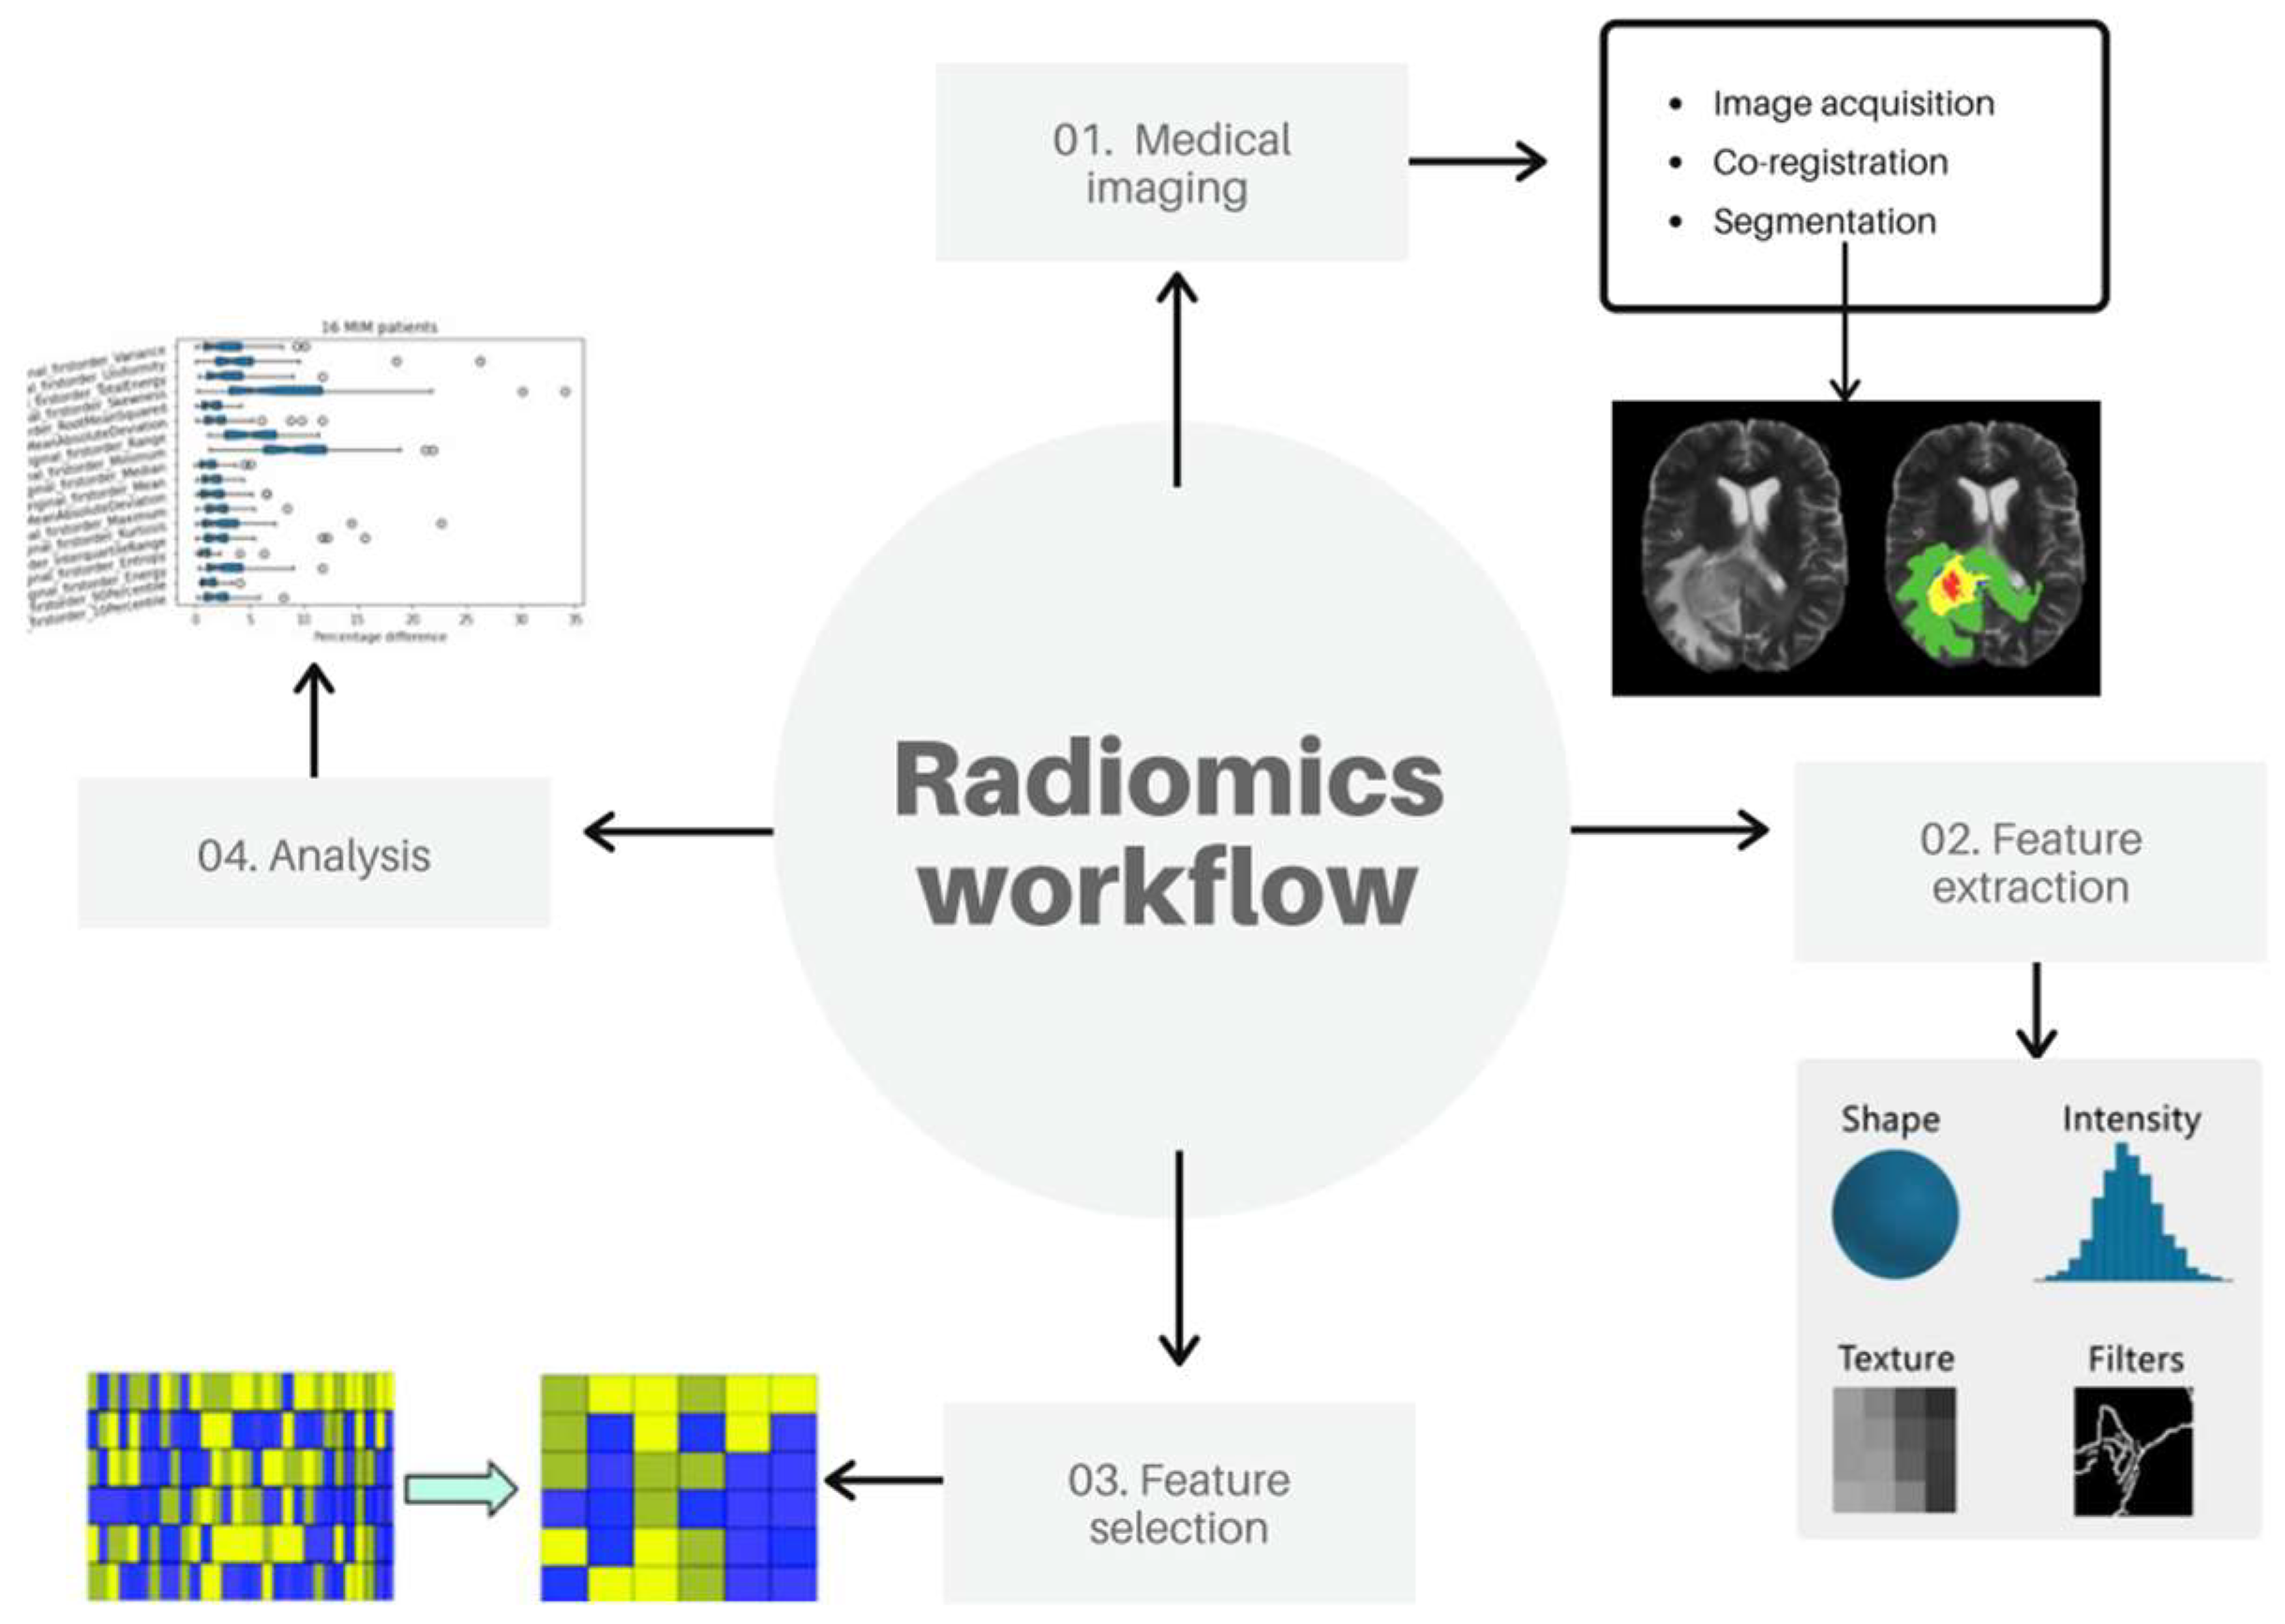
For this reason, seventeen glioblastoma patients who underwent both MET-PET and MRI between a time range of three years (2016–2019) were used for our analysis by extracting radiomics features grouped into shape, first- and higher-order features. Usually, the feature extraction task is one of the five fundamental tasks of a radiomics workflow [
25] together with image acquisition, target segmentation, feature selection, and implementation of the classification model to predict the clinical outcome. Nevertheless, our study will omit the final task focusing on the first four steps by newly adding the PET/MRI co-registration prior to the feature extraction process to evaluate its impact in a radiomics study.
2. Materials and Methods
To analyze the stability of PET radiomics features after co-registration with MRI, the PET volume of interest was delineated before and after co-registration using a semi-automatic threshold segmentation approach, followed by the extraction of radiomics features. Afterward, a robustness analysis was performed considering the different feature groups and, since not all radiomics features are useful in predicting a particular outcome of an event, the most representative features were identified from the large number of extracted features through an appropriate selection algorithm. An overview of our workflow is shown in
Figure 1. Each step is detailed in the following sections.
2.1. Medical Imaging
While MRI images are anatomical imaging with high spatial resolutions but a limited physiological information, PET images provide metabolic details on the target but with poor spatial resolution leading to low-valued anatomical information. As a consequence, it would be advantageous to integrate useful data from those two images into a single one with complementary anatomical and functional information yielding more accurate disease information that will significantly aid in the early detection of tumors and enhance the efficiency of diagnosis. Compared with PET/CT, hybrid PET/MRI is capable of providing superior anatomical detail while reducing the cost of significant radiation exposure. The adoption of hybrid PET/MRI, however, is still limited. Consequently, while PET/CT is an image acquired with a single device in almost all hospital centers, PET/MRI performed in a single scanning session is not yet a widely used technology. For this reason, PET/MRI image co-registration, which is a process of overlaying images from different modalities taken at different time points of the same organ, plays an increasingly important role in the part of medical imaging analysis. Therefore, seventeen glioblastoma patients undergoing [11C]-MET PET (Biograph Horizon, Siemens Healthcare, Erlangen, Germany) and MRI (T1-weighted and FLAIR sequences, Achieva, Philips Healthcare, Best, The Netherlands) examinations were considered. An interval of no more than 15 days between PET and MRI examinations was considered. Specifically, the mean interval was of 6.6 days (range 2–15 days). PET images were reconstructed using the Ordered Subset Expectation Maximization (OSEM) with 4 iterations with a 512 × 512 image matrix and a voxel size of 0.4821 mm × 0.4821 mm × 3 mm. T1-weithted sequences had a matrix resolution of 288 × 288 with a voxel size of 0.8888 mm × 0.8888 mm × 2 mm, while FLAIR sequences had a matrix resolution 240 × 240 image matrix with a voxel size of 1 mm × 1 mm × 2 mm. PET/MRI co-registrations were obtained using the automatic registration MIM software (MIM v.7.0.5 software; Cleveland, OH, USA). Rigid Assisted Alignment is MIM’s default method for aligning images by maximization of mutual information. An optimization routine adjusts the translation and rotation between the two series in order to maximize a mutual information metric. The mutual information metric is based on the intensities of the overlapping voxels between the two images that are being aligned and is partially based on joint entropy calculations between the volumes. The theory is that the ratio of intensity levels should vary little in regions of similar structures contained in the series. Therefore, the variability of this ratio should be minimized, and mutual information maximized, when the images are aligned correctly. The advantage of this technique is that it is general in nature and can be used to align series of the same modality or different modalities. In our study, this function produces a link between PET and MRI series that allows you to localize and scroll on both series simultaneously, transfer contours, and more.
The following steps were performed for all patient studies such that there were no differences in the co-registration algorithm while avoiding other sources of bias:
In an open session, click the “Create Fusion” tool;
Select the main series;
Select the secondary series;
The co-registered image is created and appears on the current page.
The primary series is the series that remains unaltered when co-registration is performed (MRI in our study). The secondary series (PET) is rotated and translated to be alignment with the main series which aligns images by maximization of mutual information. An optimization routine adjusts translation and rotation between the two series in order to maximize a mutual information metric. After that, the segmentation task was performed on the original and co-registered PET images. This process is challenging because many tumors show unclear borders [
26]. Radiologists can flexibly delineate targets manually resulting in highly accurate segmentations. Nevertheless, manual segmentation is labor-intensive, time-consuming, and not always feasible for radiomics analysis requiring huge datasets. Additionally, manual segmentation is subject to inter- and intra-observer variability [
27]. Hence, many semi-automatic delineation algorithms, such as region growing or thresholding, are used in the clinical environment although less precise than manual segmentation. Conversely, they reduce the operator interaction in the segmentation process, improving time efficiency, and reproducibility. Consequently, the stand-alone and freely available Local Image Feature Extraction (LifeX, IMIV/CEA, Orsay, France) platform [
28] was used. Specifically, the threshold method was applied in the regions including the target roughly determined by the user. With this approach, the region is identified by the user, but no accurate drawing is required. Once the inclusion of the anomalous region was chosen, the algorithm performed all the subsequent processes automatically leading in the delineation of the volume of interest (VOI). According to [
29], the threshold value was set at 40% of the maximum SUV (SUV
max). This operation was performed for each PET study, before and after image co-registration.
2.2. Feature Extraction
After VOI identification, the extraction of radiomics features was performed for each patient in the data set. One of the main points in radiomics is to increase the reproducibility of the extracted features. For this, the image biomarker standardization initiative (IBSI) [
30], which is an independent international collaborative study towards the standardization of radiomics features for the purpose of high-throughput quantitative image analyses, has been introduced. For this reason, we used a comprehensive open source IBSI-compliant platform called PyRadiomics (Harvard Medical School, Boston, MA, USA) [
31], which enables processing and extraction of radiomics features from medical image data using a large panel of engineered hard-coded feature algorithms, and currently is one of the most commonly used software for radiomics studies. PyRadiomics is implemented in Python, a language that has established itself as a popular open-source language for scientific computing, and which can be installed on any system. PyRadiomics provides a flexible analysis platform with a back-end interface allowing automation in data processing, feature definition, and batch handling. The Pyradiomics platform calculates different feature classes, namely first-order statistics, shape descriptors, and five texture classes: gray level cooccurrence matrix (GLCM), gray level run-length matrix (GLRLM), gray level dependence matrix (GLDM), gray level size-zone matrix (GLSZM) and neighboring gray level dependence matrix (NGLDM).
Shape-based features are based on the VOI voxel representation and are independent of the distribution of gray level intensity in the image. They are used to describe the three-dimensional shape, size of the lesion and other geometric aspects such as volume, maximum diameter along different orthogonal directions, surface, tumor compactness, and sphericity (a measure of roundness). Specifically, compactness and sphericity describe how the VOI shape differs from that of a circle (for 2D analyses) or a sphere (for 3D analyses). Additionally, the surface area is calculated by triangulation (a process that produces a net of triangles that completely cover the tumor surface) and serves as a base for calculation of the surface-volume ratio: spiculated tumors show higher values than those of a round tumor of similar volume. Furthermore, flatness describes whether the surface of the object is flat or has raised areas or indentations. In short, these radiomics features provide physical measurements and significantly contribute to clinical outcome.
First-order statistical features describe the frequency distribution of voxels within a VOI. This information can be obtained from the histogram of gray-level intensity values; for this, they are referred as “histogram-based” features. Sophisticated features include skewness and kurtosis, which describe the shape of the intensity distribution of data: skewness reflects the asymmetry of the data distribution curve to lower or higher values than the mean one (negative skew and positive skew, respectively), whereas kurtosis reflects the tail of a data distribution with respect to a gaussian distribution due to outliers. Other features include histogram entropy and uniformity (also called energy).
Texture analysis is a key concept in radiomics. It refers to wide variety of quantitative methods that are used to assess the relative voxel positions within the image to derive texture features. As a result, the texture features provide information on the spatial organization of color or intensities in an image or a selected region of an image. The texture is a linked set of voxels fulfilling a given gray level property that occurs repeatedly in an image region thus creating a textured region. Due to the fact that the texture is characterized by the spatial distribution of gray levels in a neighborhood, it cannot be defined for a point. Texture features are sub-categorized according to particular matrices from which they are obtained. These matrices are calculated to describe the spatial voxel differences by considering the spatial correlation properties of gray scales and therefore are the most capable of expressing the correlation between different parts of the tumor. In particular, GLCM is used to quantify the incidence of voxels with same intensities at a predetermined distance along a fixed direction while GLRLM quantifies consecutive voxels with the same intensity along fixed directions and GLDM is created by counting the number of voxel segments having the same intensity in a given direction. In addition, GLSZM is defined as number of connected voxels that have equal gray level intensity. Finally, NGTDM valuates the spatial interrelationships between 3 or more voxels. These features provide a complete information of the tumor; therefore, it is believed to match and resemble the visual experience of a human.
To evaluate the difference percentage (DP) coefficient between the feature values extracted from the original PET images and the co-registered PET ones, we used the following formula:
2.3. Feature Selection and Analysis
The process of identifying small sets of features useful for diagnostic purposes, namely the selection feature process, is a challenging task in radiomics studies. The aim is to obtain the smallest possible set of features, considered as optimal set for achieving a good predictive performance, thus leading to exclusion of non-reproducible, redundant, and irrelevant features from the dataset. In this study, we want to investigate whether the same optimal set of radiomic features is obtained from three sets of images, namely original PET, PET co-registered with T1-weighted MRI, and PET co-registered with FLAIR MRI. In that way, the robustness of radiomics features can be evaluated after co-registration. Spearman’s rank correlation coefficient, which belongs to the filter method group [
25], is used to assess whether there is any association between two observed features and to estimate the strength of this relationship. In this way, it is possible to eliminate all features whose level of correlation is above a user-specified threshold. For two sets of variables x and y, each raw score x
i and y
i is converted to ranks X
i and Y
i. The Spearman’s correlation coefficient is then used on the ranked variables which can be expressed mathematically by the following formula:
where d
i = Xi − Yi is the difference between ranks and n is the number of paired observations. The coefficient ranges from −1 to +1, where negative values indicate that y decreases with x and positive values indicate that y increases with x. In other words, a correlation of 1.0 indicates a perfect positive correlation, and a correlation of −1.0 indicates a perfect negative correlation. Particularly, the strength of association between the two variables is considered very strong if the coefficient ranges from 0.8 to 1, moderate from 0.6 to 0.7, weak from 0.3 to 0.5, and very weak when less than 0.2. When the correlation coefficient is equal to 0, the two variables are independent from one another [
32] (see
Table 1).
In our study, a threshold of 0.8 was selected such that a number of high correlated features will be extracted. Consequently, a list of features that are not correlated, i.e., have the correlation coefficient lower than the chosen threshold, is obtained. After applying this correlation-based method, observation of different radiomic features from three different sets of images is obtained to evaluate the robustness of radiomics features following co-registration interference.
3. Results and Discussions
A total of 107 features (14 shape features, 18 first-order statistical features, and 65 texture features) were extracted from each PET study before and after co-registration with T1-weighted (for 15 patients because two T1 images were unavailable), and FLAIR (for all 17 patients) MRI sequences, for a total of three feature datasets for each lesion.
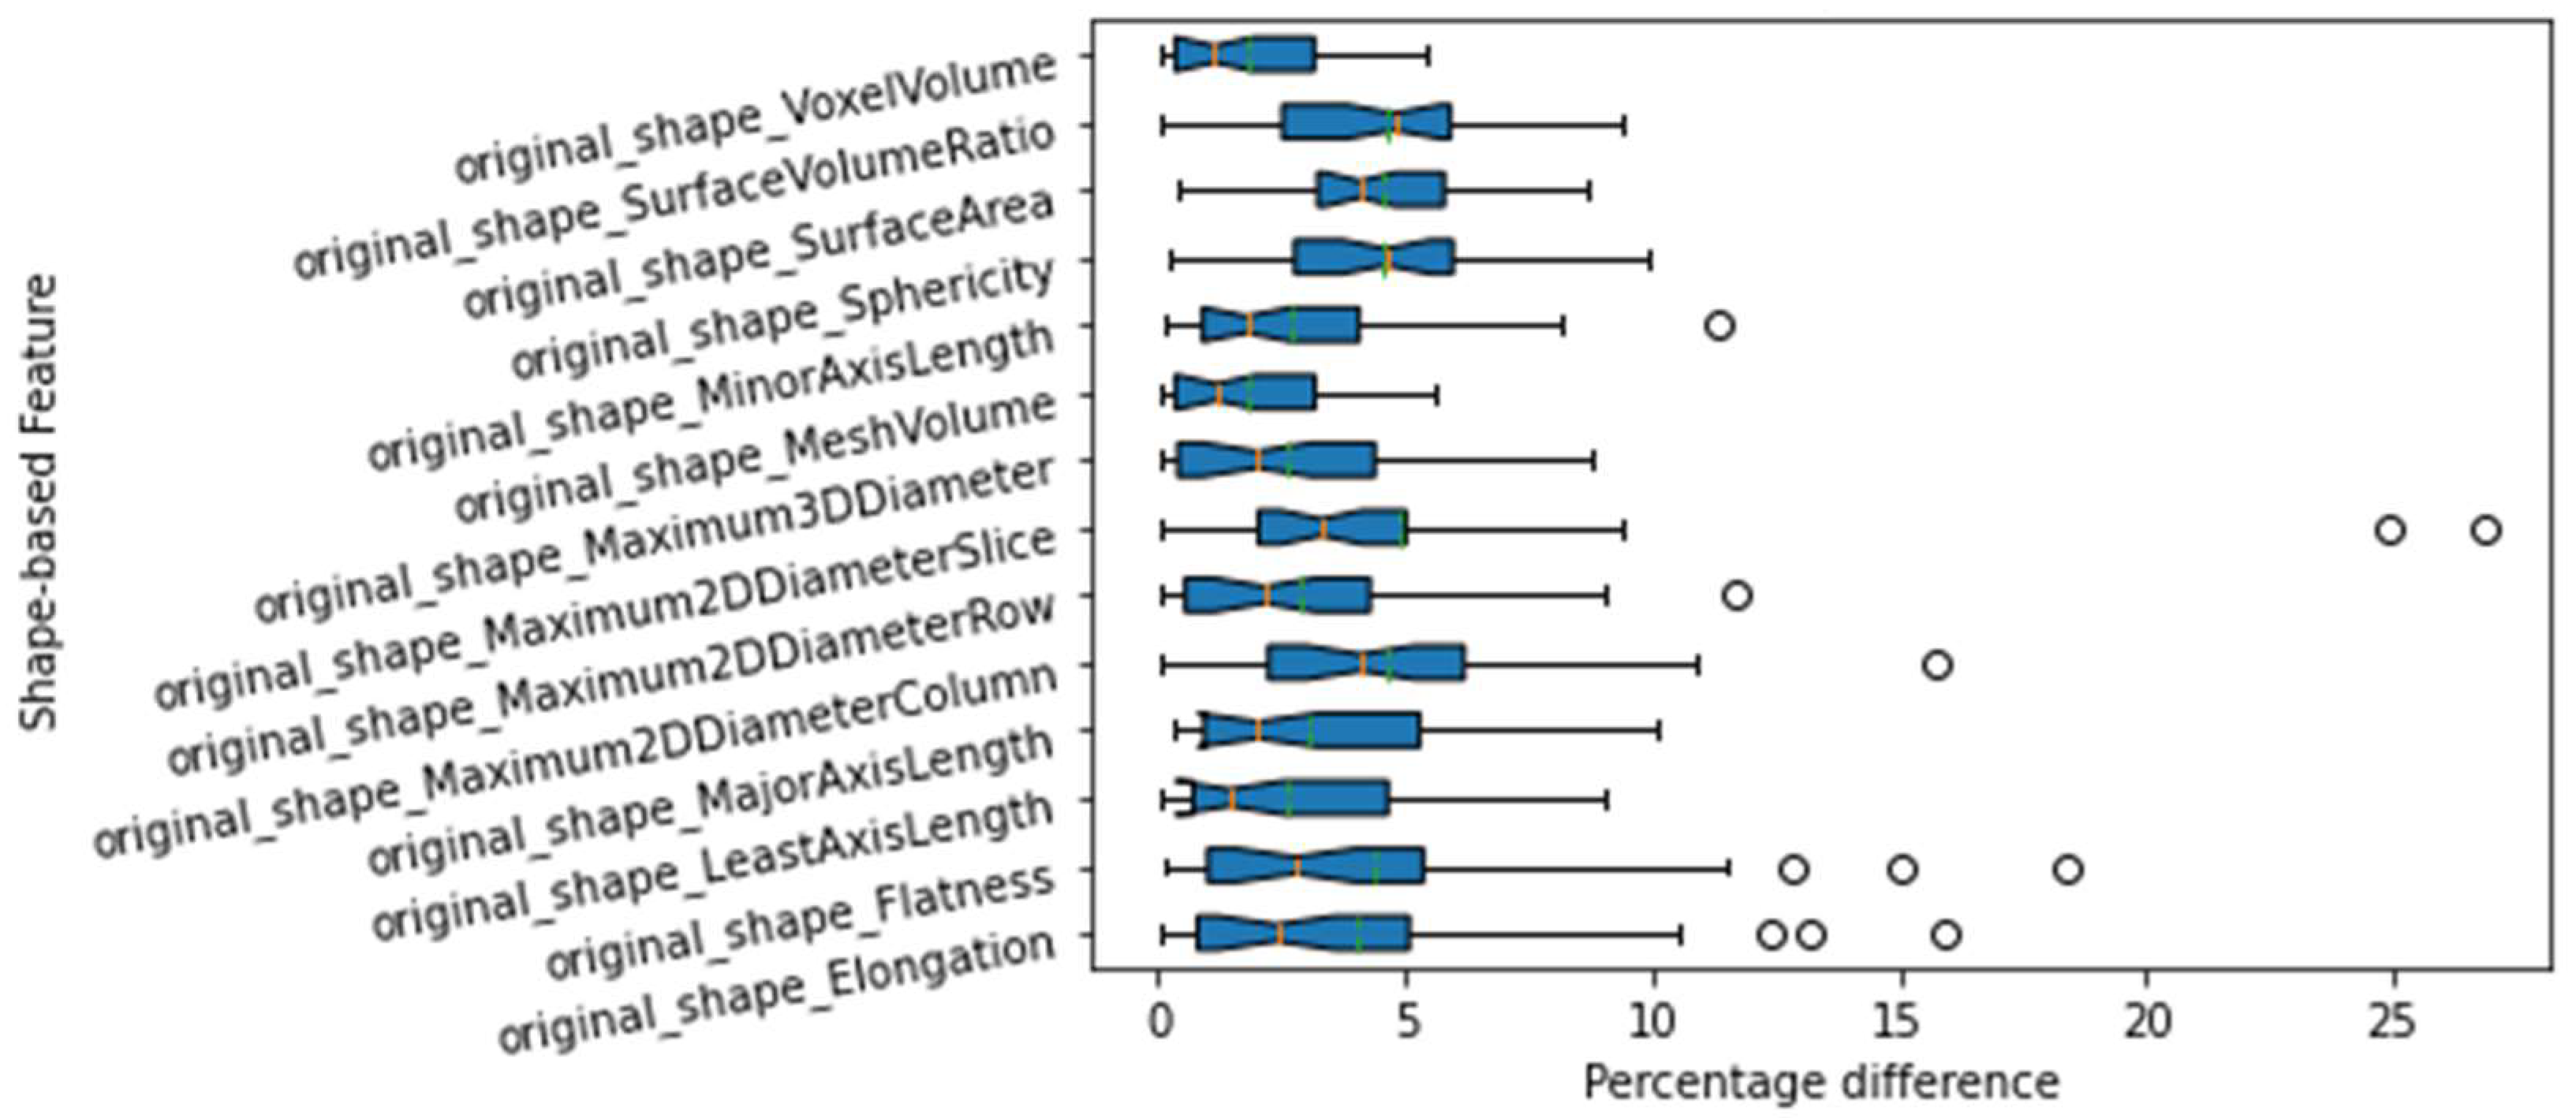
Starting from an exploratory analysis of the difference percentage between the feature values obtained from original PET images and co-registered PET ones, the shape-based feature group showed a mean less than 5% for all features indicating that this group has significantly robust features (see
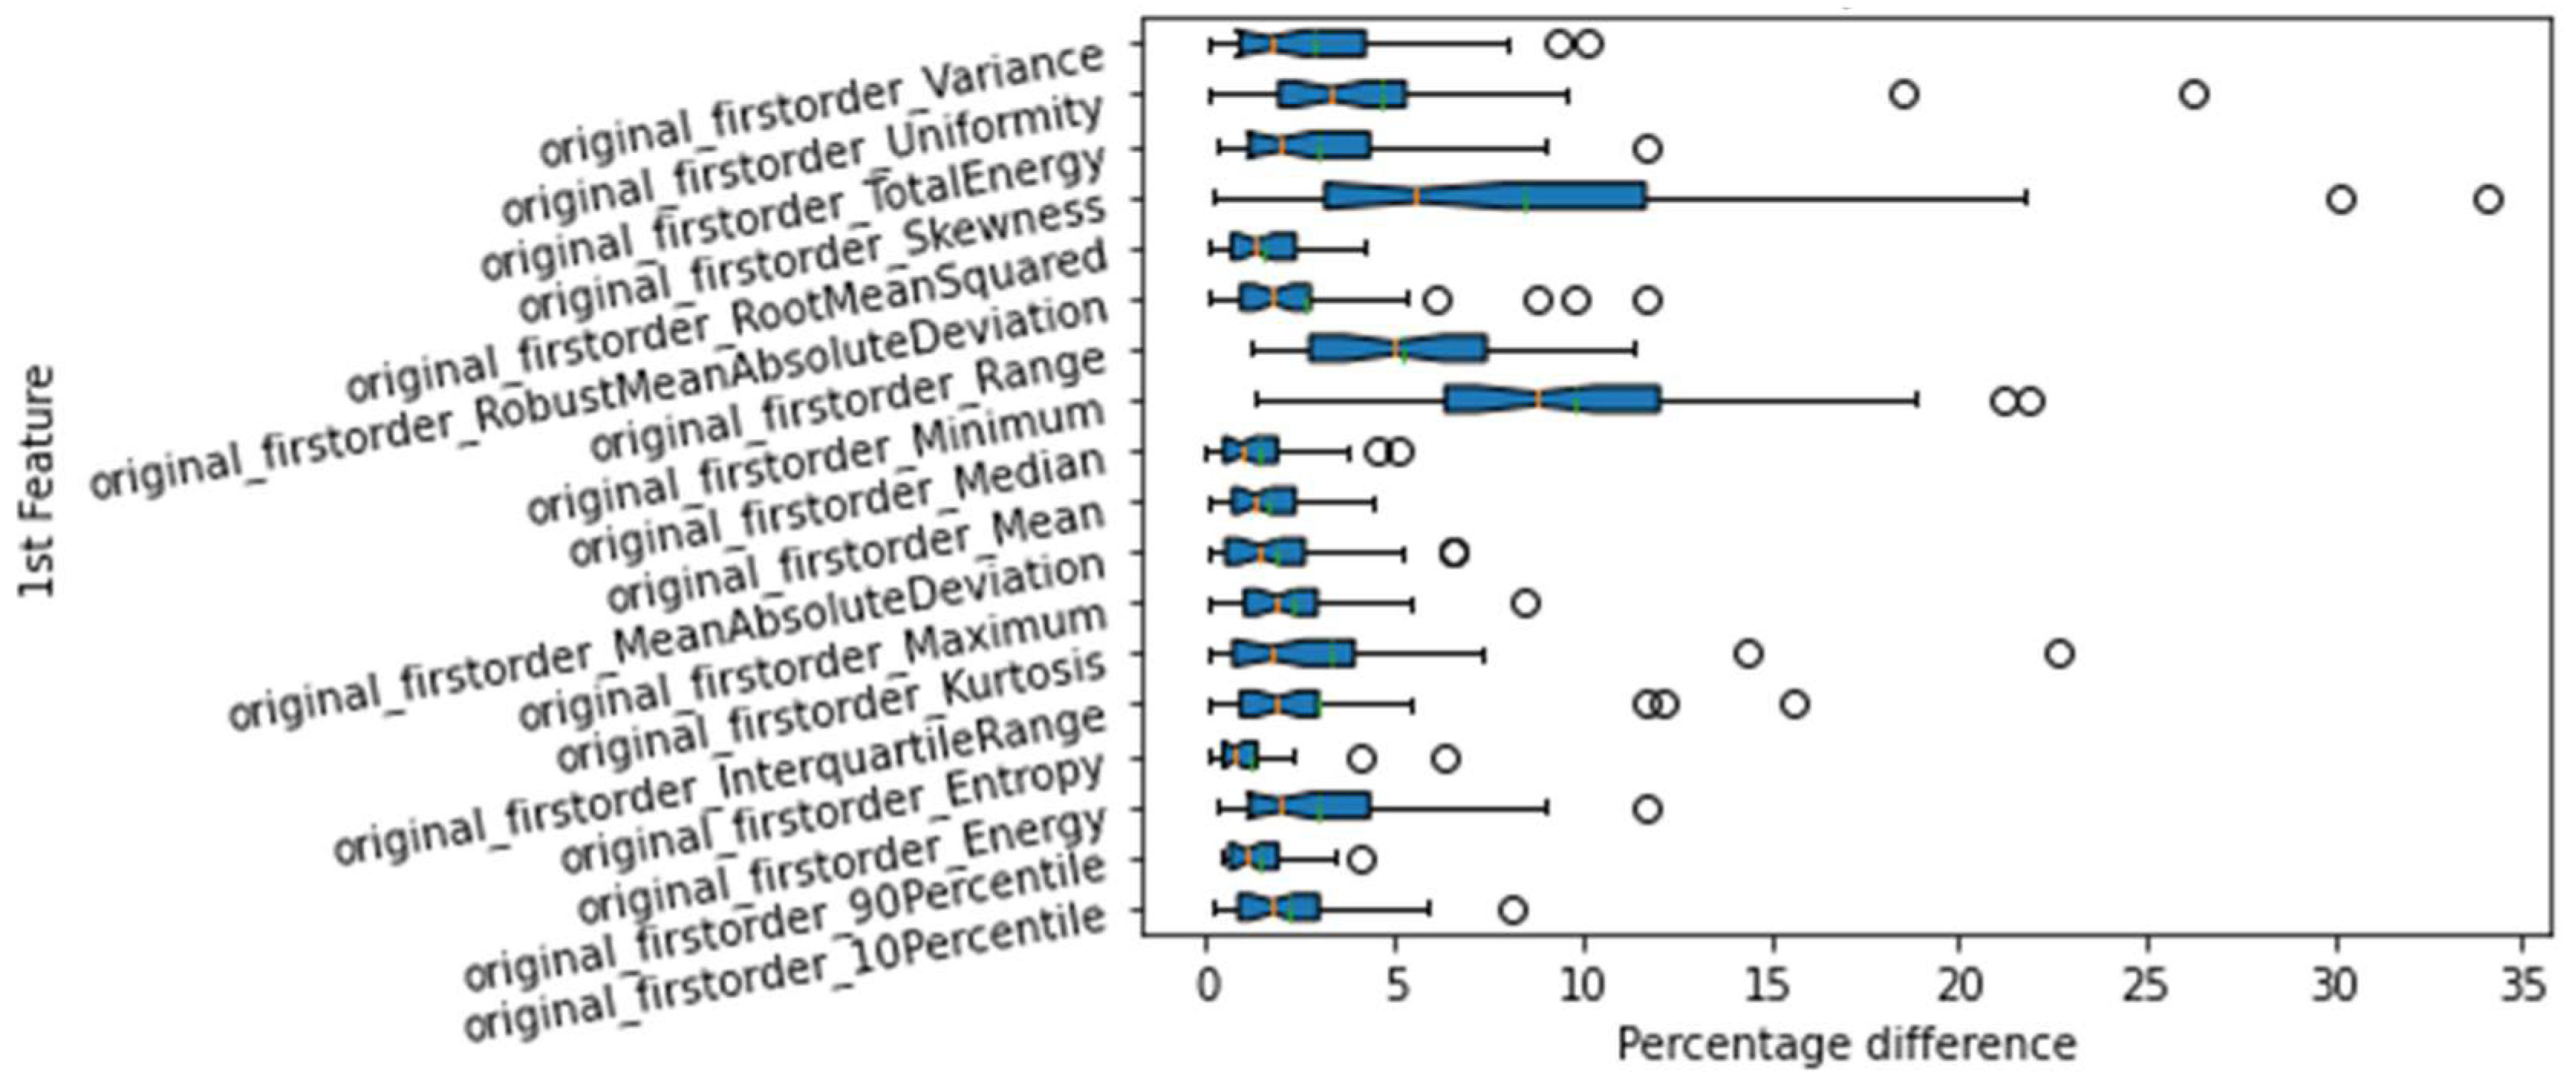
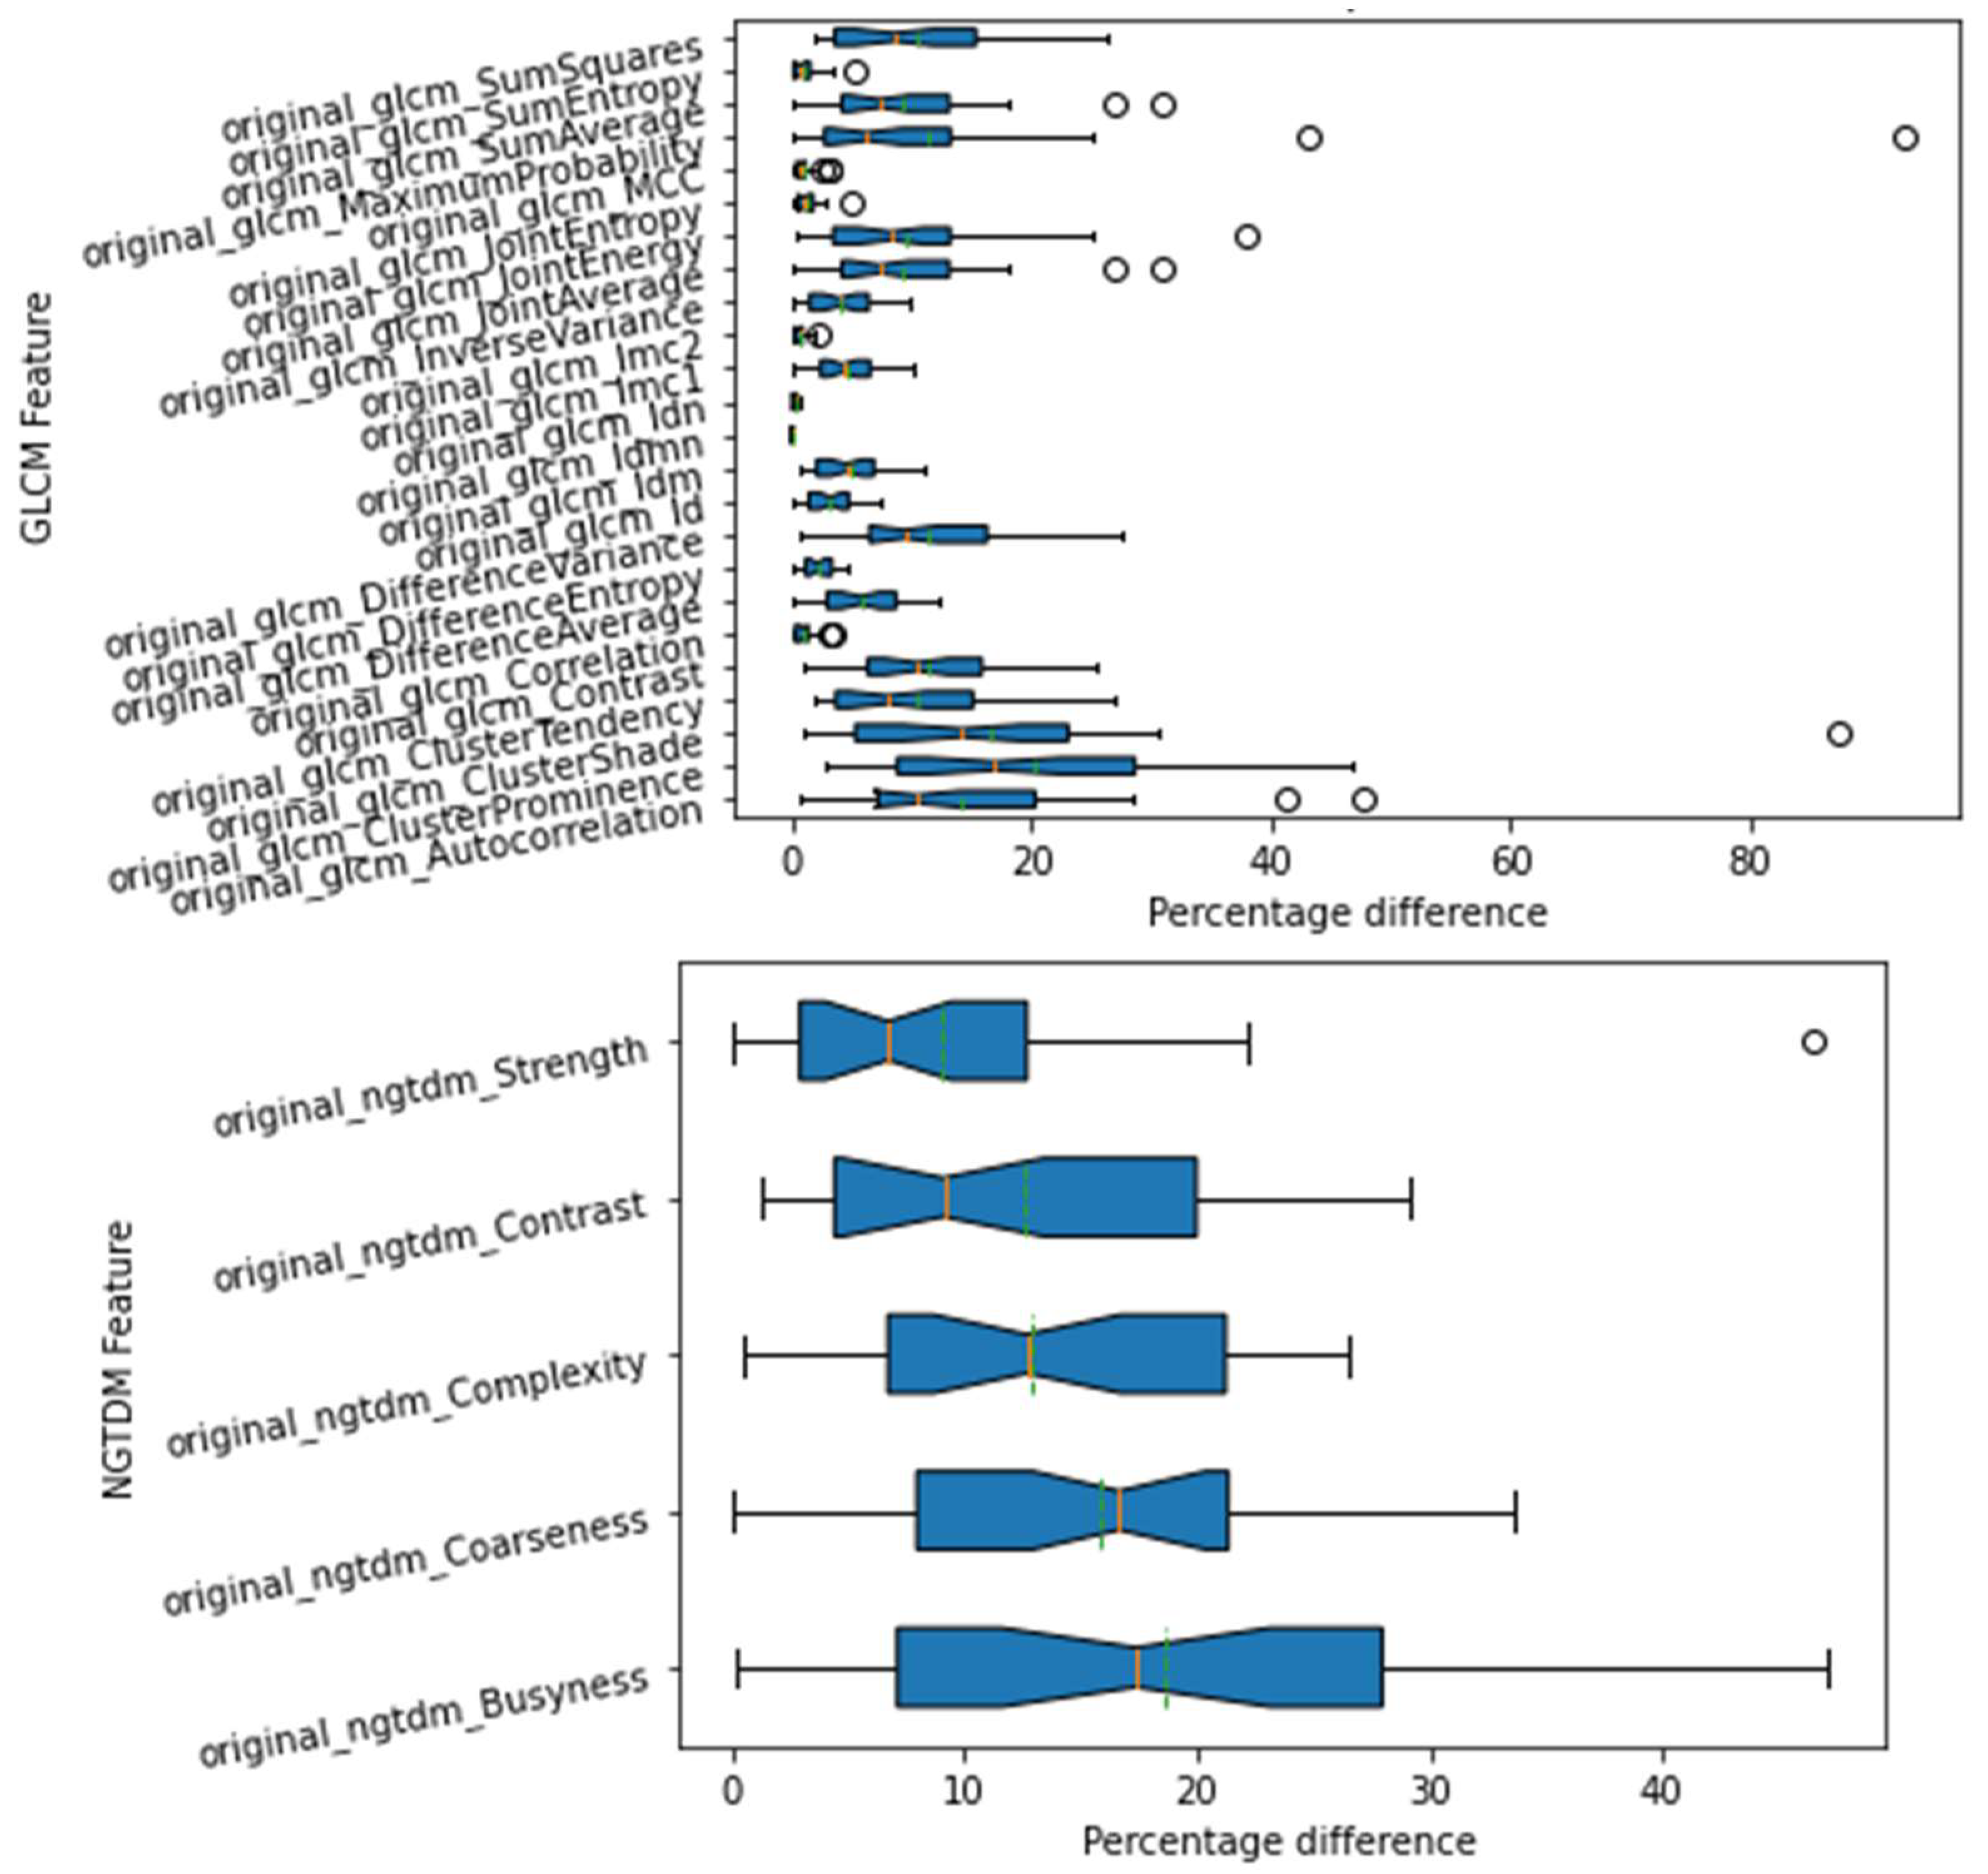
Figure 2). This is because a similar VOI is used before and after co-registration, and as a result, the shape characteristics are not supposed to change significantly from each other after the co-registration process. Even the first-order statistical GLCM and NGTDM features showed a median of less than 20% (<10% for first-order statistical features); thus, they are quite robust (see
Figure 3).
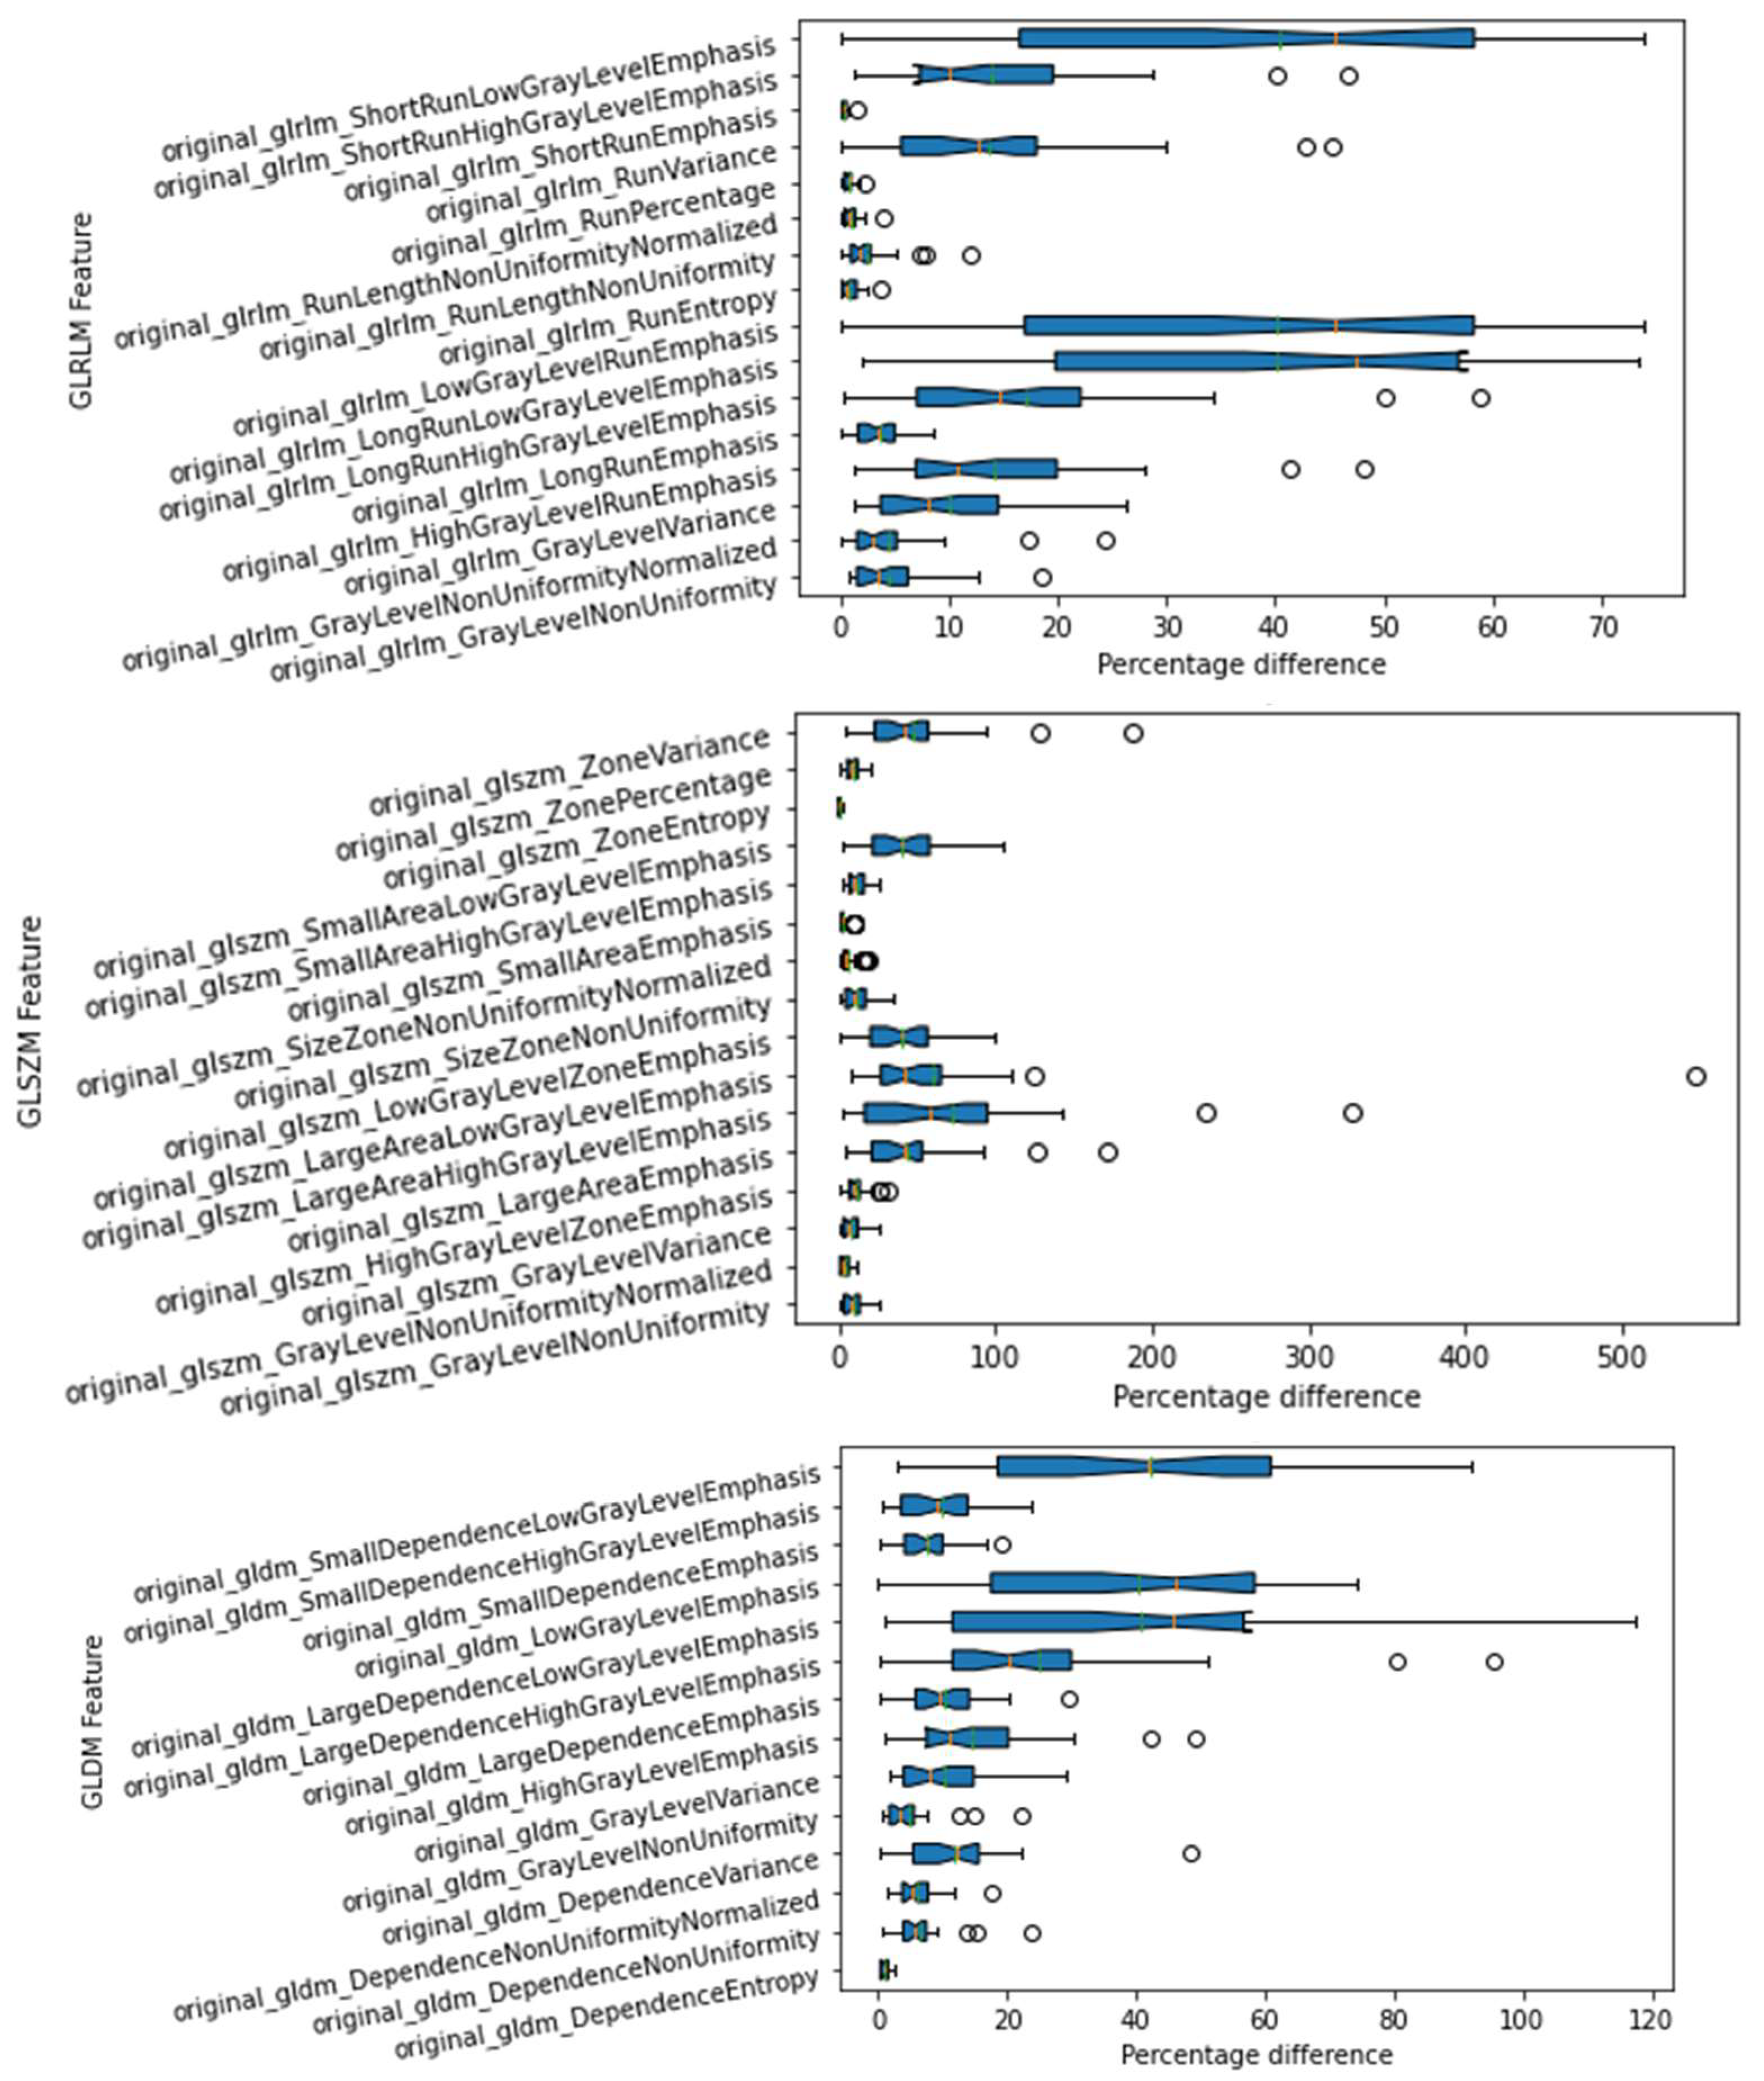
Vice versa, significant differences were found for the remaining texture matrices with mean values above 40% (
Figure 4). In the case of the GLSZM Large Area High Gray Level Emphasis feature, the main exceeded 70%. These results are consistent with previous results published in [
33]. In addition, in GLSZM group, a peculiarly high difference percentage was obtained for one patient (DP = 546% for the Large Area Low Gray Level Emphasis feature). Once again, this result shows a similarity with Meijer’s findings [
33], where the GLSZM class is the one with the highest variation. Specifically, a difference of 106.58% was reported for the Large Area Low Gray Level Emphasis feature. This value refers to the variability analysis of the PET features when image acquisition is repeated five times. Conversely, in our study, the comparison is not between PET phantom studies obtained at different times but between PET and co-registered PET studies. Consequently, we can expect that this difference increases in our study where image co-registration is considered. In other studies dealing with other types of images, i.e., CT imaging [
17] where deformable image registration was applied, the shape-based features were 100% robust, while GLSZM and NGTDM were the most unstable feature groups. Furthermore, features from the categories of intensity and GLCM were considered as stable. This is in good agreement with our results. In a MRI study, Joonsang Lee’s [
34] found that the variation of radiomics features were intermediate or high for Skewness, glcm-Autocorrelation, glcm-ClusterShade, glcm-Imc1, glrlm-LongRunLow (or High) GrayLevelEmphasis, firstorder-90Percentile, glcm- ClusterTendency, glcm-Correlation, and ngtdm-Complexity. This also matches with our study.
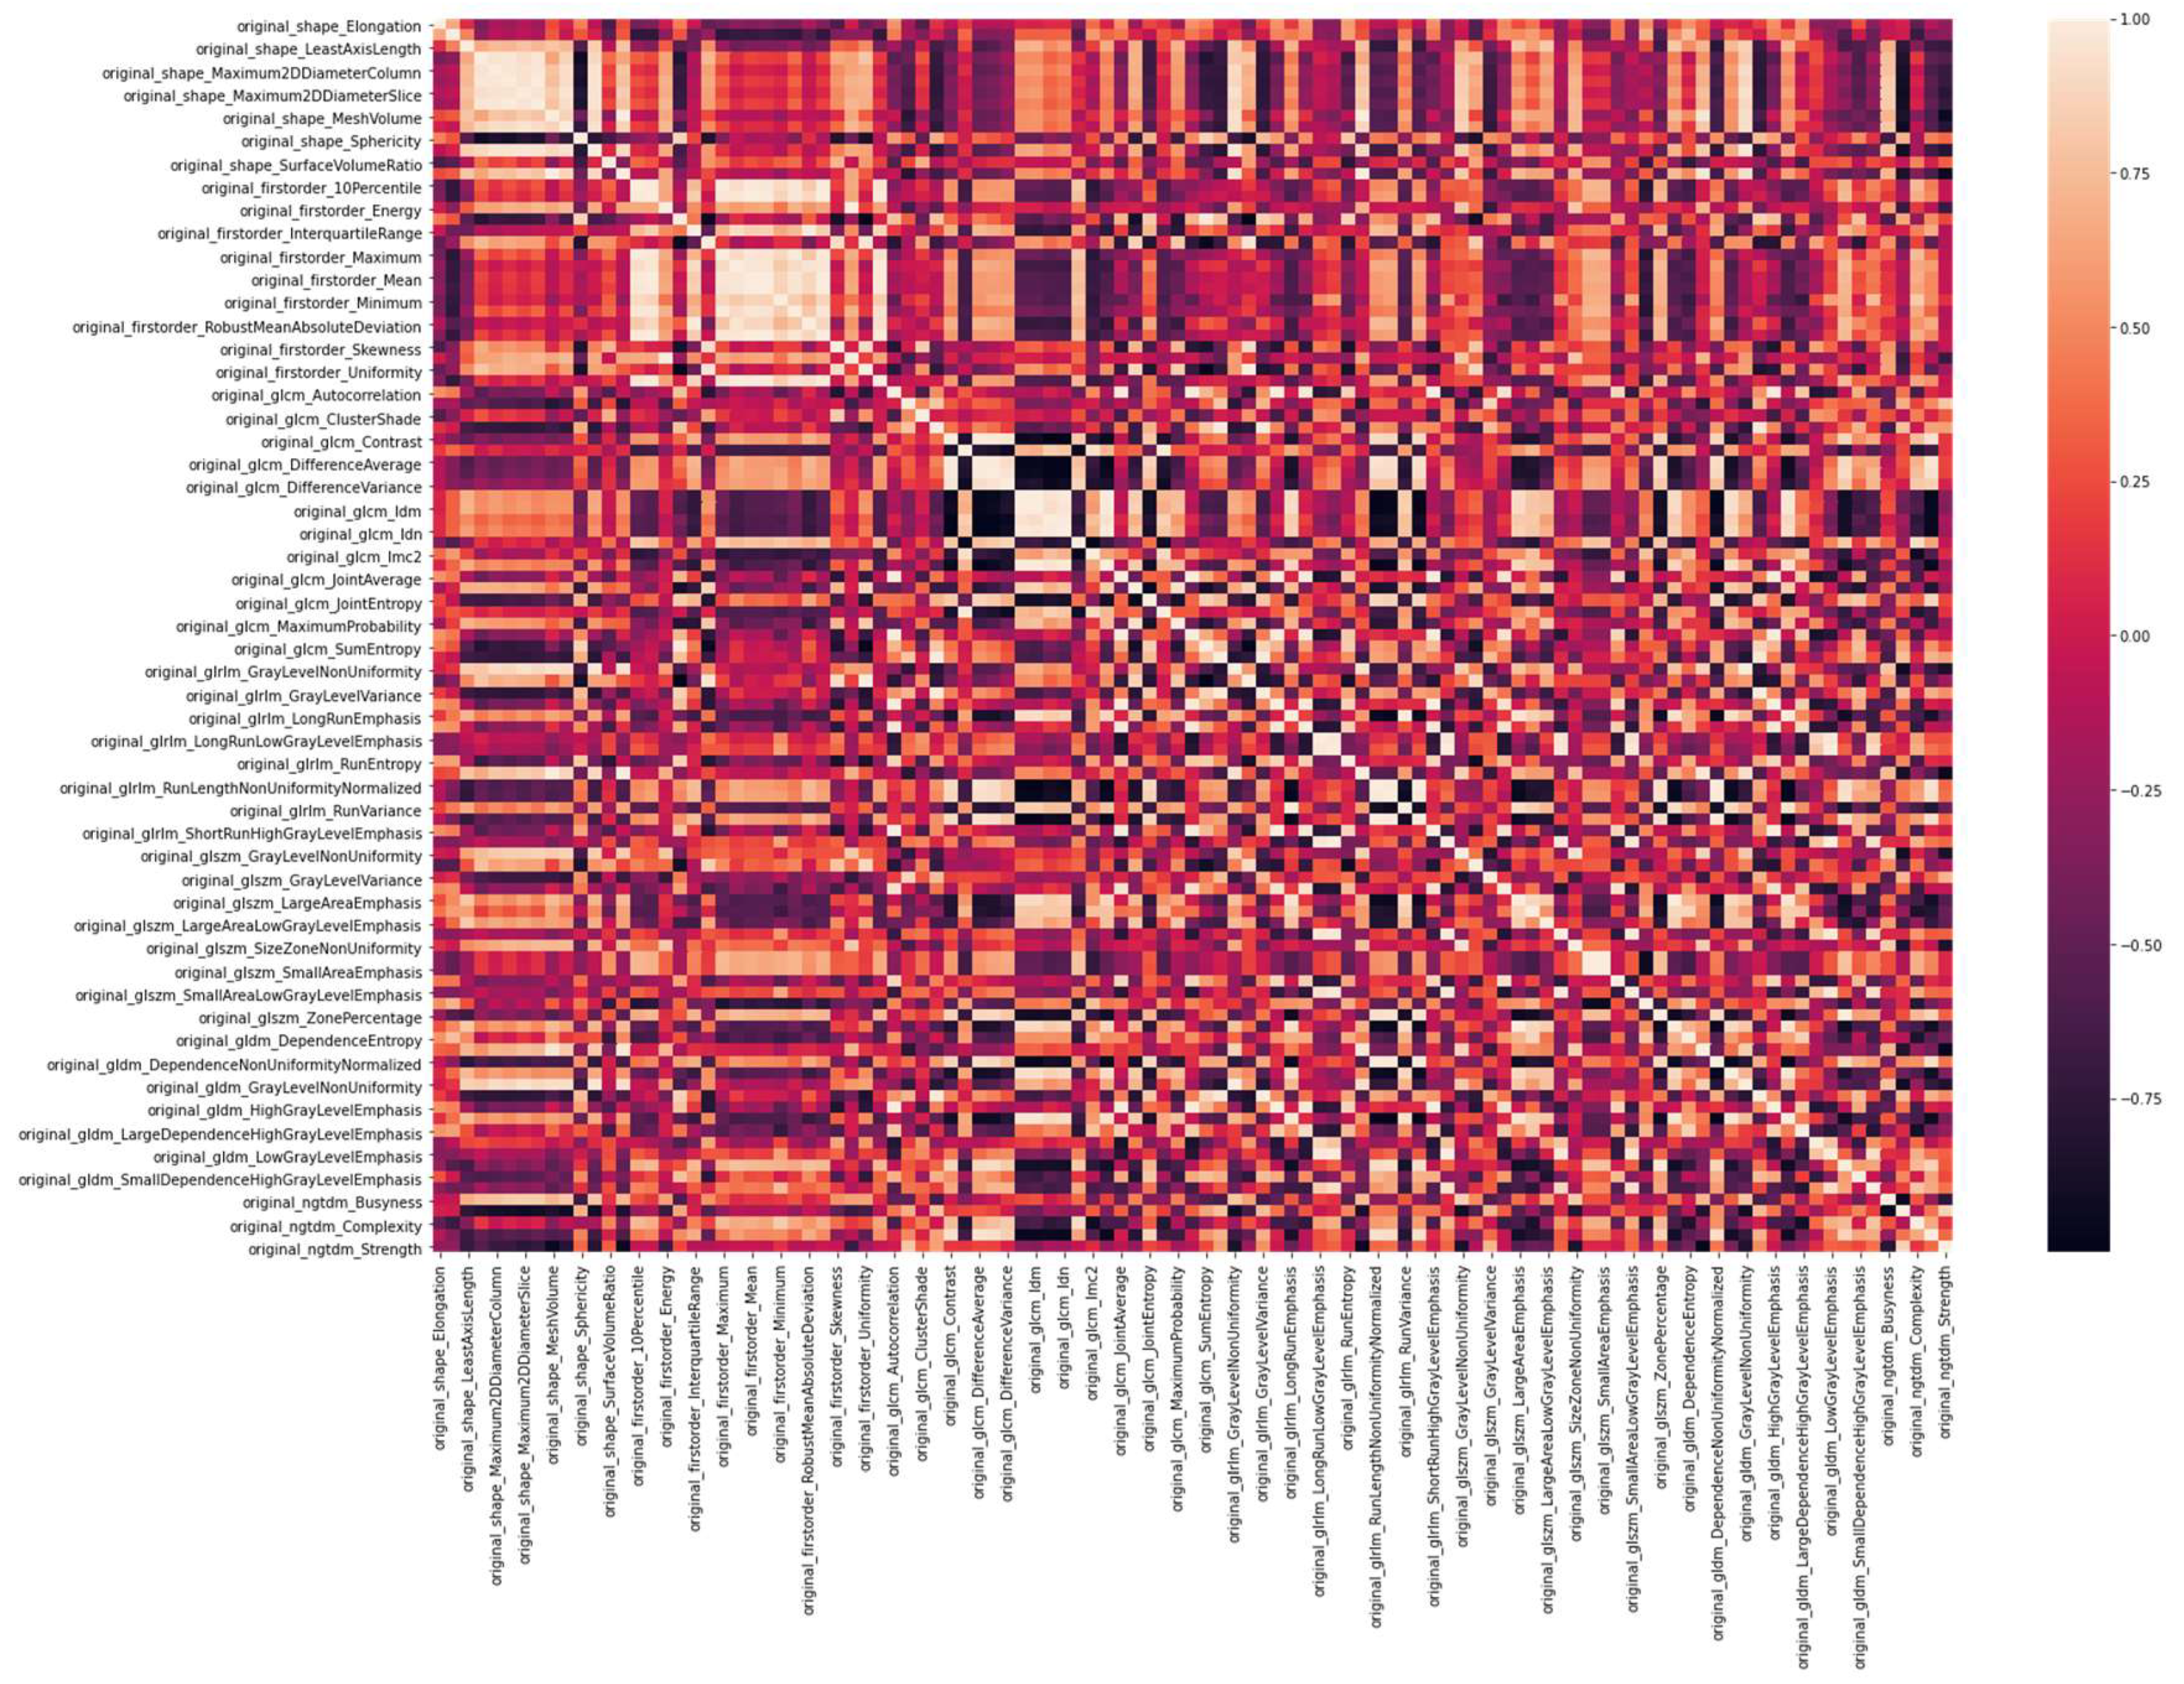
The next step was to verify if the same optimal set of radiomics features was obtained in the three groups of images after the selection process based on the Spearman rank correlation coefficient. This approach was replicated for all patient studies producing a matrix that showed the correlation coefficient for all extracted features (see
Figure 5).
A threshold of 0.8 (see
Table 1) was chosen to reduce the amount of radiomics features that are highly correlated. In this way, only uncorrelated features were considered. Specifically, 21 features were identified both for PET, and PET co-registered with FLAIR while 19 for PET co-registered with T1. Although the number of uncorrelated features is similar (in the case of PET and PET/T1 is identical), the same features were not selected. In particular, nine features were different between PET and PET co-registered with FLAIR, while eight were different between PET and PET co-registered with T1. Approximately 40% of the uncorrelated features were different within the three image datasets. The different features from each other group are detailed in
Table 2 and
Table 3.
These results show that the co-registration process not only modifies the value of the features, as shown in the previous analysis based on the difference percentage value, but that the changes are severe enough that the selection process identifies about 40% of different features in the three image datasets. Arguably, resizing voxels can be the parameter with the greatest impact on feature robustness when co-registration is performed. However, we cannot say for sure which parameter harmed the process the most. In general, it can be argued that feature robustness can be improved if an effort is made to harmonize image acquisition and processing as defined by EARL accreditations [
35]. Further analyses will be needed to provide more detailed information on this issue.


 ,
, 


