Article

Understanding Customers’ Transport Services with Topic Clustering and Sentiment Analysis

by
Alejandro Moreno
and
Carlos A. Iglesias
*
Intelligent Systems Group, ETSI Telecomunicación, Avda. Complutense 30, 28040 Madrid, Spain
*
Author to whom correspondence should be addressed.
Appl. Sci. 2021, 11(21), 10169; https://doi.org/10.3390/app112110169
Submission received: 5 October 2021 / Revised: 21 October 2021 / Accepted: 26 October 2021 / Published: 29 October 2021
(This article belongs to the Section Computing and Artificial Intelligence)

Abstract

:
The recent increase in user interaction with social media has completely changed the way customers communicate their opinions, questions, and concerns to brands. For this reason, many companies have established on the top of their agendas the necessity of analyzing the high amounts of user-generated content data in social networks. These analyses are helping brands to understand their customers’ experiences as well as for maintaining a competitive advantage in the sector. Due to this fact, this study aims to analyze and characterize the public opinions from the messages posted by Twitter users while addressing customer services. For this purpose, this study carried out a content analysis of a customer service platform. We extracted the general users’ viewpoints and sentiments of each of the discussed topics by using a wide range of techniques, such as topic modeling, document clustering, and opinion mining algorithms. For training these systems and drawing conclusions, a dataset containing tweets from the English-speaking customers addressing the @Uber_Support platform during the year 2020 has been used.

1. Introduction

During the last decade, social media has constantly been growing, and it has completely changed the way people communicate and interact with the rest of the world [1]. This impact has directly affected customer engagement. Some of the most important companies have decided to modify their customer service model based on phone calls and paper forms to be adapted to this new way of communicating. This led companies to create official accounts on the most popular social media networks in order to help customers with their concerns, questions, and opinions.
Customers can freely express their satisfaction with a brand, and this could directly affect the brand’s popularity since millions of users can read this public information. Moreover, companies need to analyze their competitors to obtain a competitive advantage [2]. For these reasons, the periodic capture and analysis of this large amount of user-generated content will be critical for understanding the public opinion about brands and the provision of higher quality responses that satisfy their needs.
Previous to this work, there have been several research projects that investigated the analysis of user opinions in ride-hailing services. Some examples have been focused on Facebook [3] and Twitter [4,5] domains. These research projects have proved that the analysis of brands in this sector can be critical for understanding their customer’s opinions to adapt their business models to their customer needs.
Thus, this article aims to analyze customer service from Twitter. This social network is one of the most popular referring to customer services. Its simplicity of publishing short messages has tailored perfectly with customer needs of communication with brands. We decided to analyze Uber Customer Service (@Uber_Support [6]) due to its fast growth in the ride-sharing sector [7] and its robust customer service. Furthermore, we are particularly interested in customer replies to the platform. We consider these tweets as the most valuable ones for companies to understand the real necessities of customers when communicating with brands.
However, the individual analysis of these tweets may not represent the opinions and concerns of the majority of customers. So, in this project, we attempt to seek answers to the following questions:
1.
What are the most discussed topics posted by users in a customer service platform regarding a transport company from Twitter?
2.
How do different topic modeling and clustering technologies compare in terms of performance?
3.
What are the areas from transport and customer services where user satisfaction needs to be improved?
To obtain a conclusion to these questions, we will perform several data mining techniques in the captured tweets. These methods include the use of a wide range of topic modeling procedures to determine the most discussed topics of the dataset, opinion mining techniques to analyze the user’s sentiment and emotions when tweeting to these platforms, and the use of several document clustering algorithms to group these tweets into the different topics as well as their sentiments and emotions.
The remainder of this paper is organized as follows. Section 2 reviews the related work. Section 3 describes the methodology used to achieve the objectives proposed. Section 4 presents the results obtained with the dataset created. Finally, Section 5 discusses the conclusions of this work and its possible future outcomes.

2. Related Work

Social networks have become one of the main communication tools in our society where users can share their daily activities and give their opinions about any theme. These platforms have increased their number of users in recent years, and it is estimated that at the end of 2021, there will be 3.78 billion active users [8].
One of the social networks that has experienced a fast increase in popularity in the last decade has been Twitter. For this reason, this social network has become one of the primary data collection sources for many research works in user opinion analysis. As a result, several studies have emerged to investigate the impact of users’ opinions on Twitter in a large variety of perspectives, including politics [9], opinions and sentiments in sports [10,11], health issues [12], stock market analysis [13], and many others.
In addition to the previous fields mentioned, the analysis of customer opinions towards brands using social networks has also been performed prior to this study. All these articles [14,15,16] have concluded that analyzing large amounts of data generated in social media can provide companies with better approaches for understanding customers’ needs.
Ibrahim and Wang [14] analyzed a corpus of tweets associated with five leading UK online retailers covering the period from Black Friday to Christmas and New Year’s sales. Their principal objective was the evaluation of the most common topics shared by customers when tweeting these brands. Moreover, they were interested in determining which areas of online retailing service users complained the most. To do this, they develop topic modeling, sentiment analysis, and network analysis techniques on their corpus. As a result, they determined that the areas with the most negative sentiment tweeted by customers were the topics related to customer service and delivery. Based on this conclusion, we can affirm that the analysis of customer services is an area of study that needs to be exploited due to its common negative sentiment opinions.
Another study has also been carried out in the Twitter domain but based on the context of transportation services [15]. Their objective was to introduce a new computational method for eliciting influential factors that govern brand equity assessment. To do this, they collected a corpus containing the keywords @uber and #uber from the official Twitter platform @Uber during a three-month period. They analyzed the most discussed topics and developed a machine learning classifier for sentiments analysis. For the task of clustering tweets into the different topics, they designed and implemented a Genetic Algorithm based on their LDA results which improved the K-means clustering approach. Their Genetic Algorithm based on clustering has been adopted in this project with the aim of optimizing the solution described in our customer service dataset.
Finally, another relevant study has been carried out to analyze Uber’s transportation service on the Twitter domain [16]. Their objective was the content analysis of tweets related to this brand. To do this, they collected tweets containing the keyword uber on a 19-day observation period. One of their conclusions revealed that Latent Dirichlet Allocation (LDA) topic modeling could provide the capacity to extract the most discussed topics in a large dataset in a short period of computing time.

3. Materials and Methods

The five steps this work tackles to obtain results are: (i) collect the tweets that refer to a specific transport customer service (Section 3.1); (ii) pre-process and prepare the tweets to reduce the dimensionality of the corpus (Section 3.2); (iii) perform a topic modeling procedure to find the most relevant topics in the dataset (Section 3.3 and Section 3.4); (iv) implement a document clustering system to group the collected tweets into the predefined topics in the most efficient way possible (Section 3.5), and (v) explore the sentiments and emotions of the collected tweets to understand the user’s expressions towards the customer service (Section 3.6).

3.1. Data Collection

The collection of tweets was done through an advanced Twitter scraping tool called Twitter Intelligence Tool (TWINT) [17]. Data was collected from tweets that contained the keyword @Uber_Support to focus on the Official Uber Customer Service. These tweets were filtered through the following criteria:
  • They must be written in English since our goal is to address the English- speaking community.
  • Tweets posted by the customer service @Uber_Support were eliminated since our achievement is to analyze customers’ demands and issues with the brand.
  • Duplicated tweets were eliminated.
  • Concerning spam detection, some of the most popular methods for generating fundamental truth are physical examination and filtering of blacklists [18]. The use of machine learning methods for detecting spammers [19] is out of the scope of this work and left as an interesting research line. In our case, we have used a physical examination of the dataset by selecting the first 20 user accounts that posted the highest volume of tweets in the dataset. Then, if one of those users was a spammer, the whole account was eliminated from the dataset. In our particular case, we filtered 4 of these 20 accounts since we detected them as spammers. This analysis was fundamentally performed to reduce the creation of false topics in the topic modeling approach (Section 3.3).
We decided to capture tweets between 1 January 2020, and 31 December 2020. Following the steps mentioned above, the final capture of tweets resulted in 215,387 tweets.

3.2. Data Pre-Processing

Pre-processing of data is one of the most important steps before analyzing results. Choosing appropriate pre-processing methods will improve text classification significantly [20]. We decided to use some of the most popular Natural Language Processing (NLP) Python libraries for pre-processing texts, such as the Natural Language Toolkit (NLTK) [21], and SpaCy [22] projects.
The following steps were taken in order to pre-process the tweets: (i) tokenization to split tweets into discrete words; (ii) removal of numbers, punctuation marks, emojis, emoticons, URL paths, symbols, non-alphabetical words, English stop words, and tokens with less than one character; (iii) text lemmatization including Part-Of-Speech (POS) Tagging to reduce the dimensionality of the corpus into only nouns, verbs, adverbs, and adjectives; (iv) elimination of tokens with low frequency on the corpus; (v) stemming of words following the Snowball method; (vi) inclusion of n-grams with n from 1 to 2 (unigrams and bigrams); and (vii) the elimination of empty tweets from the corpus and tokens whose length was less than two characters since we consider an English word must have at least three characters to provide any significant information.

3.3. LDA for Topic Modeling

Latent Dirichlet Allocation (LDA) [23] is a generative probabilistic model of a corpus. This algorithm considers that each document is described by a distribution of topics, and each topic can be reduced to a mixture of words based on the frequency to be assigned to that topic. This unsupervised machine learning method allows reducing the dimensionality of corpora to obtain relevant information. Moreover, LDA requires the user to define the number of T topics for distributing the words from the corpus.
We have implemented LDA to obtain the underlying structure of latent topics in our dataset. To do this, Python’s Gensim library [24] was selected due to its excellent and intuitive implementation. Moreover, the Gensim library allows the execution of the algorithm with multi-threads, resulting in an efficient and fast analysis. In this project, the Gensim default α and β hyperparameters from LDA were selected.

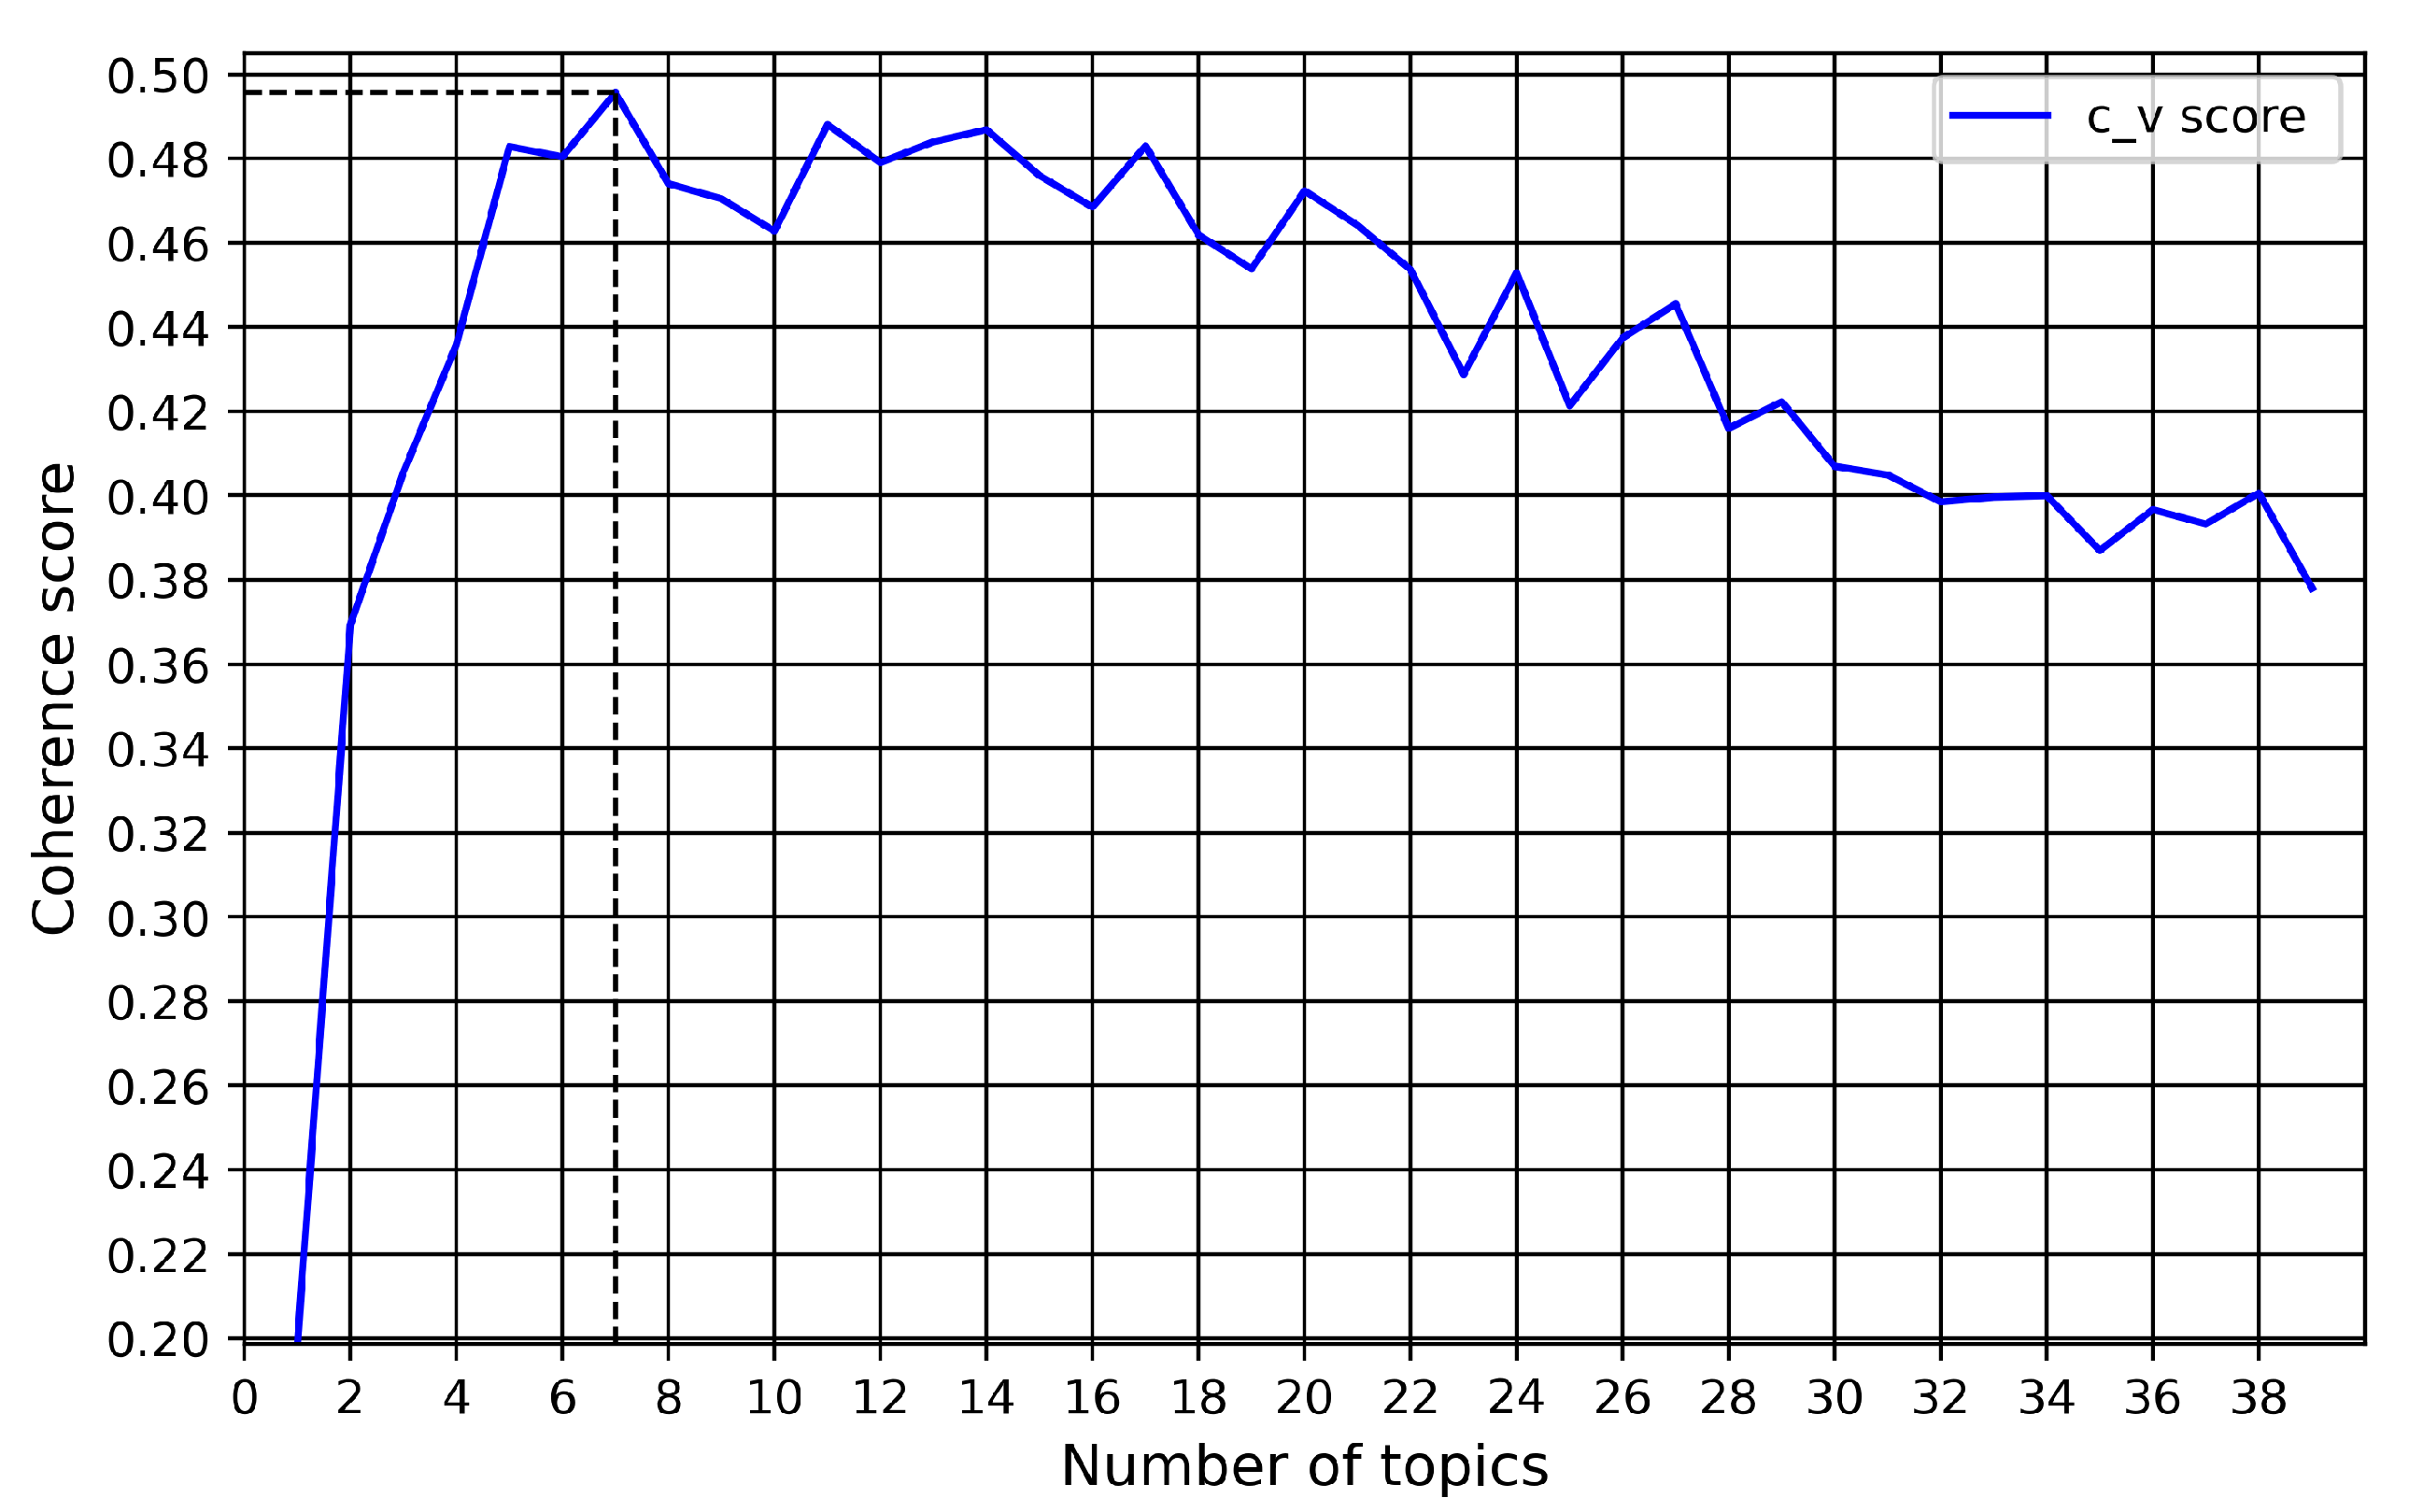
3.4. Determining T Optimal Number of Topics

The main challenge facing topic modeling is to determine the optimal number of latent topics in a group of documents. This issue is still one of the main difficulties faced by researchers during topic modeling. For this reason, there is not a fixed methodology to follow [25,26,27,28]. Our first approach was the implementation of a Markov Chain Monte Carlo (MCMC) using Gibbs Sampling to obtain the optimal T topic model, which maximizes the log-likelihood value (log P(w|T)). This approach was driven following Griffiths and Steyvers’ model [28].
Finally, the optimal number of topics in our model was found by performing different LDA implementations to achieve an optimal value of Topic Coherence. Topic Coherence measures score a single topic by measuring the degree of semantic similarity between high scoring words in the topic [29]. In this work, the c_v Topic Coherence measure was selected, and it provides values from the range [0, 1].
For each of the models defined, several pre-processing techniques (Section 3.2) were performed: (a) corpus lemmatization without stemming nor bigrams; (b) lemmatization and stemming for reducing the granularity in our dataset; and (c) lemmatization, stemming and the introduction of variations in the frequency to form bigrams.
We implemented LDA [24] in each of the proposed models, iterating T from 1 topic to 40 topics to determine which T in each model has the maximum c_v measure. It is important to clarify that c_v is a measure that helps to determine the optimal number of topics, but this measurement requires human interpretability to determine if the T topics selected are appropriate. For more extensive information on Topic Coherence measures, we encourage the reader to see [29,30].
Finally, pyLDAvis [31] Python’s library was implemented in the T highest c_v measure of each model to understand visually how words in each document were fitted among the different topics declared. This tool was very useful for giving a name to each of the topics extracted and checking the above-mentioned human interpretability.

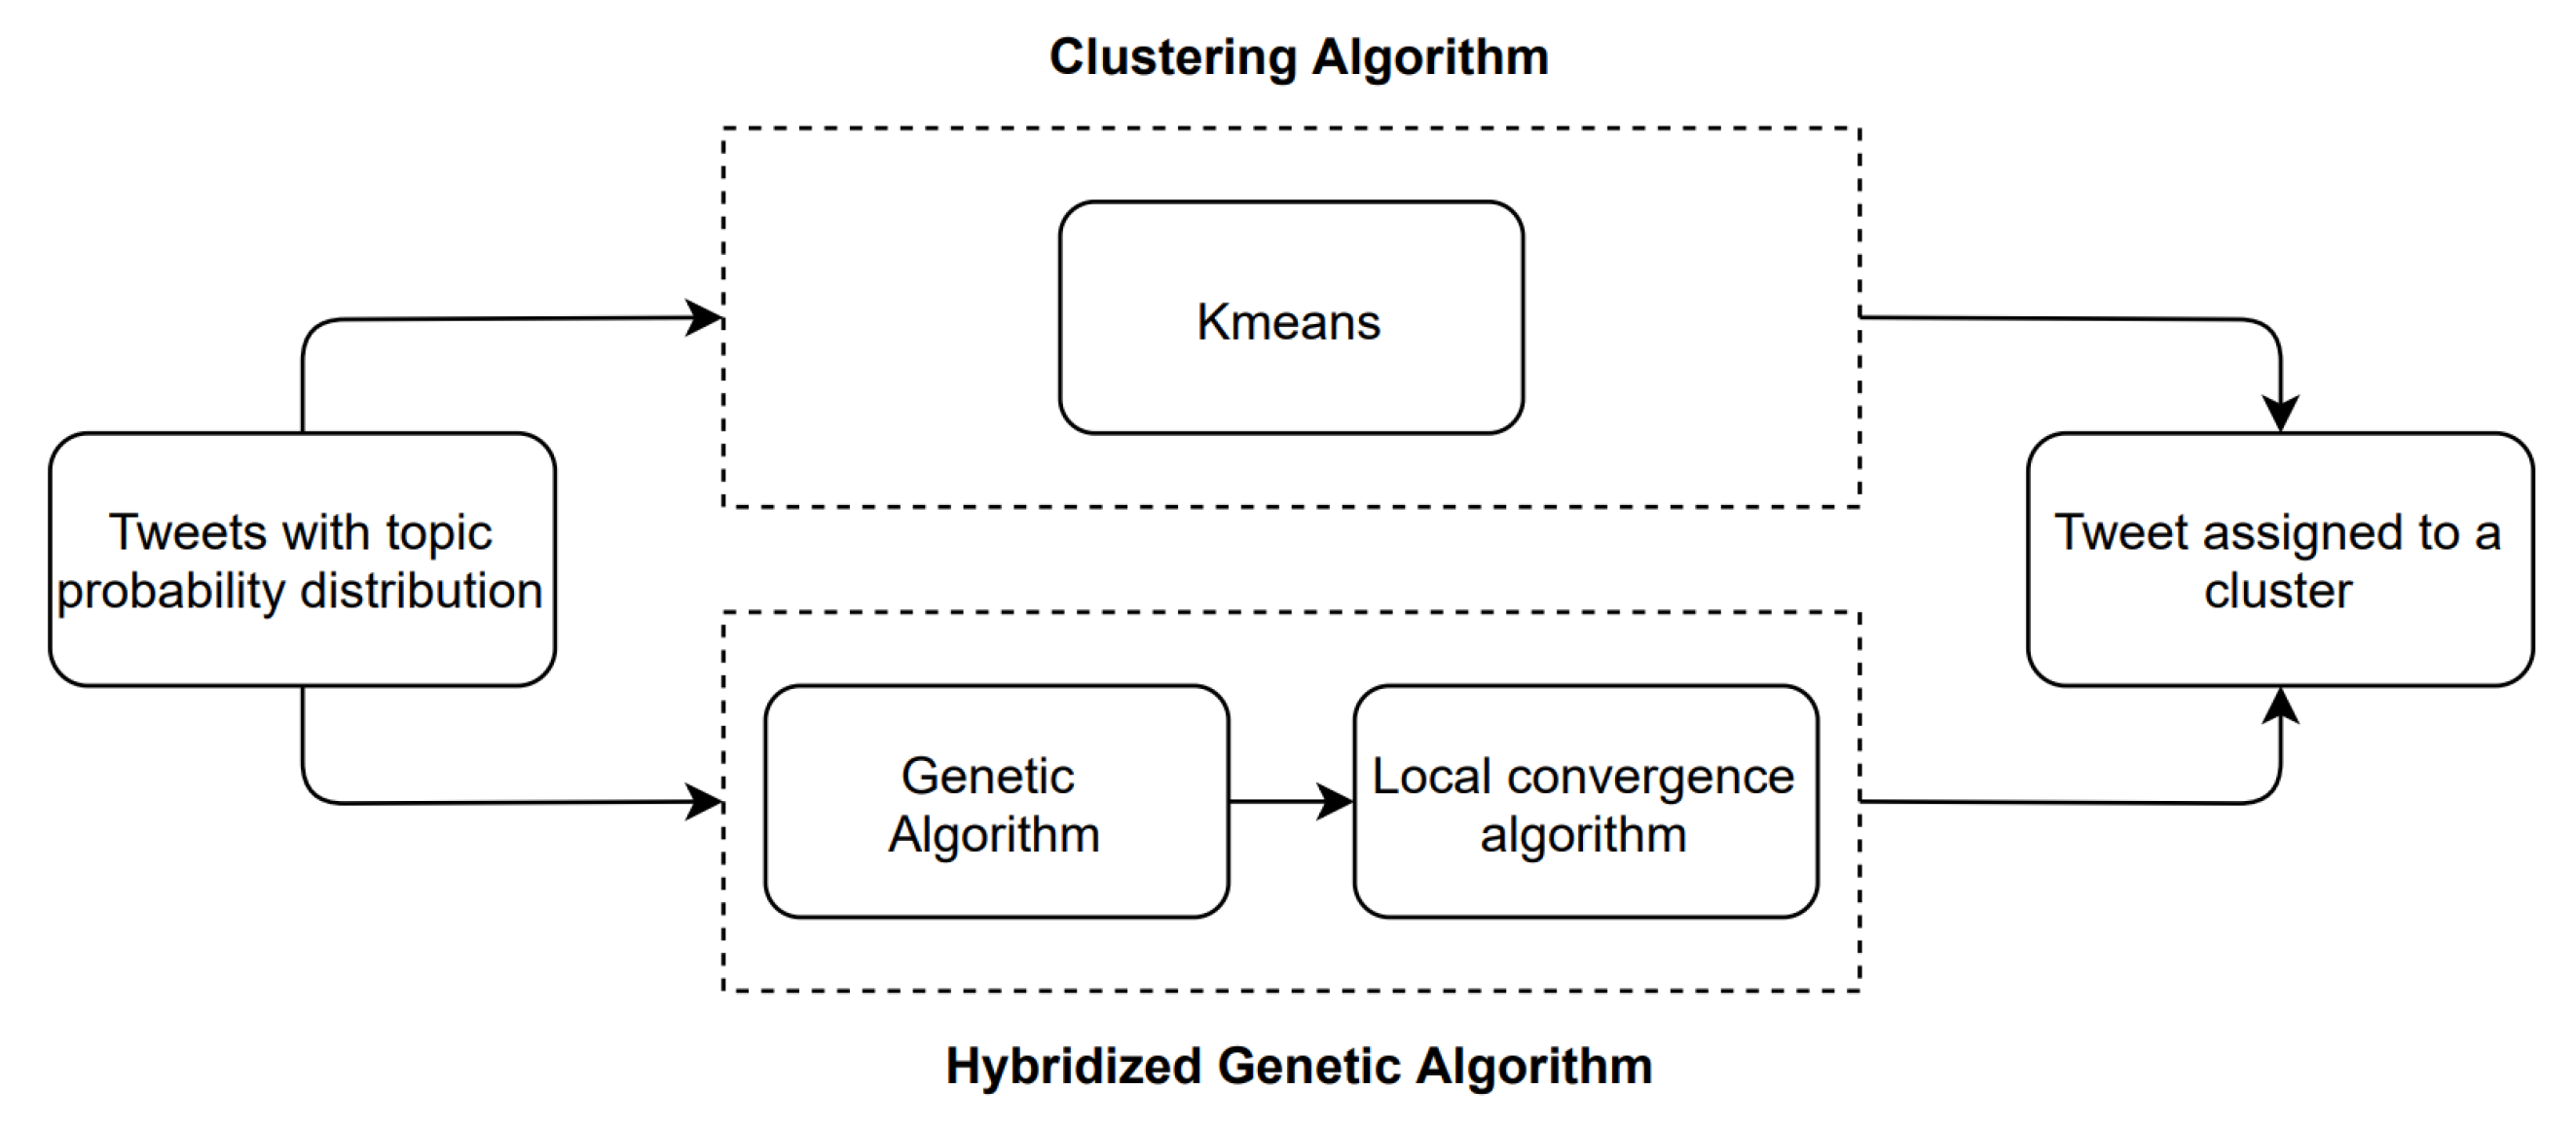
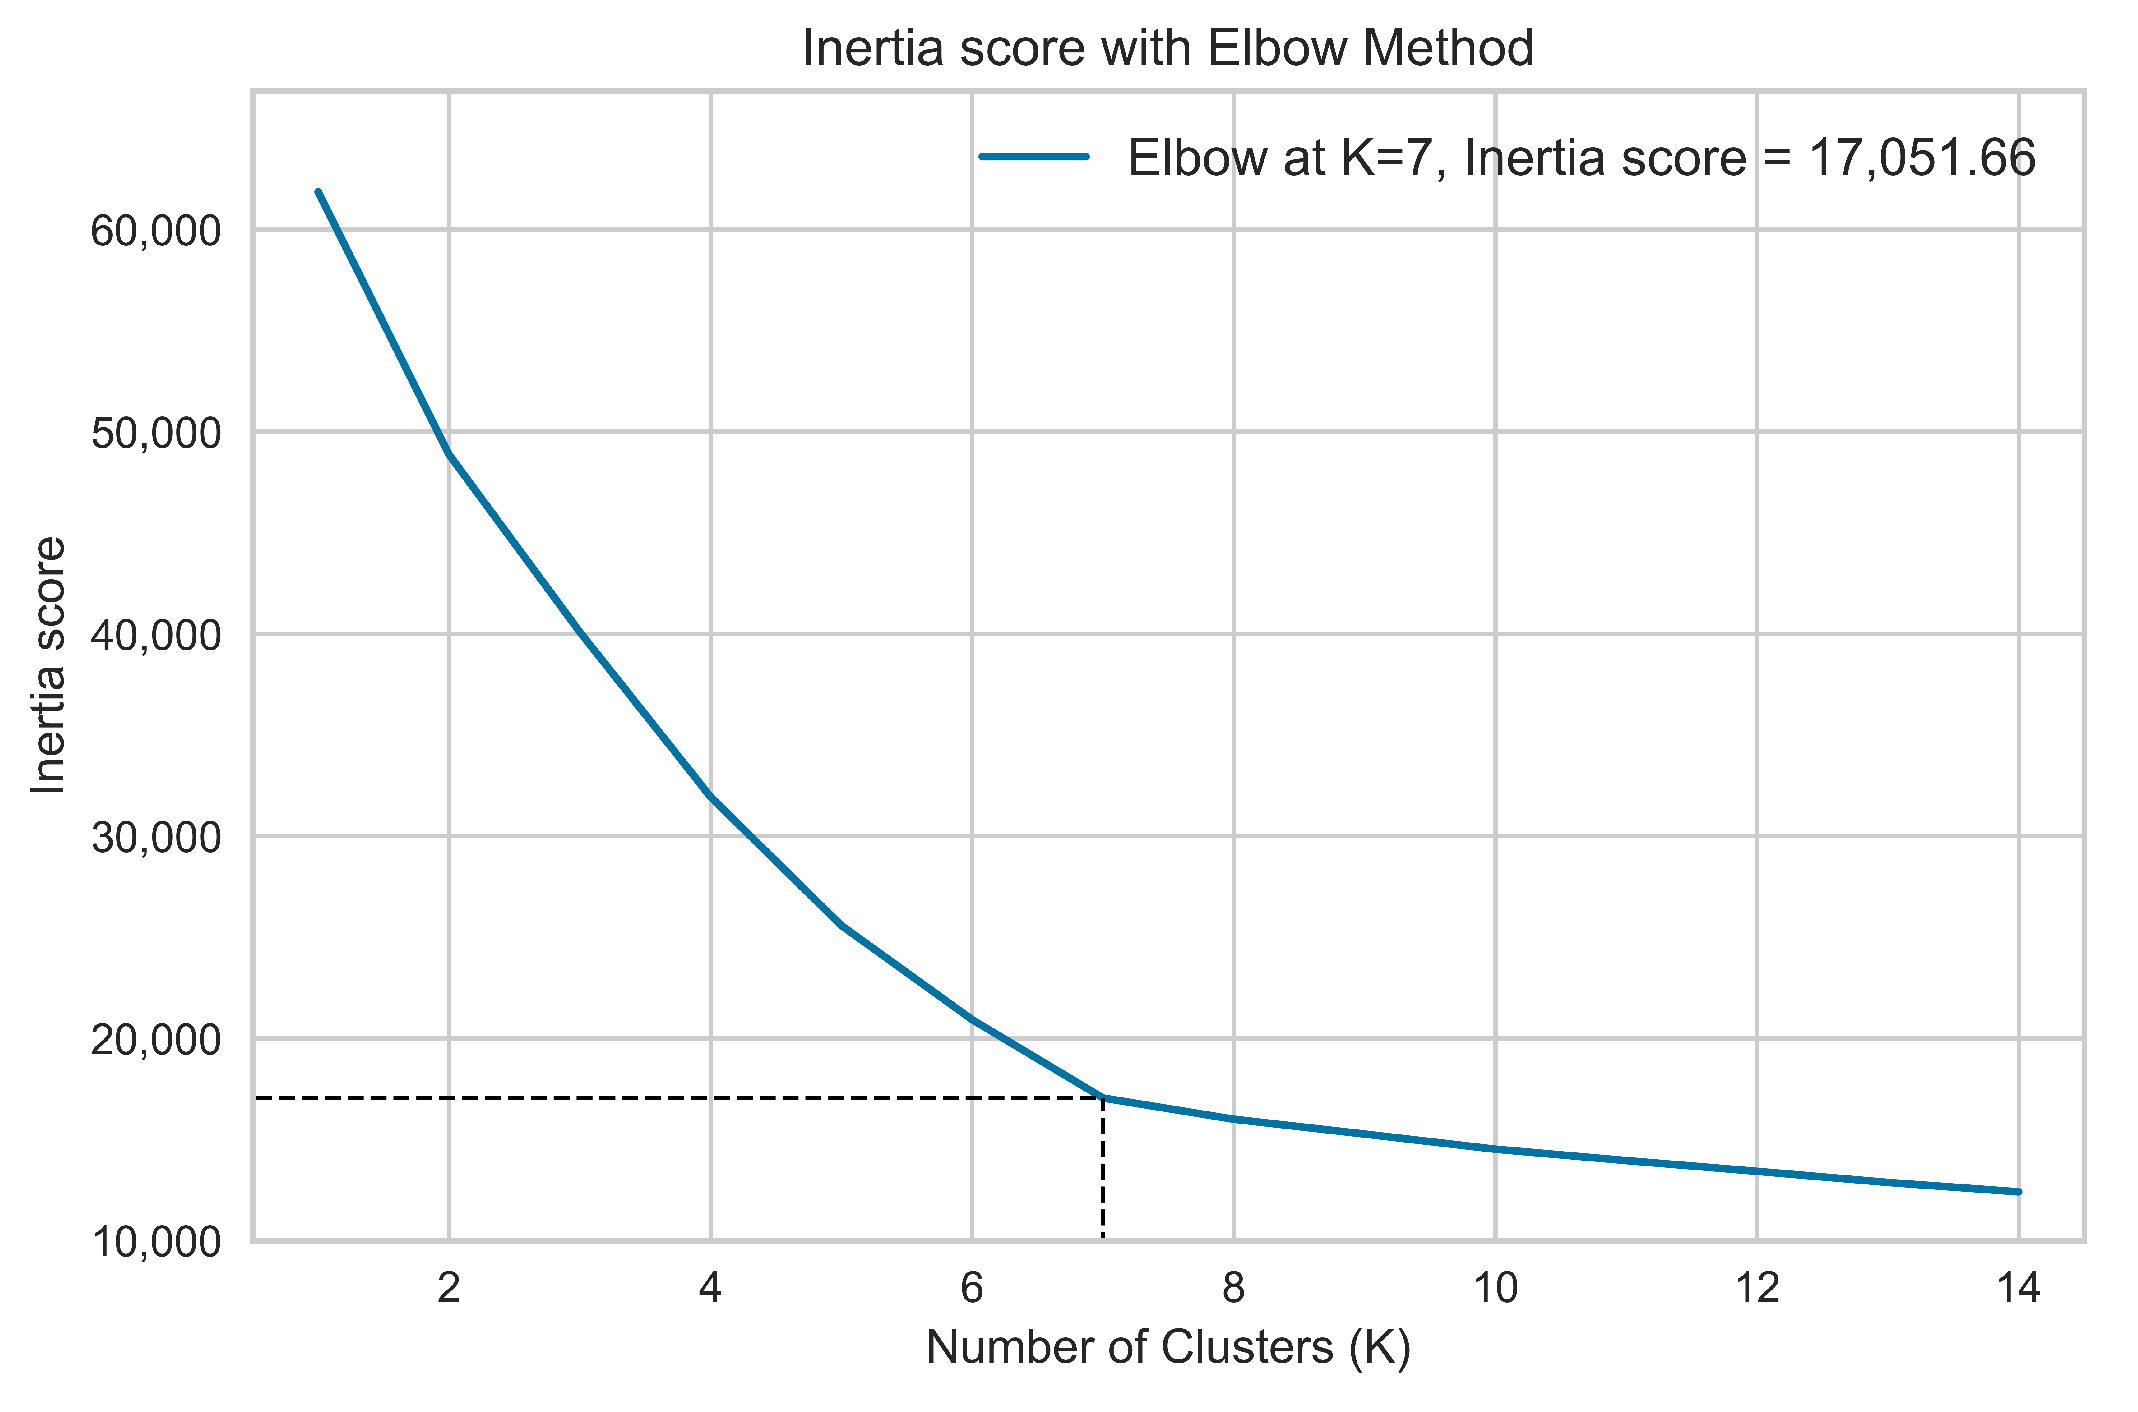
3.5. Document Clustering

After performing topic modeling and determining the optimal T number of topics in the dataset, LDA can represent each document as a vector containing the different probabilities to be assigned to each of the predefined topics.
However, these vectors do not provide the document’s topic but only a distribution of probabilities to the different topics. For this reason, the next phase in our project was to group each tweet into one of the predefined topics from Section 3.4. To do this, we considered the use of several clustering techniques in our corpus as shown in Figure 1.
This work tackles two different clustering methodologies to determine which documents should be grouped to the different T topics. These methods involve the use of the K-Means clustering algorithm [32] and a Genetic Algorithm [15,33] combined with a local convergence algorithm.

3.5.1. Clustering Algorithm: K-Means Description

K-Means is an unsupervised hard and partitional clustering algorithm. It was first developed by Mac Queen in 1967 [32] and is one of the most widely used algorithms for grouping data.
The basic idea of this algorithm is closely related to the optimization of the inertia criterion. At first instance, the K centroids are defined by randomly selecting K different instances [34]. Then, the remaining data points from the model will be assigned to the clusters whose inertia score is the minimum. After this cluster-data point association, centroids ( μ i ) will move to the mean of its distribution of data points S as explained in Equation (1).
μ i ( t + 1 ) = 1 | S i ( t ) | x j S i ( t ) x j
This process is repeated until the position of the cluster-centroids does not variate in each iteration, where we can affirm that the algorithm has converged to an optimal solution.
The partitional nature of K-means will result in the creation of K groups where each instance will only belong to a single cluster.
Scikit-learn [35] Python’s library was selected to implement the algorithm due to its simplicity, good results, and efficient performance in computing time.

3.5.2. Genetic Algorithm

Once established a basis for clustering the documents from the dataset by using the K-Means approach, we decided to use Genetic Algorithms aiming to optimize the results provided in Section 3.5.1. Genetic Algorithm (GAs) [33] are adaptative heuristic search and optimization techniques that provide solutions based on the ideas of natural selection and genetics.
To perform this task, we have implemented in the project a Genetic Algorithm based on clustering LDA probability vectors following the [15] model. Once we obtained the optimal number of K clusters to divide the space using the K-Means algorithm (Section 3.5.1), we created an initial population of 100 individuals where each individual was composed of K clusters-centroids. These individuals followed the methodology described in [15] where all its operators (generation of an initial population, crossover, and mutation techniques) guaranteed that their solutions were placed within the T-dimensional simplex in each iteration. Besides, we included in the algorithm a selection operator followed by the tournament procedure to slightly accelerate the convergence of the genetic process. We ran this algorithm until its convergence process described an asymptotic result. In the case of our project, 200 generations were established as a stop criterion. As in K-Means, the implementation of this algorithm guaranteed that each tweet belonged to a unique cluster. The Distributed Evolutionary Algorithms in Python (DEAP) [36] package was selected for the implementation of this algorithm.

3.5.3. Local Convergence Algorithm

Genetic Algorithms aim to search for the global convergence of the problems, but in some cases, their solutions may be near this optimal value. For this reason, the best individual from the Genetic Algorithm described previously was introduced into a local convergence algorithm aiming to obtain a fitter individual for its analysis.
The proposed optimization technique follows the idea described in [15] which establishes the criterion that all cluster centroids must be placed within the T-dimensional simplex in order to obtain feasible results for Topic Clustering.
The local convergence algorithm used in this work was followed through the Sequential Least-Squares Programming (SLSQP) package from the Scipy library [37]. In order to feed this machine learning model, four main inputs were introduced into the algorithm: (i) the genetic fitness function from [15] for calculating its step derivatives; (ii) the step size used for the numerical approximation of the Jacobian h = 1 × 10 4 ; (iii) the stop criterion ftol = 1 × 10 5 ; and (iv) the K linear constraints that satisfied that all the K clusters from the individual were placed in the T-dimensional simplex.
It is important to highlight that the restriction imposed by the dimensional simplex refers to the idea that each cluster centroid must satisfy the constraint that all their coordinates have to sum a probability value equal to the unit. The use of a local convergence algorithm to optimize a topic clustering problem is, to the best of our knowledge, a novel work.

3.6. Sentiment and Emotion Analysis

Sentiment and emotion analysis has become a fundamental step in every Opinion Mining project. In our case, we considered of relevance the extraction of this information from the collected tweets since these messages are public opinions that can directly affect Uber brand popularity. We have selected two available free sentiment and emotion services that allow us to process high volumes of tweets:
  • For the task of sentiment extraction, we have used the Senpy [38] framework that provides a simple interface to a wide number of Sentiment analysis services. In particular, we have used the plugin Sentiment 140 since it can be executed locally on our server.
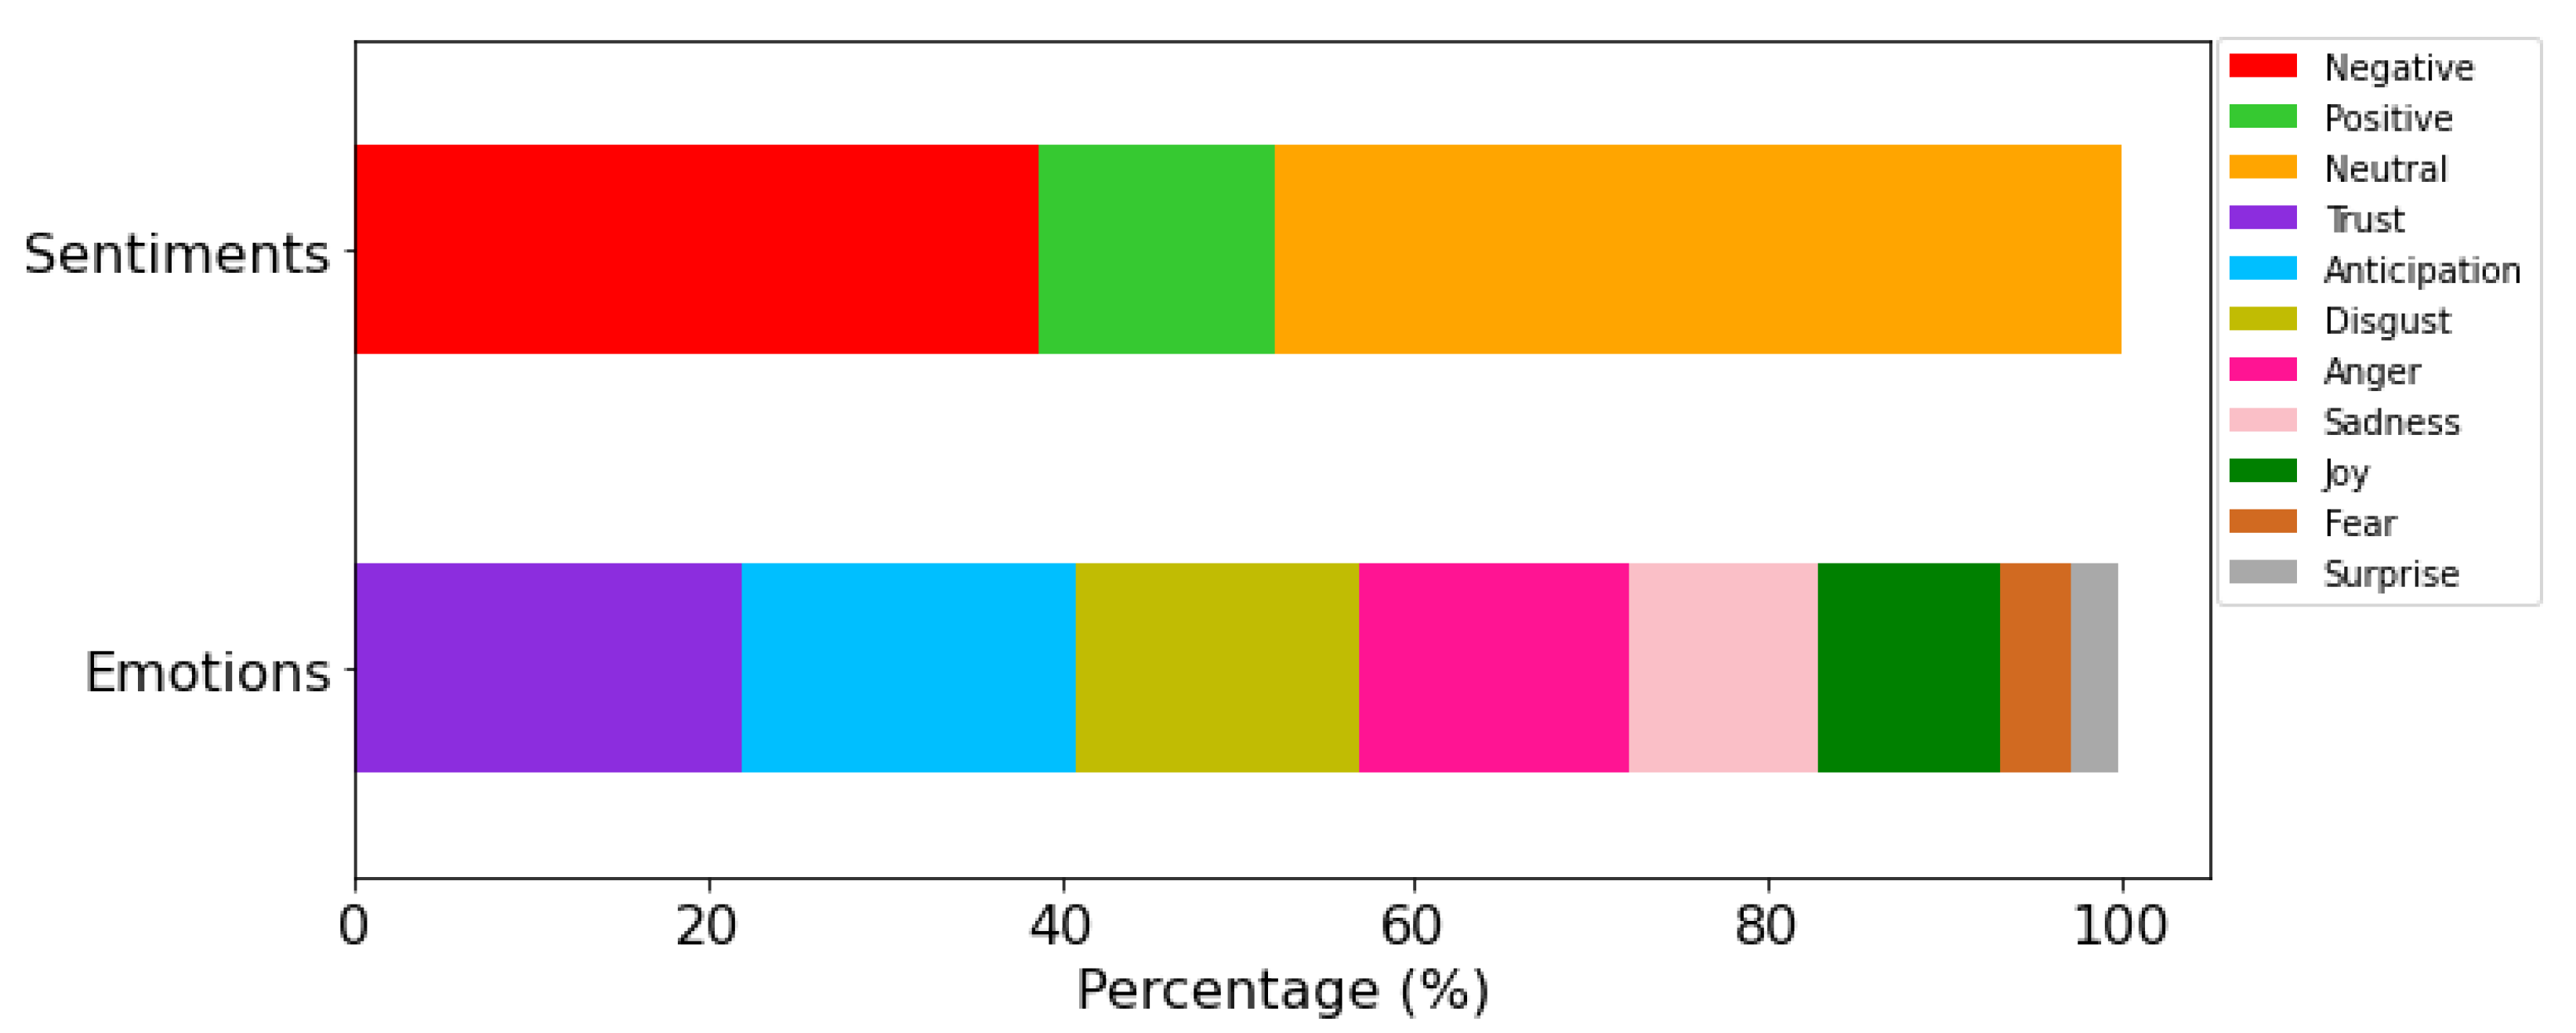
  • With respect to the methodology used for the emotion extraction, the framework Rapidminer [39] combined with the MeaningCloud [40] commercial platform was implemented through the Deep Categorization API. Specifically, the Emotion Recognition categorization model was used. Besides, this analysis resulted in the individual evaluation of each tweet which was classified as a mixture of trust, joy, sadness, anger, disgust, anticipation, fear, and surprise emotions.
The analysis of the collected data described in this section helped us to draw conclusions from two different perspectives. Firstly the initial capture of the tweets (Section 3.1) combined with the application of this analysis allowed us to obtain a general viewpoint of the public opinion towards the Uber brand. Finally, the combination of these statistics with the topic modeling approach (Section 3.3) and the document clustering procedure (Section 3.5) described in detail the sentiments and emotions associated with each of the topics described in the dataset.

4. Results

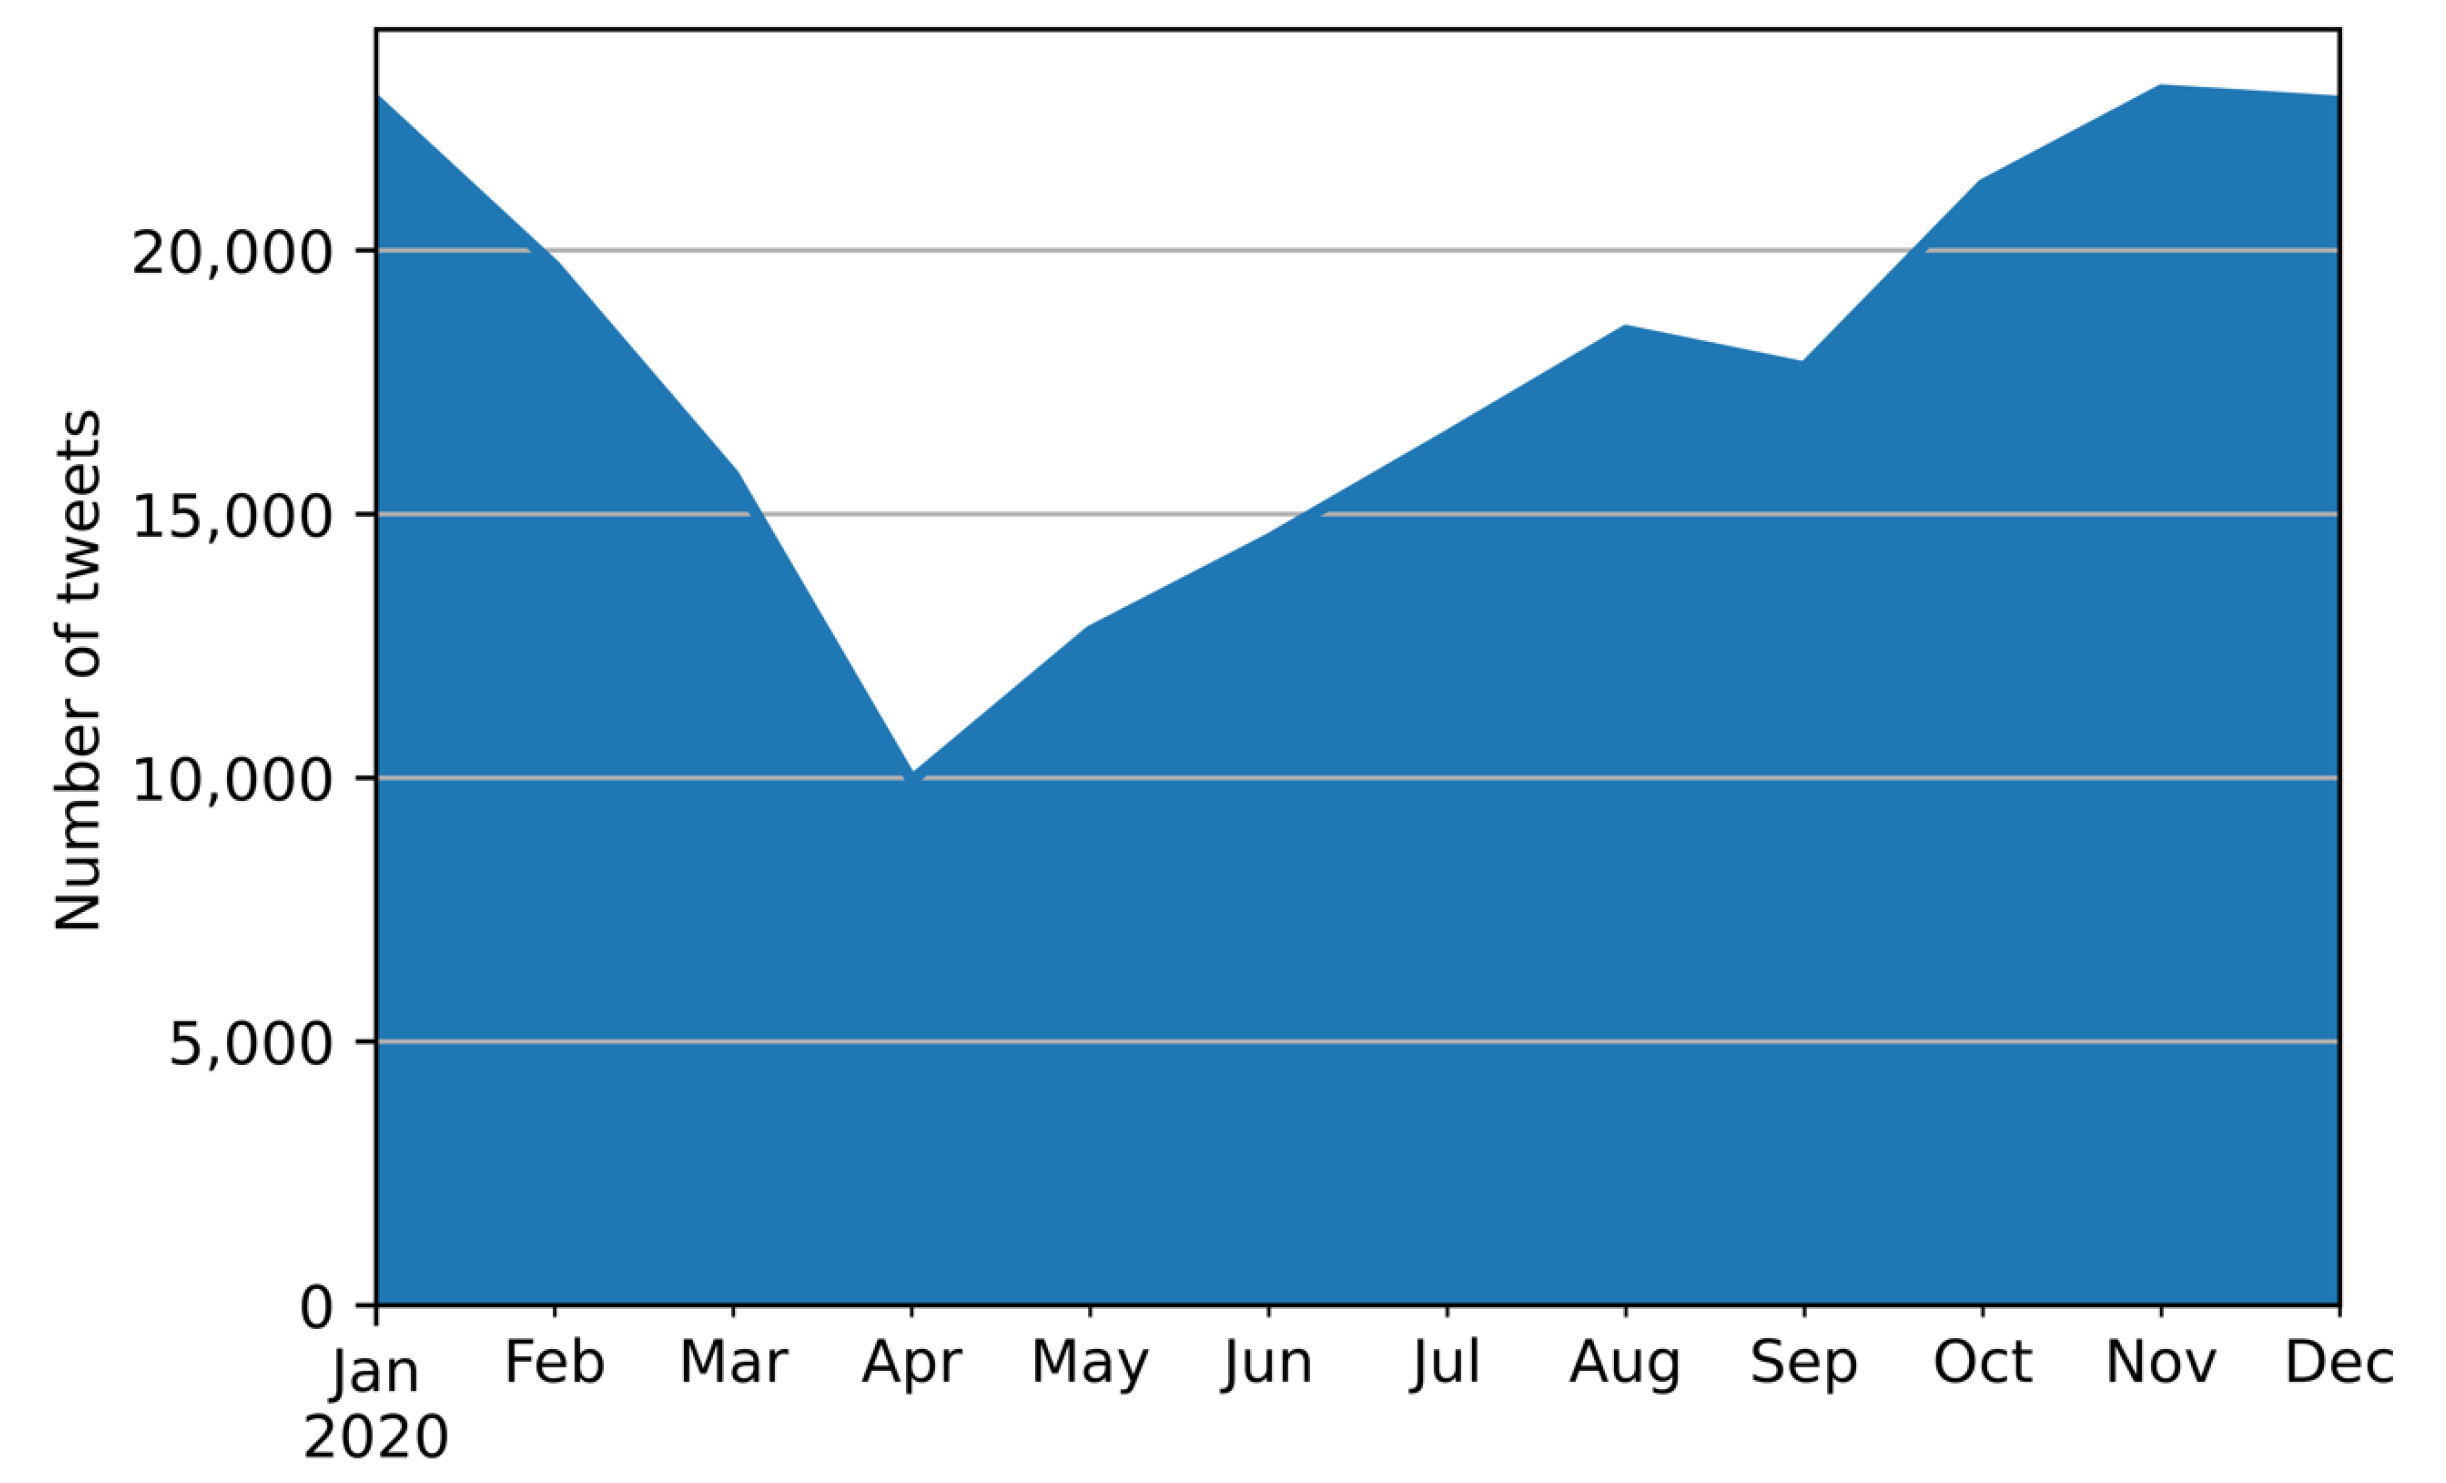
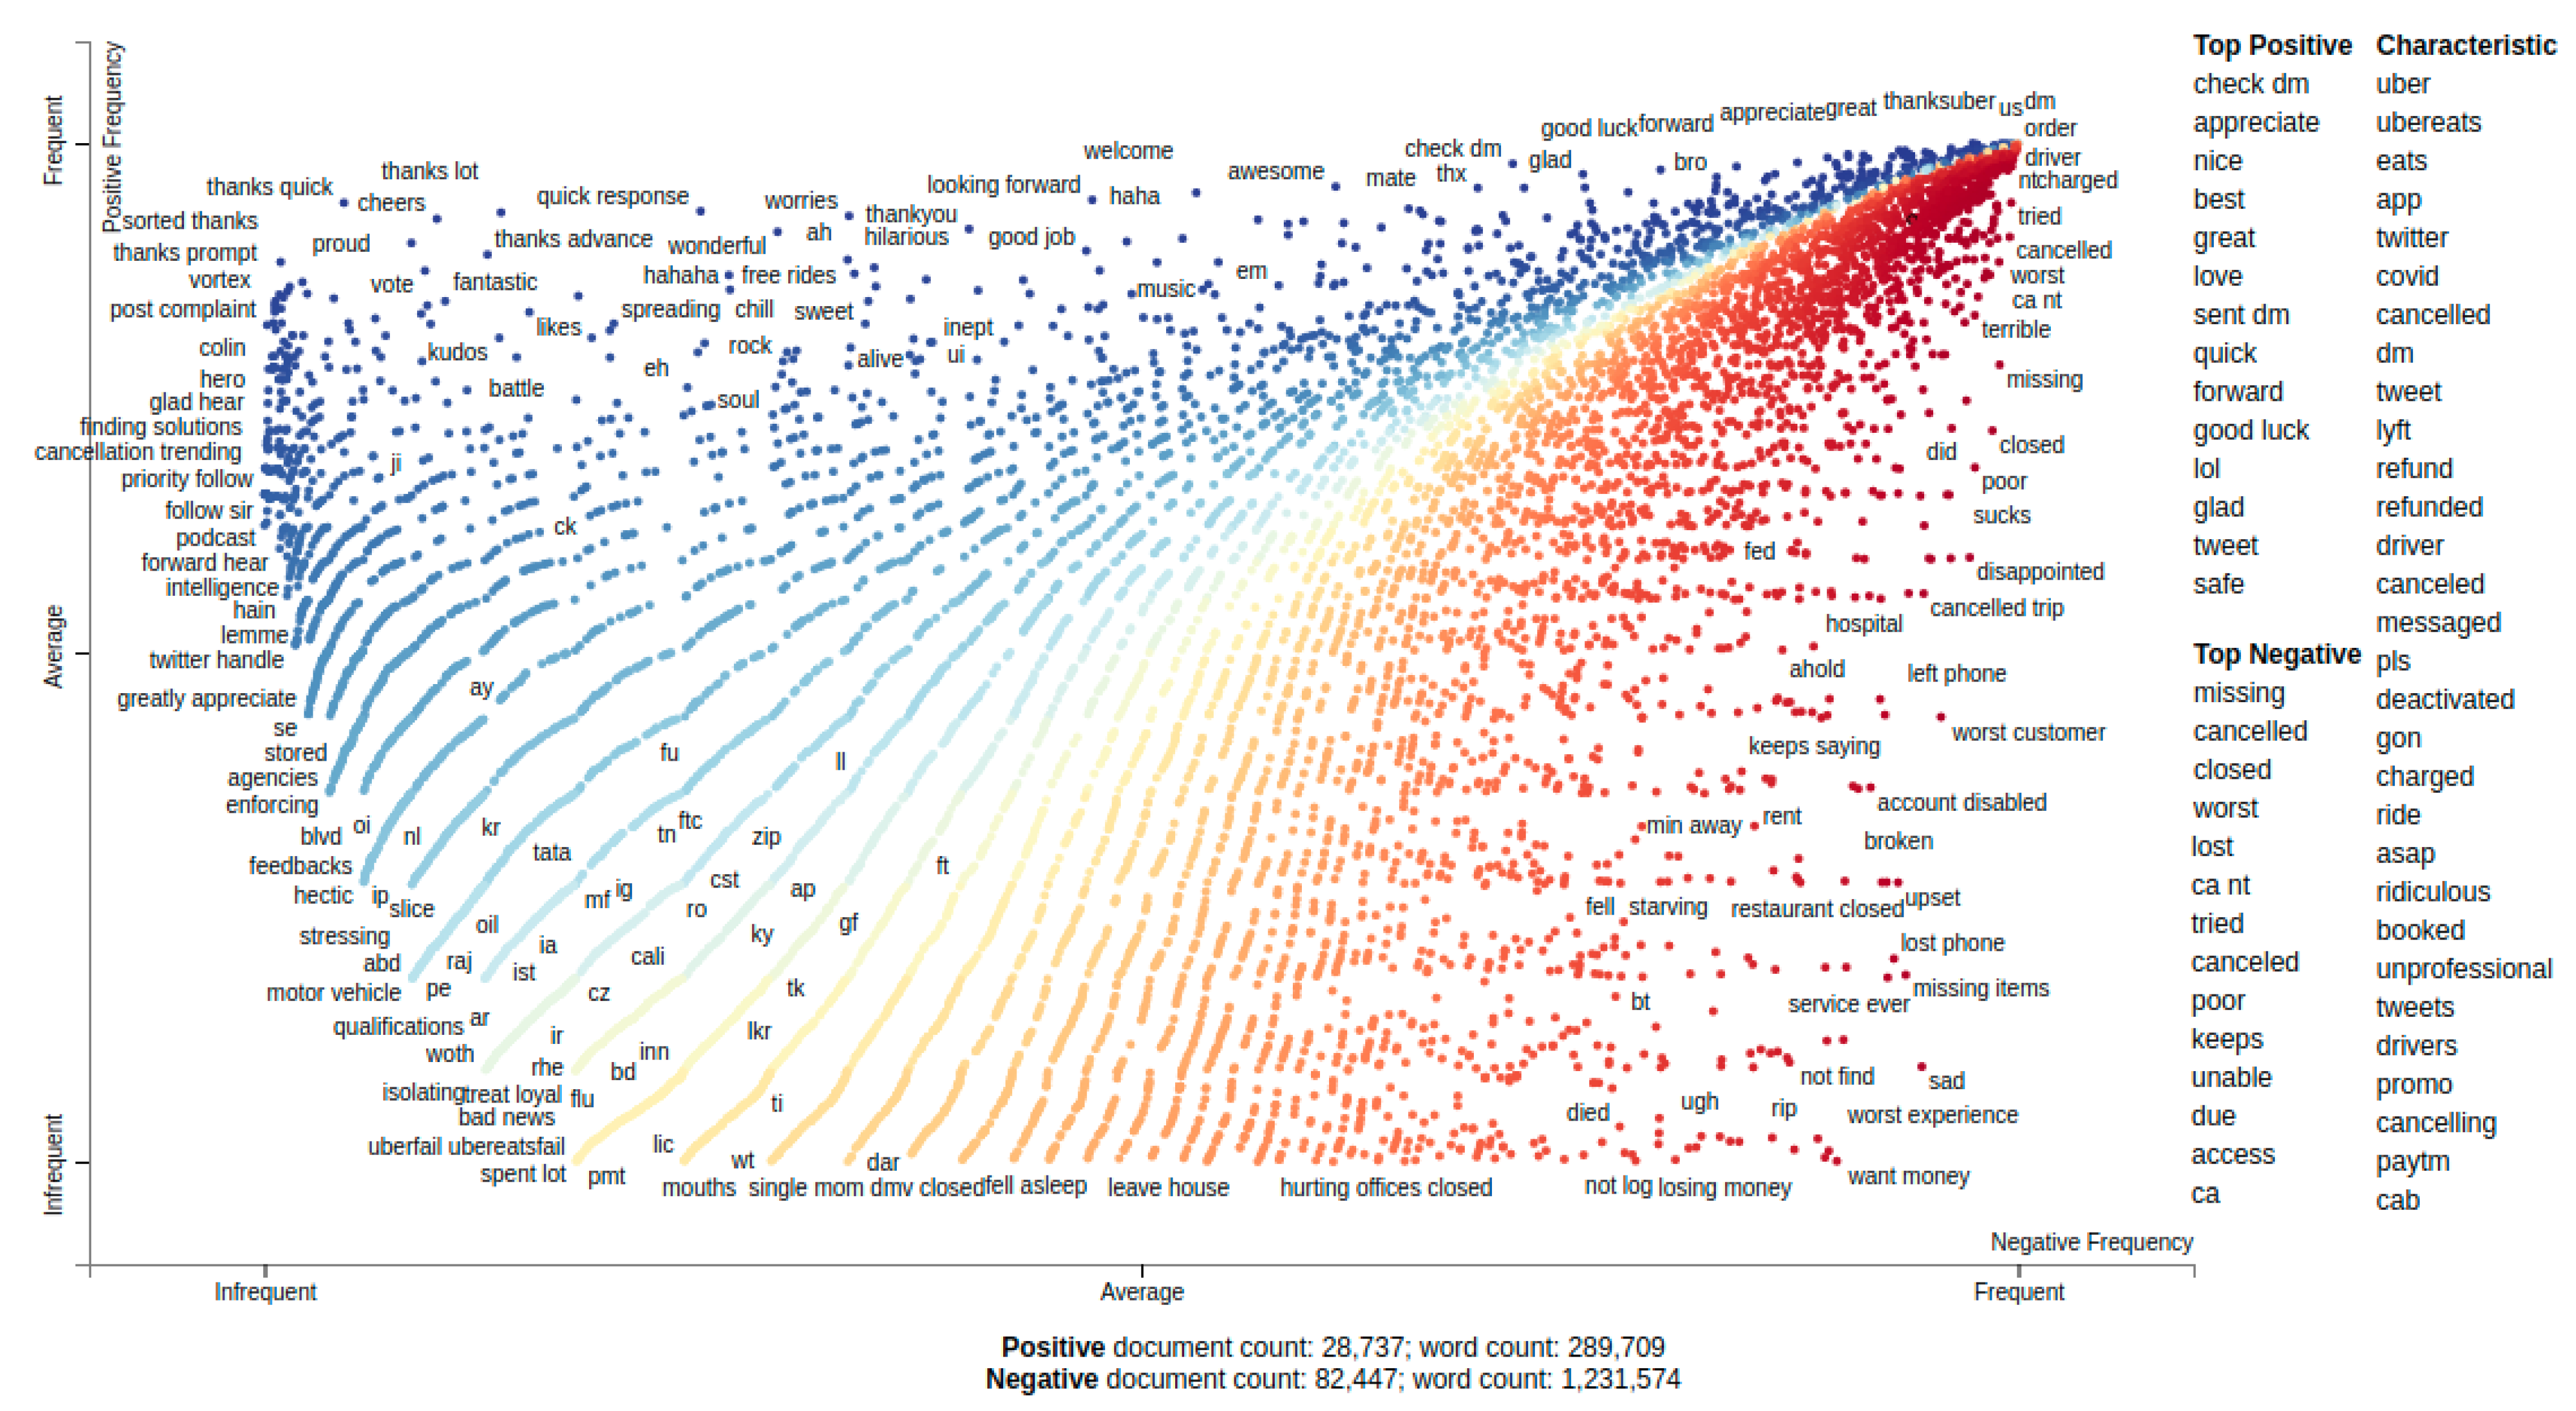
4.1. Data Collection and Global Analysis

As mentioned in Section 3.1, tweets were collected from Uber customers addressing the @Uber_Support Twitter platform during the entire year of 2020. As a result, we can see, in Figure 2, the monthly volume of tweets during 2020.
Figure 2 shows interesting results that need to be interpreted: we can observe a significant decrease (43%) in the daily tweet volume during March and April. This decrement occurred with high probability due to the restrictions and confinements suffered during those months throughout the world population due to the pandemic caused by Coronavirus disease (COVID-19). After restrictions and confinements were decreasing, we observed that people started to use transport platforms again to recover their daily activities. This means that people also started to tweet their problems and opinions on the different transport platforms again.
We also collected the most frequent words of customers and drivers to check the most common and relevant issues these users post on the platform. Figure 3 shows a word cloud with these most frequent words.
This word cloud provides each word with a different size according to the frequency on the corpus. Words like “driver”, “customer”, “time”, and “thank” are the most frequent words. These word frequencies show that people commonly tweet to @Uber_Support to discuss problems or recommendations related to drivers and their customer service.
Regarding the opinion analysis, we have grouped the tweets according to their sentiment and emotion following the processes described in Section 3.6. As a result, Figure 4 shows the global outcome of the sentiments and emotions described in this customer service dataset.
The first conclusion we have drawn from the sentiment analysis was that Uber users who post tweets containing a sentiment usually express a negative polarity (38.8%) over a positive one (13.3%). We consider this fact a worrying outcome since this transport company highly depends on users’ satisfaction to compete with their competitors.
Regarding the emotion extraction, it is observed that the trust (21.9%) and anticipation (19.0%) emotions are the predominant emotions in the collected tweets. However, the emotions related to disgust (15.9%) and anger (15.4%) seem to appear frequently in these customer services. Based on these results, we believe that a high proportion of negative tweets from the dataset can be intimately related to tweets expressing anger and disgust expressions.
In addition to the previous analysis, we collected the ten most frequent hashtags in the dataset, and we classified the tweets containing these hashtags according to their sentiment value, as can be seen in Table 1.
The obtained results show that the majority of the tweets containing hashtags describe a neutral polarity. However, some tweets containing the specific hashtags related to Uber Eats and Uber drivers describe a predominant negative sentiment value which can be related to a user’s negative experience related to these services.
As the last step from this section, we decided to filter the most frequent words and phrases from the negative and positive tweets. At first instance, it can be assumed that these words individually may not represent (in most cases) a sentiment value. However, their placement on negative tweets and positive ones may encode a vocabulary of words that can describe a sentiment value in the context of both transport and customer services.
To perform this task, we first made several pre-processing of the dataset. After that, we visualized in Figure 5 a scatter plot [41] containing the frequency of these words in both positive and negative tweets. This figure represents a distribution of words into a 2-dimensional space where their axis represents the frequency of the positive and negative categories for each word.
In this way, the y-axis encodes the frequency in the positive category where words located on the top area frequently appear in positive tweets (e.g., quick response and worries). This means that these words will represent with high probability a positive sentiment in the context of transport and customer services. Similarly, the x-axis represents the negative category where the words located on the right area are highly frequent in negative tweets (e.g., want money, and restaurant closed).
However, there are several words such as thanksuber or driver which are located with high frequency in both categories. This means that these words are usually written on both negative and positive tweets. For example, the term thanksuber can be associated with both categories since users may post this word using an ironic expression providing a negative opinion towards the platform, or conversely, they are expressing their gratitude to the response provided by the service.
In light of these results, it is observed that this first analysis does not provide deep information from the dataset since it only describes global statistical information. Hence, the following sections of this work will describe in detail the process to segregate the different tweets into their topic with the purpose of classifying the sentiment and emotion information of each of the latent topics.

4.2. Topic Modeling Performances and Results

To perform the task of extracting the most discussed topics, we have evaluated the T topics with c_v maximum in each LDA model described in Section 3.4. As a result, we decided to select the model shown in Figure 6. This LDA model uses lemmatization, stemming, and bigrams with a minimum frequency to create them to 10 times.
From the previous figure, it is observed that the maximum value of coherence score (c_v) is located in 7 topics with a value of 0.4956. The principal reason for selecting this model among the rest of the models analyzed during the project involves the above-mentioned combination between high c_v results and human interpretability. In our particular case, we experimented that some of the models described in Section 3.4 had higher values of c_v score than others. However, after the individual analysis of each topic (particularly the words this topic contains) from those models, we experimented that some of them could be grouped as the same topic.
For this reason, in order to ensure that each topic represents a unique theme in the dataset, we combined the previous c_v analysis from Figure 6 with a pyLDAvis [31] implementation (Section 3.4). As a result, Figure 7 shows the distance between topics in a two-dimensional space using pyLDAvis [31].
We can notice that all the topic groups from Figure 7 are well separated from each other. For this reason, topics do not have similarities between them, and we can ensure that our topic modeling proposed is viable for its analysis.
After this previous analysis, we have determined that the optimal number of topics in the dataset refers to seven non-overlapped topics. Intending to optimize the solution created in this section, we implemented some of the most widely used topic models. Specifically, this work has focused on the comparison between the Non-negative matrix factorization (NMF) [42], the Latent Semantic Analysis (LSI) [43], and the LDA models, taking advantage of the OCTIS [44] project. This project help researchers easily train, analyze and compare several Topic Models on their corpus. OCTIS optimal hyperparameters can be estimated by means of a Bayesian Optimization approach. In this work, we have used OCTIS to compare the topic models mentioned above through several evaluation metrics (coherence score and topic diversity).
Table 2 shows that the models that use NMF and LDA for topic modeling lead to the best performance metrics. As they both have similar results, we decided to continue focusing on the model with the maximum c_v score. For this reason, we selected the model that uses the LDA method for distributing the words from the corpus into the seven topics in order to analyze them individually.
Before giving a name to each of the seven topics obtained, previous research on transport platforms and customers services was realized. As a result, Table 3 shows these seven most discussed topics in the dataset with its most frequent words providing a word cloud, a detailed description of each of the topics, and the name of the topic.

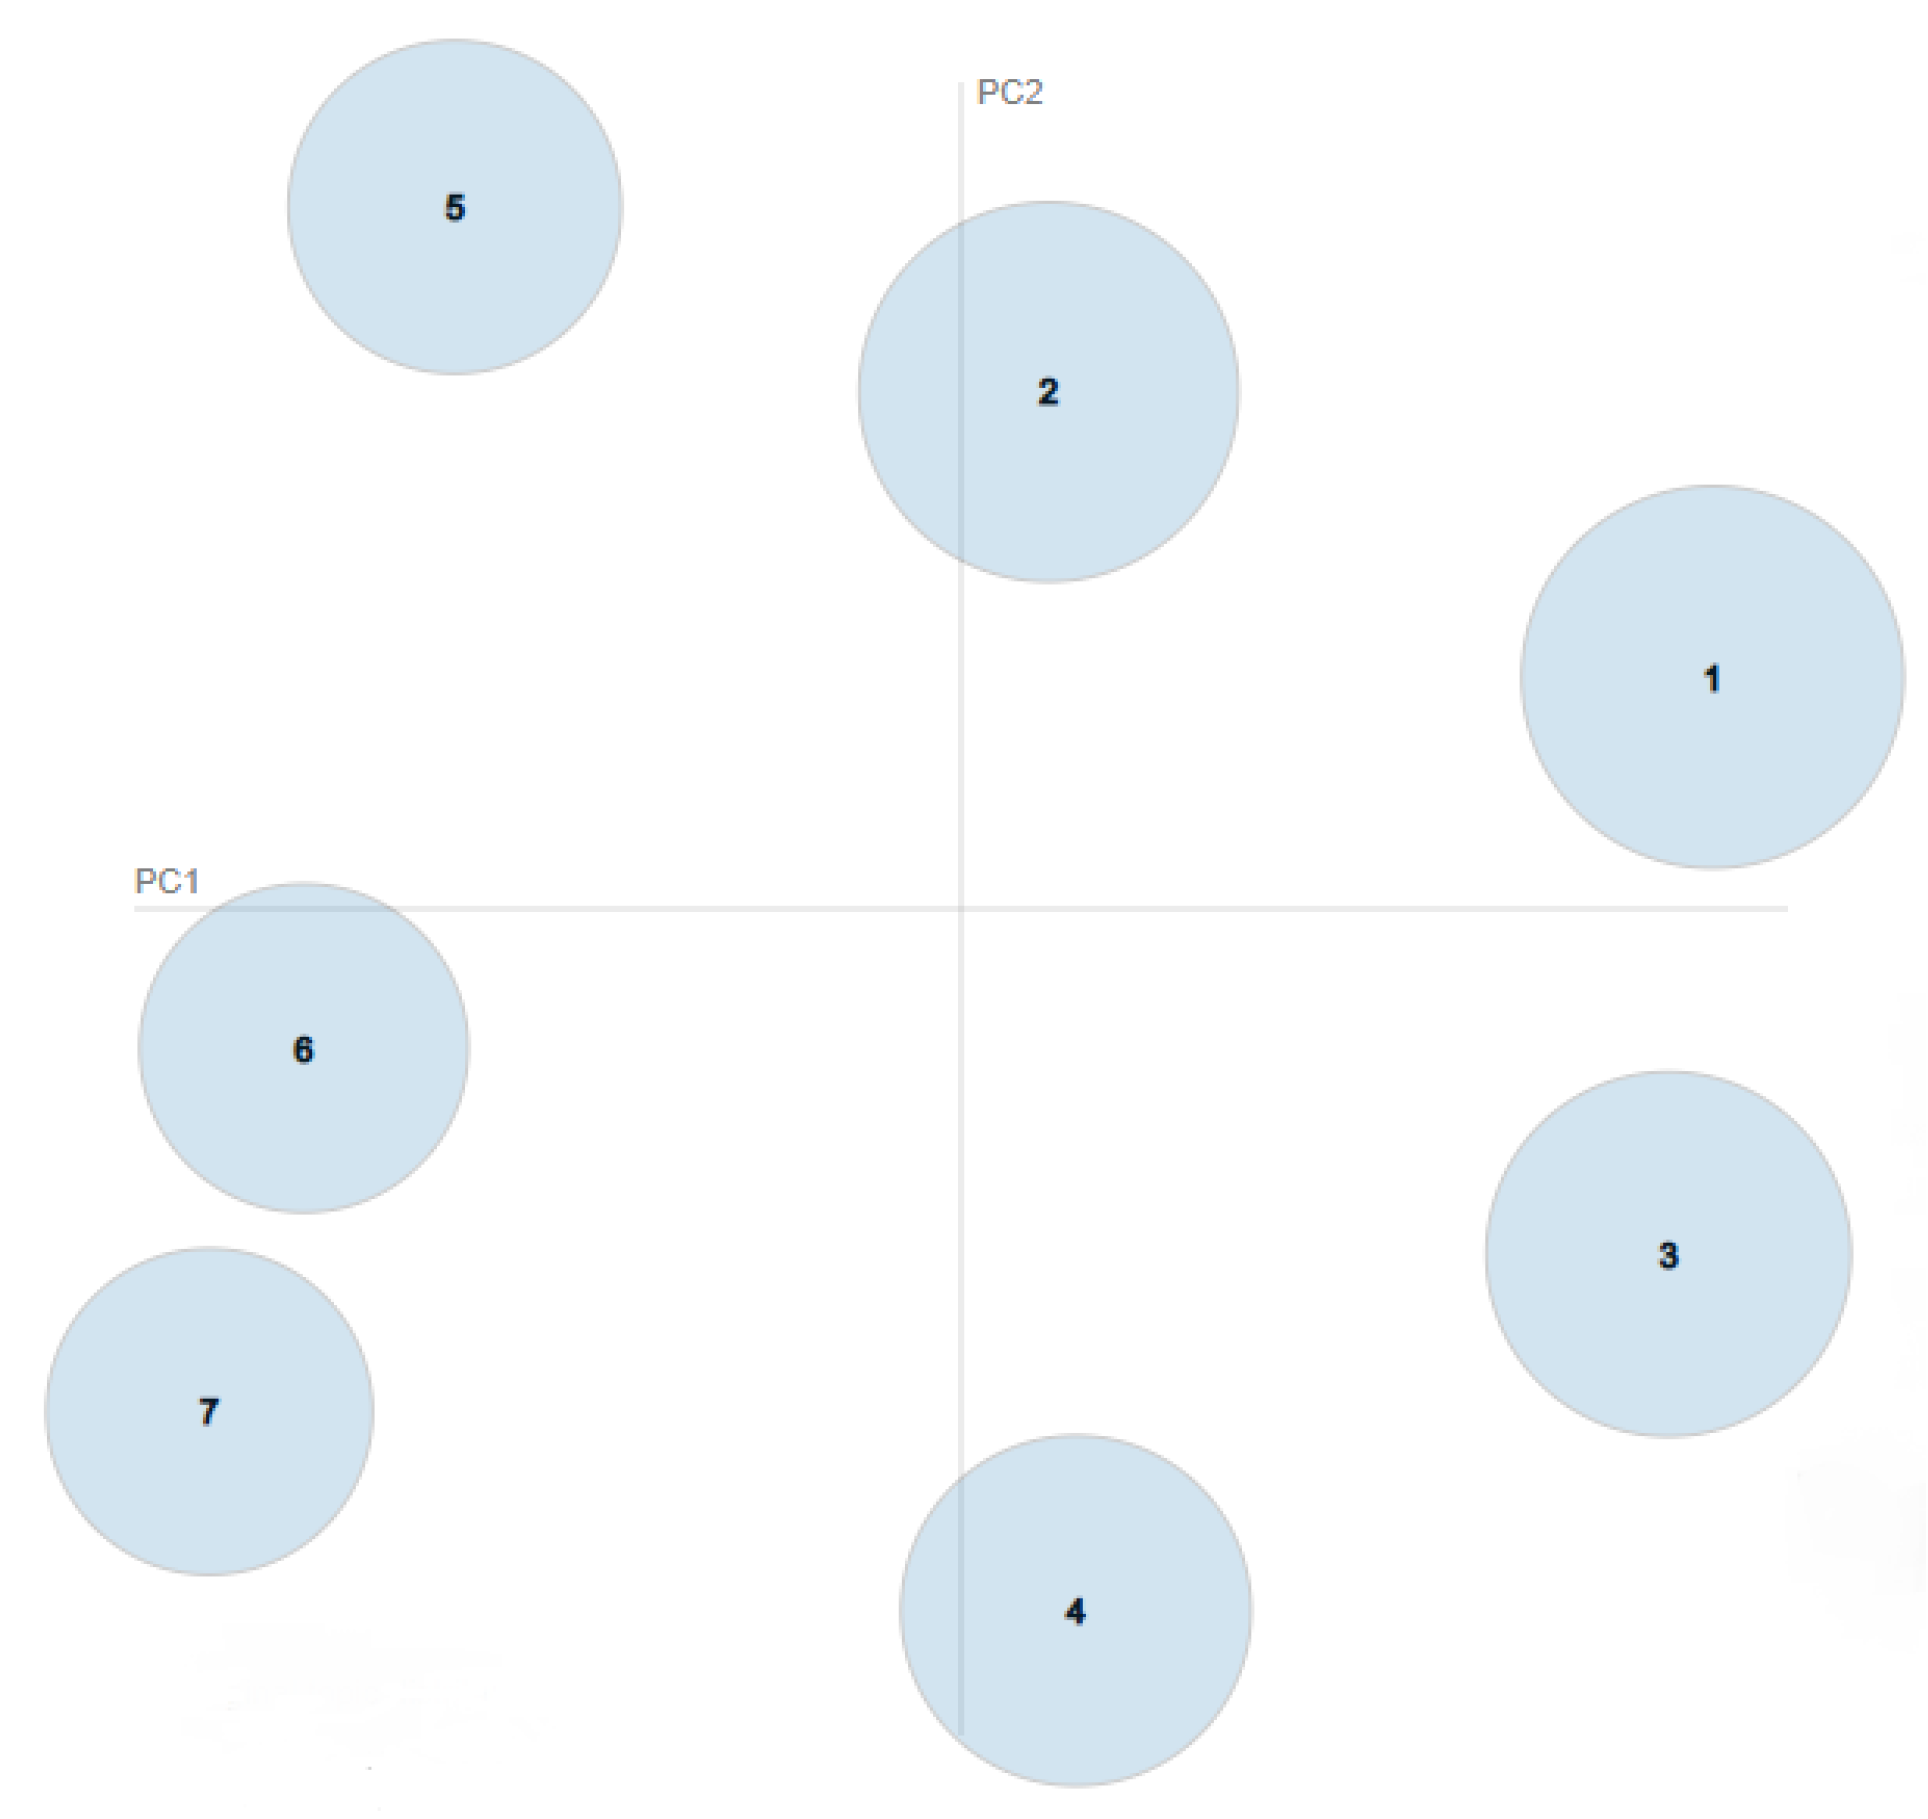
4.3. Clustering Performances and Results

To perform the task of grouping each of the tweets into one of the predefined topics, we first introduced in the project the K-Means algorithm. However, the unsupervised nature of this algorithm (Section 3.5.1) requires the user to establish the optimal number of clusters to partition the space. To do this, we followed an iterative process by making variations on the number of clusters. In each iteration, we measured the total value of inertia, as can be seen in Figure 8.
It is observed that the optimal value for clustering the LDA probability vectors refers to K = 7 with a total inertia value of 17,051.66. Moreover, this K value projects the same result as the optimal number of topics T = 7 (Section 4.2). Besides, we highlight from this algorithm that each cluster centroid is uniformly distributed in a 7-dimensional space since their predominant components (Table 4) are not repeated in any of the centroids. For this reason, each cluster defines a unique topic, and each document associated with the same cluster will share the same topic.
After this first clustering approach, we introduced the Genetic Algorithm and the local convergence algorithm described in Section 3.5.2 and Section 3.5.3 with the aim of optimizing the inertia value calculated with the Elbow Method for a K = 7 cluster representation, as shown in Figure 8.
The obtained results are shown in Table 5, where the three algorithms were compared following the fitness evaluation described in [15]. It can be seen that the hybridized GA, which is referred to as the use of the GA and the local convergence algorithm, describes the same mathematical performance as the K-Means algorithm performed with Scikit-learn [35]. In light of these results, it is safe to assume the hypothesis that both algorithms could have reached the global minimum of the problem.
To conclude this section, Table 4 shows the predominant component of each cluster centroid and the percentage of tweets associated with each of the clusters by using both K-Means and the hybridized Genetic Algorithm. It is seen that both algorithms describe nearly the same tweet distributions through the topics where the topic related to “Contact with Uber Support” has the highest volume of tweets. Moreover, this table shows that both algorithms distribute the predominant component of each cluster centroid in a similar position of the 7-dimensional space.

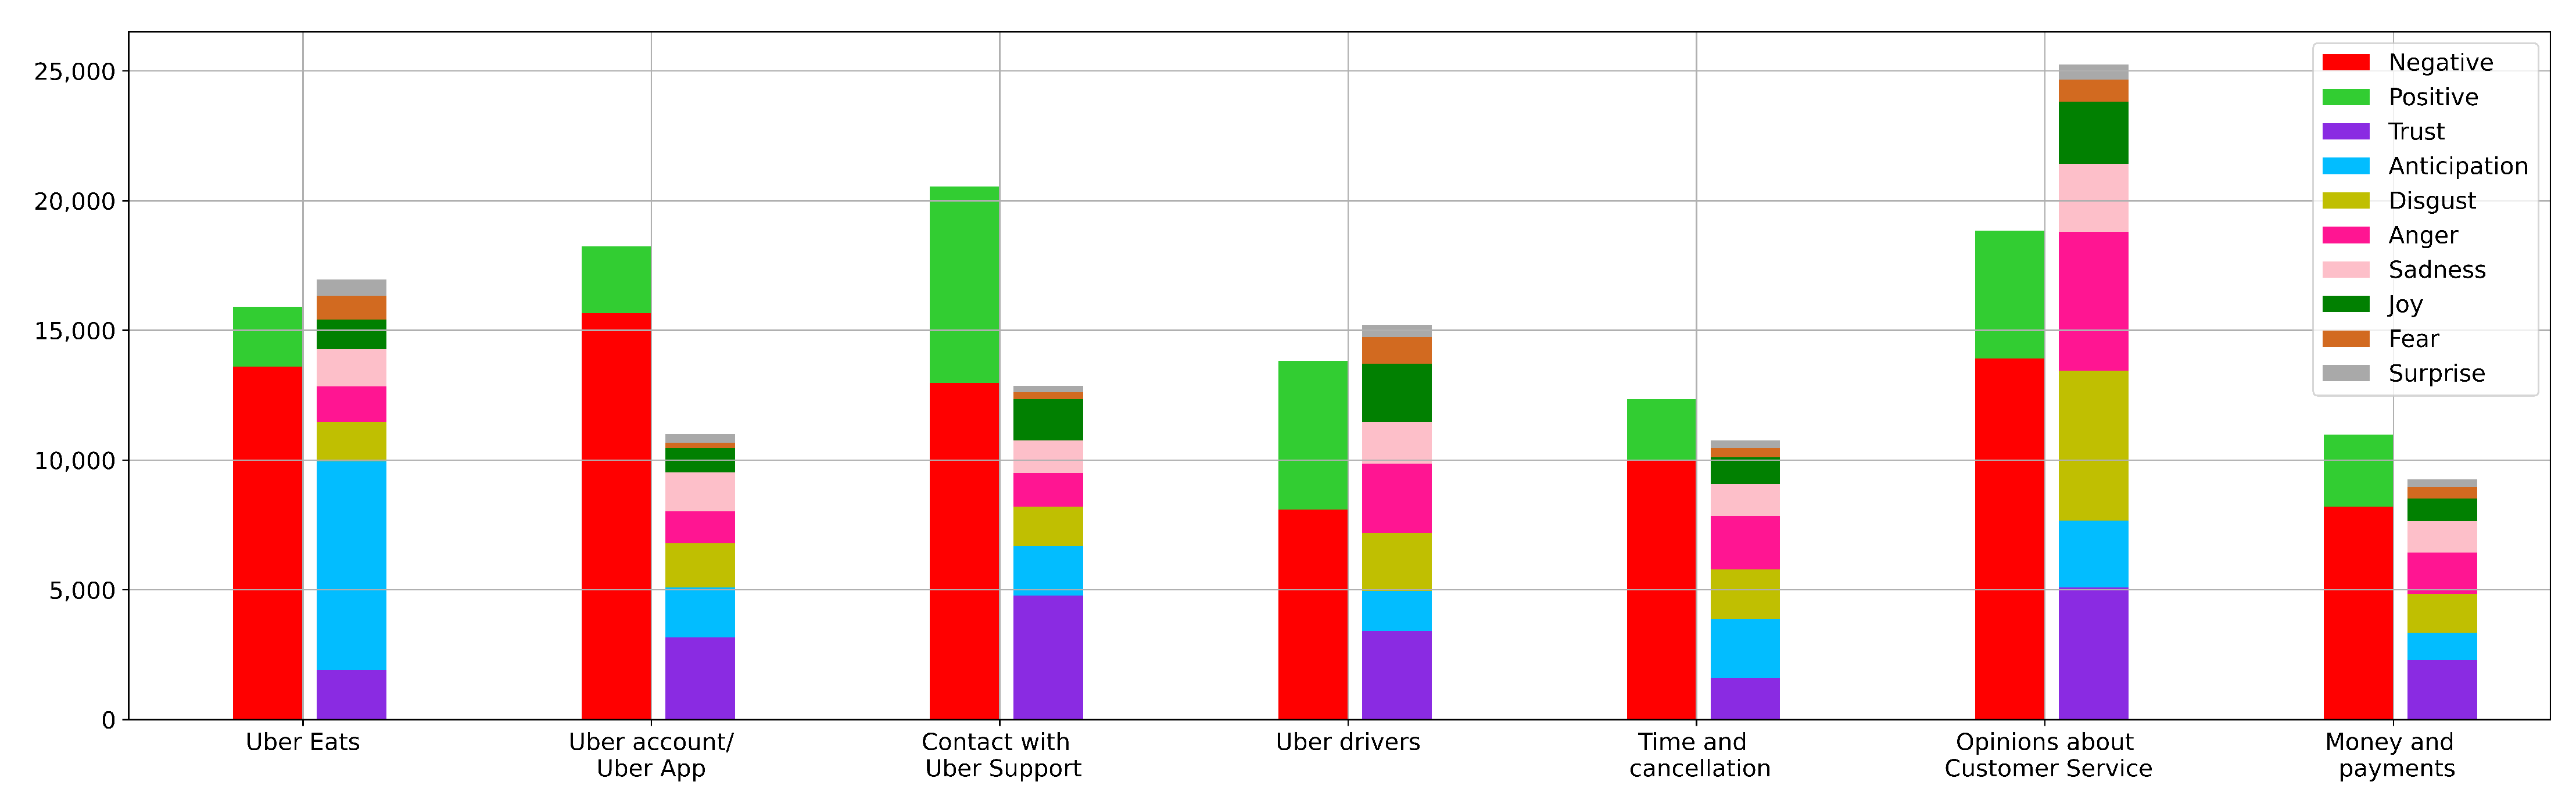
4.4. Sentiment and Emotion Analysis of Each Topic

The last step of this work involves the detailed analysis of the sentiments and emotions for each of the different topics described. To perform this task, we have combined both topic modeling techniques (Section 4.2) and the hybridized Genetic Algorithm (Section 4.3) to group each tweet that contains sentiments and emotions into the identified topics.
The volume of sentiments and emotions associated with the different topics is shown in Figure 9. This figure plots two vertical stacked bars for each topic where the left bar defines the sentiments of the topic (red for negative sentiments and green for positive ones), and the right bar describes the emotion volume for each topic.
Based on the sentiment values, it is observed that all the discussed topics in the dataset show more negative tweets than positive ones. This result means that Uber users address the customer service platform (@Uber_Support) to tweet about complaints and problems with a negative expression on their posts with more frequency than using positive expressions, independently of the topic they are referring to. Specifically, the tweets related to the Time and cancellation, Uber account / Uber App, and Uber Eats topics seem to have the highest negative sentiment values since these topics show the highest difference between negative tweets and positive ones.
With respect to the emotions, two relevant conclusions can be extracted. Firstly, we can observe that the topic related to Opinions about Customer Service shows the highest volume of emotions. Furthermore, it is observed that the predominant emotions of this topic are related to disgust and anger expressions. In light of this result, it is safe to assume that most of the negative tweets from this topic could be related to customers who are angry or disgusted about the support provided by the customer service. This emotion result justifies the high values of anger and disgust described in Figure 4. The second relevant feature extracted from this analysis emphasizes that the topic related to Uber Eats shows that the anticipation emotion is the most repeated one among these tweets. This result could be intimately related to the user’s expectancy of awaiting food that did not arrive on time (e.g., @Uber_Support my food never arrived), which can also be related to the high volume of negative tweets from this topic.

5. Conclusions and Outlook

This work has focused on analyzing the messages posted by users to a customer service platform based on the social network Twitter. Specifically, we have analyzed the customer’s voice from the @Uber_Support transport service platform during the complete year of 2020. Furthermore, three main research questions have driven this work.
In relation to the first research question, before obtaining the different topics from the dataset, we first have characterized a global analysis of the collected data, which helped us to understand the users’ viewpoints when publishing information in the context of both transport and customer services. Specifically, we have been able to quantify the monthly volume of tweets in which we have determined that the COVID-19 disease directly affected the daily volume of questions and concerns of users towards these services. Additionally, we have been able to characterize the sentiments and emotions of the users when tweeting to this customer service platform. The conclusion we draw from this analysis was that a wide range of users who post negative tweets usually relates to disgust and anger expressions. Furthermore, we noticed that the majority of the tweets containing sentiments usually describe similar vocabulary expressions, which can be related to the context of both transport and customer services.
However, the previous analysis did not characterize the underlying structure of the dataset since it only described the most common statistics from an opinion mining project. Therefore, to provide high-quality approaches that can help companies to understand users’ demands, we considered the importance of answering our first research question related to obtaining the latent topics in the platform. For this reason, we performed several pre-processing techniques on the collected data, and we combined them with several topic modeling techniques. This process concluded that customers and drivers usually posted in 2020 tweets to @Uber_Support concerning seven different topics.
In addition to the topic modeling system, we performed several clustering techniques to group each tweet into the identified topics. Firstly, we introduced into the project the K-Means algorithm, where we concluded that the optimal number of clusters to divide the space referred to seven clusters. Additionally, intending to optimize the solution given by the K-Means approach, we used a Genetic Algorithm based on clustering LDA probability vectors following the model proposed in [15]. Finally, we introduced the fittest individual from the previous algorithm into a local convergence algorithm which followed the linear restrictions imposed by the probability simplex for each cluster.
The conclusions obtained from both topic modeling (NMF, LDA, and LSI) and clustering algorithms (K-Means, GA, and hybridized GA) performances helped us to provide an answer to our second research question, which is intimately related to the project’s optimization. In the case of our dataset, we concluded that the combination of LDA with the K-Means algorithm from the Scikit-learn library [35] or the hybridized GA describes the best performance results among all the algorithms used.
Finally, the combination of both topic modeling and clustering techniques helped us to dissect the high volume of data in a detailed description of the sentiment and emotion information associated with each topic. The obtained results indicated that some specific topics related to time policies, food delivery, and issues related to logging or validation of the account described a high volume of users’ negative tweets. This worrying outcome suggests that some users may have lost their loyalty towards Uber’s services which could result in the use of Uber’s competence to satisfy their needs. Moreover, this analysis helped us to explore in detail the impact of the emotions combined with the sentiment description for each of the different topics. One of the main obtained results from this analysis indicated that the anticipation emotion transmitted in the context of transport and food delivery services could be highly related to tweets that contain a negative expression.
This work has presented a methodology for analyzing customer service interactions that can be used to understand the user satisfaction with this service and the main areas that concern users. Expert domain knowledge is required to provide a significant name to every detected topic. When analyzing a continuous message stream, other techniques, such as incremental LDA [45], should be used so.
Our future work focuses on a more detailed analysis of the user’s opinions by investigating two main branches. Firstly, a geographical analysis of the dataset can provide detailed information on the different topics and opinions of each city or country the transport service operates. We believe that this detailed analysis could help brands to establish higher quality marketing approaches since the user’s opinion towards the company will differ depending on the region analyzed. Finally, as it can be seen, this work has only been restricted to the Uber brand domain. However, the possibility of exploring other transport services from the sector (e.g., Cabify in the Spanish-speaking countries, Lyft) is a wide area of investigation which will help companies to analyze more deeply the global transport and customer service market.

Author Contributions

Conceptualization, A.M. and C.A.I.; methodology, A.M. and C.A.I.; software, A.M.; validation, A.M.; writing—original draft preparation, A.M.; writing—review and editing, A.M. and C.A.I.; supervision, C.A.I. All authors have read and agreed to the published version of the manuscript.

Funding

This research was funded by Cátedra Cabify-UPM.

Institutional Review Board Statement

Not applicable.

Informed Consent Statement

Not applicable.

Acknowledgments

This research work was supported by the Cabify-UPM Chair of Smart Technologies and Data Science for Sustainable Mobility, and by the scholarship GSI Gregorio Fernández for Research in Machine Learning. We also want to thank MeaningCloud for providing access to their resources for research purposes.

Conflicts of Interest

The authors declare no conflict of interest.

Abbreviations

The following abbreviations are used in this manuscript:
DEAPDistributed Evolutionary Algorithms in Python
GAGenetic Algorithm
LDALatent Dirichlet Allocation
LSILatent Semantic Analysis
MCMCMarkov Chain Monte Carlo
NLPNatural Language Processing
NLTKNatural Language Toolkit
NMFNon-negative Matrix Factorization
POSPart-Of-Speech
SLSQPSequential Least-Squares Programming
TWINTTwitter Intelligence Tool

References

  1. Subramanian, K. Influence of Social Media in Interpersonal Communication. Int. J. Sci. Prog. Res. (IJSPR) 2017, 109, 70–75. [Google Scholar]
  2. He, W.; Tian, X.; Chen, Y.; Chong, D. Actionable Social Media Competitive Analytics For Understanding Customer Experiences. J. Comput. Inf. Syst. 2016, 56, 145–155. [Google Scholar] [CrossRef]
  3. Baj-Rogowska, A. Sentiment analysis of Facebook posts: The Uber case. In Proceedings of the 2017 Eighth International Conference on Intelligent Computing and Information Systems (ICICIS), Cairo, Egypt, 5–7 December 2017; pp. 391–395. [Google Scholar]
  4. Morshed, S.A.; Khan, S.S.; Tanvir, R.B.; Nur, S. Impact of COVID-19 pandemic on ride-hailing services based on large-scale Twitter data analysis. J. Urban Manag. 2021, 10, 155–165. [Google Scholar] [CrossRef]
  5. Zulkarnain, Z.; Surjandari, I.; Wayasti, R. Sentiment Analysis for Mining Customer Opinion on Twitter: A Case Study of Ride-Hailing Service Provider. In Proceedings of the 5th International Conference on Information Science and Control Engineering (ICISCE), Zhengzhou, China, 20–22 July 2018; pp. 512–516. [Google Scholar] [CrossRef]
  6. Uber Customer Service Twitter Platform. Available online: https://twitter.com/Uber_Support (accessed on 21 June 2021).
  7. Wallsten, S. The Competitive Effects of the Sharing Economy: How is Uber Changing Taxis? Technol. Policy Inst. 2015, 22, 1–21. [Google Scholar]
  8. Statista. Number of Social Network Users Worldwide from 2017 to 2025. Available online: https://www.statista.com/statistics/278414/number-of-worldwide-social-network-users/ (accessed on 21 June 2021).
  9. Malik, A.; Kapoor, D.; Singh, A. Sentiment Analysis on Political Tweets. In Proceedings of the Vth International Symposium on Fusion of Science and Technology, Prague, Czech Republic, 5–9 September 2016. [Google Scholar]
  10. Yu, Y.; Wang, X. World Cup 2014 in the Twitter World: A big data analysis of sentiments in U.S. sports fans’ tweets. Comput. Hum. Behav. 2015, 48, 392–400. [Google Scholar] [CrossRef]
  11. Gong, X.; Wang, Y. Exploring dynamics of sports fan behavior using social media big data—A case study of the 2019 National Basketball Association Finals. Appl. Geogr. 2021, 129, 102438. [Google Scholar] [CrossRef]
  12. Praveen, S.; Ittamalla, R.; Deepak, G. Analyzing Indian general public’s perspective on anxiety, stress and trauma during COVID-19—A machine learning study of 840,000 tweets. Diabetes Metab. Syndr. Clin. Res. Rev. 2021, 15, 667–671. [Google Scholar] [CrossRef] [PubMed]
  13. Ruan, Y.; Durresi, A.; Alfantoukh, L. Using Twitter trust network for stock market analysis. Knowl.-Based Syst. 2018, 145, 207–218. [Google Scholar] [CrossRef] [Green Version]
  14. Ibrahim, N.F.; Wang, X. A text analytics approach for online retailing service improvement: Evidence from Twitter. Decis. Support Syst. 2019, 121, 37–50. [Google Scholar] [CrossRef] [Green Version]
  15. Pournarakis, D.E.; Sotiropoulos, D.N.; Giaglis, G.M. A computational model for mining consumer perceptions in social media. Decis. Support Syst. 2017, 93, 98–110. [Google Scholar] [CrossRef]
  16. Alamsyah, A.; Rizkika, W.; Nugroho, D.D.A.; Renaldi, F.; Saadah, S. Dynamic Large Scale Data on Twitter Using Sentiment Analysis and Topic Modeling. In Proceedings of the 2018 6th International Conference on Information and Communication Technology (ICoICT), Bandung, Indonesia, 3–4 May 2018; pp. 254–258. [Google Scholar] [CrossRef]
  17. Twitter Intelligence Tool (TWINT). Available online: https://github.com/twintproject/twint (accessed on 21 June 2021).
  18. Murugan, N.S.; Devi, G.U. Detecting streaming of Twitter spam using hybrid method. Wirel. Pers. Commun. 2018, 103, 1353–1374. [Google Scholar] [CrossRef]
  19. Gheewala, S.; Patel, R. Machine learning based Twitter Spam account detection: A review. In Proceedings of the 2018 Second International Conference on Computing Methodologies and Communication (ICCMC), Erode, India, 15–16 February 2018; pp. 79–84. [Google Scholar]
  20. Uysal, A.K.; Gunal, S. The impact of preprocessing on text classification. Inf. Process. Manag. 2014, 50, 104–112. [Google Scholar] [CrossRef]
  21. NLTK: The Natural Language Toolkit. Available online: https://www.nltk.org/ (accessed on 19 September 2021).
  22. Spacy: Industrial-Strength Natural Language Processing. Available online: https://spacy.io/ (accessed on 21 June 2021).
  23. Blei, D.M.; Ng, A.Y.; Jordan, M.I. Latent Dirichlet Allocation. J. Mach. Learn. Res. 2003, 3, 993–1022. [Google Scholar]
  24. Řehůřek, R.; Sojka, P. Software Framework for Topic Modelling with Large Corpora. In Proceedings of the LREC 2010 Workshop on New Challenges for NLP Frameworks, Valletta, Malta, 22 May 2010; pp. 45–50. [Google Scholar]
  25. Li, X.; Fan, M.; Zhou, Y.; Fu, J.; Yuan, F.; Huang, L. Monitoring and forecasting the development trends of nanogenerator technology using citation analysis and text mining. Nano Energy 2020, 71, 104636. [Google Scholar] [CrossRef]
  26. Das, R.; Zaheer, M.; Dyer, C. Gaussian LDA for Topic Models with Word Embeddings. In Proceedings of the 53rd Annual Meeting of the Association for Computational Linguistics and the 7th International Joint Conference on Natural Language Processing, Beijing, China, 26–31 July 2015; Volume 1, pp. 795–804. [Google Scholar] [CrossRef] [Green Version]
  27. Mimno, D.; Wallach, H.M.; Talley, E.; Leenders, M.; McCallum, A. Optimizing Semantic Coherence in Topic Models. In Proceedings of the 2011 Conference on Empirical Methods in Natural Language Processing, Scotland, UK, 27–31 July 2011;–31; Volume 27–31, pp. 262–272. [Google Scholar]
  28. Griffiths, T.L.; Steyvers, M. Finding scientific topics. Proc. Natl. Acad. Sci. USA 2004, 101, 5228–5235. [Google Scholar] [CrossRef] [PubMed] [Green Version]
  29. Stevens, K.; Kegelmeyer, P.; Andrzejewski, D.; Buttler, D. Exploring Topic Coherence over Many Models and Many Topics. In Proceedings of the 2012 Joint Conference on Empirical Methods in Natural Language Processing and Computational Natural Language Learning, Jeju Island, Korea, 12–14 July 2012; pp. 952–961. [Google Scholar]
  30. Mifrah, S.; Benlahmar, E.H. Topic Modeling Coherence: A Comparative Study between LDA and NMF Models using COVID’19 Corpus. Int. J. Adv. Trends Comput. Sci. Eng. 2020. [Google Scholar] [CrossRef]
  31. Sievert, C.; Shirley, K. LDAvis: A method for visualizing and interpreting topics. In Proceedings of the Workshop on Interactive Language Learning, Visualization, and Interfaces, Baltimore, MD, USA, 27 June 2014; pp. 63–70. [Google Scholar] [CrossRef]
  32. MacQueen, J. Some Methods for Classification and Analysis of MultiVariate Observations. In Proceedings of the 5th Berkeley Symposium on Mathematical Statistics and Probability, Davis, CA, USA, 21 June–18 July 1967; Volume 1, pp. 281–297. [Google Scholar]
  33. Holland, J.H. Adaptation in Natural and Artificial Systems; University of Michigan Press: Ann Arbor, MI, USA, 1975. [Google Scholar]
  34. Arthur, D.; Vassilvitskii, S. K-Means++: The Advantages of Careful Seeding. In Proceedings of the Eighteenth Annual ACM-SIAM Symposium on Discrete Algorithms, New Orleans, LA, USA, 7–9 January 2007; pp. 1027–1035. [Google Scholar]
  35. Pedregosa, F.; Varoquaux, G.; Gramfort, A.; Michel, V.; Thirion, B.; Grisel, O.; Blondel, M.; Prettenhofer, P.; Weiss, R.; Dubourg, V.; et al. Scikit-learn: Machine Learning in Python. J. Mach. Learn. Res. 2012, 12, 2825–2830. [Google Scholar]
  36. Fortin, F.A.; De Rainville, F.M.; Gardner, M.A.; Parizeau, M.; Gagné, C. DEAP: Evolutionary Algorithms Made Easy. J. Mach. Learn. Res. 2012, 13, 2171–2175. [Google Scholar]
  37. Virtanen, P.; Gommers, R.; Oliphant, T.E.; Haberland, M.; Reddy, T.; Cournapeau, D.; Burovski, E.; Peterson, P.; Weckesser, W.; Bright, J.; et al. SciPy 1.0: Fundamental Algorithms for Scientific Computing in Python. Nat. Methods 2020, 17, 261–272. [Google Scholar] [CrossRef] [PubMed] [Green Version]
  38. Sánchez-Rada, J.F.; Iglesias, C.A.; Corcuera-Platas, I.; Araque, O. Senpy: A Pragmatic Linked Sentiment Analysis Framework. In Proceedings of the DSAA 2016 Special Track on Emotion and Sentiment in Intelligent Systems and Big Social Data Analysis (SentISData), Montreal, QC, Canada, 17–19 October 2016; pp. 735–742. [Google Scholar]
  39. Ritthoff, O.; Klinkenberg, R.; Fischer, S.; Mierswa, I.; Felske, S. Yale: Yet Another Learning Environment; Technical Report; University of Dortmund: Dortmund, Germany, 2001. [Google Scholar] [CrossRef]
  40. MeaningCloud’s Deep Categorization API. Available online: https://www.meaningcloud.com/developer/deep-categorization (accessed on 21 June 2021).
  41. Kessler, J.S. Scattertext: A Browser-Based Tool for Visualizing how Corpora Differ. In Proceedings of the ACL 2017, System Demonstrations, Valencia, Spain, 3–7 April 2017; pp. 85–90. [Google Scholar]
  42. Lee, D.; Seung, H.S. Algorithms for Non-negative Matrix Factorization. In Advances in Neural Information Processing Systems; Leen, T., Dietterich, T., Tresp, V., Eds.; MIT Press: Cambridge, MA, USA, 2001; Volume 13. [Google Scholar]
  43. Landauer, T.; Foltz, P.; Laham, D. An Introduction to Latent Semantic Analysis. Discourse Process. 1998, 25, 259–284. [Google Scholar] [CrossRef]
  44. Terragni, S.; Fersini, E.; Galuzzi, B.G.; Tropeano, P.; Candelieri, A. OCTIS: Comparing and Optimizing Topic Models is Simple! In Proceedings of the 16th Conference of the European Chapter of the Association for Computational Linguistics: System Demonstrations, Online, 19–23 April 2021; pp. 263–270. [Google Scholar]
  45. Banerjee, A.; Basu, S. Topic Models over Text Streams: A Study of Batch and Online Unsupervised Learning; SDM: Philadelphia, PA, USA, 2007. [Google Scholar]
Figure 1. Clustering algorithms implemented.
Applsci 11 10169 g001
Figure 2. Monthly volume of tweets.
Applsci 11 10169 g002
Figure 3. Most repeated words tweeted by customers.
Applsci 11 10169 g003
Figure 4. Global sentiment and emotion percentages.
Applsci 11 10169 g004
Figure 5. Frequency of words for both Positive and Negative categories. On the right, most frequent words for Positive (Top Positive) and Negative (Top Negative), and both (Characteristic).
Applsci 11 10169 g005
Figure 6. LDA model selected for its analysis.
Applsci 11 10169 g006
Figure 7. Topic modeling representation.
Applsci 11 10169 g007
Figure 8. Evaluation of the optimal number of clusters.
Applsci 11 10169 g008
Figure 9. Sentiments and emotions associated with each topic.
Applsci 11 10169 g009
Table 1. Hashtags frequency and sentiment percentage.
HashtagsFrecuencySentiment (%)
PositiveNegativeNeutral
#uber220718.12%38.92%42.95%
#ubereats111416.78%42.72%40.48%
#customerservice23819.74%37.81%42.36%
#ubersucks2249.82%37.5%52.67%
#boycottuber21318.30%37.08%44.60%
#covid1919032.10%27.89%40%
#uberdriver17414.36%46.55%39.08%
#fraud16722.15%33.53%44.31%
#badcustomerservice15726.75%31.84%41.40%
#customerexperience14814.86%33.78%51.35%
Table 2. Topic models evaluation for T = 7 topics.
Topic Modeling Evaluation
Evaluation MetricsNMFLDALSI
C_V0.48840.49020.3820
UMass−2.5915−2.727−2.2890
UCI0.16410.14170.0039
NPMI0.036290.031750.00496
Topic Diversity0.68570.81420.3714
Table 3. Description of the seven latent topics from the dataset with their most frequent words using LDA topic modeling.
Topic NameWordcloudTopic Description
Uber account/Uber app Applsci 11 10169 i001
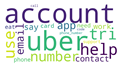
Customers reporting issues when logging into Uber app or validating their accounts.
Uber drivers Applsci 11 10169 i002
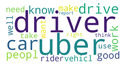
Customers reporting issues or giving their opinion about Uber drivers. This topic also includes Uber drivers asking for support about their licences and regulation.
Money and payments Applsci 11 10169 i003
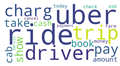
Users contacting with Uber Support platform due to money issues and wrong payments on their accounts.
Uber Eats Applsci 11 10169 i004
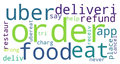
Clients contacting with Uber Support to resolve issues related with Uber Eats platform.
Opinions about Customer Service Applsci 11 10169 i005
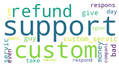
Tweets sharing the experience about contacting Customer Service or asking for additional support or refunds.
Time and cancellation Applsci 11 10169 i006
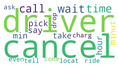
Time related issues, including cancellation of the trip by the driver at the last minute and longer than expected waiting time to the driver to arrive.
Contact with Uber Support Applsci 11 10169 i007
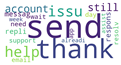
Clients or drivers contacting directly with Uber Support to provide alternative ways of contact (email, telephone, direct message...) or answering previous conversations.
Table 4. Predominant component of each cluster centroid and tweet distribution through the topics.
Topic NamePredominant ComponentNo. Tweets (%)
KmeansHybridized GAKmeansHybridized GA
Uber account
/Uber app
0.59220.593115.21%15.22%
Contact
with Uber
Support
0.63410.634820.93%20.94%
Time and
cancellation
0.52100.522610.23%10.23%
Opinions
about customer
service
0.57770.578717.19%17.20%
Uber Eats0.57170.573812.35%12.33%
Money and
payments
0.52850.531710.50%10.47%
Uber drivers0.50400.504513.59%13.61%
Table 5. Evaluation of K-means, Genetic Algorithm, and hybridized GA for K = 7 clusters.
AlgorithmsK-MeansGAHybridized GA
Fitness0.082620.085760.08262
Publisher’s Note: MDPI stays neutral with regard to jurisdictional claims in published maps and institutional affiliations.

