1. Introduction
As the use of augmented reality (AR) and virtual reality (VR) becomes more ubiquitous, it will become important to understand how its long-term and consistent use impacts users on several different facets so that user interface (UI) designers can better mitigate the resulting issues and tune UI designs to increase productivity whilst decreasing concerns related to health and safety. In a similar vein, early AR and VR systems required users to be somewhat immobile, tethered, or confined to small rooms but, as technology improved (and continues to improve), users are afforded greater movement capabilities unbridled by the technology constraints of past devices. As these technology constraints decrease, however, designers will need to understand how unrestricted movement in these virtual spaces may impact users. Additionally, the technological improvements have also afforded novel interaction techniques that, for instance, require the user to rotate their head to interact with the AR holograms [
1]. While these novel interaction methods offer exciting possibilities, little information is available on how these techniques may affect users biomechanically when wearing the device for long periods of time. As AR and VR inhabit a more functional and readily used space, measurement tools will need to be developed to determine how these tools affect users holistically across different modalities. In this paper, we propose jerk as a candidate metric for understanding how movement in virtual and mixed-reality spaces may impact users and for developing best practices for their use in the novel work and play spaces they may be asked to inhabit as their use becomes more commonplace.
2. Jerk
2.1. Jerk Defined
As people or objects are exposed to sudden changes in motion, extreme biomechanical forces and effects can be applied that lead to undesirable outcomes. While some movement in a system can be necessary, it is often good practice to reduce extraneous movements that can lead to overexertion, injury, or performance decrements. These human factors can even be further exacerbated by long working shifts or mental fatigue [
2].
For objects in motion, their movements can be quantified in several ways. One way to quantify said movement is to measure their position relative to time. The most often used metrics of these data are velocity, acceleration, and jerk, which are, respectively, the first, second, and third derivatives of the position vector with time. Whenever an object moves, it experiences velocity and, when that velocity changes, it experiences acceleration that humans can feel [
3]. When that acceleration changes over time, we experience a change in movement that is called jerk, which is sometimes referred to as jolt [
3].
While jerk is typically referred to as a translational motion, jerk can also be described and calculated in terms of rotational motion. In the case of angular jerk, the measurement is simply derived from the angular acceleration over time instead of the longitudinal acceleration over time. With angular jerk, rotational accelerations around an axis can be measured to then derive the associated angular jerk around that axis. Combined with the three-degrees of freedom rotational tracking afforded by inertial measurement units (IMU) and optical tracking systems associated with most AR and VR head-worn displays (HWDs), researchers can obtain the magnitude of angular jerk a user experiences by using the hardware already located on widely available HWDs [
4].
The human vestibular system is the main processor for the sensation of jerk. This organ is made up of the semicircular canals, which encodes rotational accelerations, and the otoliths, which send information about linear accelerations to the central nervous system [
5]. Together, the non-linear interactions between these two sub-systems in the vestibular organ afford the sensing of inertial forces applied to the body [
5]. The sensing of these inertial forces is thus crucial to the sensation and perception of jerk and movement intensities in humans [
6].
2.2. Design Issues Involving Jerk
An abundance of jerk in a human-operated system can lead to undesirable performance outcomes due to several physiological and ergonomic human factors. In many physical activities, jerky movements can lead to quickened levels of exhaustion, increased risk of injury, and a decline in performance [
2]. Across many disparate fields, designers aim to decrease jerk to limit the negative effects associated with its excesses. These design changes may take the form of springs or other force-absorbing materials that limit jerk by slowing the acceleration or deceleration of objects to make their accelerations and decelerations smoother. While designers in the virtual space cannot use physical features like springs to decrease jerk, they may be able to limit jerk by designing the environment in a way that slows down or truncates necessary user movement.
When designing user interfaces in AR and VR spaces, designers often use visual cues to draw users’ attention to specific areas or objects of a virtual world (in VR) or real-world object (in AR) [
7]. When designed properly, users’ attention can be directed without overworking the user. However, when cues are placed far apart, the user’s attention and vision may be drawn to cues in disparate areas of the scene, requiring the user to make quick head and neck movements to move to the desired area. In these situations where the user interface (coupled with task demands) requires large movements in a short amount of time, it would be important for designers and researchers to know if their UI designs will require operators to make these sorts of exaggerated movements that may lead to excessive jerk, and thus possible fatigue and performance decrements.
2.3. Potential Uses of Jerk in AR and VR
Various methods for quantifying movements in AR and VR have been used in the past for various research purposes (e.g., orientation and speed). In addition, these methods have been used with other measures such as pupil dilatation or eye tracking to correlate body-centric measures with physical measures to quantify and provide proxy measures of mental and physical workload. One example of the use of these proxy measures would be the use of pupil dilation or galvanic skin response with adaptive automation to measure workload in real time in order to adapt the user interface to the user’s needs and capabilities [
8,
9]. One issue with these measures, however, is that they require additional hardware to obtain the data along with more computing power to analyze the resulting data. While the analysis of jerk would require additional computing, the processing requirements are low and the there is no additional hardware needed, as the necessary components are found on nearly all HWDs.
With these facets, jerk could then potentially be used in adaptive user interfaces to change the level of jerk required by the system if the user begins to experience too much cumulative jerk. This example adaptive user interface could take the form of a system that truncates the usable interface space when users experience some set threshold of cumulative jerk so that users may move less and with less intensity to interact with the desired elements of the interface. Additionally, the interface could alert users when they experience an excessive jerk dose so that users can change their job role, or behavior, to avoid a potential injury. When these adaptive user interfaces are used in concert with other measures, jerk may offer a useful and effective way to reduce physical workload dynamically based on user movements. Beyond reducing workload, jerk can also be a useful measure of expertise as jerky movements are often correlated with novice abilities [
10]. Thus, should this attribute hold true for virtual- and mixed reality spaces as well, jerk may be a useful tool for measuring expertise and performance in sub-domains within VR and AR, which could further help develop targeted training programs that use AR and VR devices.
2.4. Contribution of the Current Research
As previously mentioned, there are many studies that use jerk as a way of quantifying the impact of forces placed on humans [
10,
11], but no studies to our knowledge have done so in VR/AR nor used angular jerk as the measured variable. While linear jerk is certainly useful, its application in VR is currently limited as users are often limited in their gross physical movements due to tethers or other hardware and space constraints. Additionally, the IMUs found on many HWDs are much better at rotational tracking than translational tracking, so the use of angular jerk may be better suited for the AR and VR domains that use these tracking systems [
4].
While techniques for measuring jerk exist in many fields (e.g., manufacturing and aerospace), we see an additional use case in AR and VR that will allow designers to measure jerk in situ and in real time to determine how the biomechanical forces placed on the user may impact their physical and mental workload during VR/AR-supported tasks. By analyzing this angular jerk in real time and using adaptive user interfaces, designers can adapt the task and environment to fit the user’s current capabilities. This analysis method will become more important as AR/VR is increasingly being used in other domains that require physical exertion in which the additional weight of a HWD could be problematic.
In this paper, we present an initial user study in which orientation-independent angular jerk was measured along with our analysis method so that future AR and VR researchers can use the process outlined in this paper to conduct user studies using angular jerk and to facilitate product design and research that uses jerk as an analysis technique.
3. Related Works
3.1. Similar Testing Methods in AR and VR
While we were unable to find use cases that used the same analysis methods as prescribed in this work, we were able to find adjacent methods that may align tangentially with our work. In one such work, the authors used steering entropy, defined as “the amount of deviation between an observed measurement and an expected value,” to measure in situ performance in a head-worn AR display [
12]. This metric, like jerk, can also be measured with the onboard sensor suite found on most HWDs. While steering entropy is distinctly different from jerk, it represents a similar phenomenon of erratic user movement in the virtual space that can be used to quantify user movement data and performance. While steering entropy is a useful measure, jerk has a more comprehensive research base in adjacent domains, so it was chosen as the metric used in this study. Separate from jerk, other forms of head tracking in AR and VR have been used to study its effect on levels of presence and motion sickness in users while in virtual environments [
13]. These component usability measures, when used together with novel measurement tools like jerk, may help better elucidate and quantify user behavior in virtual spaces.
3.2. Uses of Jerk in Non-AR/VR Domains
In biomechanics, jerk has been used as a measure to detect changes in muscle fatigue as a result of physical exertion [
2,
14]. In these use cases, jerk is often used to obtain a cumulative measure of exhaustion that can then be used to predict current performance on physical and mental tasks. Similar methods can also be used to determine current levels of fatigue with the caveat that improper sensor location can lead to spurious data that can lead to false conclusions [
11]. With these measures in place, the task can be changed (e.g., removing a heavy lifting task) to adapt to current user abilities. Other work involving jerk has been used to determine levels of fatigue in construction workers [
15], skill level of surgeons [
10], and to identify the aggressiveness of drivers in a naturalistic setting [
16]. It should be noted though that these studies typically use purpose-built IMUs to analyze the movement patterns and thus would require workers to wear special equipment to obtain these jerk analytics. While methods of jerk calculation using mobile phones exist [
17], these methods rely on the quality of the mobile phone, which can differ on the model used and the quality of the IMU.
4. Jerk Analysis and Computation
To calculate jerk magnitude, we used the recorded quaternion data from the Unity game engine, which describes the user’s orientation, to furnish a local (viewing) reference frame relative to a global (inertial) reference frame. The angular jerk values may then be obtained following several successions of numerical differentiation.
Most directly, the magnitude of angular jerk is
where
is the Euclidean norm and
is the user’s angular velocity. This quantity is expressible in terms of the measured unit quaternion, written
where
is the scalar part, as
The overdot notation used in (1) and (2) represents a derivative with respect to time; these derivatives are estimated numerically via forward finite difference. The angular jerk’s magnitude is lastly quantified with a single number for each user by computing its root mean square via numerical integration over the data set. While our method specifically works with quaternions, the listed method can also be used with Euler angles by first converting the raw Euler angles to quaternions and then using our prescribed method and code. In this way, motion smoothness and data quality are ensured and retained while taking the derivatives. To view the code used in this work, please visit:
https://github.com/KTanous/Virtual-Drone-Analysis [accessed on 21 September 2021].
5. User Study
The purpose of the current user study is to determine what performance decrements may be correlated with high levels of jerk in AR and VR systems and how certain UI elements may affect a user’s movements in these virtual environments. To test our algorithms and method, we developed a testbed that used virtual reality to simulate a drone-based augmented reality video pass-through device (including simulating candidate AR user interface elements, or annotations) that would be used in the real world to scan civil infrastructure elements for defects (e.g., concrete deteriorations). In addition, this testbed allowed us to determine how imperfect computer vision (CV) cuing systems impact performance and user movements when the cuing aid is unable to accurately and reliably cue each target.
The simulated drone in the testbed followed a set flight path, but allowed participants to control the orientation of the simulated gimbled camera by moving their head with the worn VR HWD. As participants went through the simulation, they were asked to find and select targets using ray casting via a Vive Pro hand controller. For this work, we use the term targets to refer to bridge defects, which we modelled to be visually similar to those seen on real world bridges, but which still allowed us to modify them to adjust their detectability. The targets appeared randomly on the bridge’s surface and required the participant to move their head to see all the targets as they passed through the different sections of the simulated bridge.
In this study, we aimed to extend previous jerk research into AR and VR use cases and determine what effect, if any, excessive jerk may have on performance. In this work, we posit the following hypotheses:
Hypothesis 1 (H1). Jerk will be highest in trials without augmentations as users must scan all sections of the bridge without relying on the AR cues to direct their attention.
Hypothesis 2 (H2). Jerk will be highest in trials with the highest saliency as the targets in those conditions are the easiest to see and will better draw the attention of the user.
Hypothesis 3 (H3). Signal detection performance will be significantly correlated with jerk with percentage of hits having a positive correlation and percentage of misses and false alarms having negative correlations.
5.1. Experimental Design
We recruited participants (
n = 28,
μ 27 years old, 7 Females) with a volunteer sampling method and were assigned to experimental conditions via a Latin square design where participants saw all three levels of target saliency and all four AR cue types. Thus, our study employed a two (simulated CV: low and high) × four (AR cue type: none, bounding box, corner-bound box, and outline–see
Figure 1) × three (target saliency: low (0.12), medium (0.17), and high (0.22)) mixed design with AR cue type and target saliency as within-subjects variables and CV accuracy as a between-subjects variable. With this design, participants went through 12 total trials lasting two minutes each and experienced each possible target saliency and AR cue type permutation pair.
5.2. Procedure
During the experimental portion of the study, participants sat in an office type chair that allowed them to spin around the vertical axis inside a room that measured 11.6 ft. by 12 ft. As participants were in this seated position, we only analyzed angular jerk, but linear jerk could also be calculated using the same hardware as in the current study. As noted earlier though, IMUs found in most HWDs may not be well-suited for such translational measurement [
4]. Before beginning the experiment, participants were given a brief tutorial on the use of the HWD, and associated Vive Pro hand controllers used to select targets. Participants were then shown what the targets would look like before completing a practice trial that used the same bridge model and drone path as the experimental trials, but had targets with lower transparency values of 0.4 to make them easier to see. In all trials, participants were asked to detect as many targets as possible on the bridge and select them using the provided hand controllers. After participants indicated that they understood what the targets looked like and what their task was for the experiment, the experimental trials began.
5.3. Testbed Environment
We modeled and rendered the virtual bridge in the Unity game engine using SteamVR tracking (version 2 lighthouses) and presented the scene to participants via a wireless HTC Vive Pro headset with a 90 Hz display and 1440 × 1600 pixels per eye. We used an Alienware Aurora R6 running Windows 10 with an Intel Core i7-7700 CPU and a NVIDIA GeForce GTX 1080 Ti graphics card to power the Vive Pro HWD. Concentrated areas of dots that were a different color from the surrounding bridge area delineated the target areas (
Figure 1). Each target used the same dot pattern, but was rotated, or flipped randomly across the bridge surfaces so that the targets would not look the same, but would still have the same general features. Target saliency was manipulated by adjusting the transparency values of the target area. We used transparency values of 0.22 for the high saliency/easy condition, 0.17 for the medium saliency condition, and 0.12 for the low saliency/hard condition. Transparency values were obtained from a pilot study in which we adjusted transparency values until participants got an average of 80% correct for the easy condition, 60% correct for the medium condition, and 30% correct for the hard condition. No AR cues were present in this pilot study.
Before each trial, targets were placed randomly on the bridge surface with a maximum of three targets per plane to prevent an excess of targets on any individual bridge section. Additionally, governing the maximum number of targets per plane limits user misses due to a physical inability to accurately select the targets even if they could visually identify them all.
The cues used in the study were a corner-bound box, bounding box, and an outline of the dotted target area. We used a no-augmentation condition as a control. All augmentations were red (RGB: 255, 0, 0). See
Figure 1 for a visual representation of the different target saliency levels and AR cue types. Cuing accuracy was a two-level, between-subjects variable in which we randomly assigned participants to either the high accuracy cuing aid or low accuracy aid condition. In the high accuracy group, 80% of the targets were hits (the aid correctly cued the target with the red hologram), 10% were false alarms (the aid cued a non-target area), and 10% were misses (the aid did not cue the target). In the low accuracy group, 40% were hits, 30% were false alarms, and 30% were misses. It is worth noting that current methods for defect detection in infrastructure inspections have achieved accuracy rates of 89.95% [
18] and 85.33% [
19], but the data sets used in these studies came from still images and, given the use case of the present study, a slightly more conservative accuracy rate of 80% was chosen for the highly accurate condition to compensate for the noisy, and moving, environment faced by the drone and the operator. Additionally, similar signal detection studies used comparable cuing accuracy rates [
20].
We used a virtual camera in Unity to simulate the drone-mounted, gimbaled camera and in turn, a video pass-through AR user experience (
Figure 2). The drone followed a fixed flight path—see
Figure 1 for a graphical representation of the flight path delineated with white arrows—that mimicked a typical flight path a drone might take as it captured video of a bridge surface for an inspection. As such, participants could not control the position or speed of the drone, but could control the orientation of the camera by scanning with their head. The linear movement of the drone and camera followed a winding pattern that weaved in between each bridge section and gave the participant a view of every bridge surface plane that could have targets on it. While our path did not mimic the exact flight path of a real drone in terms of a real drone’s non-rigid turning behavior and flight dynamics, we chose to rigidize the flight path taken to help better isolate the head movements of the user and decrease the effect of reactionary and compensatory user movements that may be caused by unpredictable and random movements of the simulated drone.
User selections were categorized as hits when users correctly selected an actual target, as false alarms when users selected an area that did not contain a target, and as misses when users did not select an area that contained a target. Movement speed and flightpath were the same in every condition and the total flight time of each trial was approximately two minutes. With 12 total trials excluding the practice run, the total signal detection task time was 24 min. Participants, however, were given time in between trials to complete survey batteries so the total experiment lasted for roughly one hour.
6. Results
We used the Winsorize technique to transform five total outliers when a data point (a single participant’s measure over one trial) was greater than 1.5 interquartile ranges from the upper, or lower, limit of the 25th percentile. Alpha levels were set to 0.05 for all statistical tests.
6.1. Augmentation Types and Saliency
To examine hypothesis one, we used a RMANOVA with augmentation type and saliency as within-subjects variables and computer vision accuracy as a between-subjects variable to determine their effects on jerk. Tests of sphericity were not violated for the augmentation type (p = 0.45) variable and augmentation/saliency interaction (p = 0.38), but were violated for the saliency variable (p = 0.02). Huynh–Feldt corrections were used when sphericity could not be assumed.
The main effects were present for augmentation type [
F (3,78) = 4.10,
p = 0.009,
η2partial = 0.136], but did not reach significance for saliency type (
p = 0.987), nor did the augmentation–saliency interaction (
p = 0.876), or the interaction of augmentation–saliency–CV accuracy interaction (
p = 0.406). As shown in
Figure 3a, post hoc comparisons showed that a decrease in jerk magnitude was significantly associated with the use of augmentations with pairwise comparisons showing significant differences between no augmentations (
M = 8.20 deg/s
3) and the bounding box (
p = 0.003;
M = 7.41 deg/s
3), corner-bound augmentation (
p = 0.002;
M = 7.33 deg/s
3), but not for the outline augmentation (
M = 7.68 deg/
3) and no augmentation pair (
p = 0.52). Pairwise comparisons between the three augmentation types themselves did not reach statistical significance as all
p values were greater than 0.5. As shown in
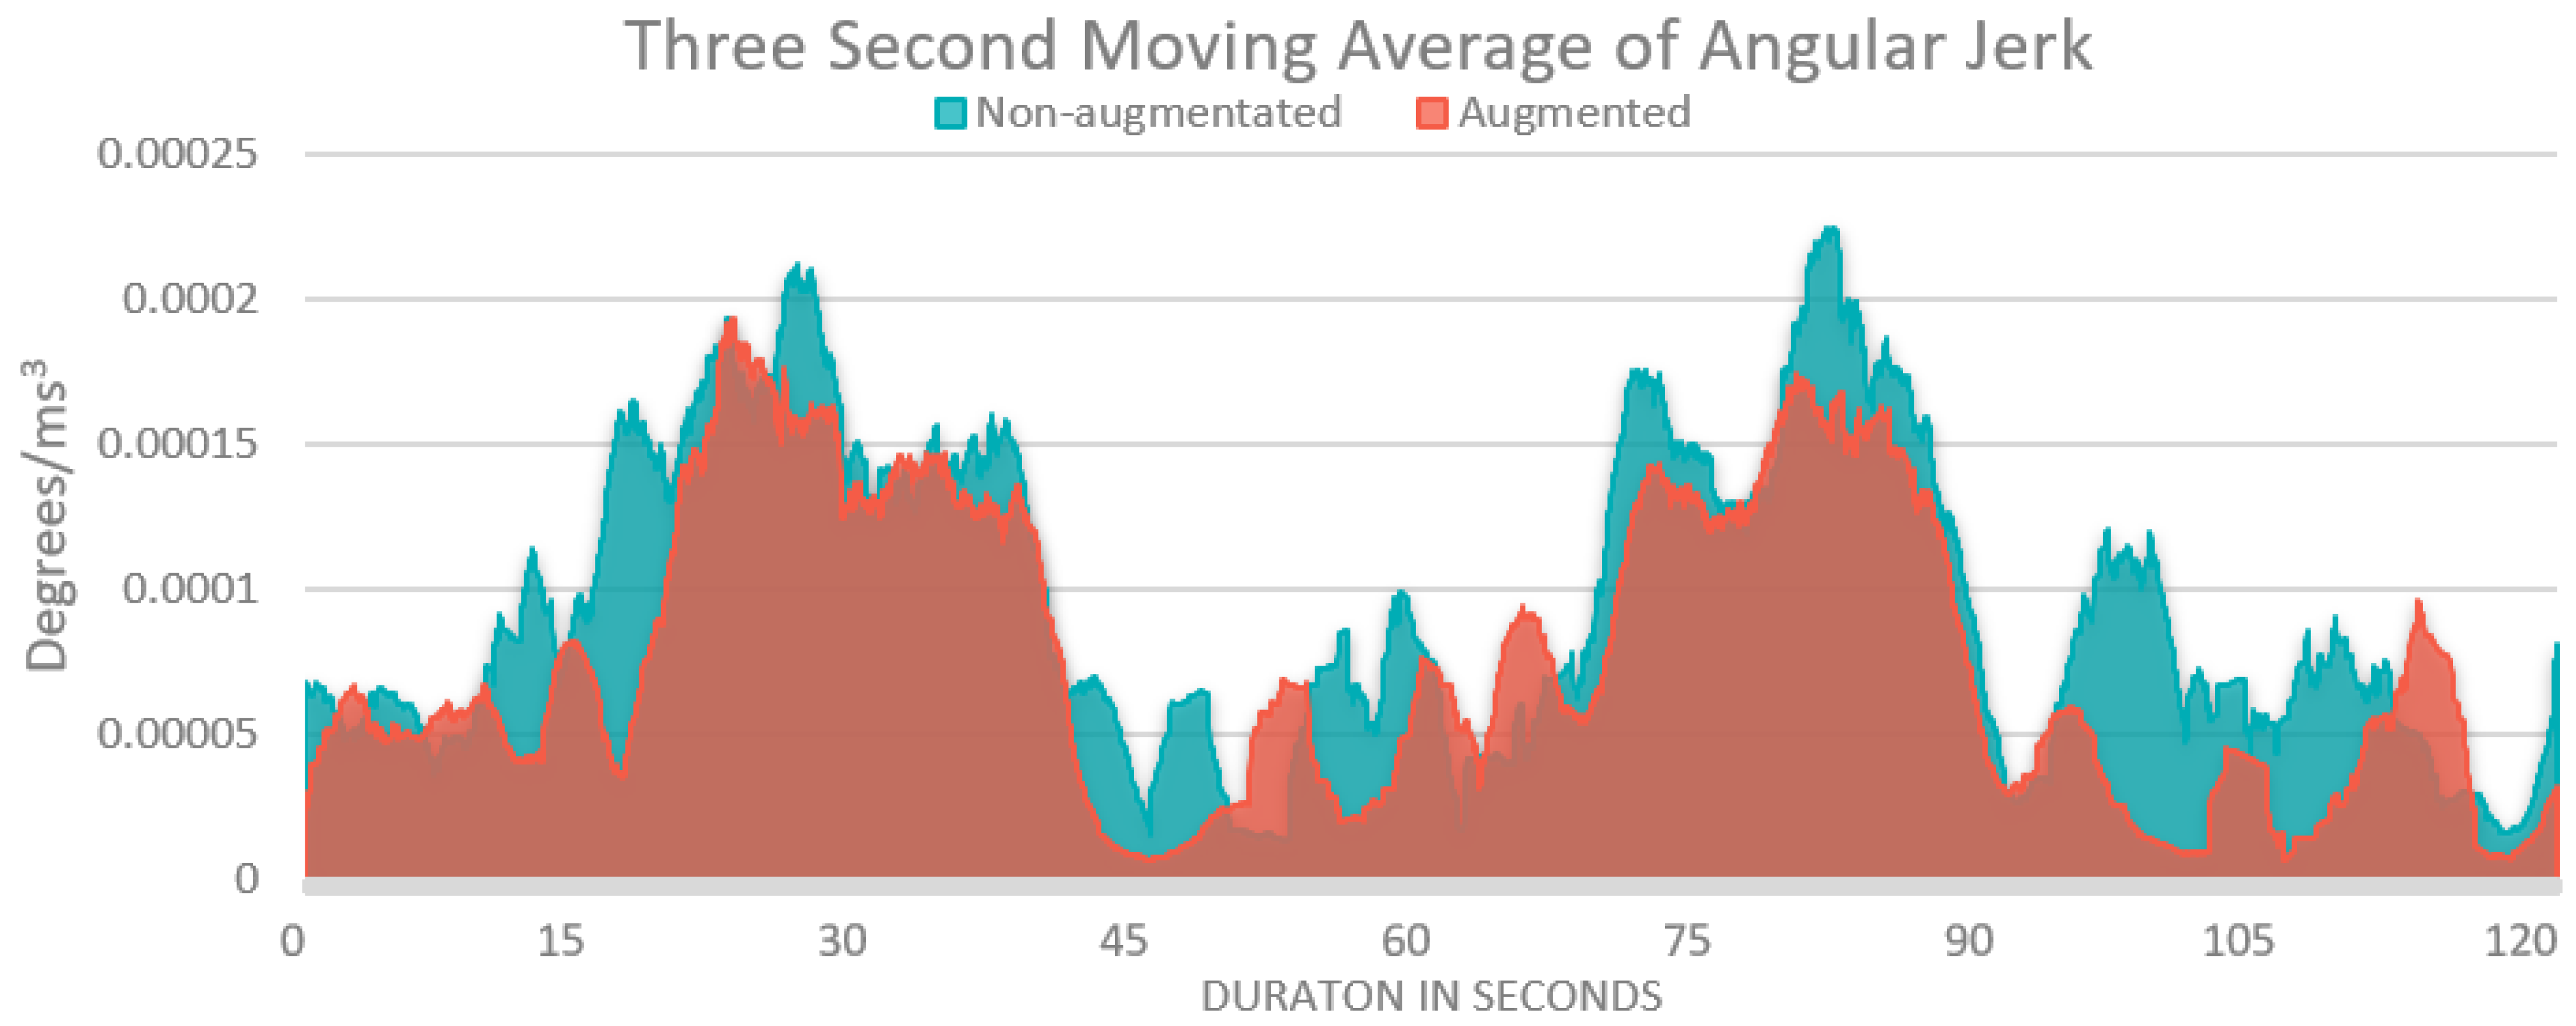
Figure 4, the three second moving average graph of angular jerk, gross levels follow similar trends and patterns in both the augmentation and non-augmented conditions, but with greater intensity and more spikes in the non-augmented conditions.
Pairwise comparisons between levels of saliency as well did not reach significance with all
p values greater than 0.80. As seen in
Figure 3b, the jerk a participant experienced varied significantly based on whether augmented cues were present in the given trial, with higher levels of jerk seen in the non-augmented conditions. These results support hypothesis one, that jerk will be highest in those trials without augmented cuing, but did not support hypothesis two, that jerk would be highest in those trials with higher levels of saliency.
6.2. Signal Detection
To determine what effect the magnitude of angular jerk has on signal detection, we performed a Pearson’s correlation analysis correlating jerk magnitude with a user’s hit percentage, miss percentage, and the total number of false alarms per trial. Correlations of the total number of targets per trial are also presented to rule out spurious correlations simply due to the total number of targets. As shown in
Table 1, some individual correlations obtained statistical significance, but the majority did not reach set levels of significance. Thus, with so few correlations reaching significance, hypothesis three was not supported.
7. Discussion
While hypothesis one, stating that jerk would be higher in trials without AR augmentations, was supported, the other hypotheses received little to no support. The lack of support for hypothesis three is contrary to the results found in other domains but, given that the present experiment used a signal detection task where it was difficult to see the targets, participants may not have experienced levels of jerk that would significantly decrease performance as they were simply unable to see the targets reliably. This inability may partly explain why we did not see statistically significant results in terms of performance, while other studies in different domains have [
2,
10,
11]. The other reason for the lack of significance is likely due to the raw data collected via Unity. During data collection, the default values for the number of digits saved (to the tenths place) for the quaternions were used when, to get reliable angular jerk data, finer resolution data (at least five digits) were needed. This lack of resolution in the raw data led to low-quality angular jerk data. However, while this lack of resolution may have led to a lack of power in determining correlational differences in signal detection performance, results from the augmentation type analysis and visual analysis of the angular jerk plots indicate that the resolution was at least fine-grained enough to determine that significant differences do exist between user interface types and that angular jerk is an adequate metric for showing these differences.
Even though the results from the present study did not universally affirm previous research from other domains, we believe that jerk is still a useful measure for AR and VR designers due to the well-studied use of jerk in other domains [
2,
10,
11,
12] and its ease of calculation given the already available hardware on most HWDs and code supplied with this work. While more benchmarking work is certainly needed to develop best practices for VR and AR, the work presented substantially facilitates the use of angular jerk as a metric for both researchers and practitioners as well as provides lessons learned that may be useful to those individuals who conduct similar studies in the future.
Still to be determined though is what levels of angular jerk in AR and VR reach practical significance in terms of performance decrements and usability as well as the directionality of those interactions. While results indicate a significant difference in angular jerk between those trials with and without augmentations, the present study is unable to ascertain whether these differences rise to the level of practical significance where users would be significantly impaired by the increase in jerk. Additionally, in order to fully understand the practical significance and impact of designs on users, these studies will need to take into account the weight and form factor of the headset as these factors are inextricably tied to jerk in determining the overall impact that the user experiences.
Additionally, of note are the many ways in which to present the data gathered. In the present study, we displayed the data presented in
Figure 4 as smoothed via a three-second moving average to show global patterns during the experiment. However, the raw data plots could also be shown if the researcher wanted instead to display the maximum and minimum values throughout the trial to. Presenting the data in this way could help researchers and designers understand where weak points are in their design that may require excessive movements from the user.
8. Limitations and Future Work
The primary limitations of this paper are that the resolution in which the quaternions were saved was not in high enough resolution to afford the calculation of jerk to a precise enough extent and that the sample size of 28 may not afford substantial extrapolative power. However, we believe that the work presented herein is valuable in that it both provides researchers with a roadmap and lessons learned for the calculation of angular jerk in AR/VR systems while also providing background literature that supports its application in these domains and providing examples of possible use cases.
Another methodological limitation of the study was the short exposure time of two minutes per trial and the overall elapsed time the user spends wearing the HWD. These short exposure times may not have been enough time to elicit the performance and fatigue decrements seen in prior research [
2,
10] given that other studies have used longer exposure times with greater required levels of physical exertion [
14]. Additionally, the narrow structure of the bridge and the random placement of the targets may have allowed users to see the entirety of the structure without needing to move their head at levels required to experience the negative effects of prolonged jerk exposure. Researchers wanting to conduct studies in this area should consider designing studies in a way that emphasizes distance between targets while making sure that the user is under significant time pressure to complete the task so that they are forced to make more exaggerated movements throughout the task. Doing so may better elucidate the potential effects of jerk in AR/VR systems relative to the signal detection task used in this work.
Given the limitations of the present study, future work in this space should determine what levels of jerk and what cumulative exposure amounts elicit the greatest amount of physical fatigue and performance decrements in users so as to better understand how user movements while using AR and VR systems influence overall functioning and performance. Understanding these exposure factors will not only give designers and researchers better tools to understand how jerk in AR and VR interfaces can harm users, but can also help interface designers come up with new design paradigms that limit said exposures using methods like adaptive user interfaces.
While much of the previous research using jerk has focused on the precipitous performance decrements associated with excessive loads caused by jerk, the work presented herein was unable to do so to a similar extent due to the lack of fidelity with the recorded quaternions and short exposure time. Instead, we focused mainly on providing researchers with an example application and calculation of the angular jerk metric so that researchers may apply this method to their experiments and develop targeted research designs that can better determine the long-term effects of excessive jerk in AR and VR.
Critical to the widespread adoption and success of any product or device is in understanding how users interact with and are affected by the design. Thus, as AR and VR use becomes more ubiquitous and the technology underpinning these devices advances, it will be necessary to measure the effectiveness of these new technologies and use cases to understand how their design impacts users so that only the most appropriate designs are chosen to solve the novel challenges they will be designed to alleviate. While many measurement tools currently exist that aim to measure usability in its different forms, few are designed to measure the movement requirements of a given candidate HWD. Given that excessive jerk is a known issue in other similar human-technology systems, we hope that the work described herein will be used as a first step in that direction of creating holistic usability metrics for AR/VR interfaces and environments that can create new measurement paradigms that better explain and document how humans interact with augmented and virtual environments.
Author Contributions
Conceptualization, J.V.D. and J.L.G.; methodology, J.V.D. and J.L.G.; software, K.T. and M.W.; formal analysis—statistical analysis, J.V.D.; formal analysis—jerk formulation, M.W. and K.T.; investigation, J.V.D.; resources, J.L.G.; data curation, J.V.D., K.T. and M.W.; writing—original draft preparation, J.V.D. and M.W.; writing—review and editing, J.V.D. and J.L.G.; supervision, J.V.D. and J.L.G.; project administration, J.L.G.; funding acquisition, J.L.G. All authors have read and agreed to the published version of the manuscript.
Funding
This research was funded by The National Science Foundation, grant number 1840044.
Institutional Review Board Statement
The study was conducted according to the guidelines of the Declaration of Helsinki and approved by the Institutional Review Board of Virginia Tech (protocol code: 19-085 and date of approval: 1 May 2019).
Informed Consent Statement
Informed consent was obtained from all subjects involved in the study.
Data Availability Statement
The data presented in this study are available on request from the corresponding author. The data are not publicly available due to potentially identifiable data points and Institutional Review Board policies.
Conflicts of Interest
The authors declare no conflict of interest, and the funder had no role in the design of the study; in the collection, analyses, or interpretation of data; in the writing of the manuscript, or in the decision to publish the results.
References
- Lu, F.; Bowman, D.A. Evaluating the potential of glanceable AR interfaces for authentic everyday uses. In Proceedings of the 2021 IEEE Virtual Reality and 3D User Interfaces (VR), VR 2021, Lisbon, Portugal, 27 March 2021; pp. 768–777. [Google Scholar] [CrossRef]
- Zhang, L.; Diraneyya, M.M.; Ryu, J.H.; Haas, C.T.; Abdel-Rahman, E.M. Jerk as an Indicator of Physical Exertion and Fatigue. Autom. Constr. 2019, 104, 120–128. [Google Scholar] [CrossRef]
- Eager, D.; Pendrill, A.-M.; Reistad, N. Beyond Velocity and Acceleration: Jerk, Snap and Higher Derivatives. Eur. J. Phys. 2016, 37, 1–11. [Google Scholar] [CrossRef]
- Melendez-Calderon, A.; Shirota, C.; Balasubramanian, S. Estimating Movement Smoothness From Inertial Measurement Units. Front. Bioeng. Biotechnol. 2021, 8, 1–16. [Google Scholar] [CrossRef] [PubMed]
- Angelaki, D.E.; Cullen, K.E. Vestibular System: The Many Facets of a Multimodal Sense. Annu. Rev. Neurosci. 2008, 31, 125–150. [Google Scholar] [CrossRef] [PubMed] [Green Version]
- Rabbitt, R.D. Semicircular canal biomechanics in health and disease. J. Neurophysiol. 2019, 121, 732–755. [Google Scholar] [CrossRef] [PubMed] [Green Version]
- Van Dam, J.; Krasner, A.; Gabbard, J.L. Drone-based Augmented Reality Platform for Bridge Inspection: Effect of AR Cue Design on Visual Search Tasks. In Proceedings of the 2020 IEEE Conference on Virtual Reality and 3D User Interfaces Abstracts and Workshops (VRW), Atlanta, GA, USA, 22–26 March 2020; pp. 201–204. [Google Scholar] [CrossRef]
- Othman, N.; Romli, F.I. Mental Workload Evaluation of Pilots Using Pupil Dilation. Int. Rev. Aerosp. Eng. 2016, 9. [Google Scholar] [CrossRef]
- Joseph, A.W.; Murugesh, R. Potential Eye Tracking Metrics and Indicators to Measure Cognitive Load in Human-Computer Interaction Research. J. Sci. Res. 2020, 64, 168–175. [Google Scholar] [CrossRef]
- Kholinne, E.; Gandhi, M.J.; Adikrishna, A.; Hong, H.; Kim, H.; Hong, J.; Jeon, I.-H. The Dimensionless Squared Jerk: An Objective Parameter That Improves Assessment of Hand Motion Analysis during Simulated Shoulder Arthroscopy. Biomed. Res. Int. 2018. [Google Scholar] [CrossRef] [PubMed] [Green Version]
- Zhang, L.; Diraneyya, M.M.; Ryu, J.; Haas, C.T.; Abdel-Rahman, E. Assessment of Jerk As a Method of Physical Fatigue Detection. In Proceedings of the ASME 2018 International Design Engineering Technical Conferences and Computers and Information in Engineering Conference, Quebec City, QC, Canada, 26–29 August 2018; pp. 1–6. [Google Scholar]
- Sprehn, K.A.; Endsley, T.C.; Ryan, K.J. Utilizing Steering Entropy as a Measure of Performance in Head-mounted Augmented Reality. Proc. Hum. Factors Ergon. Soc. 2019 Annu. Meet. 2019, 63, 63–67. [Google Scholar] [CrossRef]
- Wu, T.L.Y.; Gomes, A.; Fernandes, K.; Wang, D. The Effect of Head Tracking on the Degree of Presence in Virtual Reality. Int. J. Hum. Comput. Interact. 2019, 35, 1569–1577. [Google Scholar] [CrossRef]
- Sedighi Maman, Z.; Alamdar Yazdi, M.A.; Cavuoto, L.A.; Megahed, F.M. A Data-driven Approach to Modeling Physical Fatigue in the Workplace Using Wearable Sensors. Appl. Ergon. 2017, 65, 515–529. [Google Scholar] [CrossRef] [PubMed]
- Zhang, L.; Diraneyya, M.M.; Ryu, J.; Haas, C.T.; Abdel-Rahman, E. Automated monitoring of physical fatigue using jerk. In Proceedings of the 36th International Symposium on Automation and Robotics in Construction (ISARC), Banff, AB, Canada, 21–24 May 2019; pp. 989–997. [Google Scholar] [CrossRef] [Green Version]
- Feng, F.; Bao, S.; Sayer, J.R.; Flannagan, C.; Manser, M.; Wunderlich, R. Can vehicle longitudinal jerk be used to identify aggressive drivers? An examination using naturalistic driving data. Accid. Anal. Prev. 2017, 104, 125–136. [Google Scholar] [CrossRef] [PubMed]
- Hämäläinen, W.; Järvinen, M.; Martiskainen, P.; Mononen, J. Jerk-based Feature Extraction for Robust Activity Recognition from Acceleration Data. In Proceedings of the 11th International Conference on Intelligent Systems Design and Applications, Cordoba, Spain, 22–24 November 2011; pp. 831–836. [Google Scholar] [CrossRef]
- Hoang, N.-D.; Nguyen, Q.-L. Metaheuristic Optimized Edge Detection for Recognition of Concrete Wall Cracks: A Comparative Study on the Performances of Roberts, Prewitt, Canny, and Sobel Algorithms. Adv. Civ. Eng. 2018, 2018, 1–16. [Google Scholar] [CrossRef] [Green Version]
- Hoang, N.-D. Image Processing-Based Recognition of Wall Defects Using Machine Learning Approaches and Steerable Filters. Comput. Intell. Neurosci. 2018, 2018, 1–18. [Google Scholar] [CrossRef] [PubMed] [Green Version]
- Lu, W.; Duh, B.L.H.; Feiner, S. Subtle Cueing for Visual Search in Augmented Reality. In Proceedings of the 2012 IEEE International Symposium on Mixed and Augmented Reality (ISMAR), Atlanta, GA, USA, 5–8 November 2012; pp. 161–166. [Google Scholar] [CrossRef]
Figure 1.
Simulated bridge environment with all saliency levels and augmentation types represented. The top left target is the low saliency target (0.12) with the bounding box augmentation, the bottom left target is the medium saliency target (0.17) with the corner-bound augmentation, the top right target is the high saliency target (0.22) with the outline type augmentation, and the bottom right target is the non-augmented, high saliency target. The white line denotes the movement the simulated drone made during each trial. Note that this graphic is for visual representation only and that during experimental trials, only one saliency type and one augmentation type would appear for each trial. © 2021 IEEE. Reprinted, with permission, from J. Van Dam, A. Krasner and J. L. Gabbard, “Drone-based Augmented Reality Platform for Bridge Inspection: Effect of AR Cue Design on Visual Search Tasks,” 2020 IEEE Conf. Virtual Real. 3D User Interfaces Abstr. Work., pp. 201–204, 2020, doi:10.1109/VRW50115.2020.00040.; J. Van Dam, A. Krasner, and J. L. Gabbard, “Augmented Reality for Infrastructure Inspection with Semi-autonomous Aerial Systems: An Examination of User Performance, Workload, and System Trust,” 2020 IEEE Conf. Virtual Real. 3D User Interfaces Abstr. Work., pp. 743–744, 2020, doi:10.1109/VRW50115.2020.00220.
![Applsci 11 10082 g001]()
Figure 2.
Simulated bridge environment as displayed to a participant during the experiment. The blue hemisphere in the upper left of the figure denotes an area where the participant selected and the black line in the bottom center of the shows the ray-casting marker, used to display where the user is pointing.
Figure 3.
Graph of jerk with augmentation type and saliency. Levels of jerk magnitude are shown on both graphs with the left graph (a) showing jerk levels for each augmentation type and the right graph (b) showing jerk levels in the different saliency conditions. Simulated computer vision accuracy groups (low, high, and combined) are show on of the left graph (a) and levels of augmentation saliency (low, medium, and high) are shown in the panels of the graph on the right (b). Error bars reflect the standard error of the mean.
Figure 4.
Angular jerk magnitude. Levels of angular jerk are shown for both an example AR cued condition as well as a trial when no cues were present. Jerk levels presented for both conditions represent one trial.
Figure 4.
Angular jerk magnitude. Levels of angular jerk are shown for both an example AR cued condition as well as a trial when no cues were present. Jerk levels presented for both conditions represent one trial.
Table 1.
Correlations for signal detection performance are presented with the high CV accuracy condition presented above and the low CV accuracy condition presented below. Bolded values indicate statistical significance at ≤0.05.
Table 1.
Correlations for signal detection performance are presented with the high CV accuracy condition presented above and the low CV accuracy condition presented below. Bolded values indicate statistical significance at ≤0.05.
High CV
Accuracy
|
No Augmentation
|
Bounding Box
|
Corner Bound
|
Outline
|
|---|
Low
(0.12) | Medium (0.17) | High
(0.22) | Low
(0.12) | Medium (0.17) | High
(0.22) | Low
(0.12) | Medium (0.17) | High
(0.22) | Low
(0.12) | Medium (0.17) | High
(0.22) |
|---|
|
Hit Percentage
| −0.460 | −0.581 | 0.159 | 0.298 | 0.140 | 0.249 | 0.057 | 0.193 | 0.424 | 0.145 | 0.244 | 0.182 |
|
Miss Percentage
| 0.421 | 0.581 | −0.159 | −0.338 | −0.050 | −0.145 | −0.160 | −0.240 | −0.362 | −0.268 | 0.000 | −0.178 |
|
False Alarms
| 0.128 | 0.559 | −0.133 | 0.005 | 0.282 | 0.232 | 0.411 | −0.343 | −0.189 | 0.564 | −0.251 | 0.175 |
|
Total Targets
| 0.147 | −0.058 | −0.021 | −0.052 | 0.229 | −0.312 | 0.147 | 0.016 | −0.074 | −0.101 | 0.342 | 0.206 |
Low CV
Accuracy
| No Augmentation | Bounding Box | Corner Bound | Outline |
Low
(0.12) | Medium (0.17) | High
(0.22) | Low
(0.12) | Medium (0.17) | High
(0.22) | Low
(0.12) | Medium (0.17) | High
(0.22) | Low
(0.12) | Medium (0.17) | High
(0.22) |
|
Hit Percentage
| 0.165 | 0.231 | 0.462 | −0.195 | 0.183 | 0.344 | −0.111 | −0.020 | 0.460 | 0.041 | 0.183 | 0.214 |
|
Miss Percentage
| −0.165 | −0.231 | −0.279 | 0.150 | −0.202 | −0.128 | −0.256 | 0.189 | −0.601 | 0.011 | −0.187 | −0.359 |
|
False Alarms
| −0.323 | 0.195 | 0.296 | −0.512 | −0.273 | 0.297 | −0.092 | 0.335 | −0.077 | −0.206 | −0.014 | −0.052 |
|
Total Targets
| −0.250 | −0.083 | −0.190 | −0.559 | −0.003 | −0.046 | −0.084 | −0.338 | −0.203 | −0.087 | −0.494 | 0.261 |
| Publisher’s Note: MDPI stays neutral with regard to jurisdictional claims in published maps and institutional affiliations. |
© 2021 by the authors. Licensee MDPI, Basel, Switzerland. This article is an open access article distributed under the terms and conditions of the Creative Commons Attribution (CC BY) license (https://creativecommons.org/licenses/by/4.0/).


