Abstract
With the arrival of 5G wireless communication systems, there has been increased interest in exploring higher frequency bands above 6 GHz, up to millimeter-wave frequencies. Radio wave propagation at these higher frequencies can suffer from substantial Doppler impairments. The linear dependency of Doppler shifts with carrier frequencies make them challenging to use in high-mobility 5G cellular scenarios. Therefore, the Doppler power spectrum (DPS) characteristics and radio channel coherence time (CT) of the received signals are of great importance for 5G wireless systems. In this way, this paper presents the effects of a narrow beam phased antenna array in reducing the DPS (due to user movement) and, simultaneously, increasing the coherence time (CT). Functional and complete descriptive assessments of beamwidths versus the DPS and CT, through different elements and geometries of the phased antenna array, are analyzed. Moreover, in terms of CT and the DPS, better performance on the 5G cellular scenarios was obtained.
1. Introduction
Radio 5G technology promises dramatic network speed improvements and super-fast connection times, defining new physical layer technologies based on beamforming, massive MIMO, and mmWave transmissions [1]. The use of millimeter-wave (mmWave) frequency for 5G communication systems is usually presented by the research community, but mmWave does have its challenges [2,3,4,5].
The 5G technology specifies new frequency bands below 6 GHz and extends into millimeter-wave (mmWave) frequencies where more contiguous bandwidth is available for sending a lot of data. While users will appreciate the increased bandwidth, it introduces challenges, e.g., link quality requirements at mmWave frequencies. Often, these impairments are not an issue at sub-6 GHz, but become more problematic at mmWave frequencies [6,7,8]. Common signal impairments impact baseband and RF designs with wider channel bandwidths expected at mmWave frequencies [9,10,11]. These impairments become more problematic at higher frequencies or with wider bandwidths. According to IMT 2020 specifications, below 1 GHz, there are multiple bands of interest in 600, 700, and 800 MHz to support the internet of things and other mobile services. On the other hand, bands between 1 and 6 GHz aim to increase coverage and capacity. Above 6 GHz will primarily support the need for ultra-high broadband use cases [12,13,14].
In wireless mobile communication, two fundamental parameters determine its operation: Doppler spread—or time-varying nature of the radio channel—which causes frequency dispersion, and multipath, which causes time dispersion and, therefore, its relationship to coherence time [15]. Doppler spread is more convenient to express in terms of power spectral density (PSD) in the Doppler spectrum (DS), resulting in the Doppler power spectrum (DPS), which characterizes this spectrum broadening caused by the time-varying nature of the wireless channel. In particular, 5G wireless mobile communications require reducing the DS due to user movement and increasing the coherence time (CT) simultaneously to achieve a better system performance when a 5G high-mobility user environment is required.
In the technical literature, different models describe the Doppler power spectrum (DPS), the most consulted and cited are the Clarke model [16], the Jakes model [17], the Gans Model [18], and the IEEE P802.11 model [19]; they all define the DPS, depending on the carrier frequency and the speed of the mobile user. To assess the influence of high gain antenna arrays over DPS models, in [20], the authors describe radio propagation’s statistical properties between a mobile terminal and a base station as a function of time, space, and frequency. In particular, a mathematical model that relates the DPS to the antenna gain when the main beam is focused along the perpendicular plane of the mobile terminal was conducted.
Theoretical results in [20] conclude that, for all mobile station movement directions, the DPS is reduced when the width of the radiation beam from the base station to the mobile user is narrower or more directive. Nevertheless, the numerical analysis and results focus on highly narrow beamwidth values rarely found in small cells of wireless communications.
On the other hand, a set of experimental measurements regarding the CT, in rural and road environments at a carrier frequency of 5.9 GHz, were presented in [21], demonstrating that the CT decreases, as a reverse relationship, according to the distance between the transmitter and receiver increases. Moreover, they determined that the Doppler power spread increases with the mobile equipment speed linearly and proportionally. Additionally, in [22], the coherence time (CT) was evaluated for the main antenna beamwidth under a wireless channel at 60 GHz in a millimeter frequency band.
In [22], the numerical analysis and results are focused on determining the effects of the main antenna beamwidth over the CT, considering different pointing angles between the scatter ring and the mobile terminal. However, there is no evidence of any procedure that optimizes the antenna beamwidth under CT propagation metric constraints.
Based on the above, and motivated by the results exposed in the cited works, we propose to lay down a numerical setup that allows obtaining the effects of the narrow beam phased antenna arrays over the CT and DPS propagation metrics, considering a 5G wireless channel that operates in the millimeter frequency band. The main contribution of our paper, and the significant difference concerning previous work (including the work published in [12]), is a comparative evaluation of different antenna array geometries with a different number of antenna elements to generate these metrics in 5G. This knowledge could be considered to establish an antenna array geometry with better performance on 5G cellular scenarios.
The remainder of this paper is organized as follows. Section 2 describes the different mathematical models published in the literature to compute DPS and CT metrics. Section 3 evaluates the dependence of geometric placement of antenna array elements regarding radio link improvements. We expose the relevant results and discuss the DPS and CT performance, considering circular antenna array geometries. Finally, we present the respective conclusions of the paper in Section 4.
2. Doppler Power Spectrum (DPS) and Coherence Time (CT) as Radio Channel Metrics
In this section, several mathematical approaches, regarding the radio channel metrics, Doppler power spectrum (DPS), and coherence time (CT), are summarized.
2.1. Doppler Power Spectrum
In order to obtain an appropriate Doppler power spectrum (DPS) model to assess the effects of mmWave over 5G radio channels, we analyze the mathematical approaches of Clarke, Jakes, Gans, and IEEE, defined in [1,3], respectively; under mmWave frequency range.
Based on the above, and considering the frequency shift (Doppler Shift) caused by the user mobility, which depends on the signal angle of arrival ; the receive signal frequency and Doppler frequency , are defined as follow:
where the carrier signal frequency , in [GHz], is shifted by the effects of Doppler frequency , in which the parametric values of the light speed c and the receiver speed v, both in [m/sec], are considered. Additionally, the extreme values of , define the frequency interval of interest as, , as was suggested in [16,18].
From the antenna radiation pattern perspective, only the proposals of the Clarke and Gans mathematical approaches has the following assumptions: with the Clarke proposal, in [16], an omnidirectional antenna radiation pattern (monopole antenna) is supposed, and the receive signal angle of the arrival has a uniform distribution in a range of , where the azimuthal gain is constant. Meanwhile, Gans, in [18], defines the DPS as:
where is the maximum Doppler frequency, defined as , is the receiver antenna gain with a directive beam. The receiver antenna gain is taken when the following condition is accomplished:
where the difference between the arriving signal angle () and the direction of the antenna beam () is limited by half of the beamwidth of the receiver antenna .
2.2. Coherence Time Models
The shift Doppler represents a temporal change of Doppler spread due to receiver spatial displacement. Additionally, temporal variations on the Doppler spread are also related to the radio channel coherence time (CT).
In order to describe this behavior, the mathematical models proposed by IEEE P802.11, in [19,23], V. Va, in [22], and Rappaport, in [24,25,26,27], are the most relevant. However, the V. Va model is the only one that considers the effects of the antenna radiation beam pattern over CT metrics. In this way, this apart describes (and analyzes) only this CT model.
In particular, the V. Va model establishes the CT expression from the correlation function of the channel and the user spatial displacement, when the user is located in a scattering ring, concerning a base station.
The CT metric can be described from the pointing angle and the antenna beamwidth in the receiver. Depending on the value of the pointing angle, two different cases can be analyzed, as proposed in [22].
Case 1: when the angle is small,
where R is the correlation coefficient, it is found when the correlation function of the channel depends on the coherence time (), denotes the scattering radius normalized by the carrier wavelength, and is the beamwidth in the receiver.
Case 2: when the angle is not small,
3. Dependence of Geometric Placement of Antenna Array Elements in Regards to Radio Link Improvements
In this section, we analyze the geometric placement of the antenna array elements. In particular, we identify the beamwidth and steerable of the main beam capacities, which are fundamental antenna features to improve the DPS and CT metrics; the planar and circular geometries are analyzed, as well as the special case of concentric rings.
3.1. Geometric Assessment of Phased Antenna Arrays
We propose two antenna arrays with lengths of and . The number of elements required for each antenna array, according to its geometry, are follows: (1) planar (PA) of the and elements, respectively; (2) circular (CA) of 21 and 47 elements; and (3) 42 circular concentric rings (CR) (with three rings) and 196 (with seven rings) elements. The design and model of each array geometry were carried out by computing the array factor; PA [28,29,30,31,32], CA [28,29,30,31,33], CR [34,35,36,37,38].
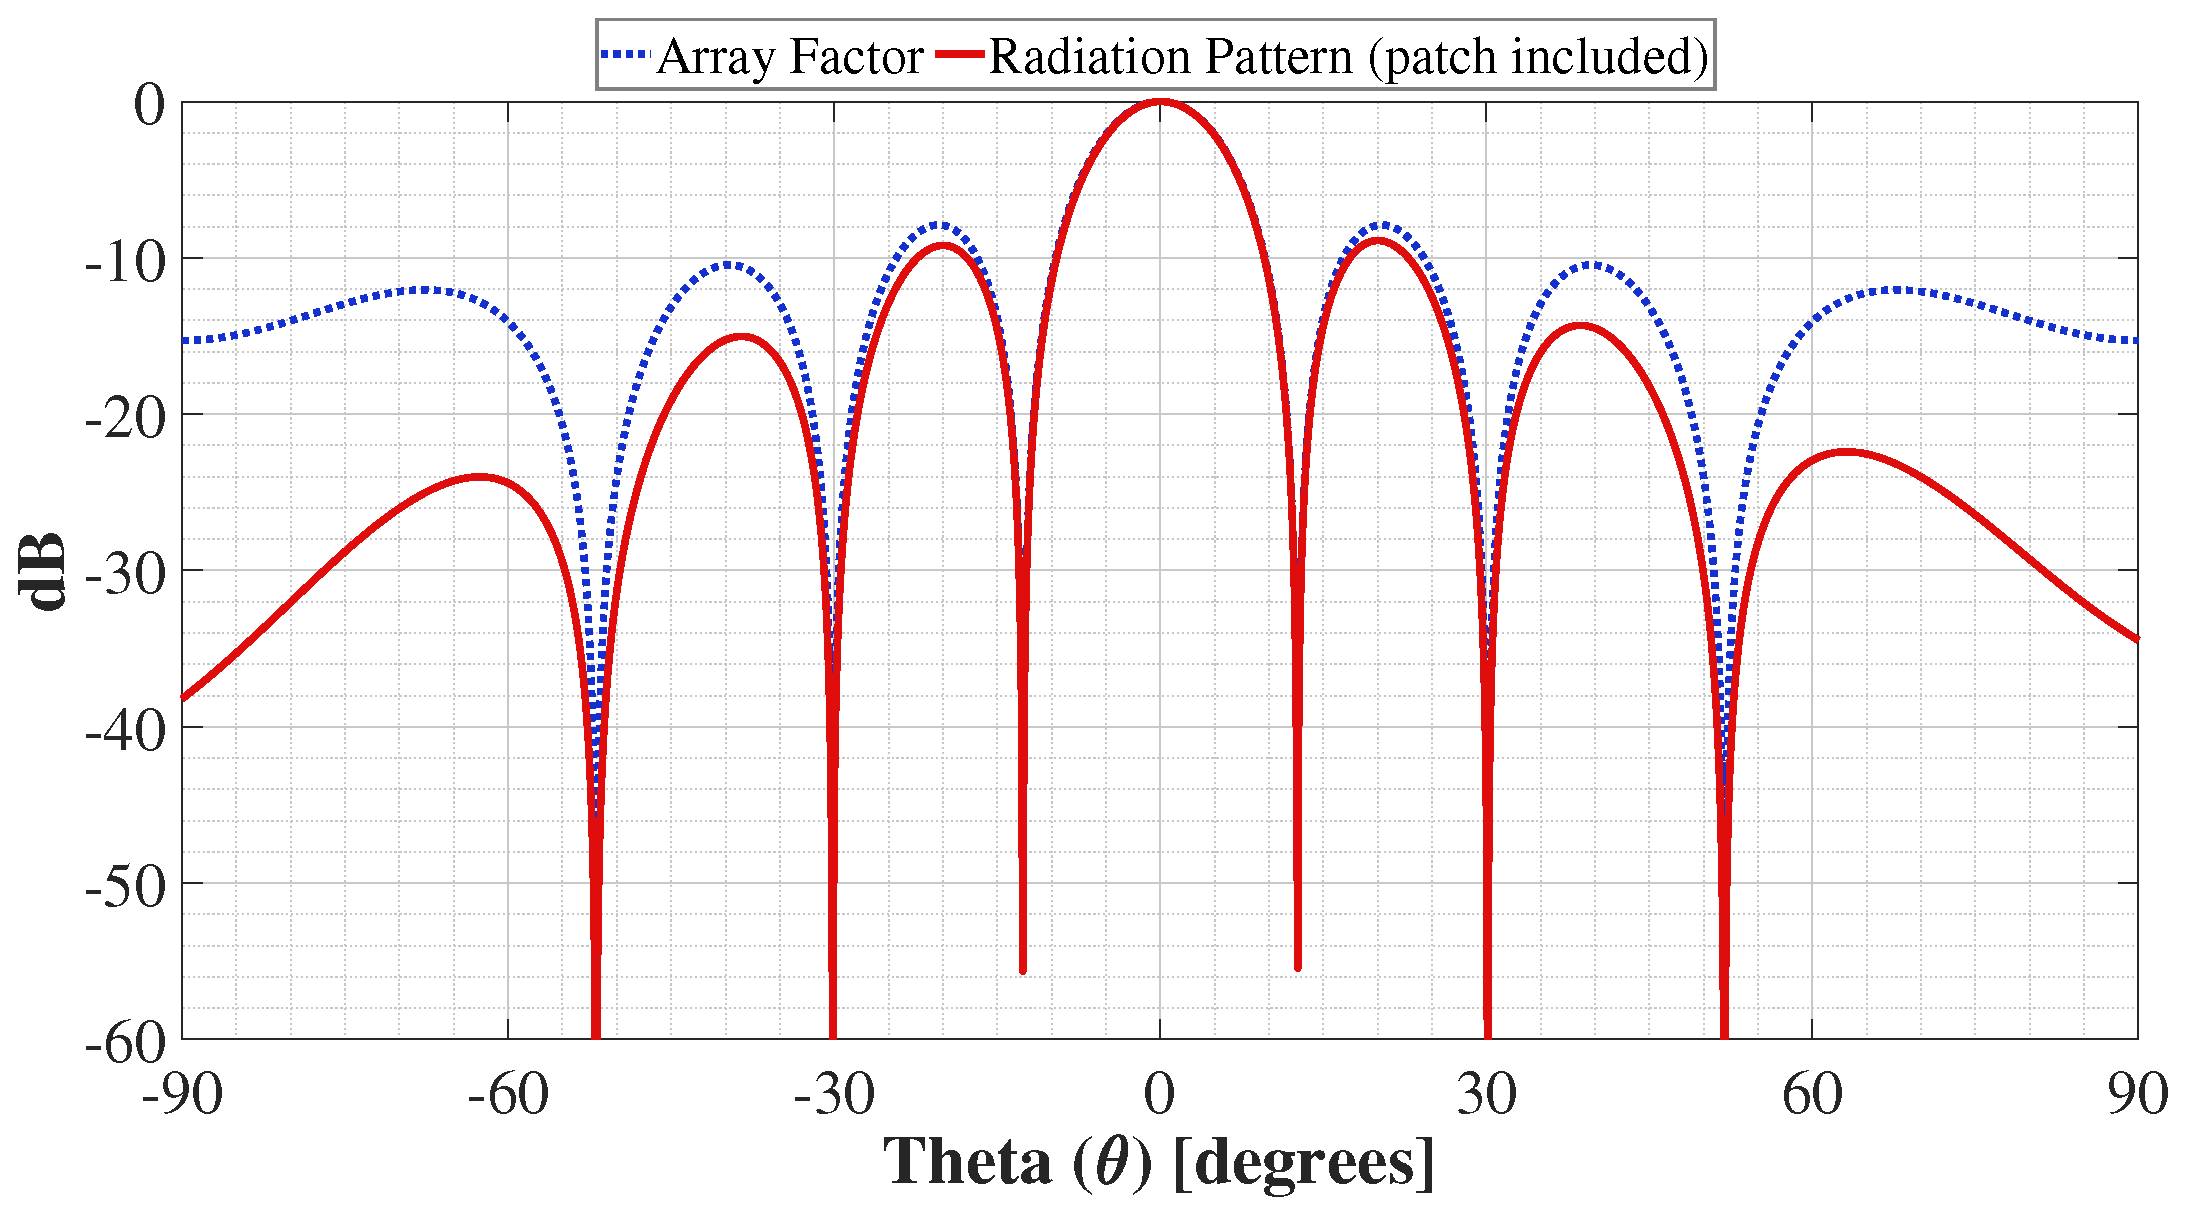
The numerical simulations of the antenna arrays were performed by the product of the array factor and the radiation pattern data of the antenna element. A patch was used as the antenna element and characterized in every interest frequency. The radiation performance is improved by using the antenna element. The results obtained by numerical results are similar to full-wave simulations. Figure 1 shows a comparison of the numerical simulation of the array factor and the radiation pattern (including the circular patch antenna).
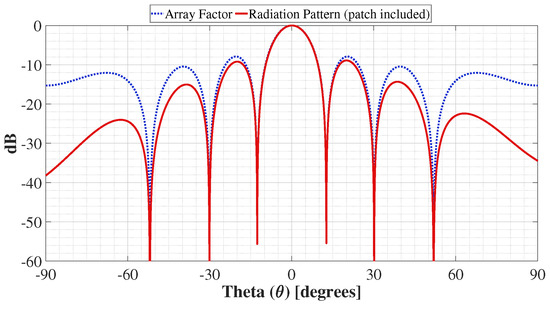
Figure 1.
Comparison between the numerical simulations of the array factor and radiation pattern (including a patch antenna) of the CA of 21 elements at .
The circular patch uses substrate laminates FR-4 (for 700 MHz and 3.5 GHz) and RT/duroid 5880 (for 26 and 48 GHz) with a dielectric constant () of 4.2 and 2.2, respectively. The FR-4 laminate considers a thickness of 1.6 mm, while the RT/duroid 5880 a laminate of 0.787 mm. The radiation efficiency of the circular patch is 65% in every frequency. An example of the radiation pattern of the circular patch antenna is shown in Figure 2.
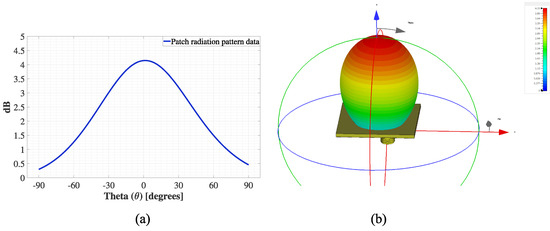
Figure 2.
Radiation pattern of the circular patch antenna; (a) radiation pattern data for numerical simulations, and (b) 3D radiation pattern from the CST MicroWave Studio Suite.
On the other hand, we defined an interelement spacing of with the aim of avoiding the mutual coupling between elements, and obtaining the least deformations in the radiation pattern, a main radiation beam direction at , with the samples of scanning angle in a range of to 90 degrees. The numerical outcomes regarding the antenna beamwidth and gain for the different geometries under the proposed antenna setup are summarized in Table 1.

Table 1.
Numeric results of the antenna arrays simulated at .
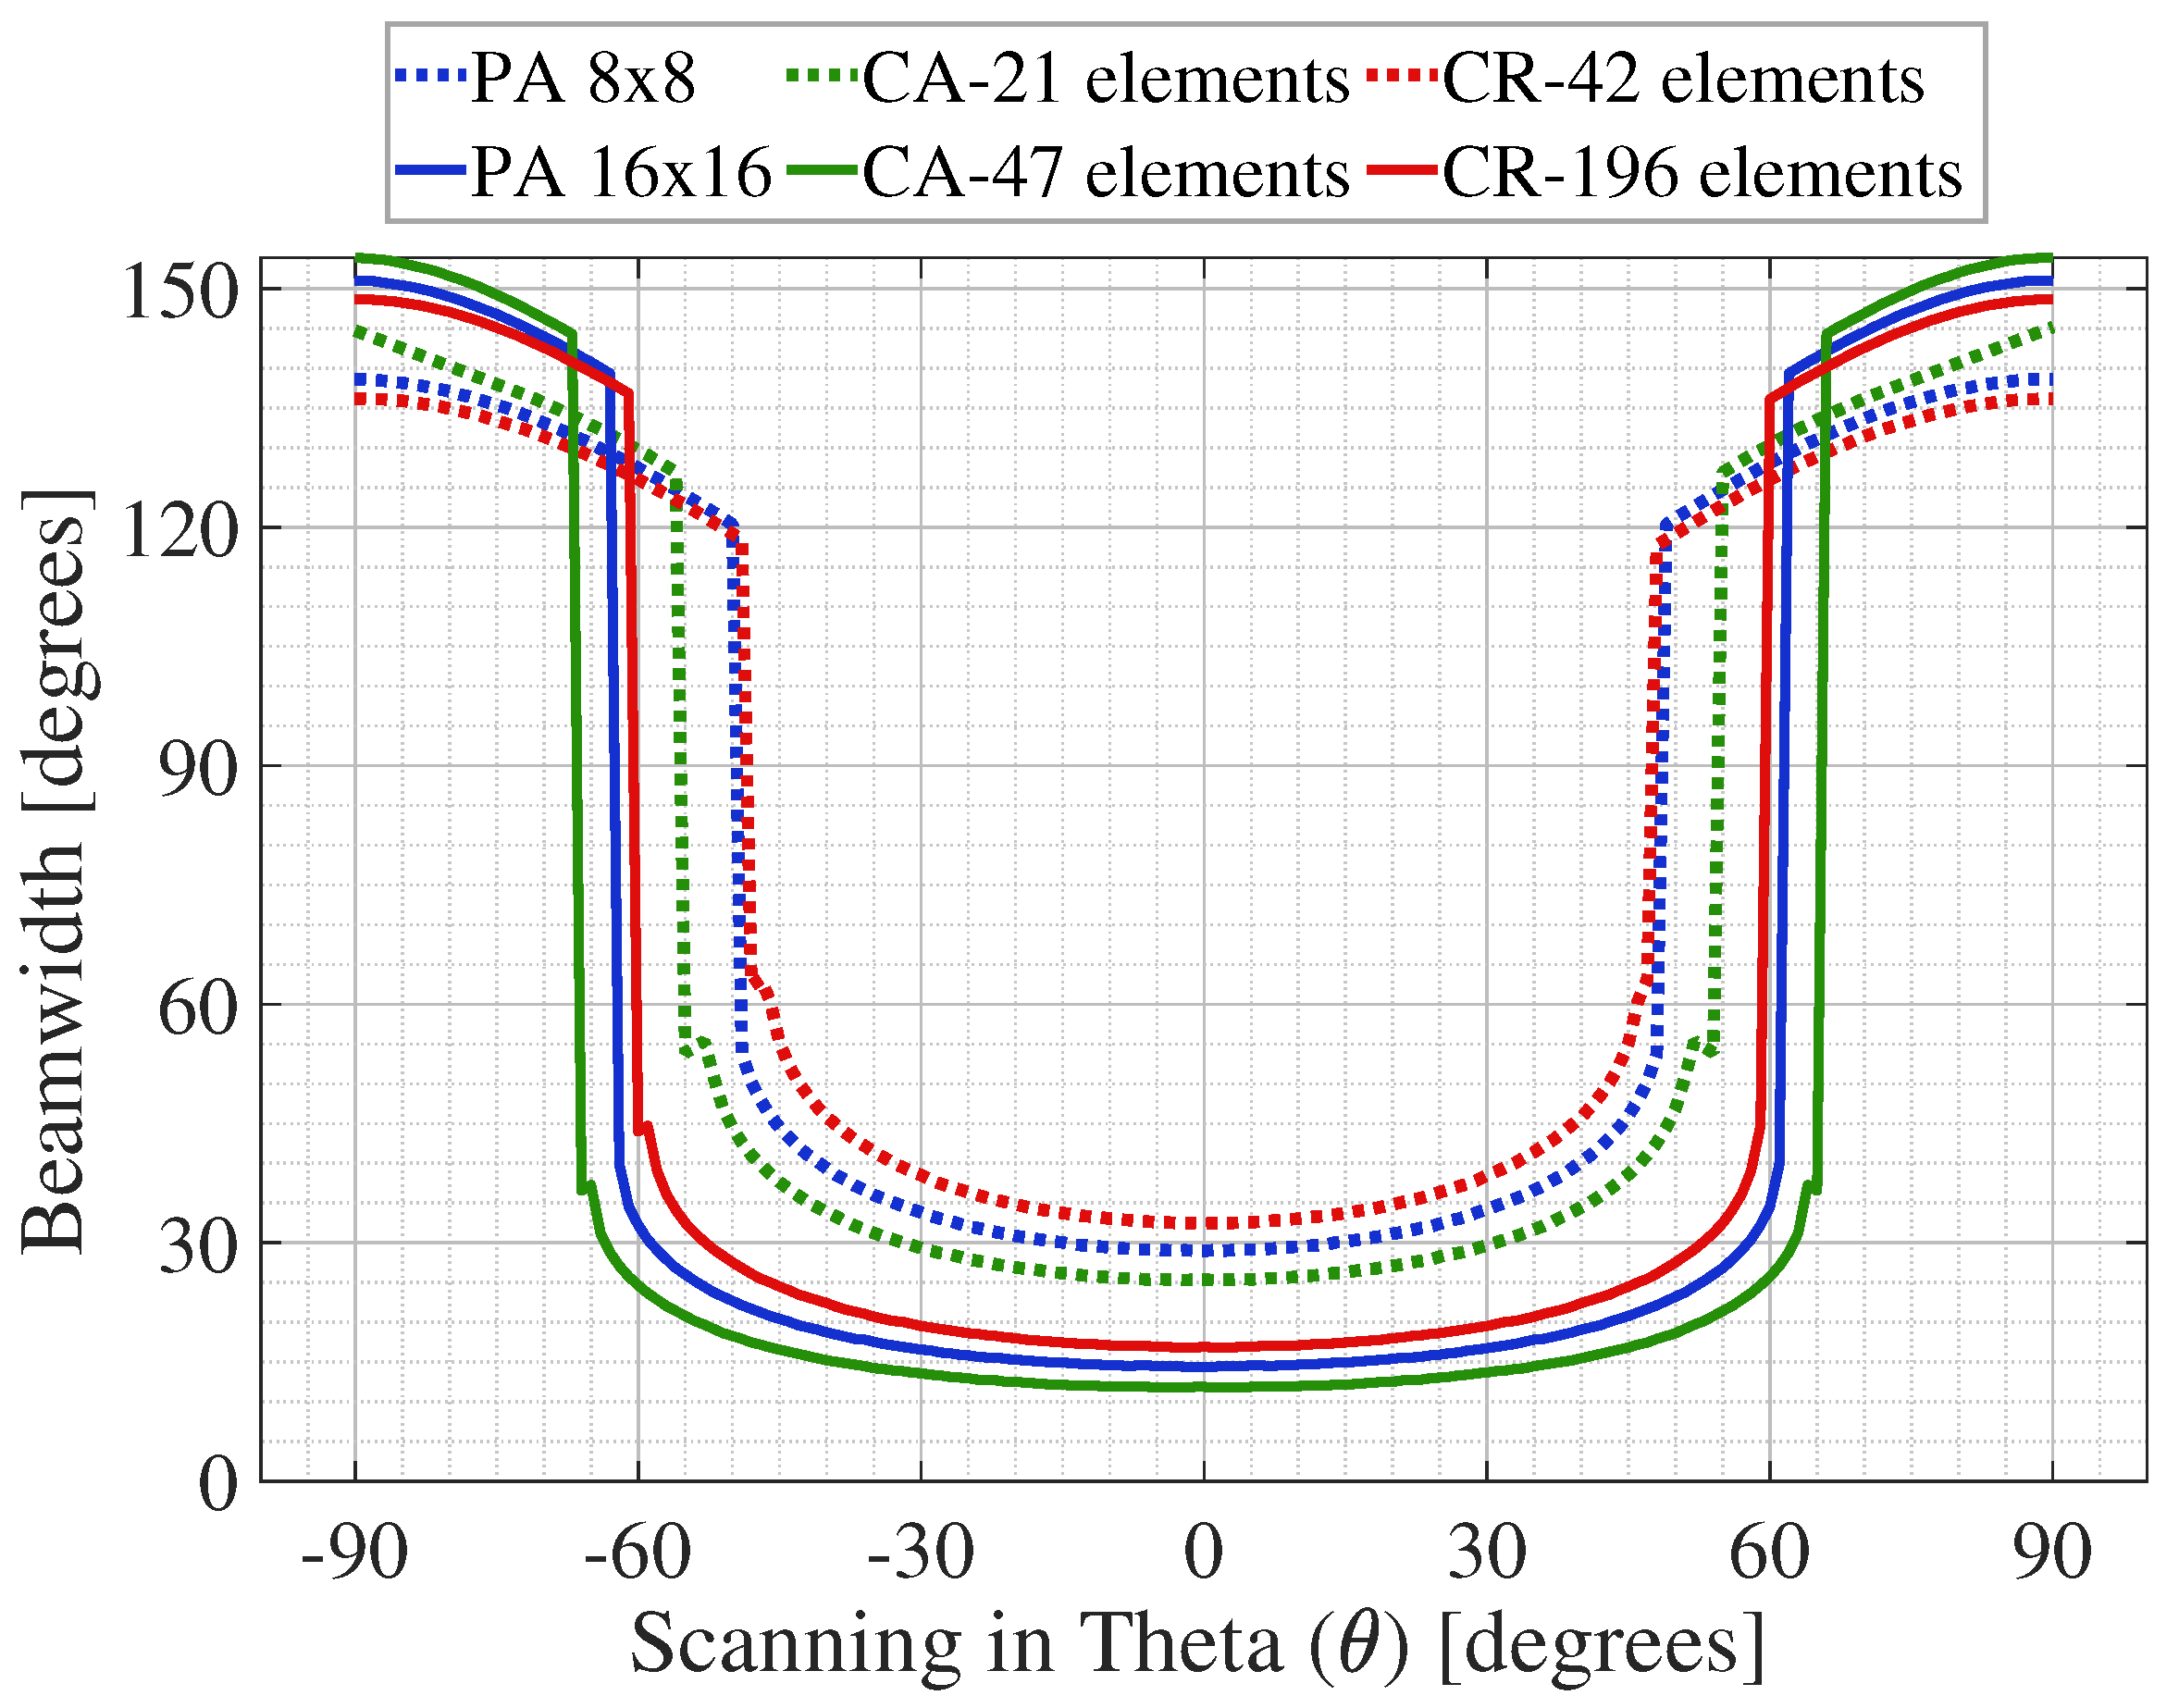
The obtained results illustrate that increasing the number of elements can achieve higher directivity (Gain) values and smaller beamwidth. Additionally, the circular antenna array has the best performance, with a narrower beamwidth and higher directivity compared to the other geometries. Although each geometry has its pros and cons, another required feature associated with the antenna arrays is the scanning capacity, a vital parameter to perform beamforming links and directional tracking of the mobile user in the radio mobile. Figure 3 and Figure 4 show a comparison of the beamwidth and gain levels at different scanning directions of the planar, circular, and concentric ring antenna arrays.
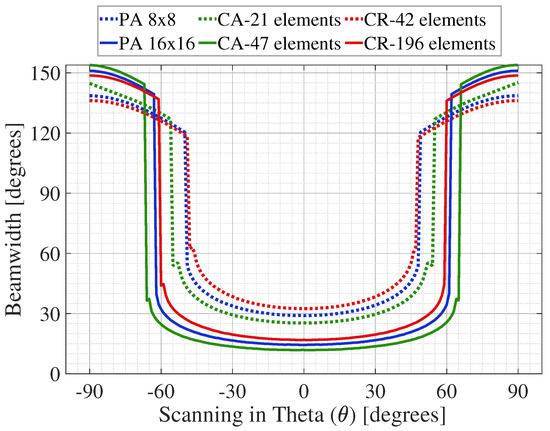
Figure 3.
Comparison of the beamwidth at different scanning directions of the planar (PA), circular (CA), and concentric ring (CR) antenna array.
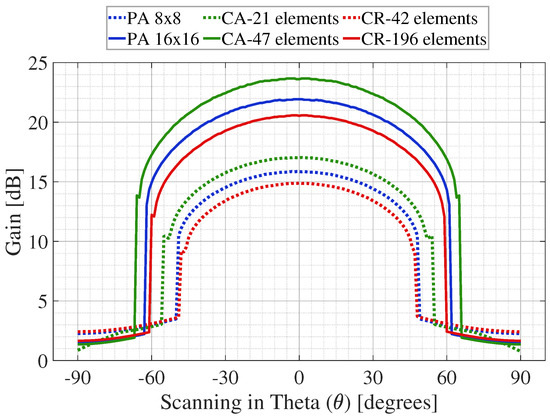
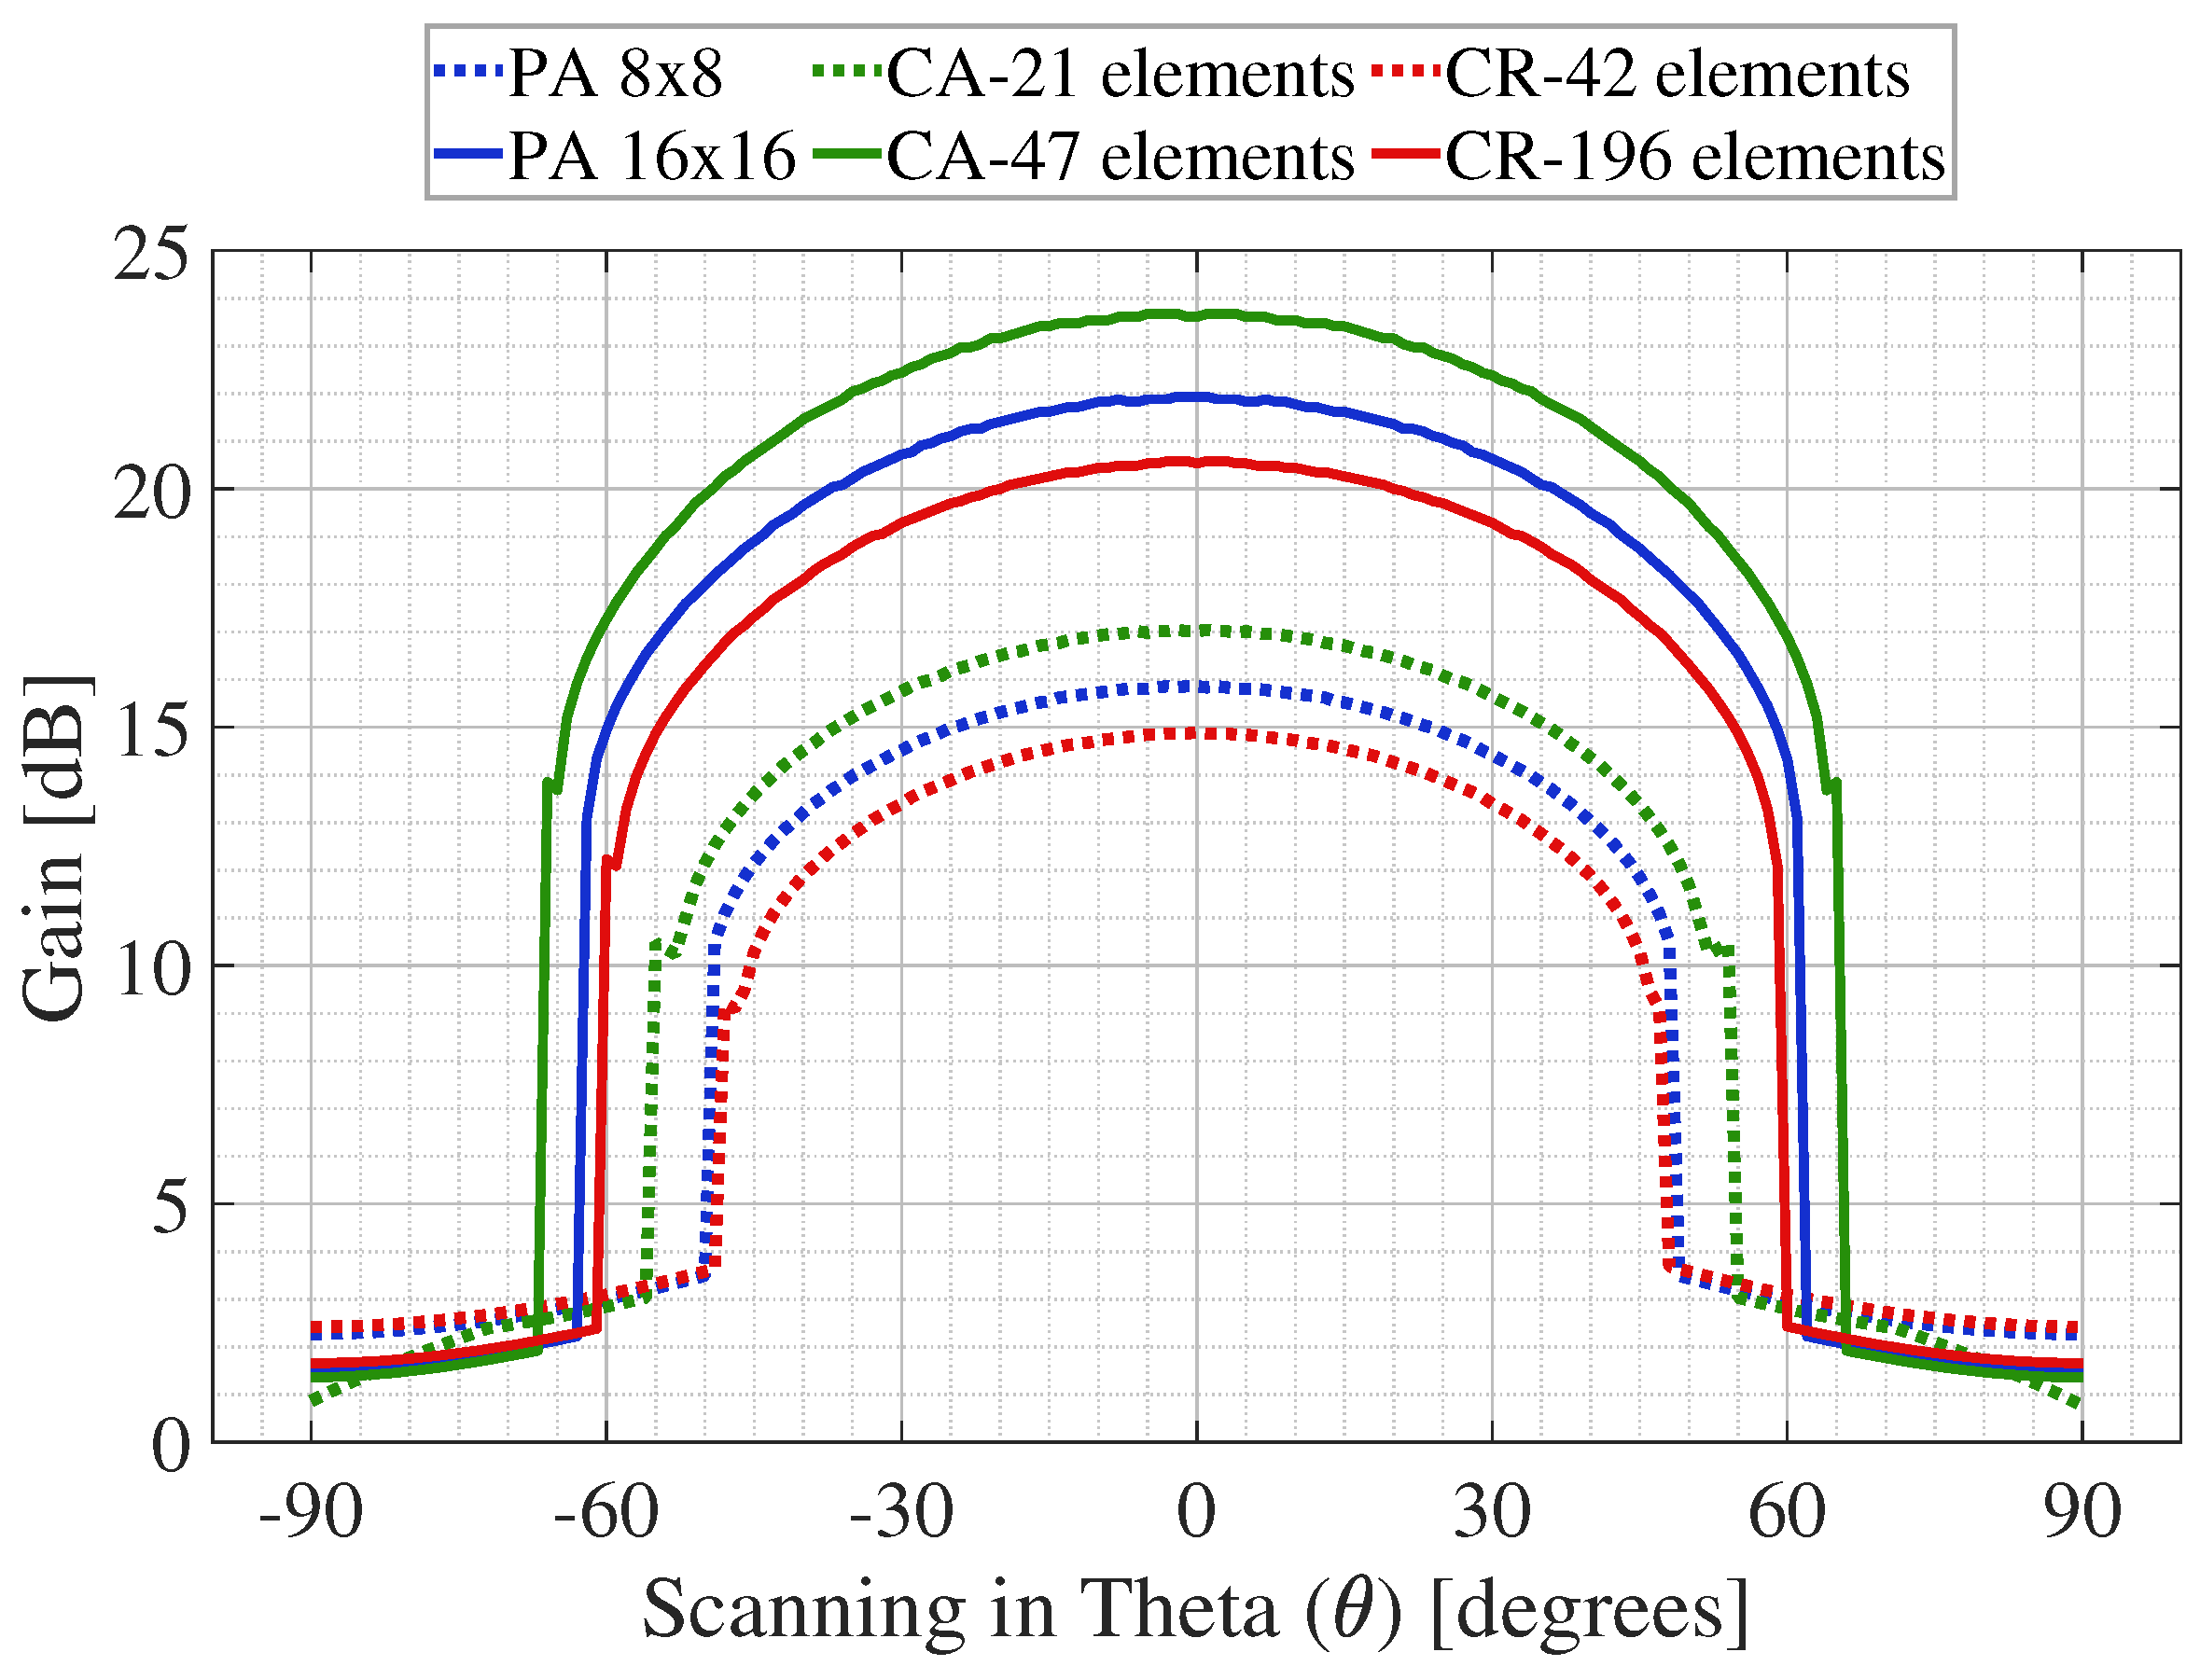
Figure 4.
Comparison of the gain levels at different scanning directions of the planar (PA), circular (CA), and concentric ring (CR) antenna array.
From Figure 3, we can see that the planar geometry is the more significant array with the higher area, higher number of antenna elements, and narrow beamwidths ( for 8 × 8 array and for 16 × 16 array), but its performance is not appropriate for large scanning directions. As shown in Figure 4, the scanning capacity of the planar array geometry is and in the 8 × 8 and 16 × 16 array, respectively. In this range the directivity levels are more stable and have narrower beams. It can be seen that the gain levels remain from 10 to 15 dB for 8 × 8 array, and from 13 to 22 dB for 16 × 16 array in the scannable range, due to the large number of antenna elements used in this array.
Circular array geometry, despite it having a smaller area and less antenna elements ( for 21-element-array and for the 47 element-array), illustrates a better performance than the planar array, due to an increase of of scanning with narrow beamwidths for the 21 element-array; and of scanning for the 47 element-array. Although the gain levels are higher than the results of the planar array, these levels remain stable in the same scanning directions, remaining from 10 to 17 dB and from 13 to 23 dB in the 21 element-array and the 47 element-array, respectively. Considering these numerical results, circular antenna arrays provide better performance and compromise between beamwidth and steering features.
This way, the circular antenna array is selected to analyze its effect in the TC and DPS, considering its beamwidth and gain at different frequencies. To achieve better and more accurate results in the following analysis, the full-wave simulations of the circular antenna array were implemented.
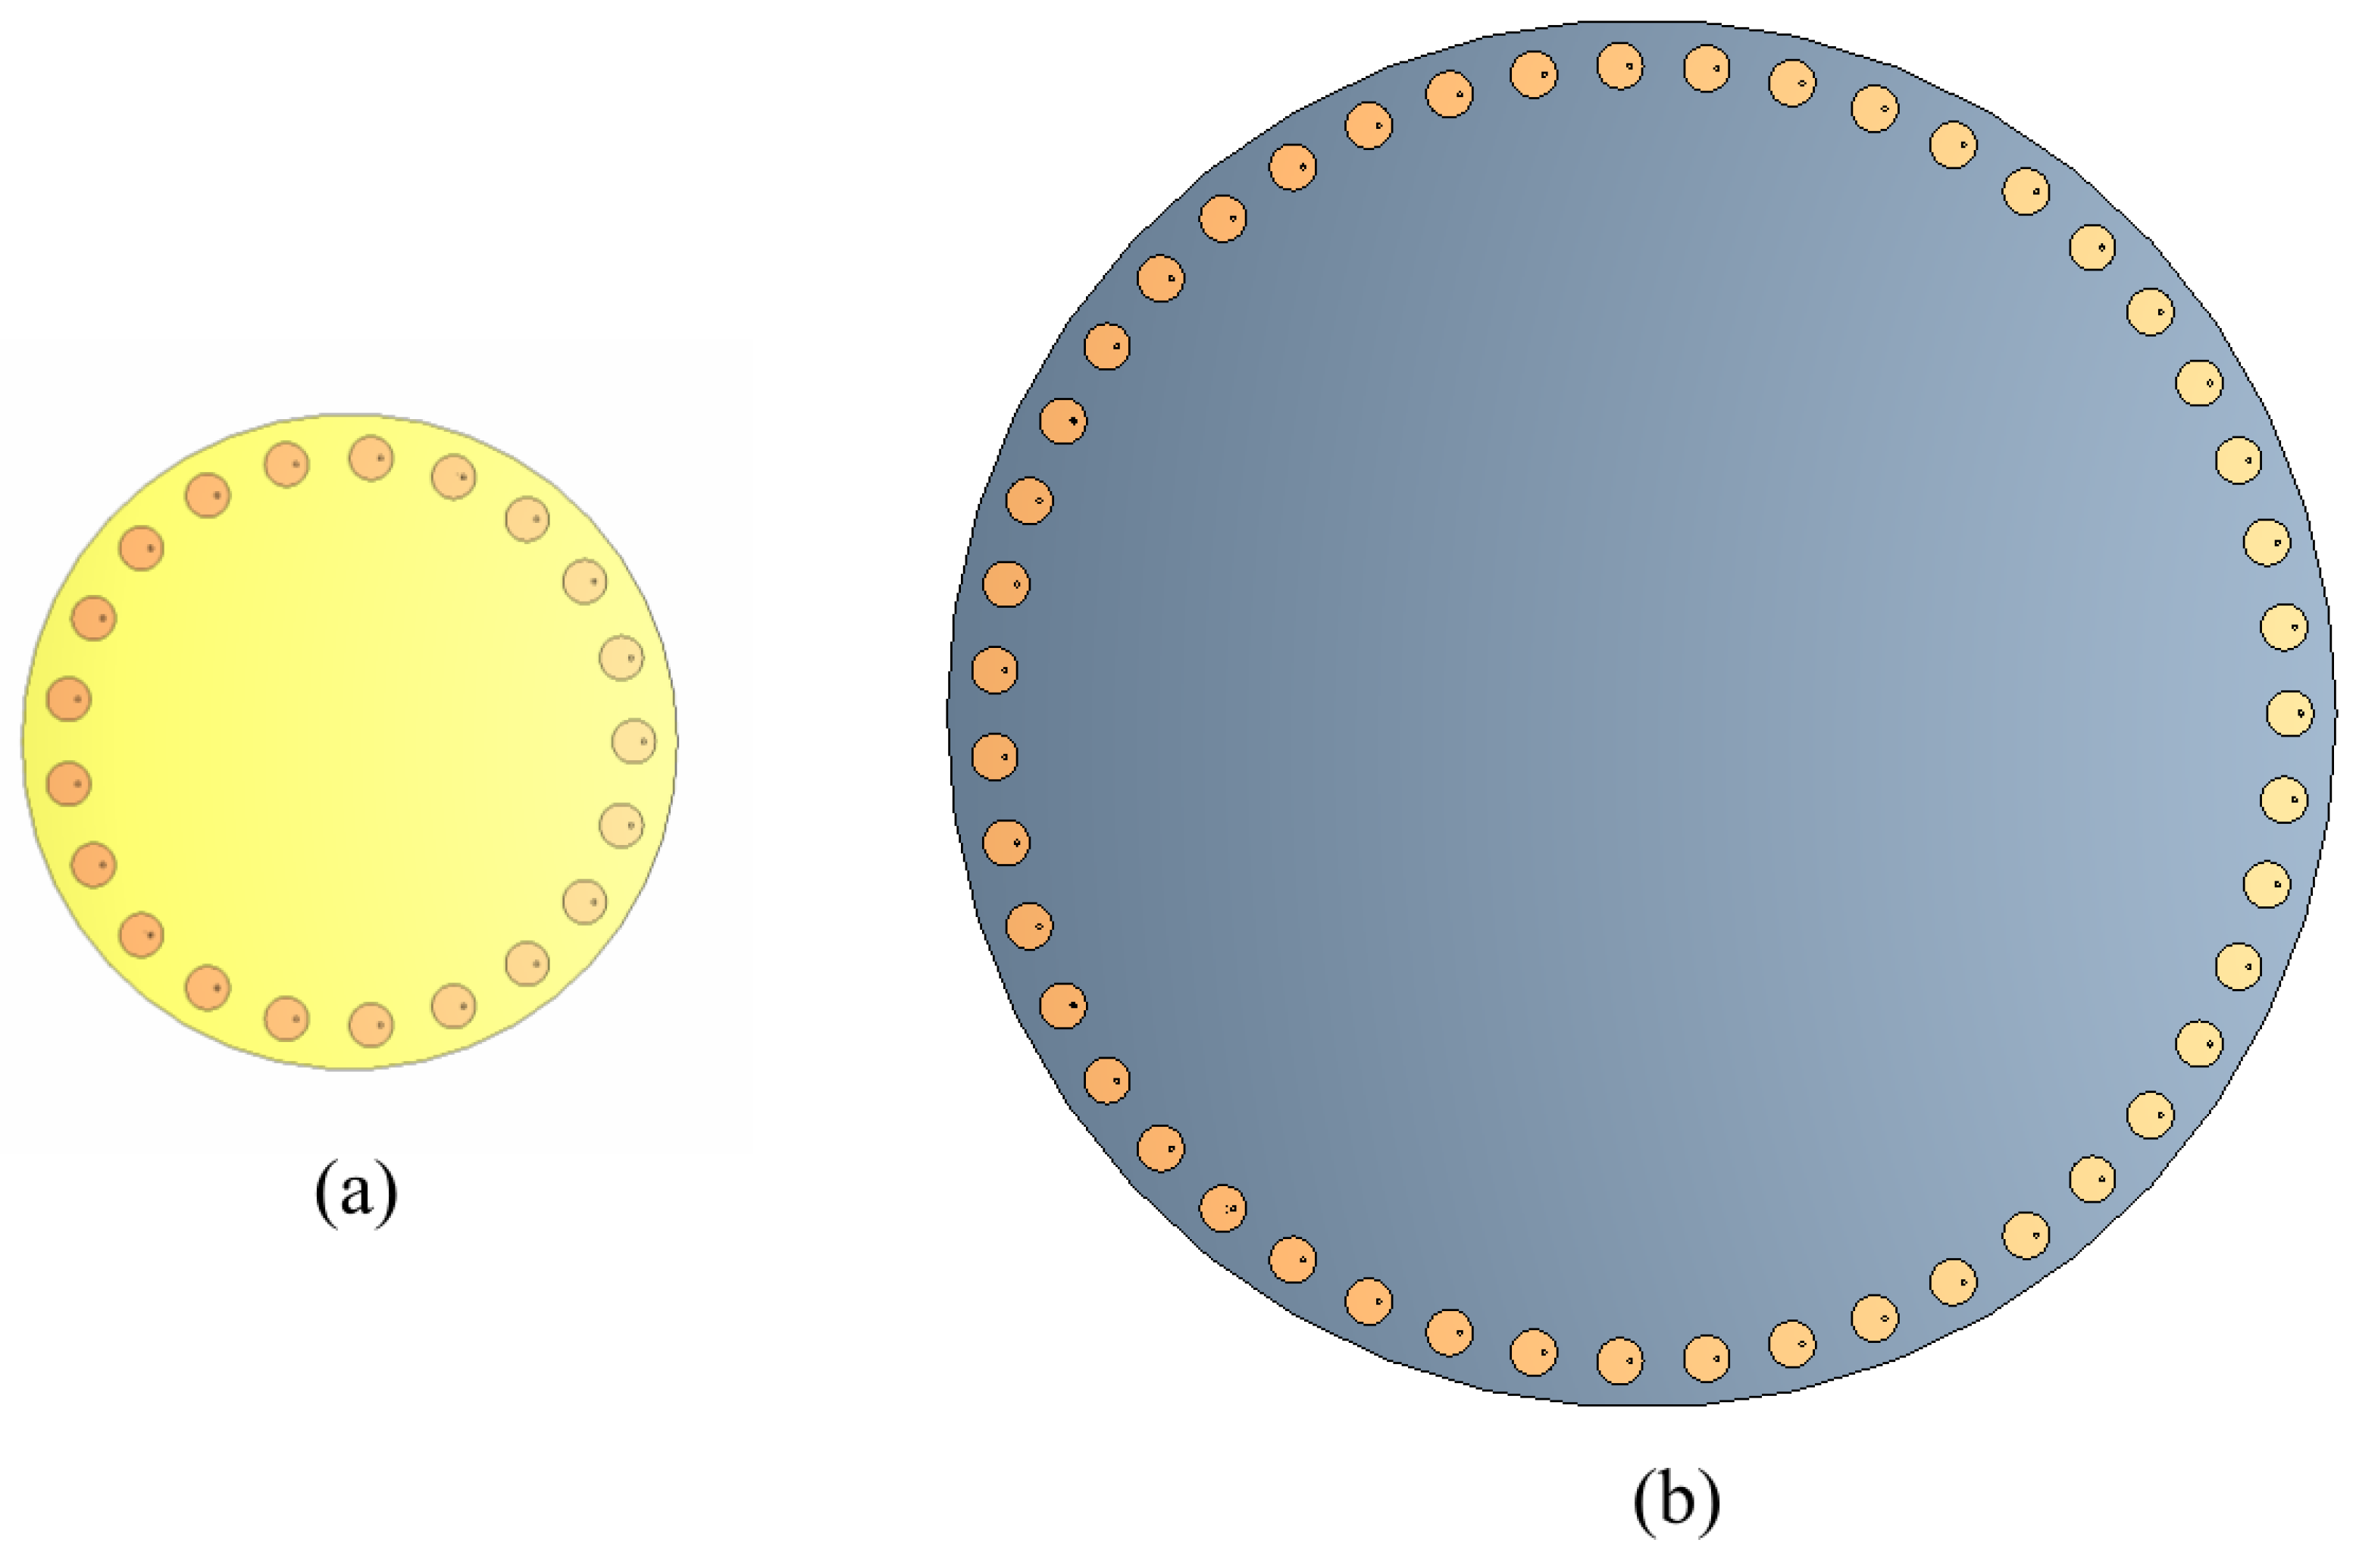
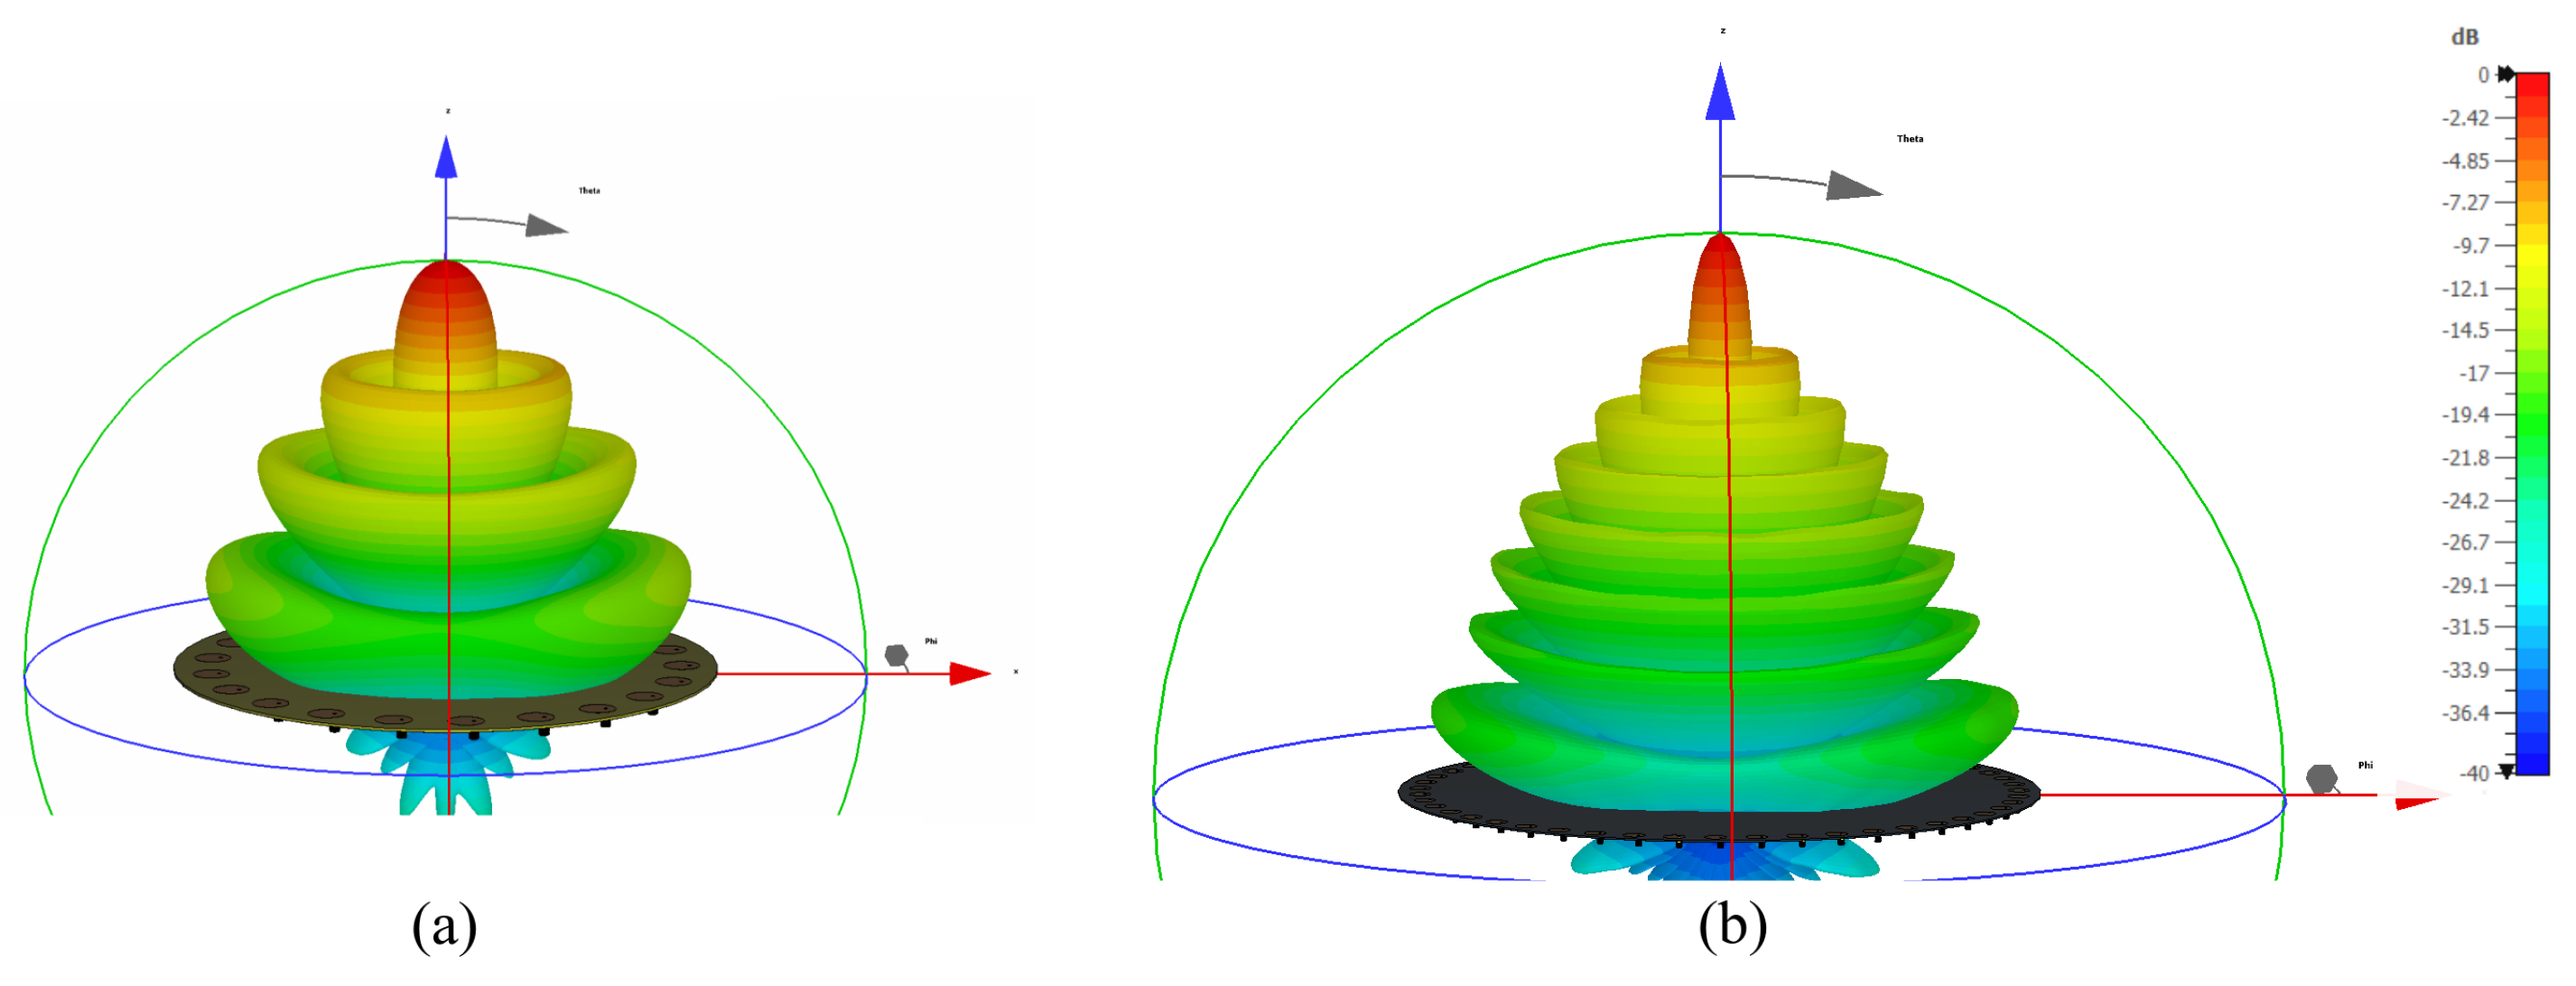
To obtain the beamwidth and gain of the circular array were necessary to simulate every frequency using a circular patch. The substrate laminates were FR-4 () and RT/duroid 5880 () with a thickness of 1.6 and 0.787 mm, respectively. Moreover, the radii of the different antennas used for the simulations were 59 mm (700 MHz), 11.43 mm (3.5 GHz), 2.48 mm (26 mm), and 1.46 mm (48 GHz). Additionally, SMA and 2.4 mm connector models were included in the simulation process. Figure 5 shows the CA-21 (a) at 3.5 GHz and CA-47 (b) at 26 GHz simulated in the CST MicroWave Studio Suite. The 3D radiation pattern yielded in both antenna arrays from Figure 5 are shown in Figure 6. Due to the geometry symmetry of the antenna array design, the beamwidth and gain were similar in every simulated case (CA-21 and CA-47). Both results are listed in Table 2.

Figure 5.
Circular antenna array models (a) CA-21 and (b) CA-47 in CST MicroWave Studio Suite.

Figure 6.
3D radiation pattern yielded by (a) CA-21 at 3.5 GHz and (b) CA-47 at 26 GHz in CST MicroWave Studio Suite.
Table 2.
Simulation parameters considered.
3.2. Effects of Circular Antenna Arrays over Doppler Power Spectrum and Coherence Time Metrics
In order to determinate the effects of circular antenna arrays over the Doppler power spectrum, defined by Gans, and the coherence time model proposed by V. Va, we used the simulation parameters described in Table 2. In addition to the simulation parameters, with the purpose of calculating the maximum Doppler frequency, a mobile user speed used in urban environments was also considered.
The simulation results, in regard to the Doppler power spectrum, can be observed in Figure 7, where the frequency of the carrier signal increases and the spectrum becomes broader and more extensive due to the effect of the Doppler shift. Power levels are also dependent on the Doppler frequency; in this sense, a higher frequency tends to have lower power levels. This effect can be counteracted by increasing the antenna gain; thus, improving the possibility of receiving the carrier signal with minimal effect from the Doppler effect.
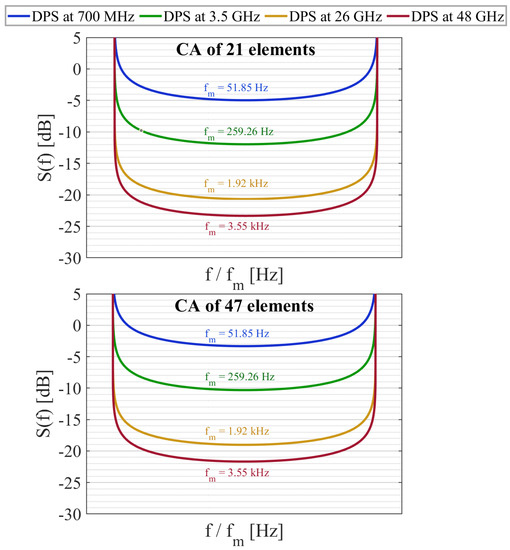
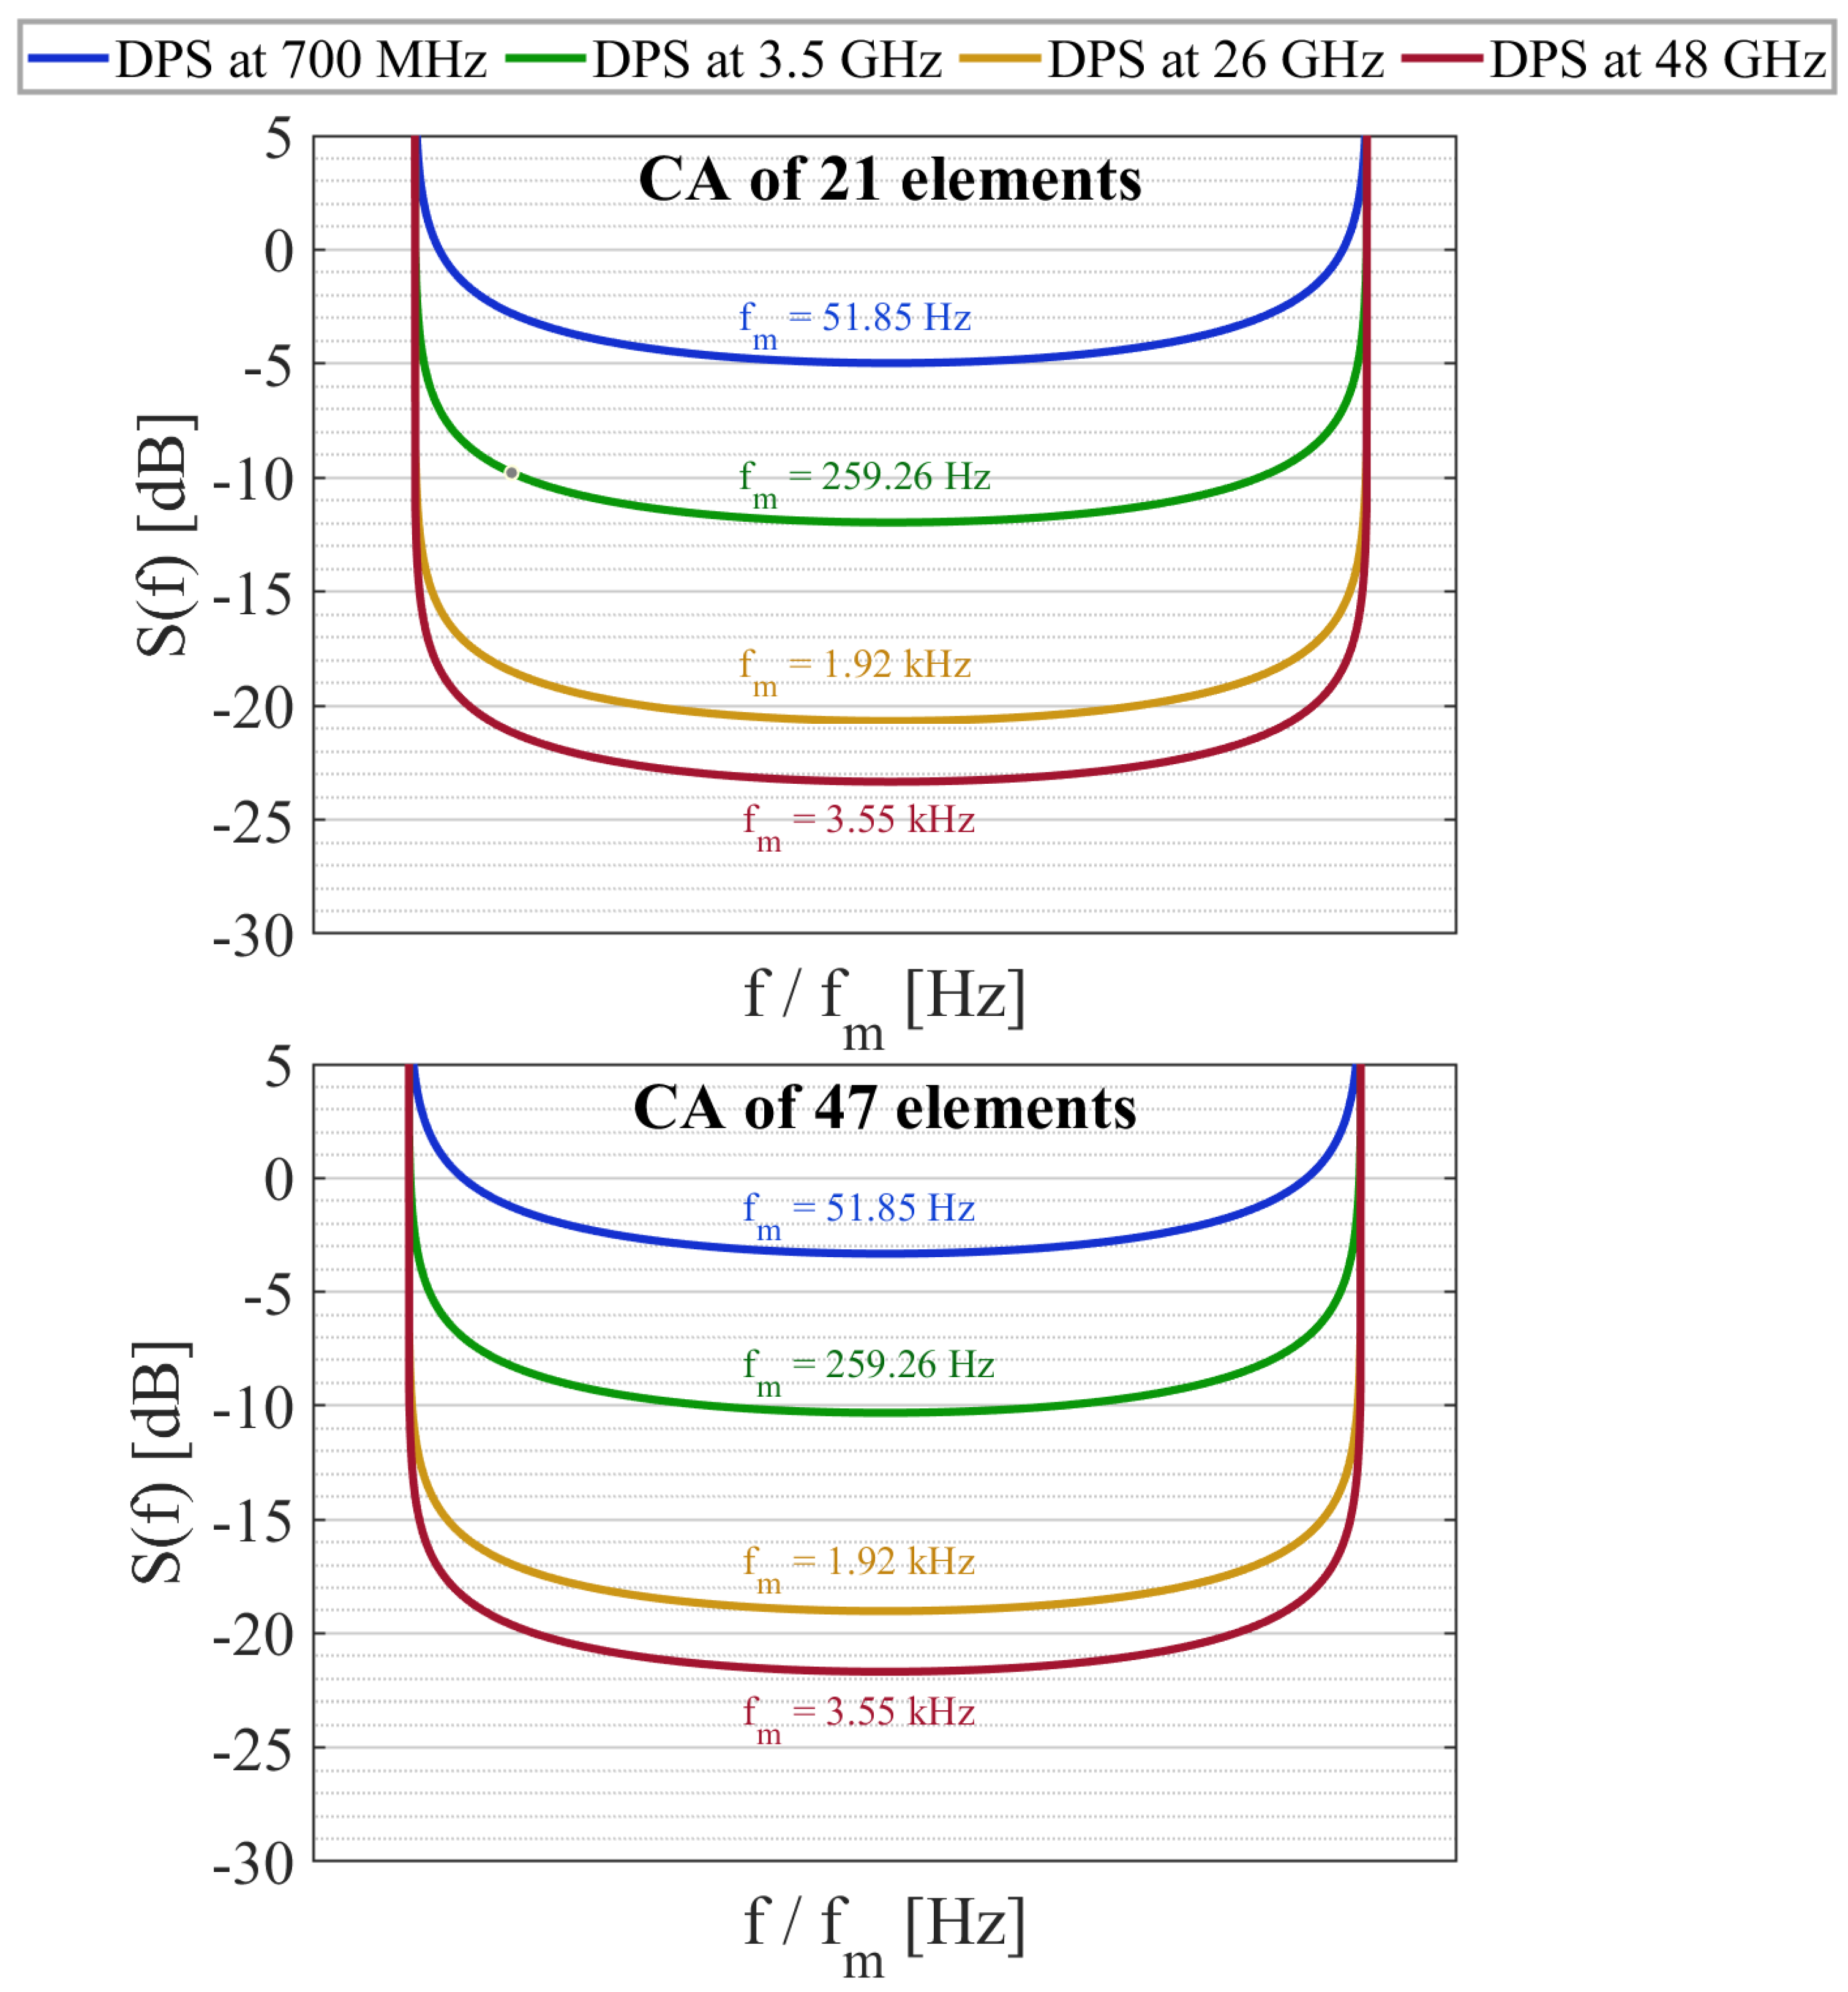
Figure 7.
Simulation and comparison of the DPS by Gans model at different carrier frequencies, including the gain of the CA-21 and CA-47.
The use of an antenna array is beneficial; there were improvements of up to 10 dB the power level of the carrier signal, with respect to the DPS of the Clarke model. The values of DPS for each 5G frequency band analyzed, at , are summarized in Table 3.
Table 3.
Power levels found in the central frequency of each simulated DPS in Figure 7.
We can observe that, in Table 3, all carrier frequencies analyzed showed an increase in the power levels as the Doppler frequency increases; thus, demonstrating the mitigation of the Doppler effect and obtaining high power levels at the central frequency. With these results, we can verify the improvement of the behavior of the Doppler power spectrum, using a receiver or transmitter with high antenna gains, regardless of the analyzed carrier frequency.
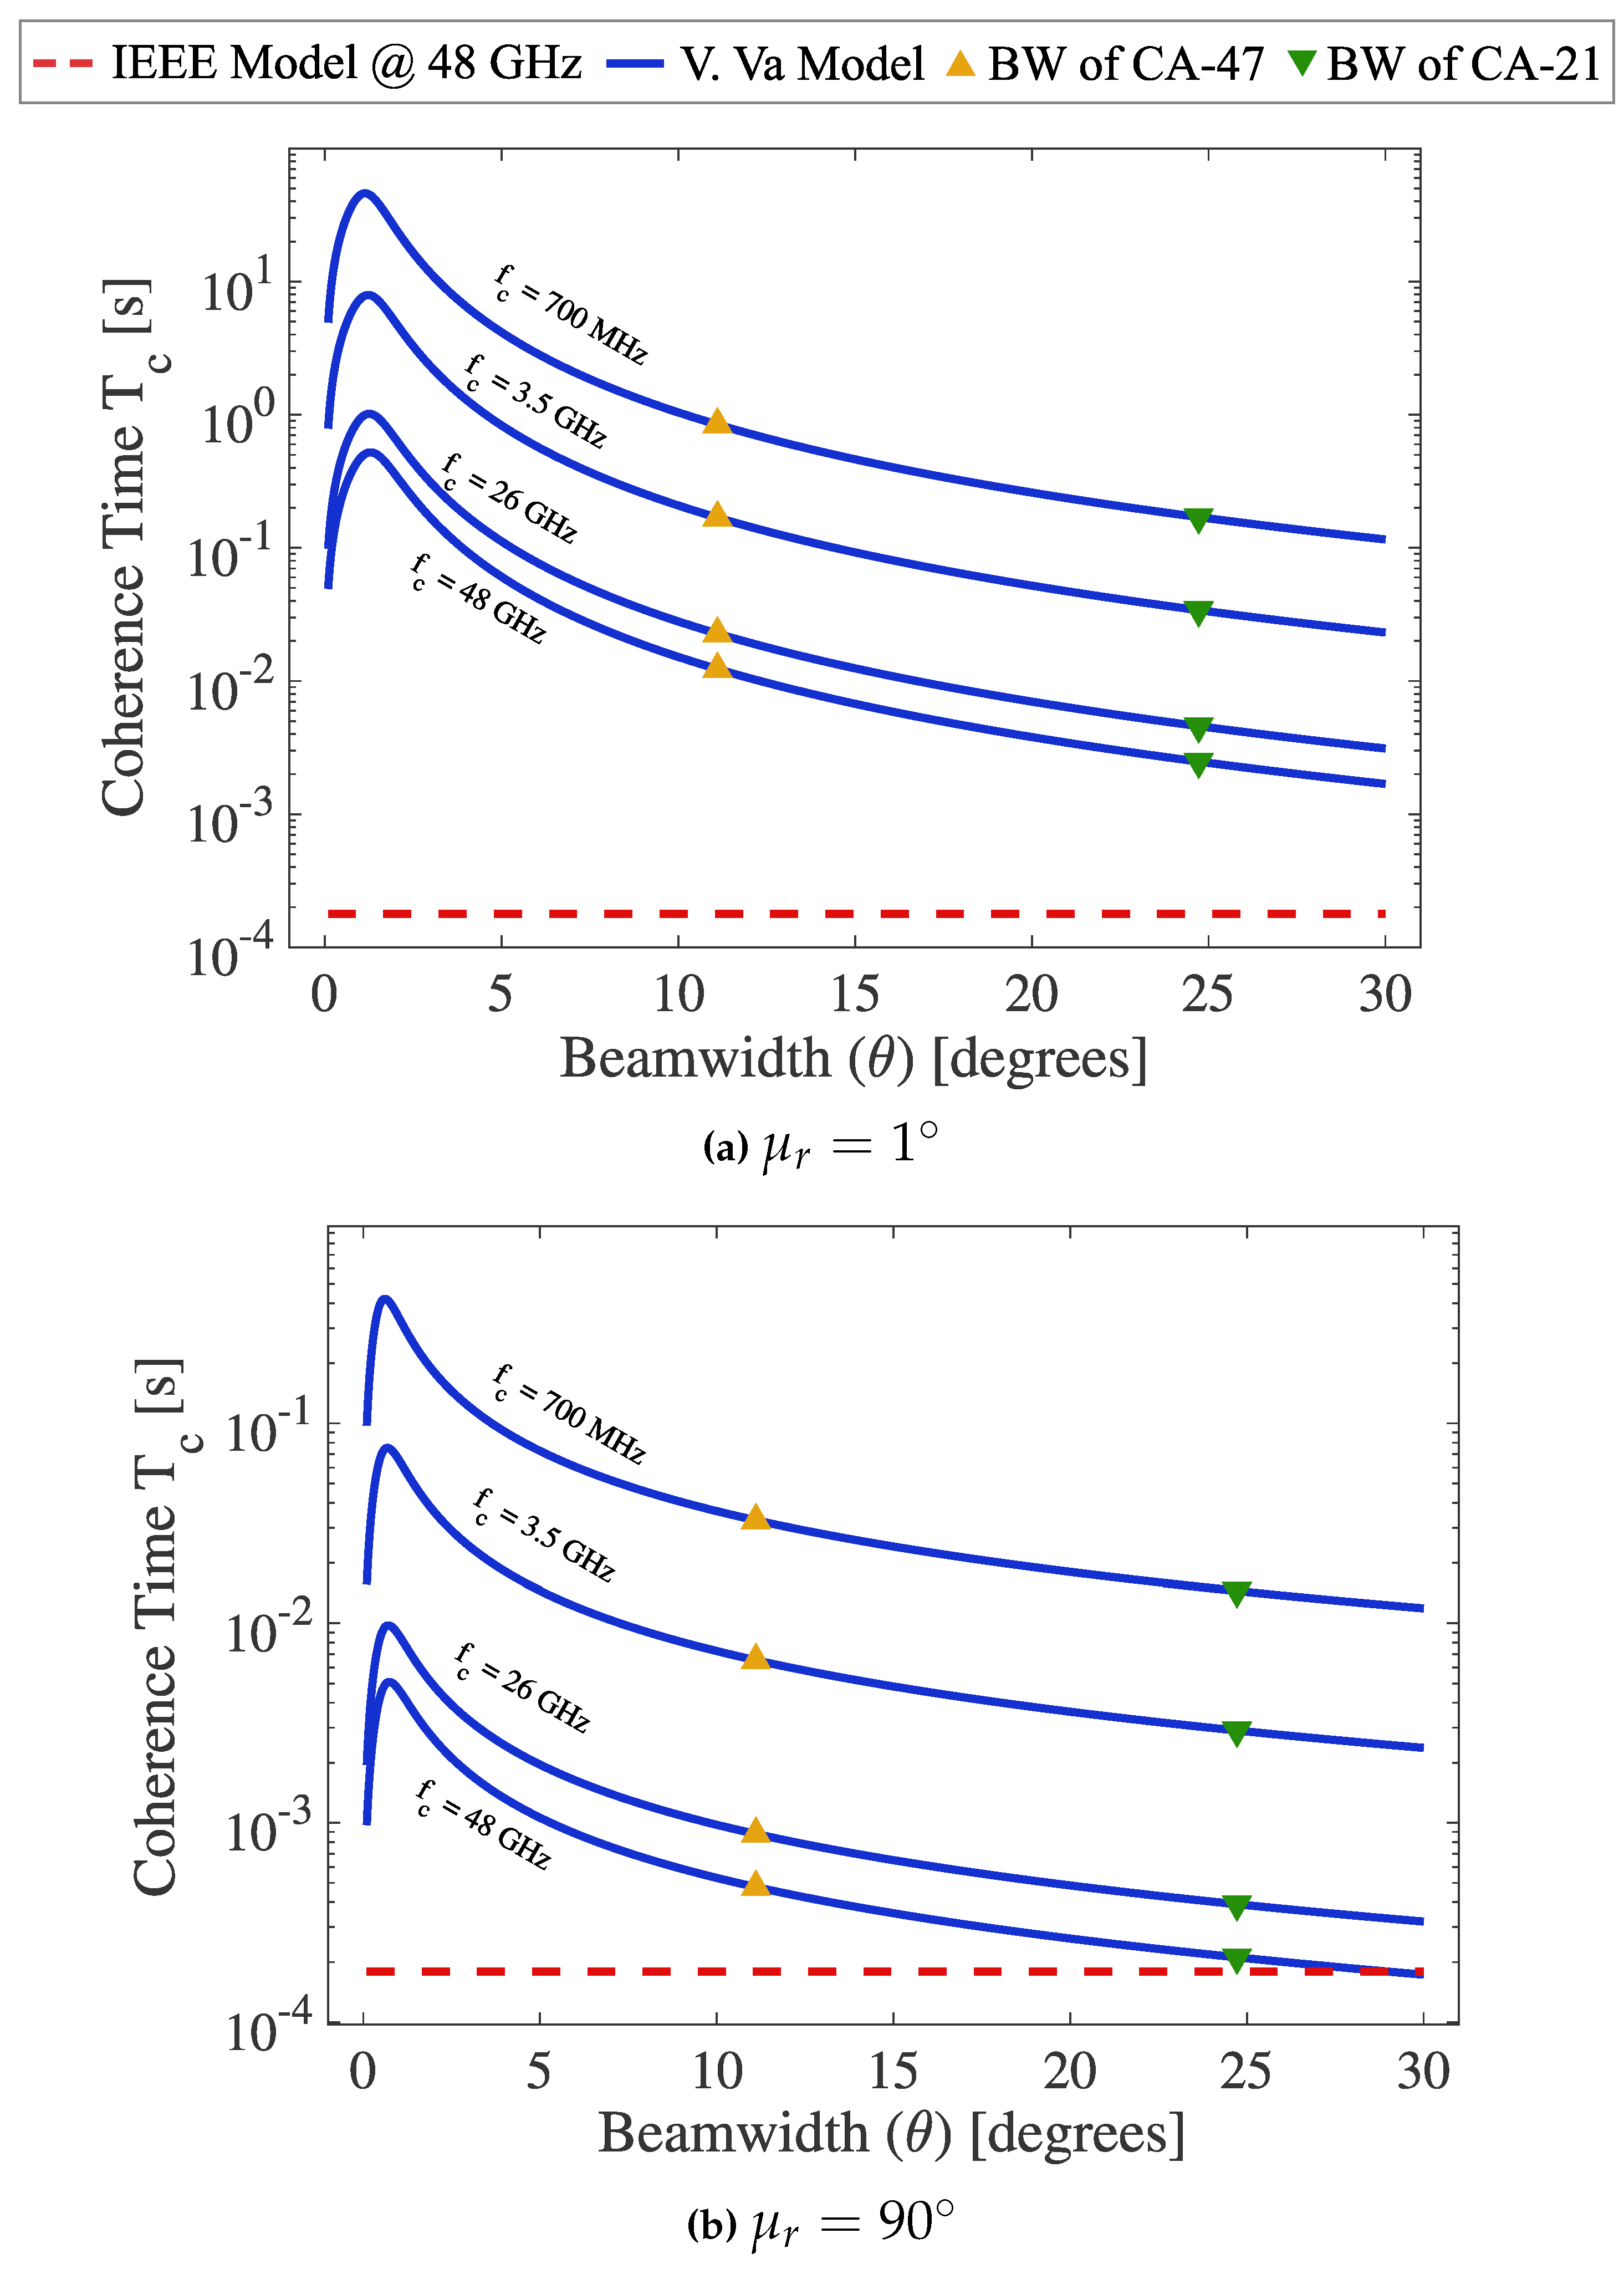
For the simulation of the coherence time, the following suitable parameters were considered: a circular geometry and the variation in the number of elements of the phased array of antennas. For the antenna array of 21 elements (CA-21), a beamwidth of was attained; for the antenna array of 47 elements (CA-47), a beamwidth of was obtained. Four carrier frequencies were considered—two less than, and two higher than 6 GHz.
With the idea of establishing a comparison of the coherence time values obtained in our simulation of the modified Va Model (VaMod), we show the behavior of the IEEE model for 5G, reported in [19,23], which cannot generate directive beams. Figure 8 shows the behavior of the coherence time, taking into account the previous parameters.
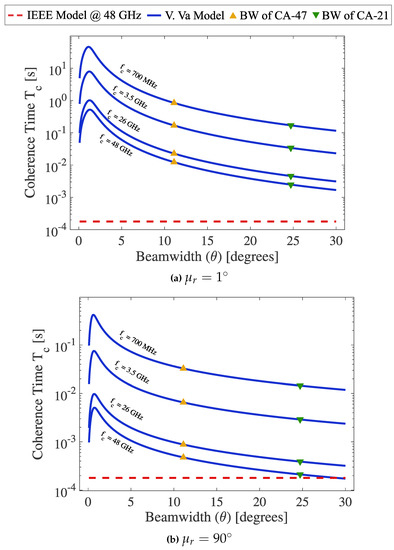
Figure 8.
Simulations and comparison of the coherence time at different carrier frequencies, using
the VaMod and IEEE model. Taking into account the two pointing angles cases: (a) when it is small,
and (b) when it is not small. The CT of the CA of the 21 and 47 elements is shown.
From Figure 8, it is possible to distinguish, in both cases, LOS and NLOS conditions, very high coherence time values of the order of several seconds in the window of 0 to beamwidth. However, it is not recommended to generate this beamwidth since it would imply greater complexity in the structure of the circular phased antenna array. Besides, very convenient coherence time values were obtained, ranging from the order of almost one second to hundreds of milliseconds; that is, values that far exceed the coherence time reported by the IEEE model, and by other models.
The numerical values of the coherence times are shown in Table 4, which shows the coherence time values of the IEEE model, corresponding to the four carrier frequencies considered.
Table 4.
Coherence time values of VaMod (using CA-21 and CA-47) and IEEE simulated in Figure 8 at different carrier frequencies.
From Table 4, we can conclude the following aspects: the smaller the beam width generated by the antenna array, the greater the coherence time. The higher the carrier frequency, the shorter the coherence time. The coherence time from a beamwidth and a carrier frequency remain constant in the user’s mobility condition within the interfering ring. The variation in one or even two orders of magnitude in the coherence time in the cases of , and , is because, in this last condition, the radio signal experiences multipaths, increasing with it the RMS delay spread at the receiver, and as a result, a considerable decrease in coherence time. Even in the most unfavorable condition of the orthogonal movement of the mobile concerning the source, the coherence time values are higher than those obtained by the IEEE model.
Finally, in Table 5, we make a comparison of our work and results with other similar and cited studies. This comparison is realized in terms of important contributions in relation to a typical wireless communications environment. Thus, the principal contributions of this work can be shown.
Table 5.
Comparison between this work and cited works.
4. Conclusions
In this paper, we evaluated the effects of narrow beam phased antenna arrays over the radio channel metrics, Doppler power spectrum, and coherence time, in a context of 5G operation frequency bands. A proper mathematical model was selected for both metrics, and the best geometric placement of antenna array elements was determined. The results show that the circular antenna arrays provide improvement over both metrics, by considering the geometric placement of antenna elements on radio link metrics. The numerical simulation and results should be essential for an adequate determination of antenna array systems immersed in a context of millimeter-wave (mmWave) frequencies and the spatial radio resource allocation.
Author Contributions
Conceptualization: B.J.S., D.H.C. and E.J.; theoretical analysis and simulations: B.J.S. and E.J.; validated the theoretical analysis and the simulation results:B.J.S., D.H.C., L.F.Y. and M.A.P.; analyzed the results and contributed to writing the manuscript: B.J.S., D.H.C. and L.F.Y. All authors have contributed to reviewing the manuscript. Moreover, all authors have read and agreed to the published version of the manuscript.
Funding
This work was supported by CONACyT under grant no.2016-01-1680.
Institutional Review Board Statement
Not applicable.
Informed Consent Statement
Not applicable.
Data Availability Statement
No new data were created or analyzed in this study. Data sharing is not applicable to this article.
Conflicts of Interest
The authors declare no conflict of interest.
References
- Boccardi, F.; Heath, R.W.; Lozano, A.; Marzetta, T.L.; Popovski, P. Five Disruptive Technology Directions for 5G. IEEE Commun. Mag. 2014, 52, 74–80. [Google Scholar] [CrossRef] [Green Version]
- 3GPP TR 36.873 v.14.0.0, Study on Channel Model for Frequency Spectrum Above 6 GHz, January 2015. Available online: http://www.3gpp.org (accessed on 19 August 2021).
- Rappaport, T.S.; Sun, S.; Shafi, M. 5G Channel Model with Improved Accuracy and Efficiency in mmWave Bands. IEEE 5G Tech Focus 2017, 1, 1–6. [Google Scholar]
- Rappaport, T.; Sun, S.; Mayzus, R.; Zhao, H.; Azar, Y.; Wang, K.; Wong, G.N.; Schulz, J.K.; Samimi, M.; Gutierrez, F. Millimeter wave mobile communications for 5G cellular: It will work! IEEE Access 2013, 1, 335–349. [Google Scholar] [CrossRef]
- Bansal, G.; Jain, A.K.; Mishra, T. 5G Technology and Their Challenges. J. Adv. Database Manag. Syst. 2019, 6, 1–7. [Google Scholar]
- Rappaport, T.S.; Heath, R.W., Jr.; Daniels, R.C.; Murdock, J.N. Millimeter Wave Wireless Communications; Pearson/Prentice-Hall: Upper Saddle River, NJ, USA, 2015. [Google Scholar]
- Huo, Y.; Dong, X.; Xu, W.; Yuen, M. Enabling Multi-Functional 5G and Beyond User Equipment: A Survey and Tutorial. IEEE Access 2019, 7, 116975–117008. [Google Scholar] [CrossRef]
- Thompson, J.; Ce, X.; Wu, C.X.; Irmer, R.; Jiang, G.; Fettweis, G.; Alamouti, A. 5G Wireless Communication Systems: Prospects and Challenges. IEEE Commun. Mag. 2014, 52, 62–64. [Google Scholar] [CrossRef]
- Zhao, K.; Ying, Z.; He, S. EMF Exposure Study Concerning mmWave Phased Array in Mobile Devices for 5G Communication. IEEE Antennas Wirel. Propag. Lett. 2016, 15, 1132–1135. [Google Scholar] [CrossRef]
- Sun, S.; Rappaport, T.S.; Shafi, M.; Tang, P.; Zhang, J.; Smith, P.J. Propagation models and performance evaluation for 5 g millimeter-wave bands. IEEE Trans. Veh. Technol. 2018, 67, 8422–8439. [Google Scholar] [CrossRef]
- Liu, Y.; Li, J.; Zhang, X.; Zhou, S. Fast Accurate Beam and Channel Tracking for Two-Dimensional Phased Antenna Arrays. IEEE Access 2020, 8, 209844–209877. [Google Scholar] [CrossRef]
- Penttinen, J.T.J. 5G Explained: Security and Deployment of Advanced Mobile Communications; Wiley & Sons: Atlanta, GA, USA, 2019. [Google Scholar]
- Osseiran, A.; Boccardi, F.; Braun, V.; Kusume, K.; Marsch, P.; Maternia, M.; Queseth, O.; Schellmann, M.; Schotten, H.; Taoka, H. Scenarios for 5G mobile and wireless communications: The vision of the METIS project. IEEE Commun. Mag. 2014, 52, 26–35. [Google Scholar] [CrossRef]
- Roh, W.; Seol, J.; Park, J.; Lee, B.; Lee, J.; Kim, Y.; Cho, J.; Cheun, K.; Aryanfar, F. Millimeter-wave beamforming as an enabling technology for 5G cellular communications: Theoretical feasibility and prototype results. IEEE Commun. Mag. 2014, 52, 106–113. [Google Scholar] [CrossRef]
- Shafi, M.; Zhang, J.; Tataria, H.; Molisch, A.F.; Sun, S.; Rappaport, T.S.; Tufvesson, F.; Wu, S.; Kitao, K. Microwave vs. millimeter-wave propagation channels: Key differences and impact on 5G cellular systems. IEEE Commun. Mag. 2018, 56, 14–20. [Google Scholar] [CrossRef]
- Clarke, R.H. A Statistical Theory of Mobile-Radio Reception. Bell Syst. Tech. J. 1968, 47, 957–1000. [Google Scholar] [CrossRef]
- Jakes, W.C. Microwave Mobile Communications; Wiley & Sons/IEEE Press: New York, NY, USA, 1974. [Google Scholar]
- Gans, M. A Power-Spectral Theory of Propagation in the Mobile-Radio Environment. IEEE Trans. Veh. Technol. 1972, 21, 27–38. [Google Scholar] [CrossRef]
- Erceg, V.; Schumacher, L.; Kyritsi, P.; Molisch, A.; Baum, D.S.; Gorokhov, A.Y.; Oestges, C.; Li, Q.; Yu, K.; Tal, N.; et al. Tgn channel models—IEEE p802.11. IEEE Tech. Rep. 2004. Available online: https://www.iitk.ac.in/mwn/papers/11-03-0940-01-000n-tgn-channel-models.pdf (accessed on 19 August 2021).
- Nawaz, S.J.; Khan, N.M.; Patwary, M.N.; Moniri, M. Effect of Directional Antenna on the Doppler Spectrum in 3-D Mobile Radio Propagation Environment. IEEE Trans. Veh. Technol. 2011, 60, 2895–2903. [Google Scholar] [CrossRef]
- Cheng, L.; Henty, B.; Bai, F.; Stancil, D.D. Doppler Spread and Coherence Time of Rural and Highway Vehicle-to-Vehicle Channels at 5.9 GHz. In Proceedings of the IEEE GLOBECOM 2008—2008 IEEE Global Telecommunications Conference, New Orleans, LA, USA, 30 November–4 December 2008; pp. 1–6. [Google Scholar]
- Va, V.; Heath, R.W. Basic Relationship Between Channel Coherence Time and Beamwidth in Vehicular Channels. In Proceedings of the 2015 IEEE 82nd Vehicular Technology Conference (VTC2015-Fall), Boston, MA, USA, 6–9 September 2015; pp. 1–5. [Google Scholar]
- Perahia, E.; Stacey, R. Next Generation Wireless LANs: 802.11n and 802.11ac, 2nd ed.; Cambrige University Press: Cambrige, UK, 2013. [Google Scholar]
- Rappaport, T.S. Wireless Communications: Principles & Practice; Prentice Hall: Upper Sadler River, NJ, USA, 1996. [Google Scholar]
- Sklar, B. Rayleigh Fading Channels in Mobile Digital Communication Systems and Characterization. IEEE Commun. Mag. 1997, 35, 90–100. [Google Scholar] [CrossRef]
- Greewood, D.; Hanzo, L. Characterisation of Mobile Radio Channels; Steele, R., Ed.; Pentech Press: London, UK, 1994. [Google Scholar]
- Steele, R.; Hanzo, L. Mobile Radio Communications, 2nd ed.; John Wiley & Sons: Hoboken, NJ, USA, 1994. [Google Scholar]
- Mohan, N.; Zinka, S.R.; Dassan, K. Design and analysis of linear, planar and circular array using ARRAY TOOL. Int. J. Appl. Eng. Res. (IJAER) 2015, 10, 22681–22686. [Google Scholar]
- Balanis, C.A. Antenna Theory: Analysis and Design, 3rd ed.; John Wiley & Son: Hoboken, NJ, USA, 2005. [Google Scholar]
- Stutzman, W.L.; Thiele, G. Antenna Theory and Design, 3rd ed.; John Wiley & Sons: Hoboken, NJ, USA, 2013. [Google Scholar]
- Elliott, R. Antenna Theory and Design: IEEE Press Series on Electromagnetic Wave Theory; John Wiley & Sons: Hoboken, NJ, USA, 2003. [Google Scholar]
- Zinka, S.; Jeong, I.B.; Chun, J.H.; Kim, J.P. A novel geometrical technique for determining optimal array antenna lattice configuration. Antennas Propag. 2010, 58, 404–412. [Google Scholar] [CrossRef]
- Josefsson, L.; Persson, P. Conformal Array Antenna Theory and Design: IEEE Press Series on Electromagnetic Wave Theory; John Wiley & Sons: Hoboken, NJ, USA, 2006. [Google Scholar]
- Hamdi, B.; Liman, S.; Aguili, T. Uniform and Concentric Circular Antenna Arrays Synthesis for Smart Antenna Systems Using Artificial Neural Network Algorithm. Prog. Electromagn. Res. B 2016, 67, 91–105. [Google Scholar] [CrossRef] [Green Version]
- Luo, Z.; He, X.; Chen, X.; Luo, X.; Li, X. Synthesis of thinned concentric circular antenna arrays using modified TLBO algorithm. Int. J. Antennas Propag. 2015, 2015, 1–9. [Google Scholar] [CrossRef] [Green Version]
- Reyna, A.; Panduroa, M.A.; Covarrubias, D.H.; Mendeza, A. Design of steerable concentric rings array for low side lobe level. Sci. Iran. 2012, 19, 727–732. [Google Scholar] [CrossRef] [Green Version]
- Zhang, L.; Jiao, Y.-C.; Chen, B. Optimization of concentric ring array geometry for 3D beam scanning. Int. J. Antennas Propag. 2012, 2012, 625437. [Google Scholar] [CrossRef]
- Mandal, D.; Ghoshal, S.P.; Bhattacharjee, A.K. Optimized radii and excitations with concentric circular antenna array for maximum sidelobe level reduction using wavelet mutation based particle warm optimization techniques. Telecommun. Syst. 2013, 52, 2015–2025. [Google Scholar] [CrossRef]

Publisher’s Note: MDPI stays neutral with regard to jurisdictional claims in published maps and institutional affiliations. |
© 2021 by the authors. Licensee MDPI, Basel, Switzerland. This article is an open access article distributed under the terms and conditions of the Creative Commons Attribution (CC BY) license (https://creativecommons.org/licenses/by/4.0/).