Abstract
We explored the usage of a response modification factor and overstrength factor for analyzing brittle or ductile failure of anchor system. Parametric studies on the tension and shear behaviors of anchor systems were compared in terms of elastic and ductile design using tuned Gyeongju earthquake data (ca. 0.3 g). We evaluated the yields of concrete anchors in terms of ductile failure and reviewed the various anchors, anchor attachments, and facilities and equipment that ensure anchor safety and functionality. The pseudo-static pushover test and elastic/inelastic dynamic tests revealed that a ductile design reduces the seismic demand relatively efficiently. As the DS-0050 design standards are based on strength design, no displacement limit for non-structural facilities/equipment is imposed. Despite the advantages of ductile design, large displacements of equipment or facilities during seismic action can cause permanent deformation and fall-out of major compartments; also, rapid functional recovery may be difficult. Thus, displacement limits for non-structural equipment or facilities should be included in the design code.
1. Introduction
Earthquake resistant design standard (DS-0050 [1]) and guidelines of electric power facilities consisted of transmission, substation and distribution facilities have recently been updated. The updated guidelines consider maximum ground acceleration equivalent to 10% of the excess probability over 100, 250, and 500 years (drawn as equidistant lines on a hazard map for Korea). These periods and over-probabilities reflect return periods of 1000, 2400, and 4800 years, respectively. In DS-0050, the zonal factors of earthquakes with return periods of approximately 2400 or 4800 years are determined for both existing and new 765-kV electrical power transmission and distribution facilities, to avoid collapse. The maximum peak ground acceleration (PGA) is 0.286 g (ca. 0.3 g). This reflects recent increases in seismic activity on the Korean peninsula. A wide range of stress redistribution over the plate-to-plate contact zone of the huge East-Japan earthquake is still underway. As major facilities, the design of electrical transmission and distribution centers must now consider higher levels of seismic motion. To ensure that concrete anchors meet the seismic provisions, ductile behavior in tension include designs based on the strength of the attachment, which is liable to ductile or brittle failure, and on anchor strength (also liable to ductile or brittle failure). In brittle anchor failure mode, an overstrength factor (Ωo) must be applied to the earthquake component (E) of the factored load [1,2,3,4,5,6]. Most structures allow designs that reduce the base shear force by reflecting the beneficial effects of flexible behavior. This concept prevents loss of life in advance and allows serious structural damage. However, special structures such as power facilities or nuclear facilities need to limit this sort of damage. There are structures that have relatively less impact on its own functionalities during/after a seismic action. Thus, the level of restriction needs to be applied differently in auxiliary structures apart from the main structures (i.e., electrical power transformer/substation, nuclear reactor vessel, and nuclear waste storage structure). Therefore, acceptable damage levels are commonly defined. The response modification factor, R consists of an inelastic energy absorption coefficient, , and an overstrength coefficient . The overstrength may be estimated through pushover analysis. However, depending on the various structural types, it is cumbersome to perform pushover analysis every time, so it may be conservatively omitted. The overstrength coefficient of a general structure is in the range of 2–3.5 and may be expressed as half of the response modification factor. The inelastic energy absorption coefficient, is affected by ductility, strain hardening, hysteresis loop, soil type, deformable mode, etc., and the method of quantifying this is used in four stages [7,8,9,10,11]. Since the 45 degrees cone method for anchoring to concrete, described in ACI 349-85 and PCI Design Handbook, was developed in the mid 1970s, experiments on their performance have been conducted intensively, when various types of anchors with embedded depth, edge distance, and anchor group effects. The method, introduced in ACI 349 and ACI 355 in the late 1980s was developed as a result of experiments at the University of Stuttgart in Germany [12,13]. In the 1990s, this method was improved and presented as a CCD (Concrete Capacity Design) method that can be used conveniently by users and an international database of experimental results was also established during the same period. Since then, the current ACI 318 and ACI 349 design methods are based on the CCD method [12,13,14,15,16]. Along the resisting capacity of the concrete bed, the upper system type is important to determine the response modification coefficient, R. For this, ASCE 7-16 provides response modification factor, R, overstrength factor , and deflection amplification factor, on various upper system such as moment resisting frame, ordinary/special wall and frames, dual system, etc., [3]. This forms the basis of the idea to select the upper structural system in the stage of seismic design. Alternatively, the R, , and can be evaluated in a pushover analysis or test. Once these three factors are determined, the column-base plate-anchor to concrete connection problem may arise in order to make most out of the ductile behavior between them under seismic action. Much research elaborates this traditional issue [17,18,19,20,21,22,23,24,25,26,27,28]. In order to extend the benefit of ductile capacity, the stretched length of steel anchor are often used in silos and containment vessels [29,30]. However, the force-based benefit may result in a severe drift. Given the high level of the PGA, DS-0050 permits ductile anchoring to concrete. The yield mechanisms for ductile failure includes those of the anchor, the anchor attachments, and the facility/equipment; these must be protected to remain functional. We explored the response modification and overstrength factors of an anchor system in terms of brittle and ductile failure. We also compared parametric studies on the tension and shear behaviors of anchor systems in terms of elastic and ductile design using tuned Gyeongju earthquake force data (maximum, 0.3 g).
2. Response Modification and Overstrength Factors
The earthquake responses of structures tend to be greatly reduced by attenuation caused by plastic behavior and/or friction. For modeling, a response correction factor (R) is used. If structural manipulation is expected to significantly reduce any effect of interest, the seismic force can be lowered using that factor. In line with Newton’s law, the maximum inertial force is obtained by multiplying the maximum acceleration by the mass. In Equation (1), A is the acceleration [usually expressed as the effective peak acceleration (EPA, ) during design] divided by the gravitational acceleration g. The earthquake hazard map of Korea shows the maximum ground acceleration equivalent to 10% of the excess probability over 100, 250, and 500 years as equidistant lines. These periods and over-probabilities reflect return periods of 1000, 2400, and 4800 years, respectively. DS-0050 [1] determines the zonal factors for earthquakes with return periods of approximately 2400 or 4800 years, applicable to existing and new 765-kV power transmission and distribution facilities; the goal is to prevent collapse. It is often assumed that the PGA expected in the zone is the zonal factor, but this is incorrect. The zonal factor is usually determined by the EPA; the acceleration responses of short-cycle ( structures affected by earthquakes are divided by 2.5 (Equation (1)).
where and are the component and height amplification factors, respectively and is the effective ground acceleration in the form of . Flexible or high-rise structures with long oscillation cycles are likely to undergo large displacements and be greatly affected by the effect. The base shear force is the total seismic load acting on the bottom part of the structure when that load is converted into an equivalent static load; it is calculated using Equation (2), where is the base shear force and is a dynamic factor as illustrated in Figure 1.
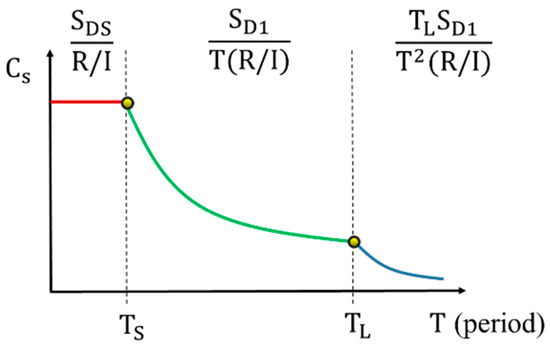
Figure 1.
Dynamic factors in different structural periods, : the design spectral response acceleration parameter at a period of 1.0 s.
If a structure is elastic and subjected to a very large earthquake load, there will be no structural damage. If a structure is inelastic (achieved by lowering the yield strength), the seismic load will also be low because significant plastic deformation will occur; this is likely to cause structural damage. If the yield strength of the structure induces inelastic behavior and the plastic performance prevents major structural damage, the structure can resist earthquakes and the economic burden is minimized. Against this background, the seismic design of structures aims to reduce the yield strength and thus render the structure resistant to earthquakes using structural elements that can withstand plastic deformation. The inelastic energy absorption coefficient (ASCE 43-05 [7]) and ductility are widely used to represent the inelastic response of a structure with elastic behavior (Equation (3)). and are the elastic and yield forces, and and the maximum and yield displacements of the structure, respectively.
A reduction of the structural yield strength to a value lower than the elastic seismic load allows the structure to engage in plastic behavior, although this behavior is not as expected because the structure exhibits overstrength. Therefore, to induce the expected behavior, the design strength must be further reduced by imparting structural overstrength. The base shear force that a structure can resist is usually greater than the design base shear force (the yield base shear force ). This overstrength indicates the extent to which the yield base shear force exceeds the design base shear force. When including overstrength in seismic design, the overstrength coefficient () is used; this is the ratio of the design load to the yield load. Thus, the seismic design criteria determine the value of the inelastic energy absorption coefficient () multiplied by the overstrength coefficient (); this is the response modification factor R (Whittaker et al., 1999, ATC-19, 1995, ASCE 7-16) of Equation (4).
Elastic analysis using the response modification coefficient under a reduced seismic load shows that the displacement does not accurately reflect the inelastic behavior. Therefore, seismic design uses an approximation of inelastic displacement; the deflection amplification factor () is multiplied by the design deflection. During real-world structural design, is exceeded given the cascading increases in cross-section size or back-up mass; this is termed “design overstrength”. As the structural material strength exceeds the nominal strength, the structure behaves elastically under higher lateral forces than expected (“material overstrength”). As the lateral force gradually increases, the structure or its member moves out of the elastic range and can resist the formation of plastic hinges either locally or globally. This is attributable to structural redundancy, and is the “system overstrength” illustrated in Figure 2.
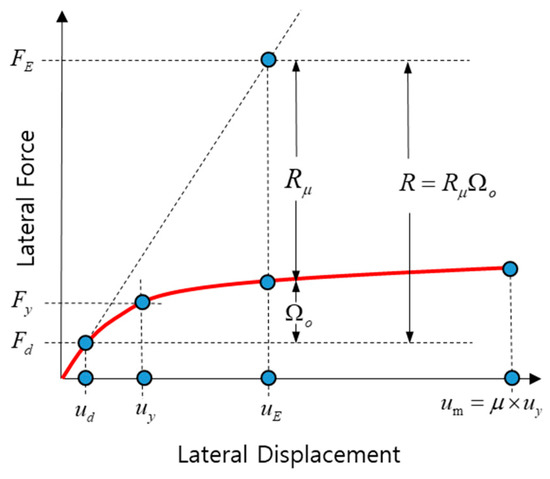
Figure 2.
Response modification, overstrength and ductility.
Equations (5) and (6) are relevant for the design of anchors in compression/tension zones. Care must be taken when using Equations (5) and (6) in the presence of negative vertical acceleration (7) to (10) below due to potential uplift. ASCE 7 defines the load combination when the earthquake load (E) is primary. D, L, and S are the dead, live, and snow loads, respectively. The basic earthquake load E is equivalent to . During elastic design, this horizontal earthquake load can be expressed as , where is a redundancy factor. On the other hand, during ductile design, the horizontal earthquake load can be expressed as , where is an overstrength factor and is set to 1. This reduces the response modification factor R to (the decrease is expressed as ). This increases the horizontal earthquake load, , because of the overstrength imparted by the design, material, and structural systems in a ductile design. Figure 3 shows graphical versions of the load combinations for elastic and ductile design.
where, , , and the resulting load combinations are:
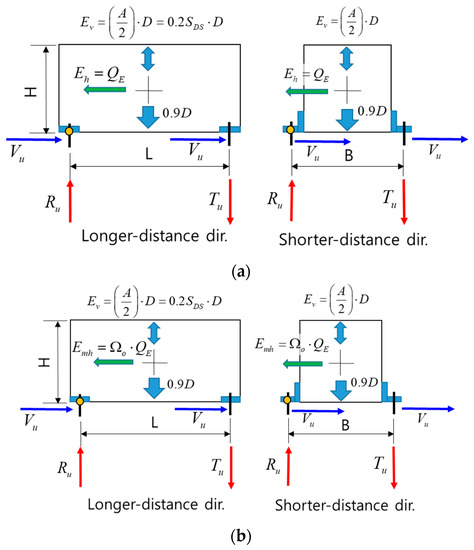
Figure 3.
Load combinations when the primary load is an earthquake. (a) Redundancy factor. (b) Overstrength factor.
3. Pushover Simulation to Quantify the Factors of Interest
Figure 4 shows the anchorage of an arbitrary structure with a wide-flanged steel column (:100 × 100 × 5 × 8 mm) and four M8 anchor bolts.
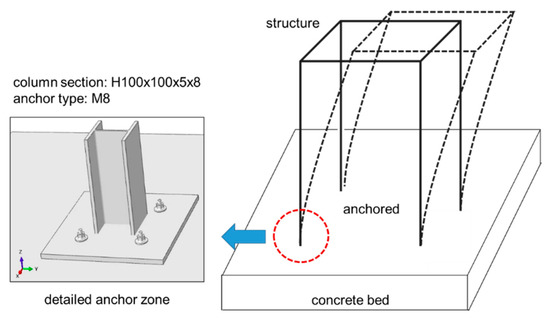
Figure 4.
Anchor zone modeling for the pushover test.
Although localized plastic behavior may differ by system (structure) ductility, redundancy, overstrength, and damping, we focus on the anchor zone shown in Figure 4 to explore variations in base shear forces during the different failure mechanisms of structural elements. The base PL steel plate has dimensions of 300 × 300 × 10 mm and the concrete bed has dimensions of 1000 × 1000 × 200 mm; the anchor embedment is = 72.75 mm. The distance between the anchors is = 150 mm. The yield and ultimate strength of the steel column (SS400) are 235 and 400 MPa, respectively; the corresponding values for the high-tension M8 anchor bolt are 250 and 400 MPa. The bilinear hardening law is applicable to the steel elements. We employ a damage-plasticity model (modified Drucker-Prager model) (Figure 5).
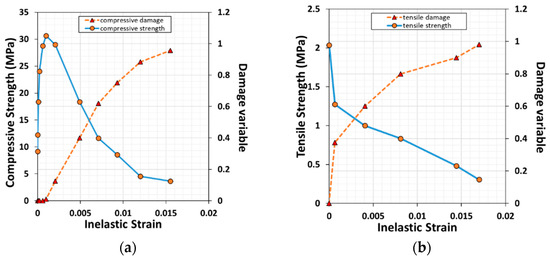
Figure 5.
(a) Inelastic material behavior of compressive concrete. (b) Variations in tensile strength and damage.
The compressive and tensile strengths are 30 and 2 MPa, respectively. The strain softening model for plain concrete is used and the damage along the inelastic strain is defined as strength deterioration. In Figure 6, the anchor zone design is explored in terms of ductile failure (a). ASCE-7 permits other types of ductile failure, i.e., anchor supplement failure (b) and failure of the main structure or non-structural components (c). We applied a pushover test to the anchor zone using different failure mechanisms, to determine if the response modification and overstrength factors change.
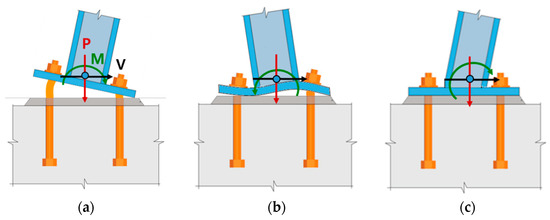
Figure 6.
Sources of ductility in the anchor zone. (a) Anchor yield. (b) Anchor support yield. (c) Structure/equipment yield.
The parametric analyses consider five scenarios: anchor ductile failure, column ductile failure, concrete brittle failure, elastic/inelastic behavior, and all elastic/inelastic materials (Figure 7).
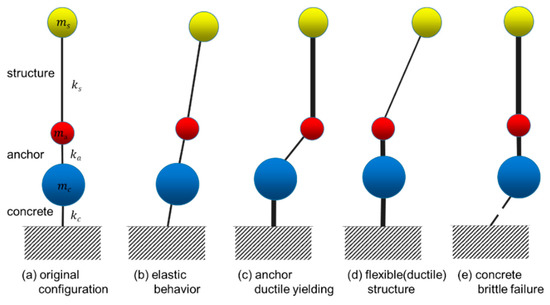
Figure 7.
Pushover simulations for different failure mechanisms.
Figure 8a shows the lateral force vs. displacement curve under various failure scenarios.
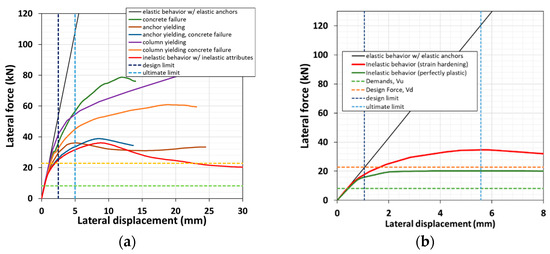
Figure 8.
Pushover simulations. (a) Lateral force vs. lateral displacement under different failure scenarios. (b) Zoomed-in curves of the anchor yielding scenarios shown in (a).
The brittle failure of concrete beds is associated with a high horizontal reaction with a small displacement. During ductile failure, column yielding is much greater than anchor yielding. In addition, both cracked and non-cracked concrete beds influence ductile behavior in terms of stiffness and strength. In Figure 8b, the material overstrength factor is apparent when comparing the strain-hardening and perfectly plastic behaviors, and by examining the inelastic energy absorption factor . Figure 9 shows the maximum von-Mises anchor stress as the yield strength and elastic modulus of the steel column vary.
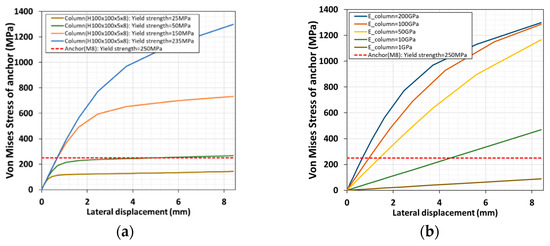
Figure 9.
Pushover simulations. Maximum anchor von-Mises stress vs. lateral displacement under different (a) column yield strengths and (b) column elastic stiffnesses.
As the anchor yield strength is 250 MPa and the anchor is elastic, the main structure experiences swinging vibration. If the structure is stiffer and stronger, the anchor must be larger in diameter and the embedded length must increase; thus, elastic anchors are expensive. The data can be interpreted as the equivalency between the elastic energy and inelastic energy in the lateral force-displacement curve (Figure 2). Figure 10 illustrates the importance of the anchor ductile yield under large lateral displacements; it reduces the reaction (base shear force) of the structure.
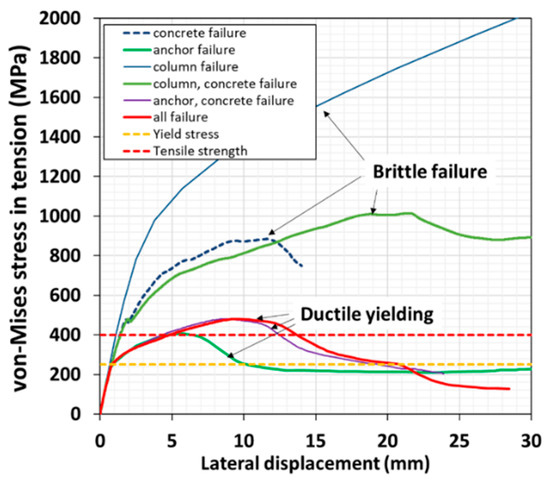
Figure 10.
Pushover simulations. Maximum anchor von-Mises stress vs. lateral displacement curve for different failure scenarios involving a cracked concrete bed.
Figure 11a shows the von-Mises stress contour of the model (ductile anchor yielding in tension) and Figure 11b illustrates the brittle concrete damage (crack) in the vicinity of the steel anchor.
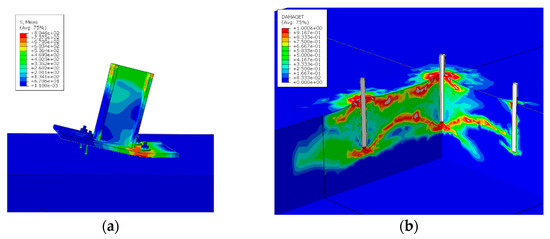
Figure 11.
Pushover simulations. (a) Anchor yield failure. (b) Concrete brittle failure.
Figure 12 shows the measured response modification factor R (5.0) and overstrength factor (material overstrength factor; 1.65). Thus, the inelastic energy absorption factor is 3.0.
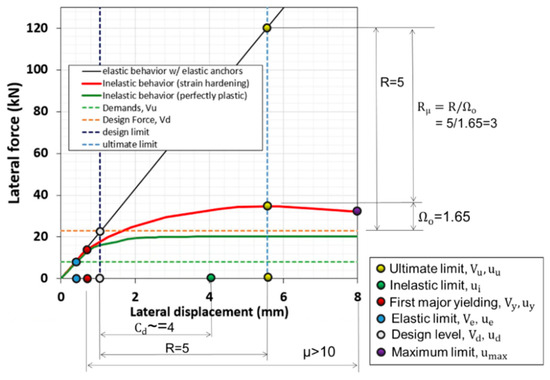
Figure 12.
Pushover simulations. Response modification factor , overstrength factor , and inelastic energy factor .
This reduces the total reaction of the system and the von-Mises stress level of the anchor in the cyclical pushover test (Figure 13).
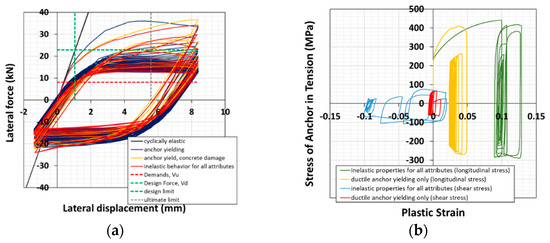
Figure 13.
Cyclic pushover simulations (a) for different failure mechanisms. (b) Normal and shear stresses vs. plastic strain.
4. Dynamic Simulation under DS-0050
In this section, a simplified electrical power transformer (single lumped mass system) with dimensions of 2.2 × 1.5 × 1.2 m is anchored using anchors differing in diameter (M24, M36, and M48) and embedded length (150~450 mm). The weight of the transformer is 1300 kN (132.52 tonnes); this is applied at the center of gravity Figure 14a. The “anchor supplement” is beam-linked to the center of gravity. Surface interactions occur between the bottom face of the anchor supplement and top surface of the concrete. The friction coefficient is set to 0.4. The circumferential surface of the embedded anchor and corresponding inner concrete hole are multiply constrained. The concrete bed has dimensions of 3650 × 3020 × 500 (~700) mm and the anchor embedments are = 150, 300, and 450 mm for M24, M36, and M48, respectively. The anchor steel supplements are a single vertical PL (300 × 140 × 20 mm), a single horizontal PL (140 × 115 × 20 mm), and two triangular PL diaphragms (172 × 115 × 16 mm) Figure 14b.
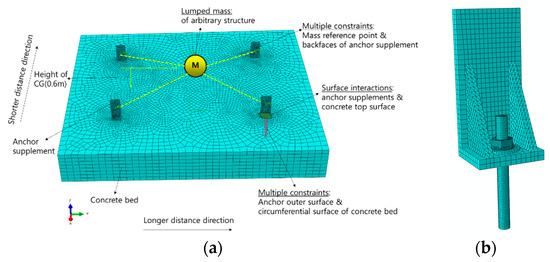
Figure 14.
(a) Finite element model used for dynamic time history analysis under an earthquake load. (b) Model for the anchor and steel supplements.
In order to consider material damage, a nonlinear material model was considered. The Drucker-Prager Cap model was used as a concrete damage model, and its yield surface is shown in Figure 15. This failure surface consists of a shear fracture surface and an equivalent compression fracture surface.
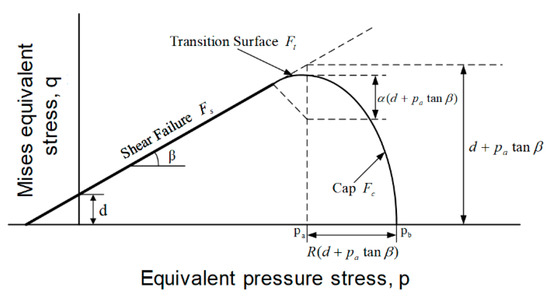
Figure 15.
Failure criterion of Cap plasticity for concrete materials.
This is the shear failure surface (), the compression failure surface () using the end-cap, and the transition surface () to supplement the occlusion continuity by connecting them. The nonlinear strain hardening section represents plastic compression and can control volume expansion.
Here, , , , and is an isotropic confining stress, is a von-Mises equivalent stress, and is a deviatoric. The shear failure surface () is determined as shown in Equation (11) by the internal friction angle , cohesion, and resistance functions for the current deriving stress tensor . As shown in Equation (12), the Cap compression failure surface provides an inelastic mechanism representing compression softening by limiting the fracture surface during isotropic compression, and simulates shear hardening behavior as a function of an inelastic volume increase occurring when concrete materials are fractured. Plastic volume compression (when compressed and yielded from the Cap surface) causes softening, and plastic volume expansion (when yielded from the Drucker-Prager shear failure surface) causes hardening.
Here, R is the material coefficient that controls the cap shape, is the value used to define the smooth transition surface between the shear failure surface and the cap, and is the stress representing hardening/softening that causes plastic volume deformation. The hardening/softening law is a function that defines the relationship between isotropic compression yield stress, and volumetric plastic strain, . For nonlinear steel material, the perfectly plasticity was assigned. The yield and ultimate strength of the steel column (SS400) are 235 and 400 MPa, respectively; the corresponding values for the high-tension anchor bolt (M24, M36, M48) are 250 and 400 MPa. The compressive and tensile strengths are 30 and 2 MPa, respectively. The progressive tension and compression damage were used as shown in Figure 5. The surface interaction between concrete bed and anchor plate was modeled a master-slave surface interaction with friction (0.4) and no overlapping is allowed. Since no reinforcement was model in concrete bed, the interaction property between steel anchor and concrete bed was modeled a master-slave surface interaction with tie option.
Data for the Gyeongju earthquake (Richter scale = 5.8) occurring in South Korea in 2016 were analyzed after tuning to a maximum PGA of 0.3 g (Figure 16).
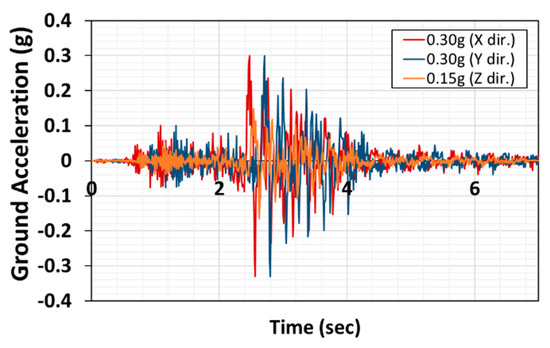
Figure 16.
The measured Gyeongju earthquake data (scaled to a maximum of 0.3 g).
The input motion changed on initial zero padding of the time axis. This reduced the correlations among the three different directional inputs when the input motions were simultaneously applied. Correlations among the motions were calculated using Equation (13) and were 0.4%, 0.048%, and 0.043% for X vs. Y, Y vs. Z, and X vs. Z, respectively. Therefore, the three orthogonal input motions are almost completely decoupled. Below, we discuss the structural responses to these simultaneously input motions and the ASCE 7 100:40:40 combination of individual input motions.
Figure 17 shows the pushover simulation results obtained with M24 anchors and regular (intact) steel supplements; we present the lateral force-displacement curves associated with different failure mechanisms.
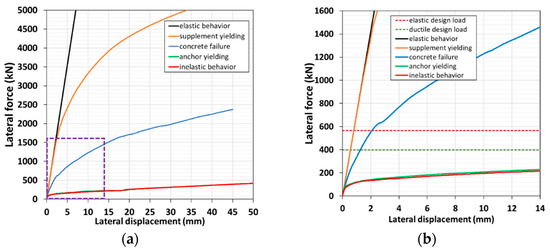
Figure 17.
Pushover simulation of the entire model. (a) Simulation with different failure mechanisms. (b) Zoomed-in view of (a).
The inelastic behaviors (all of which are nonlinear) exhibit much lower reactions than the elastic restoring forces. The case in Figure 17 highlights the large difference.
The mass of the structure is lumped at a single reference point (the center of gravity) and the structure is rigid. The ductility is derived from only the anchors and their supplements. Figure 17b indicates that the elastic, ductile design load limits are 586 and 398 kN, respectively. The nonlinear pushover simulation reveals a lateral force of 200 kN when the lateral displacement is about 15 mm, which is considerably less than the load design limits. The longitudinal tensile forces acting on each anchor are shown in Figure 18.
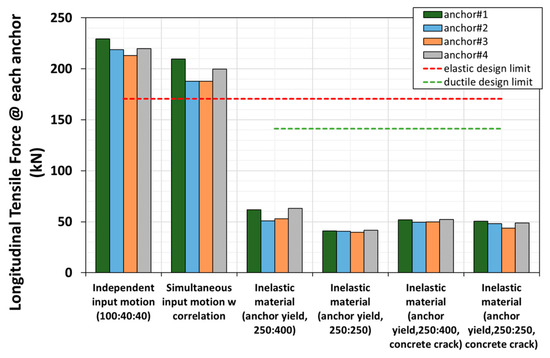
Figure 18.
Anchor forces under tension (M24, pushover analyses).
The elastic pushover simulation reveals that the independent (100:40:40) and simultaneous motions are associated with average anchor forces of 225 and 180 kN, respectively; the elastic design limit is 170 kN. Therefore, the M24 anchor is unsatisfactory. However, using a ductile design, the average anchor force is around 50 kN, which is satisfactory; the design limit is 141 kN. Figure 19 shows that all of the anchor shear forces satisfy both the elastic and ductile design limits.
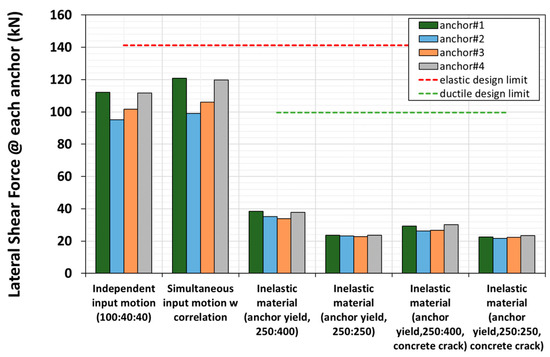
Figure 19.
Anchor forces under shear (M24, pushover analyses).
During elastic/nonlinear time history analyses, simultaneous input motions (x: 0.3 g, y: 0.3 g, z: 0.15 g) were applied in three orthogonal directions. The time histories of inertia forces and displacement at the center of gravity (elevation from concrete bed = 0.6 m) are shown in Figure 20.
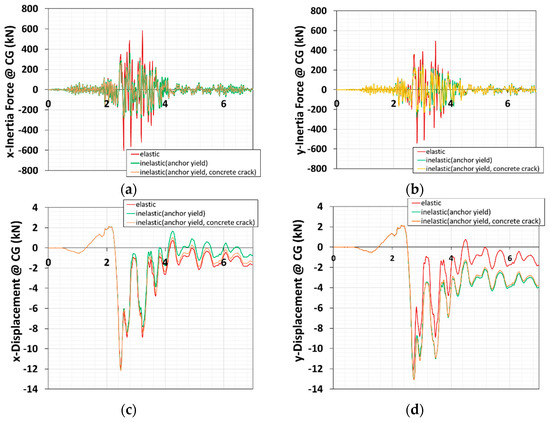
Figure 20.
Lateral inertial forces: (a) x dir., (b) y dir. and displacements: (c) x dir., (d) y dir. at the center of gravity.
The lateral inertial force at the center of gravity was calculated via finite element analysis. Figure 21 shows the horizontal earthquake load; = 586 kN bounds both the elastic and ductile behaviors of the system.
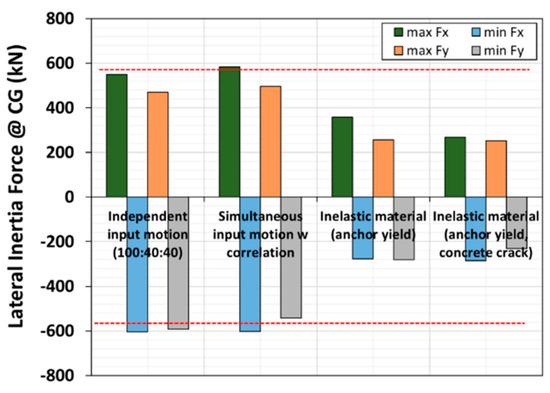
Figure 21.
Lateral inertial forces at the center of gravity (M24, dynamic analyses).
The lateral displacement is about 12~13 mm (Figure 22).
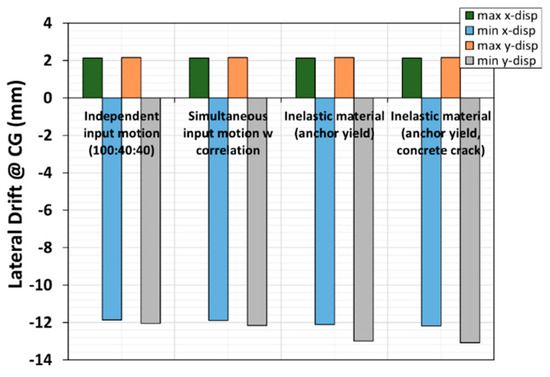
Figure 22.
Lateral drift at the center of gravity (M24, dynamic analyses).
The von-Mises stress is drastically reduced when ductility is present; simultaneous, correlated input motions exert effects that differ from those of independent input motions under the 100:40:40 ratio (Figure 23).
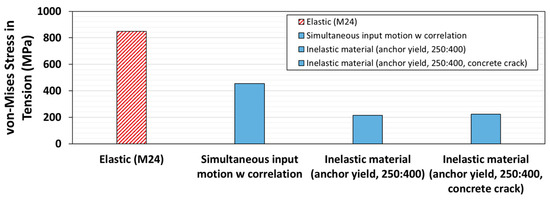
Figure 23.
Maximal von-Mises stress variations of the anchor: results of elastic and inelastic time history analyses.
Contour plots of the anchor zone are shown in Figure 24a–d. The compression/tension damage is confined to the vicinity of the concrete hole and the bottom of the anchor rod. The von-Mises/shear stress distribution indicates that the highest stress develops in the fixture zone (the washer-nut zone) and the friction-resistant zone around the anchor at the top of the concrete surface.
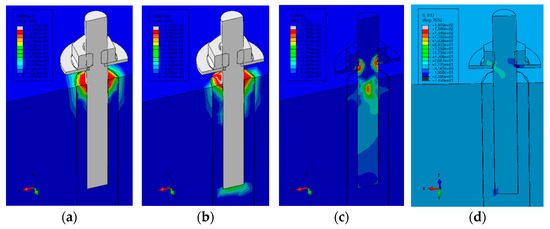
Figure 24.
Contour plots of the anchor zone. (a) Tensile damage, (b) Compressive damage, (c) von-Mises stress, (d) Shear stress, .
When incorporating the M24 anchor system (= 150 mm) into an elastic design, it is possible to increase the anchor diameter to M36 ( = 300 mm) or M48 (= 450 mm). The M24 anchor yields under the current 0.3 g standard for the earthquake load. The M36 system just reaches the yield limit; the M48 system exhibits a yield strength of 70% (Figure 25a).
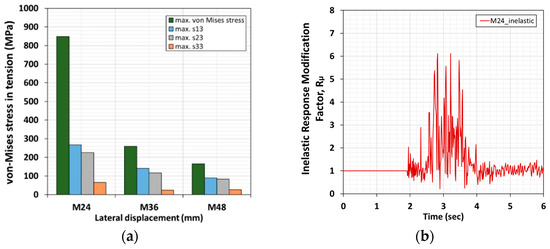
Figure 25.
(a) von-Mises stress variations with anchor size. (b) Response modification factors measured during an earthquake.
Figure 25b shows that the inelastic energy absorption factor ranges up to about 6 during a 0.3-g earthquake. Figure 26 shows the reductions in von-Mises stress caused by (a) ductile anchor yield and (b) enlarged anchor diameters and embedded lengths. We do not discuss the alternative methods here.
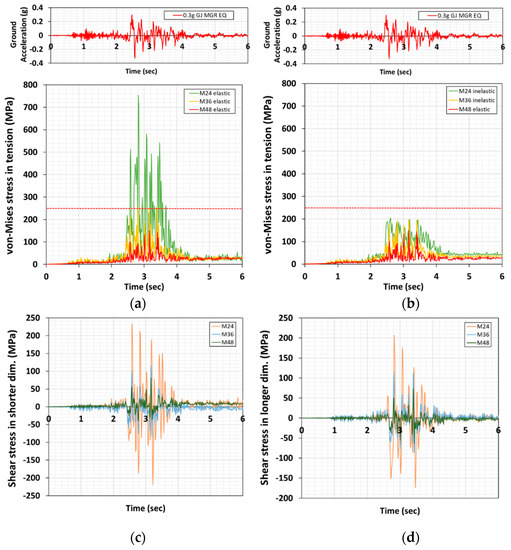
Figure 26.
von-Mises stress variations with anchor size. (a) Elastic and (b) inelastic shear stress in the direction of the shorter dimension (c) and longer dimension (d).
5. Conclusions
DS-0050 has been updated to determine the zone factors for earthquakes with return periods of approximately 2400 and 4800 years, for existing and new 765-kV electrical power transmission and distribution facilities; anti-collapse is prioritized. The maximum PGA is ca. 0.3 g. Given this high PGA, DS-0050 permits the use of ductile design for anchoring to concrete. We explored and evaluated how the different yield mechanisms of anchors in concrete handle ductile failures; we evaluated the anchor itself, and the anchor attachments and associated facilities/equipment. These components must all be protected and continue to function. The pseudo-static pushover and elastic/inelastic dynamic tests revealed that a ductile design efficiently reduces seismic demands. It was confirmed through parametric pushover analyses that the ductile behavior according to the nonlinearities of concrete or steel materials significantly reduces the lateral seismic force compared to the elastic design-based behavior. The greater the strength/rigidity of the upper structure, the greater the tensile and shear force acting on the anchor, which puts a burden on the anchor. Among the parametric failure scenarios, the anchor yielding showed the greatest reduction in lateral seismic force. The system overstrength is determined by the maximum tensile strength according to the yield of the superstructure or anchor itself. Thus, it is necessary to determine the overstrength by fabrication type of an upper structure. ASCE 7-16 presents response modification coefficients, overstrength coefficients, and deflection amplification coefficients according to various superstructure formats (building structures, non-building structures, equipment/facilities, etc.), but if not presented, pushover test or analysis are required. Therefore, it is necessary to consider a conservative method of applying only the nonlinear energy absorption coefficient without considering the problematic overstrength coefficient for structures that require structural damage limit level or service limit level. In the dynamic analysis, 3-directional excitations (x: 0.3 g, y: 0.3 g, and z: 0.15 g) for a simplified electric transformer model (size: 2.2 × 1.5 × 1.2 m, center of gravity = 0.6 m) were applied. The lateral seismic force generated in the center of gravity was similar to the equivalent static load presented in ASCE 7-16, and the anchor forces have been changed from ductile behavior to elastic behavior according to anchor diameters (M24, M36, M48). In the case of elastic design, the tensile force of the anchor was four times larger than the shear force of the anchor. In the case of ductile design, it was found that the tensile force and shear force of the anchor were similar to each other. As the DS-0050 design criteria are based on strength design, no displacement limits for non-structural facilities/equipment are given. Despite the advantages of ductile design, large displacements of equipment or facilities during seismic action can cause permanent deformation, fall-out of major compartments, and difficulties in terms of rapid functional recovery. To avoid these problems, displacement limits for non-structural equipment or facilities should be included in the completed design code.
Author Contributions
The authors state that this paper has been authored in equal contribution with the following details: Conceptualization, methodology, software, J.-M.K.; validation, formal analysis, investigation, data curation, writing—original draft preparation, I.R.; writing—review and editing, funding acquisition, supervision, J.-M.K.; project administration, funding acquisition, N.C. All authors have read and agreed to the published version of the manuscript.
Funding
This research was supported by the Ministry of Trade, Industry & Energy (MOTIE) of Korea (No. 20193110100020).
Institutional Review Board Statement
Not applicable.
Informed Consent Statement
Not applicable.
Data Availability Statement
Data sharing is not applicable to this article.
Conflicts of Interest
The authors declare no conflict of interest.
References
- Korea Electric Power Corporation. Earthquake Resistant Design Standard of Electric Power Facilities (DS-0050); Korea Electric Power Corporation: Naju, Korea, 2021. [Google Scholar]
- American Concrete Institute. Building Code Requirements for Structural Concrete and Commentary (ACI 318-14); American Concrete Institute: Farmington Hills, MI, USA, 2014; Chapter 17; pp. 221–261. [Google Scholar]
- American Society of Civil Engineers. Minimum Design Loads and Associated Criteria for Buildings and Other Structures (ASCE/SEI 7-16); American Society of Civil Engineers: Reston, VA, USA, 2016; p. 889. [Google Scholar]
- Ministry of Land, Infrastructure and Transport. Anchoring to Concrete (KDS 14 20 54); The Korea Communications Standards Commission: Seoul, Korea, 2016; pp. 1–16. (In Korean) [Google Scholar]
- FEMA. 2015 NEHRP Recommended Seismic Provisions: Design Examples (FEMA P-1051), Building Seismic Safety Council; A Council of the National Institute of Building Sciences: Washington, DC, USA, 2016; p. 995. [Google Scholar]
- Morgan, R.T. Changes in ACI 318 Anchoring to Concrete Seismic Provisions. Struct. Mag. 2016, 24–27. [Google Scholar]
- American Society of Civil Engineers. Seismic Design Criteria for Structures, Systems, and Components in Nuclear Facilities (ASCE/SEI 43-05); American Society of Civil Engineers: Reston, VA, USA, 2005; p. 81. [Google Scholar]
- European Organisation for Technical Appovals. Design of Metal Anchors for Use in Concrete under Seismic Actions, EOTA TR45; European Organisation for Technical Assessment: Brussels, Belgium, 2013; pp. 1–16. [Google Scholar]
- Ishiyama, Y. Introduction to Earthquake Engineering and Seismic Codes in the World; Hokkaido University: Sapporo, Japan, 2011; pp. 1–115. [Google Scholar]
- Julián, C.; Hugo, H.B.; Astrid, R.F. Analysis of the Earthquake-Resistant Design Approach for Buildings in Mexico. Ing. Investig. Y Tecnol. 2014, 14, 151–162. [Google Scholar] [CrossRef]
- Johnson, T.P. Evaluation of Seismic Overstrength Factors for Anchorage into Concrete of Nonstructural Components. Ph.D. Thesis, University of California, San Diego, CA, USA, 2017. [Google Scholar]
- American Concrete Institute. Guide to the Concrete Capacity Design (CCD) Method-Embedment Design Examples (ACI 349.2R-07); American Concrete Institute: Farmington Hills, MI, USA, 2007; p. 95. [Google Scholar]
- American Concrete Institute. Guide for Design of Anchorage to Concrete: Examples Using ACI 318 Appendix D (ACI 355.3R-11); American Concrete Institute: Farmington Hills, MI, USA, 2011; p. 128. [Google Scholar]
- Korean Concrete Institute. Guide and Examples for Design of Anchorage to Concrete (Written in Korean), 2nd ed.; KCI: Seoul, Korea, 2018; pp. 1–343. [Google Scholar]
- Eligehausen, R. Behavior, Design and Testing of Anchors in Cracked Concrete, ACI SP 130-5. Univ. Stuttg. 1991, 53, 123–175. [Google Scholar]
- Eligehausen, R.; Bouska, P.; Cervenka, V.; Pukl, R. Size effect of the concrete cone failure load of anchor bolts. In Fracture Mechanics of Concrete Structures: FraMCoS1; Elsevier Applied Science: London, UK, 1992; pp. 517–525. [Google Scholar]
- Hoehler, M.S.; Mahrenholtz, P.; Eligehausen, R. Behavior of Anchors in Concrete at Seismic-Relevant Loading Rates. ACI Struct. J. 2011, 238–247. [Google Scholar]
- Eligehausen, R.; Sharma, A.; Hofmann, J. On Seismic Safety Issues of Cast-in and Post-Installed Anchors in Nuclear Power Plants. In Proceedings of the Technical Innovation in Nuclear Civil. Engineering—TINCE 2013, Paris, France, 28–31 October 2013. [Google Scholar]
- Hariyadi, M.S.; Sonoda, Y. Experimental analysis of anchor bolt in concrete under the pull-out loading. Procedia Eng. 2017, 171, 926–933. [Google Scholar] [CrossRef]
- Ožbolt, J.; Elighausen, R.; Reinhardt, H. Size effect on the concrete cone pull-out load. Fract. Scaling 1999, 95, 391–404. [Google Scholar] [CrossRef]
- Bogdanić, A.; Casucci, D.; Ožbolt, J. Numerical andExperimental Investigation on Concrete Splitting Failure of Anchor Channels. CivilEng 2021, 2, 502–522. [Google Scholar] [CrossRef]
- Spyridis, P.; Olalusi, O.B. Predictive Modelling for Concrete Failure at Anchorages Using Machine Learning Techniques. Materials 2021, 14, 62. [Google Scholar] [CrossRef] [PubMed]
- Fisher, J.M.; Kloiber, L.A. Base Plate and Anchor Rod Design, 2nd ed.; American Institute of Steel Construction: Chicago, IL, USA, 2006; pp. 1–69. [Google Scholar]
- Lee, D.-Y.; Goel, S.C.; Stojadinovic, B. Exposed Column-Base Plate Connections Bending About Weak Axis: I. Numerical Parametric Study. Steel Struct. 2008, 8, 11–27. [Google Scholar]
- Lee, J.H.; Lim, J.E. Nonlinear Analysis of Cyclically Loaded Concrete-Steel Structures Using an Anchor Bond-Slip Model. KSCE Struct. Eng. 2009, 29, 495–501. [Google Scholar]
- Tsavdaridis, K.D.; Shaheen, M.A.; Baniotopoulos, C.; Salem, E. Analytical Approach of Anchor Rod Stiffness and Steel Base-Plate Calculation under Tension. Structures 2016, 5, 207–218. [Google Scholar] [CrossRef]
- Kang, H.; Kim, J. Response of a steel column-footing connection subjected to vehicle impact. Struct. Eng. Mech. 2017, 63, 125–136. [Google Scholar]
- Díaz, H.; Nuñez, E.; Oyarzo-Vera, C. Monotonic Response of Exposed Base Plates of Columns: Numerical Study and a New Design Method. Metals 2020, 10, 396. [Google Scholar] [CrossRef]
- Dizhur, D.; Simkin, G.; Giaretton, M.; Loporcaro, G.; Palermo, A.; Ingham, J. Performance of winery facilities during the 14 November 2016 Kaikōura earthquake. J. Bull. N. Z. Soc. Earthq. Eng. 2017, 50, 206–207. [Google Scholar]
- Crawford, K.N. Standard Seismic Resistant Details for Industrial Tanks and Silos; Murray-North Limited: Auckland, New Zealand, 1990; pp. 1–74. [Google Scholar]


Publisher’s Note: MDPI stays neutral with regard to jurisdictional claims in published maps and institutional affiliations. |
© 2021 by the authors. Licensee MDPI, Basel, Switzerland. This article is an open access article distributed under the terms and conditions of the Creative Commons Attribution (CC BY) license (https://creativecommons.org/licenses/by/4.0/).