Abstract
In outcome-based academic programs, Program Education Objects (PEOs) are the key pillars on which program components are built. They are articulated linguistically as broad statements of graduates’ professional and career accomplishments within a few years of graduation. Moreover, PEOs are mapped into a set of skills and attributes known as Program Learning Outcomes (PLOs). It goes without saying that a profound understanding of the PEOs is a key factor in the success of an academic program. For this sake, this paper proposes a data analytics-based approach to examine the correlations among PEOs. More specifically, it applies a data similarity-based approach to analyze the correlations among the PEOs of engineering programs. To this end, a dataset of PEOs–PLOs mapping of a set of engineering programs has been extracted from their self-study reports. The collected dataset has undergone preprocessing steps to transform it into a suitable representation. This involves data cleaning, data annotation using a developed set of PEOs labels, and removal of data instances with multiple PEO labels. Each PEO is then represented as a vector space model whose dimensions are the PLOs, and their values are the relative frequencies of PLOs computed from all data instances of that PEO. After that, three data similarity measures, namely Euclidean distance, cosine measure, and Manhattan distance, are applied to measure the similarity between PEOs vector space models. The resultant similarity matrices are then analyzed at the level of a specific measure, an agreement between measures, and average similarity across all measures. The analysis results contribute to a better understanding of the PEOs correlations and provide very useful actionable insights for empowering decision making toward systemization and optimization of academic programs processes.
1. Introduction
Over the past century, the ability of education systems to equip graduates with the necessary professional and career skills needed for the 21st century has been questioned [1,2]. Consequently, the need for an effective education system that focuses on the potential and actual abilities of the graduate has become more crucial. In response to this need, several reformation attempts of the traditional education systems have been made since 1950, among which Outcome-Based Education (OBE) is the most prominent. According to Spady [3], the prime mover of the OBE, developing an OBE system requires identifying a clear set of learning outcomes, around which all the system activities are centered, and establishing the conditions and opportunities within the system that enable and encourage all students to achieve those essential outcomes. Currently, the OBE approach is becoming prevalent in higher education academic programs. It is realized through identifying three types of outcomes: PEOs, PLOs, and Course Outcomes (COs) [4]. Although PEOs describe, in broad statements, career and professional accomplishments that the program is preparing its graduates to achieve, PLOs describe, in narrower statements, the knowledge, skills, and behaviors those students are expected to attain by the time of graduation [5]. Similarly, COs are statements that describe the knowledge, skills, and behaviors students are expected to attain as a result of taking a course. Figure 1 depicts the PEOs, PLOs, COs, and their correlations [6].
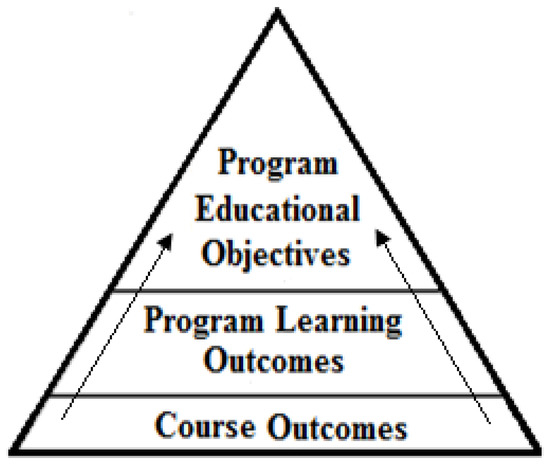
Figure 1.
PEOs, PLOs, COs, and their correlations.
Conceptually speaking, PEOs collectively represent a broad vision of the program that inform all its activities [7]. They serve as an important nexus point to assess the program; the point at which curriculum, faculty, facilities, and other programmatic components are viewed within a large context of a program’s stockholder’s needs and the mission of the institution [8]. Broadly speaking, PEOs play a key role in a program’s continuous improvement and provide a mean for the academicians to define what continuous improvement means for the program [9]. Practically speaking, PEOs are developed by program constituencies and expressed linguistically as short statements that describe graduate attributes and accomplishments within a few years of graduation. Typically, these attributes fall within the following categories [9]: technical skills, professional, ethical, communication aspects, management and leadership, lifelong learning and continuous education, advanced and graduate studies pursuing, etc. In addition, PEOs must be mapped into a predefined set of PLOs, which are developed by educational authorities or accreditation agencies [6,10]. The PEOs must be assessed periodically to continuously improve the program [7,11].
Given the hierarchical structure of academic program and the key role of the PEOs in this structure, it is hypothesized that a profound understanding of PEOs at the conceptual as well as the practical level is essential for a successful design and implementation of its processes [12]. A particular aspect in program structure that merits a thorough investigation is the internal structure of PEOs in terms of the correlation among them. It is expected that the outcome of this investigation would contribute to a better understanding of PEOs correlations, and ultimately lead to more informed systemization and optimization of different processes of academic programs. Unfortunately, as ascribed in [7,9], the literature paid very little attention to the study PEOs. Even accreditation bodies, such as the Accreditation Board for Engineering and Technology (ABET), provide little in the way of concrete guidelines for what should be included in the PEO, nor for the processes of generating and assessing them.
Recently, data analytics approaches, particularly learning analytics (LA), are being used actively for a wide range of purposes in tertiary education, to enhance the learning process, evaluate efficiency, improve feedback, enrich the learning experience and support decision making [13]. In this paper, the power of learning analytics is leveraged to deepen the understanding of PEOs by analyzing the correlation among them. More specifically, this paper applies data similarity methods to analyze the correlations among the PEOs of engineering programs. To do so, a dataset of PEOs of ABET accredited engineering programs has been collected. The PEOs, which are mapped into a set of PLOs developed by ABET, are processed, and represented as vector space models, in terms of ABET PLOs, to measure the correlation among them. Besides the actionable insights that can be obtained from this investigation, computing similarity among PEOs is essential practice for developing practical PEOs-based applications, such as clustering, recommendation and visualization.
The remaining sections of this paper review the relevant works, describe the general methodology of computing data similarity, describe the specific methodology of computing similarities among PEOs, present and discuss the obtained results, and finally conclude this paper.
2. Related Works
The vast amount of data available in digital repositories has provoked the emergence of data mining, as analytical tools can be used to extract meaningful knowledge from such data. Data mining has already been successfully applied to many domains, including medicine, business, robotics and computer vision, to name just a few [14,15]. Likewise, the constant upsurge of data in educational institutions has given rise to the emergence of educational data mining and LA, with a focus on developing, researching and applying computer-based methods to discover patterns in large educational data collections that would otherwise be difficult or impossible to analyze [13,16]. The increasing interest in the two fields is demonstrated by the increase in research of applying data mining methods to data from a variety of educational repositories.
In many applications, computing data similarity is required and normally used by Machine Learning (ML) algorithms, particularly those that deal with clustering, recommendation and dimensionality reduction [14]. In education data mining, data similarity methods have many applications, particularly in adaptive learning systems and recommendation systems. For example, in automatic recommendation systems, similarity measures are extensively used for clustering of educational items or users [17]. In addition, data similarity measures are found to be useful for a better understanding of educational processes and providing decision-makers with actionable insights [18].
The applications of data similarity to educational data have been reported in various contexts. In the programming domain, data similarity approaches are explored to select a set of the most relevant remedial programming items and worked-out examples to support students who have trouble solving a code comprehension problem in the Java language [19]. In the same domain, a content-based similarity approach is applied to provides personalized access to a repository of programming examples through adaptive visualization [20]. An additional example of data similarity application in the programming domain is reported in [21], which focuses on similarity among non-graded items such as an explanatory text and videos. To measure the similarity between educational items involving both text and images, a similarity measure is proposed in [22] to measure the similarity between items based on a representation computed by a neural network. The proposed measure is suitable for the mathematical domain, where items containing both text and images are commonly used. In the mathematical domain, the similarity of word problems is specifically studied in [23]. Moreover, similarity and clustering of users in mathematics learning system is studied in [24], where the whole processing pipeline for computing similarity is described in detail.
Similarly, data similarity measures are also used to analyze educational item (questions, problems) similarities for many purposes: to be used as input with clustering or visualization techniques [17]; to detect plagiarism in online exams, particularly cheating in essay questions, multiple-choice questions, and fill-in-the-blank questions [25]; to measure the degree of similarity for Indonesian essay assessment [26]; to group documents or contributions to identify the sub-topics and topic evolutions in the graduate discussion forums [27]; to compare students navigation behavior in different dimensions [28].
The review of the above-related works reveals the wide variety of contexts where data similarity methods can be employed, as well as the variety of data similarity measures that can be applied. Another variety of choices in applying data similarity methods is whether to compute data similarity via features or directly from the data. In the case of computing data similarity from features, a transformation of the data is performed. Moreover, the review reports that in most domains, measuring item similarity is not a clearly defined problem, and therefore there is no single correct measure of data similarity; a common practice is to use multiple measures. In these settings, it is hard to answer a general question such as which measure is better or worse. Nevertheless, questions such as: “Which choices in the similarity computation are the most important?”, “Which measures are highly correlated (and thus it is not necessary to consider both of them)?”, “How much data do we need for similarity measures to be stable?” can be explored [18].
Considering all the aforementioned drawn findings from the previous applications of data similarity measures, this paper explores the application of data similarity measures in a new educational context that is the correlation among educational objectives of academic programs. The outcomes of this application would contribute to a better understanding of the PEOs and provide useful actionable insights for the decision-makers for better planning and implementation of academic programs.
3. The Methodology of Computing Data Similarity
Figure 2 shows the basic outline of the methodology of data similarity, which starts with data collection, followed by data preparation, data similarity measure, and finally the target application. In the first step, the raw data are collected and used to create the target dataset. In the data preparation step, the target dataset is cleaned and preprocessed to obtain consistent data. It also involves a transformation of the data into a feature matrix in which rows correspond to data items and columns to features. Generally, the representation of a feature matrix depends on the type of data and the application domain. It can be, for example, based on the bag-of-words model, vector space model, etc.
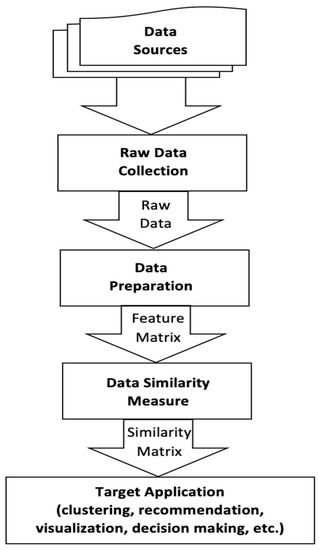
Figure 2.
Methodology of computing data similarity.
Having obtained the features matrix, the data similarities can be computed from it. In this step, a similarity measure is applied to compute the similarity of every pair of items by computing the similarity between the vectors space models that represent this pair of items in the feature matrix. The output of this step is a similarity matrix in which each value represents the degree of similarity between a particular pair of items. In data mining, computing the similarity of vectors is a common operation with many choices available. The common choices are cosine similarity, the Pearson correlation coefficient and Euclidean distance (transformed into a similarity measure by subtraction). In the case of binary data, similarity measures such as Pearson, Sokal, and Jaccard measures are applicable [14]. It is worthwhile mentioning that the choice of data similarity measure is domain-specific, and therefore it is difficult to give a verdict on a question such as which measure is better or worse in a general setting. After the computed similarity matrix is obtained, it can be used by the target applications. In this step, the similarity matrix is processed by other computational algorithms, particularly ML algorithms such as clustering algorithms and dimensionality reduction algorithms. Examples of target applications include adaptive learning systems and automatic recommendations of activities. In addition, the computed similarity matrix provides useful and actionable insights for the practitioners and decision-makers as well. In the following section the details of applying the above-described methodology to compute the similarity between the PEOs of engineering academic programs is given.
4. Computing PEOs Similarity
The general methodology described in the above section is employed to answer the research question on the correlations among PEOs of engineering programs as follows.
4.1. Raw Data Collection
The raw data are a collection of mapping data between PEOs and Student Outcomes (SOs), ABET coined term of PLOs, of a set of engineering programs accredited by ABET-Engineering Accreditation Commission (EAC). The data are extracted from the self-study report of each program. The self-study report is a primary document submitted by a program seeking accreditation. As per ABET-EAC, a program seeking accreditation must develop its PEOs and map them to 11 SOs (a to k) developed by the commission. In this work the PEOs-SOs mapping data are collected from the SSRs of 215 engineering programs accredited by ABET-EAC between 2000 and 2019. It should be noted that collected raw data have been used by the authors in several previous pieces of research [29,30], and more details can be found in [31]. Figure 3 is a snippet of the PEOs-SOs data.
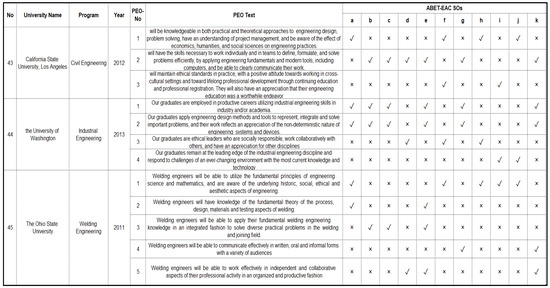
Figure 3.
Snippet of the Raw PEOs-SOs data.
4.2. Data Preparation
In this step, the selected data are cleaned and preprocessed to obtain consistent data. The data cleaning involves substantial verification and validation of the content. The data preparation involves transforming each PEO text into labels representing the graduate’s attributes expressed in its text. For this purpose, a set of PEOs labels is developed. As pointed out earlier, PEOs cover the followings attributes: technical skills, professional, ethical, communication aspects, management and leadership, lifelong learning and continuous education, advanced and graduate studies pursuing and other aspects. Based on PEOs wordings of several engineering programs, the following PEOs labels, as shown in Table 1, have been identified.

Table 1.
PEOs Label Set.
The identified PEOs label set is then used to annotate data instances with single or multiple PEOs labels, and then each multi-label data instance is removed from the dataset. Figure 4 shows a snippet of this annotated PEOs-SOs dataset. Using the annotated PEOs-SOs dataset, PEOs feature matrix is computed as vector space models. The vector space model of each PEO is computed as the relative frequencies of every SO over all its data instances. Table 2 shows PEOs represented as vector space representations (features matrix).
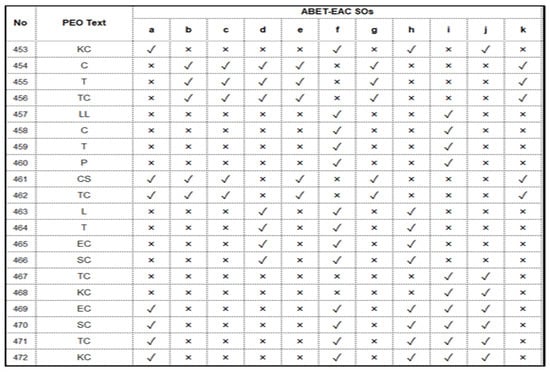
Figure 4.
Snippet of the annotated PEOs-SOs dataset.
Table 2.
PEOs vector space representation (features matrix).
4.3. PMs-PEOs Correlations Measuring
As mentioned above, in most domains, there is no single correct measure of data similarity. Therefore, for some applications, it may be useful to work with several similarity measures [18]. In this work, three data similarity metrics, namely Euclidean distance, cosine similarity, and Manhattan distance, are applied [14,15,32].
4.3.1. Euclidean Distance
Euclidean distance (ED) measure is a standard metric for geometrical problems. It is the straight-line distance between two data points and can be easily measured with a ruler in two- or three-dimensional space. It is widely used in data mining tasks such as clustering problems [33]. The Euclidean distance between two data points X = (x1…xn) and Y = (y1…yn) is defined as follows:
An interesting property of the ED measure is that it is rotation-invariant, as the straight-line distance between two data points does not change with the orientation of the axis system [14]. This property means that transformations, such as Principal Component Analysis, Singular Value Decomposition, or the wavelet transformation for time series, can be applied to the data without affecting the distance. The intuitive interpretability of the ED measure is another interesting property. Despite this, the ED measure is not the most relevant one, especially for the high-dimensional case, because of the varying impact of data sparsity, distribution, noise, and feature relevance.
4.3.2. Manhattan Distance
The Manhattan distance (MD) measure is the “city block” driving distance in a region in which the streets are arranged as a rectangular grid, such as the Manhattan Island of New York City. The MD measure has much in common with the ED measure; in fact, they are both particular cases of Minkowski distance [14]. Therefore, it has the same interesting properties and rotation-invariant and interpretability as the ED measure and suffers in high-dimensional cases. Given two data points X = (x1…xn) and Y = (y1…yn), the MD measure is defined as follows:
4.3.3. Cosine Measure
The Cosine Similarity (CS) measure is mostly used in document similarity [15]. It computes the angle between the two data points, which is insensitive to the absolute length of the vector. Given the two data points in vector representation, X = (x1…xn) and Y = (y1…yn), the CS measure is defined as follows.
The CS measure is invariant to the rotation but is variant to linear transformations. It is also independent of vector length [32].
5. Results and Discussion
This section presents and discusses the results of applying the three data similarity measures to compute the similarity between PEOs. Table 3, Table 4 and Table 5 show the similarity of PEOs based on the ED, MD and CS measures, respectively. For the sake of illustration, a heatmap data visualization technique is used to represent the similarity values in different colors. As mentioned above, the ED measures the straight distance between points, hence, theoretically, its values fall in the range between zero and infinity. In Table 3, the ED’s values range between 0 (identical pair of PEOs) and 0.43 (the most dissimilar pair of PEOs). As for MD, this measures the distance between the vector space of two points in terms of the number of horizontal and vertical units between them, hence, theoretically, its values fall in the range between zero and infinity. In Table 4, the MD’ between the PEOs vector spaces ranges between 0 (identical PEOs) and 1.35 (the most dissimilar pairs of PEO). Finally, the CS measures the cosine of the angle between the vector spaces of two points, hence, theoretically, its values fall in the range between zero and infinity. In Table 5 the CS’s values of the PEOs vector space models range between 0.38 (the most dissimilar PEOs) to 1 (identical pair of PEOs).
Table 3.
Euclidean distance among PEOs.
Table 4.
Manhattan distance among PEOs.
Table 5.
Cosine Similarity among PEOs.
Despite the different mechanisms of measuring similarity and different measurement scales, of the three measures the heatmap visualization of the three measures reflects the degree of consistency between them. Virtually, the three measures show a sort of consistency among them in their evaluation of the similarity between PEOs. However, to quantitatively evaluate the degree of consistency between the three measures, the agreement analysis between them can be employed. Basically, there are two methods for measuring the agreement between similarity measures [18]. The first method applies a simple correlation, such as Pearson’s correlation, to measure the correlation between the similarity matrices after flattening them into vectors. The second method is based on generating ranking matrices from the similarity matrices of the measures and then compute the agreement between similarity measures based on the ranking matrices. In this work, measuring the agreement based on the ranking is adopted, therefore the ranking matrices of the three measures are computed, as shown in Table 6, Table 7 and Table 8.
Table 6.
PEOs similarity ranking based on ED measure.
Table 7.
PEOs similarity ranking based on MD measure.
Table 8.
PEOs similarity ranking based on CS measure.
Based on the ranking matrices, the agreement between matrices of the three data similarity measures are computed. Table 9 shows the mutual agreement between every pair of measures in their measuring of the similarity between a particular PEO and the other PEOs. It also shows the average agreement (last row) between every pair of similarity measures across all of them. Obviously, CS indicates full agreement with ED for LL PEO and with MD for L and SC PEOs. Interestingly, the CS measures show higher agreement with ED and MD than the agreement between ED and MD.
Table 9.
Computed agreements between similarity measures.
In addition, the agreement across the three measures is computed (last column) for each PEO and across all PEOs (which is 0.49). The highest agreement between the three measures is in measuring the similarity between L and other PEOs, while the lowest agreement is in measuring the similarity between T and other PEOs.
Despite the differences between the similarity measures in their evaluation of the similarity among PEOs, the overall similarity matrix, which gives an overall estimation of the similarity among PEOs based on the similarity matrices of the three measures, can be computed. However, the values of the ED similarity matrix and MD similarity matrix need to be normalized first so that their values fall in the range of 0 and 1. This can be done using the following formula:
Then the overall similarity matrix can be computed as the average over the three matrices, as shown in Table 10.
Table 10.
Average similarity matrix.
As illustrated in Table 10, the similarity is high for the following pairs of PEOs, (CS, GS), (KC, TC) and (TC, CS), while it is low for the pairs (EC, TC), (EC, GS), (L, TC). This is expected, as the PEOs in the first group depend mostly on the soft skills SOs while the PEOs in the second group depend on a different set of SOs skills. Additionally, the spectral visualization of the similarity of each PEO with the other PEOs is shown in Table 11. A closer look at the spectral representation of PEOs’ similarities disclose several interesting aspects of PEOs correlations. First, the similarity between the spectral representation of PEOs similarities of CS, TC, KC, and GS suggests that they are forming a cluster. This can be interpreted by looking at the PEOs–PLOs mapping, from which it can be observed that these PEOs are highly correlated with a set of PLOs (a, b, c, e, k) that is known as the hard skills PLOs. By the same token, the following set of PEOs (C, L, T, EC, P and SC) show a similarity in their spectral representation of PEOs similarities. Again, this suggests that they are forming another PEOs cluster and can be interpreted by looking at the PEOs–PLOs mapping, in which it can be observed that these PEOs are highly correlated with a set of PLOs (d, f, g, h, i, j) that are known as the soft or professional skills PLOs. An interesting observation of the tow cluster is that the correlations among the PEOs of the first cluster is higher than the correlations among the PEOs of the second cluster.
Table 11.
Spectral visualization of the similarity of each PEO with the other PEOs.
Finally, with regards to LL PEO, the spectral representation shows that it is mostly correlated with the PEOs of the first cluster; however, its highest similarity with P PEOs from the second cluster is notable. This is suggesting that LL is a common PEO which is related to both PEOs clusters.
The spectral representation of the PEOs’ similarities can give an overall view on the correlations among them. As shown in Table 11, some of these of these correlations are intuitive and self-explanatory, such as TC and CS, because the technical competency is essential for carrier success; KC and TC because the knowledge and technical competencies have a reciprocal influence on each other. T and CS are also correlated because teaming skills become essential for career success, and T and C are also highly correlated because communication skills are essential for teamwork. LL and P are highly correlated because lifelong learning is indispensable to increasing the professionalism as well. However, some PEOs correlations require further investigation because of unobvious intuitive connections between them, such as CS and GS.
From a practical perspective, the above-drawn PEOs correlations provide actionable insights for the systemization and optimization of various processes in the academic programs, such as design, development, assessment and accreditation. The design of an academic program is a top-down process that involves drafting its PEOs and matching them to a predefined set of PLOs, and then design a program curriculum accordingly. Given this top-down view of the academic program, it is obvious that the insights on the PEOs correlations, located at the top level of the program, are useful for informing their matching to PLOs and the design of program curriculum at the bottom level. For example, the high correlation among the KC, TC, GS and CS PEOs suggests grouping the courses that focus on their related skills in the curriculum together, as well as design correlated course-level teaching and assessment activities accordingly. Another potential benefit of the drawn PEOs correlations during the design stage of the program is the minimization of the number of PEOs when drafting them. It is a recommended practice which can be optimized in light of the drawn insights by drafting the highly correlated PEOs in one objective, thus minimizing the number of PEOs.
Another important academic program process where the drawn insights on correlations among PEOs could be used is the assessment of PEOs. It is an essential process for maintaining the quality of an academic program and obtaining academic accreditation. During the development of the assessment PEOs plan, the insights on the PEOs correlations are a useful tool to optimize the plan in terms of the time and efforts required to implement it. For example, instead of assessing all PEOs, it is possible to obtain an approximate estimation of some PEOs based on the assessment results of others. This is particularly useful when the assessment of some PEOs might be hindered by cost, data availability and so forth.
The development process of academic programs involves reviewing the existing PEOs and introducing changes, such as adding new PEOs or modifying the existing ones. In this process, the insights on the PEOs correlations can be used to inform the developmental decisions. For example, if the developmental decision is to add a new PEO to the existing ones, the PEOs correlations can be used to predict the achievement of the newly added PEOs based on their correlations to the existing ones. In this manner, the development process of the academic program can be systematized and optimized.
The accreditation of academic programs is another process which can be optimized and systematized by the insights on the PEOs correlations. In this process, the main task of program evaluators is to evaluate the consistency and adequacy of the program’s activities for achieving its PEOs and the validity of the assessment process as a whole. With these insights in the minds of program evaluators, their assessment of a program’s quality becomes more informative. For example, the strong correlations between LL and P PEOs allows program evaluators to make assumptions on the degree of consistency and organization between their supportive curricular or extracurricular activities. Furthermore, these insights allow the program evaluators to make assumptions on the levels of PEOs achievements and ultimately judge the quality of the program.
Another process that could benefit from the obtained insights on the correlations among PEOs is the comparison between programs to understand the landscape of education in a particular discipline, such as engineering. Certainly, knowing the similarities among PEOs assists in evaluating the similarities/differences between programs at this level.
Finally, from a software development perspective, the obtained insights on the correlations among PEOs can inform the process of developing computer-based systems that could contribute to the development of computer-assisted academic program designs or accreditation.
6. Conclusions
In this research, the correlations among the PEOs of OBE academic programs were discovered using a learning analytics-based approach. Three data similarity measures, namely ED, MD, CS, were applied to discover the correlation among a set of 11 PEOs extracted and preprocessed from 215 engineering academic programs. The obtained results provide different views of the correlations among PEOs from three different perspectives. Although the three measures are different, the analysis of the agreement among them shows a remarkable consistency in their evaluation of the PEOs correlations. Finally, the average PEOs similarity matrix was computed, after normalizing the scale of measurement of ED and MD to fall in the range 0 and 1. From the average similarity matrix, the spectral similarity vectors of PEOs were drawn, from which two clusters of PEOs were identified. The first cluster involves the PEOs that were highly mapped to hard skills PLOs, while the second cluster involves the PEOs that were highly mapped to soft skills PLOs. It also identifies several interesting PEOs correlations, which are intuitively interpreted, and several PEOs correlation, which need further investigation on their causality correlations. In addition to the practical benefits of the presented approach to the applications that depend on computing similarity such as recommendation and visualization systems, the discovered insights are useful knowledge for the academicians and decision-makers to better understand, design and assess their programs.
Finally, this work can be extended in several directions. First, since this research focuses on the engineering discipline, it can be replicated for other disciplines, such as science, computing, art, etc. Secondly, the outcomes of this research, which are based on quantitative analysis, pave a way for more investigations of the causal correlations or prerequisite correlations among PEOs. Thirdly, based on this research, an interesting correlation analysis between academic programs in a given discipline such as engineering by different regions/countries (and/or by other properties) can be conducted.
Author Contributions
Conceptualization, A.A.Y.; methodology, A.A.Y. and A.A.S.; software, Z.M.Z.; validation, A.M.M.; formal analysis, A.M.M. and Z.M.Z.; investigation, A.A.S., A.M.M. and H.T.H.; resources, A.A.S.; data curation, Z.M.Z.; writing—original draft preparation, A.A.Y.; writing—review and editing, A.A.S., A.M.M. and H.T.H.; visualization, H.T.H.; supervision, A.A.Y. and A.A.S.; project administration, A.A.Y.; funding acquisition, A.A.S. All authors have read and agreed to the published version of the manuscript.
Funding
This research was funded by the Deanship of Scientific Research-Najran University, grant number NU/-/SERC/10/652 and The APC was funded by the Deanship of Scientific Research-Najran University.
Data Availability Statement
The data presented in this study are available in https://www.researchgate.net/publication/336288041_A_Dataset_of_Program_Educational_Objectives_mapped_to_ABET-EAC_Student_Outcomes.
Acknowledgments
The authors would like to express their gratitude to the Ministry of Education and the Deanship of Scientific Research—Najran University–Kingdom of Saudi Arabia for their financial and technical support under code number (NU/-/SERC/10/652).
Conflicts of Interest
The authors declare no conflict of interest.
References
- Glatthorn, A. Outcome based education: Reform and the curriculum process. J. Curric. Superv. 1993, 4, 354–363. [Google Scholar]
- Guskey, T. Defining the differences between the outcome based education and mastery learning. Sch. Adm. 1994, 51, 34–37. [Google Scholar]
- Spady, W. Outcome-Based Education: Critical Issues and Answers; American Association of School Administrators: Arlington, VA, USA, 1994. [Google Scholar]
- Rashid, M.H. The Process of Outcome-Based Education—Implementation, Assessment and Evaluations. In Proceedings of the 2013 ASEE International Forum, Atlanta, GA, USA, 22 June 2013; pp. 21.67.1–21.67.9. [Google Scholar]
- Subbaraman, S.; Jagtap, R.R.; Shinde, S.S. Outcome Based Learning: A case study. In Proceedings of the 2013 IEEE International Conference in MOOC, Innovation and Technology in Education (MITE), Jaipur, India, 20–22 December 2013; pp. 375–379. [Google Scholar]
- Mourtos, N.J. A Systematic Approach for Defining and Assessing Program Educational Objectives and Outcomes. In Proceedings of the the World Congress on Computer Science, Engineering and Technology Education, Santos, Brazil, 19–22 March 2006. [Google Scholar]
- Carter, M.; Brent, R.; Rajala, S. EC 2000 Criterion 2: A procedure for creating, assessing, and documenting program educational objectives. In Proceedings of the 2001 ASEE Annual Conference, Albuquerque, NM, USA, 24–27 June 2001. [Google Scholar]
- Khan, M.I.; Mourad, S.M.; Zahid, W.M. Developing and qualifying Civil Engineering Programs for ABET accreditation. J. King Saud Univ. Eng. Sci. 2016, 28, 1–11. [Google Scholar] [CrossRef] [Green Version]
- Abbadeni, N.; Ghoneim, A.; Alghamdi, A. Program Educational Objectives Definition and Assessment for Quality and Accreditation. Int. J. Eng. Pedagog. 2013, 3, 33–46. [Google Scholar] [CrossRef] [Green Version]
- Callahan, J. Objectives and Outcomes Jabberwocky. JOM 2016, 68, 2021–2023. [Google Scholar]
- Estell, J.K.; Williams, S.M. Program Educational Objectives: What Constitutes Sufficient Assessment? In Proceedings of the 2011 ASEE Annual Conference & Exposition, Vancouver, BC, Canada, 26–29 June 2011; pp. 22.1182.1–22.1182.17. [Google Scholar]
- Petersen, O.; Williams, S.; Durant, E. Understanding Abet Objectives and Outcomes. In Proceedings of the 2007 Annual Conference & Exposition, Richmond, VA, USA, 13–17 July 2007. [Google Scholar]
- Aldowah, H.; Al-Samarraie, H.; Fauzy, W.M. Educational data mining and learning analytics for 21st century higher education: A review and synthesis. Telemat. Inform. 2019, 37, 13–49. [Google Scholar] [CrossRef]
- Aggarwal, C.C. Data Mining: The Textbook; Springer: Berlin/Heidelberg, Germany, 2015. [Google Scholar]
- Han, J.; Kamber, M.; Pei, J. Data Mining: Concepts and Techniques; Morgan Kaufmann: Burlington, MA, USA, 2012. [Google Scholar]
- Baker, R.S.J. Data mining for education. Int. Encycl. Educ. 2011, 7, 112–118. [Google Scholar]
- Rihak, J.; Pelanek, R. Measuring similarity of educational items using data on learners’ performance. In Proceedings of the 10th International Conference on Educational Data Mining, Wuhan, China, 25–28 June 2017. [Google Scholar]
- Pelánek, R. Measuring similarity of educational items: An overview. IEEE Trans. Learn. Technol. 2019, 13, 354–366. [Google Scholar] [CrossRef]
- Hosseini, R.; Brusilovsky, P. A study of concept-based similarity approaches for recommending program examples. New Rev. Hypermedia Multimed. 2016, 23, 161–188. [Google Scholar] [CrossRef] [Green Version]
- Brusilovsky, P.; Ahn, J.-W.; Dumitriu, T.; Yudelson, M. Adaptive Knowledge-Based Visualization for Accessing Educational Examples. In Proceedings of the Tenth International Conference on Information Visualisation (IV’06), London, UK, 5–7 July 2006. [Google Scholar]
- Sahebi, S.; Brusilovsky, P. Student performance prediction by discovering inter-activity relations. In Proceedings of the 10th International Conference on Educational Data Mining, Wuhan, Hubei, China, 25–28 June 2017. [Google Scholar]
- Liu, Q.; Huang, Z.; Huang, Z.; Liu, C.; Chen, E.; Su, Y.; Hu, G. Finding Similar Exercises in Online Education Systems. In Proceedings of the 24th ACM SIGKDD International Conference on Knowledge Discovery & Data Mining, London, UK, 19–23 August 2018; pp. 1821–1830. [Google Scholar]
- John, R.J.L.; McTavish, T.S.; Passonneau, R.J. Semantic Similarity Graphs of Mathematics Word Problems: Can Terminology Detection Help? In Proceedings of the 8th International Conference on Educational Data Mining, Madrid, Spain, 22–26 June 2015. [Google Scholar]
- Käser, T.; Busetto, A.G.; Solenthaler, B.; Kohn, J.; von Aster, M.; Gross, M. Cluster-Based Prediction of Mathematical Learning Patterns. In Proceedings of the International Conference on Artificial Intelligence in Education, Memphis, TN, USA, 9–13 July 2013; pp. 389–399. [Google Scholar]
- Gehringer, E.F.; Liu, X.; Kariya, A.D.; Wang, G. Comparing and Combining Tests for Plagiarism Detection in Online Exams. In Proceedings of the 13th International Conference on Educational Data Mining, Online, 10–13 July 2020. [Google Scholar]
- Lahitani, A.R.; Permanasari, A.E.; Setiawan, N.A. Cosine similarity to determine similarity measure: Study case in online essay assessment. In Proceedings of the 2016 4th International Conference on Cyber and IT Service Management, Bandung, Indonesia, 26–27 April 2016; pp. 1–6. [Google Scholar]
- Gokaran, M.N.; Gottipati Swapna, S.; Shankararaman, V. Clustering models for topic analysis in graduate discussion forums. In Proceedings of the 27th International Conference on Computers in Education, Kenting, Taiwan, 2–6 December 2019. [Google Scholar]
- Boubekki, A.; Jain, S.; Brefeld, U. Mining User Trajectories in Electronic Text Books. In Proceedings of the 11th International Conference on Educational Data Mining, Buffalo, NY, USA, 15–18 July 2018. [Google Scholar]
- Yahya, A.A.; Osman, A. A data-mining-based approach to informed decision-making in engineering education. Comput. Appl. Eng. Educ. 2019, 27, 1402–1418. [Google Scholar] [CrossRef]
- Yahya, A.A.; Alyami, I. A Quantitative Investigation of the Correlation Between Academic Program Majors and Educational Objectives: A Data-Driven Approach. In Proceedings of the 2020 2nd International Conference on Computer and Information Sciences (ICCIS), Aljouf, Saudi Arabia, 7–9 April 2020; pp. 1–6. [Google Scholar]
- Osman, A.; Yahya, A.A.; Kamal, M.B. A Benchmark Collection for Mapping Program Educational Objectives to ABET Student Outcomes: Accreditation. In Proceedings of the 5th International Symposium on Data Mining Applications, Riyadh, Saudi Arabia, 21–22 March 2018; 2018; pp. 46–60. [Google Scholar]
- Hand, D.; Mannila, H.; Smyth, P. Principles of Data Mining; MIT Press: Cambridge, MA, USA, 2001. [Google Scholar]
- Xu, R.; Wunsch, D. Survey of Clustering Algorithms. IEEE Trans. Neural Netw. 2005, 16, 645–678. [Google Scholar] [CrossRef] [PubMed] [Green Version]
Publisher’s Note: MDPI stays neutral with regard to jurisdictional claims in published maps and institutional affiliations. |
© 2021 by the authors. Licensee MDPI, Basel, Switzerland. This article is an open access article distributed under the terms and conditions of the Creative Commons Attribution (CC BY) license (https://creativecommons.org/licenses/by/4.0/).