Article

Pathologic Complete Response Prediction after Neoadjuvant Chemoradiation Therapy for Rectal Cancer Using Radiomics and Deep Embedding Network of MRI

1
Department of Computer Science and Engineering, University of Seoul, Seoul 02504, Korea
2
Department of Radiology, Severance Hospital, College of Medicine, Yonsei University, Seoul 03722, Korea
*
Authors to whom correspondence should be addressed.
Appl. Sci. 2021, 11(20), 9494; https://doi.org/10.3390/app11209494
Submission received: 6 September 2021 / Revised: 7 October 2021 / Accepted: 8 October 2021 / Published: 13 October 2021

Abstract

:
Assessment of magnetic resonance imaging (MRI) after neoadjuvant chemoradiation therapy (nCRT) is essential in rectal cancer staging and treatment planning. However, when predicting the pathologic complete response (pCR) after nCRT for rectal cancer, existing works either rely on simple quantitative evaluation based on radiomics features or partially analyze multi-parametric MRI. We propose an effective pCR prediction method based on novel multi-parametric MRI embedding. We first seek to extract volumetric features of tumors that can be found only by analyzing multiple MRI sequences jointly. Specifically, we encapsulate multiple MRI sequences into multi-sequence fusion images (MSFI) and generate MSFI embedding. We merge radiomics features, which capture important characteristics of tumors, with MSFI embedding to generate multi-parametric MRI embedding and then use it to predict pCR using a random forest classifier. Our extensive experiments demonstrate that using all given MRI sequences is the most effective regardless of the dimension reduction method. The proposed method outperformed any variants with different combinations of feature vectors and dimension reduction methods or different classification models. Comparative experiments demonstrate that it outperformed four competing baselines in terms of the AUC and F1-score. We use MRI sequences from 912 patients with rectal cancer, a much larger sample than in any existing work.

1. Introduction

Rectal cancer is a carcinoma with a high incidence, accounting for 11.4% of the total cancer incidence, with 25,330 new cases in Korea in 2019, according to the Korea Central Cancer Registry [1]. Magnetic resonance imaging (MRI) is considered one of the most effective tools for staging rectal cancer by evaluating the local progression of tumors and lymph node metastasis.
Recently, for locally advanced rectal cancer, neoadjuvant chemoradiation therapy (nCRT) has been suggested to perform chemoradiation therapy before surgery [2]. If a patient is highly likely to have a pathologic complete response (pCR) after nCRT, they can avoid or postpone surgery while monitoring recurrence. Therefore, if we can predict pCR after nCRT accurately through MRI assessment, surgery could be avoided in the case of some patients, thereby greatly improving their quality of life by preserving their organs, which surgery might otherwise damage [3]. However, treatments, such as nCRT, may cause fibrosis, desmoplastic reaction, or colloid formation; therefore, MRI analysis becomes increasingly challenging.
To predict the pCR of rectal cancer, radiologists have used various MRI sequences, such as T2-weighted images (T2), diffusion-weighted imaging (DWI) [4,5], and contrast-enhanced imaging (CE) [6]. While T2 is considered as an essential MRI sequence, radiologists can achieve higher accuracy by using DWI along with T2 than using T2 alone [7]. This can be improved further by replacing T2 and DTW with T2/Gabor (T2 after applying the Gabor filter) and DWI/ADC (apparent diffusion coefficient of DWI) [8,9].
To quantitatively evaluate MRI for the pCR prediction of rectal cancer, many prior studies [8,10,11,12] have focused on radiomics features that can quantify the texture and non-texture characteristics of tumors. For example, a random forest classifier on T2/Gabor radiomics features outperformed qualitative analysis of T2 and DWI by radiologists [8]. By merging the radiomics features of multi-parametric MRI [10] and additional information, such as tumor length [11], simple classifiers based on multi-layer perceptron (MLP), and logistic regression, have shown high pCR prediction accuracy.
Recently, convolutional neural network (CNN) architectures have been widely used to extract new features of tumors in medical images, such as MRI and CT/PET [13,14,15,16,17,18]. Using 2D-CNN pre-trained on non-medical images, 2D features of the tumor are extracted from CE MRI and used for an effective logistic regression classifier [13,14]. To improve the pCR prediction accuracy, 2D-features from multi-parametric MRI [15] and radiomics features [16] can be combined. Some approaches have used pre-trained 3D-CNN to extract 3D features of tumor volume [17,18]. However, they neither analyze multi-parametric MRI nor consider radiomics features; they analyze 3D CT/PET images [18] or the DWI/ADC MRI sequence [17] only.
In this study, given pre-operative MRI sequences, {T2, DWI/ADC, and CE}, we predict the pCR of rectal cancer after nCRT by using multi-parametric MRI embedding. Specifically, we focus on extracting 3D features of tumor volume and radiomics features and fusing them to generate novel and diverse features of multi-parametric MRI. To this end, we encapsulate multiple MRI sequences into a multi-sequence fusion image (MSFI) and extract features directly from it, instead of simply merging the features extracted from each MRI sequence.
We generate MSFI embedding using a 3D-CNN, which is known to capture non-linear correlations of volumetric features extracted by 3D convolutional filters. As the number of 3D filters to tune for a deep 3D-CNN is very large, training randomly initialized filters will be more likely to overfit as the size of training set becomes smaller. For better generalization ability, we use transfer learning [19] with a 3D-CNN pre-trained on a large collection of videos.
Finally, we generate multi-parametric MRI embedding by concatenating MSFI embedding and radiomics features and performing dimension reduction for pCR prediction. This enables us to consider both diverse structural features of the tumor volume present in each MRI sequence and novel volumetric features that can only be found by analyzing multiple MRI sequences jointly.
We utilize the annotated MRI sequences of 912 rectal cancer patients, a sample size that is significantly larger than those used in previous works. We construct our pCR prediction model and existing models using MRI sequences of 592 patients after enlarging the number of MRI sequences using image augmentation techniques. For the model evaluation, we use the MRI sequences of 320 patients.
Our main contributions are as follows.
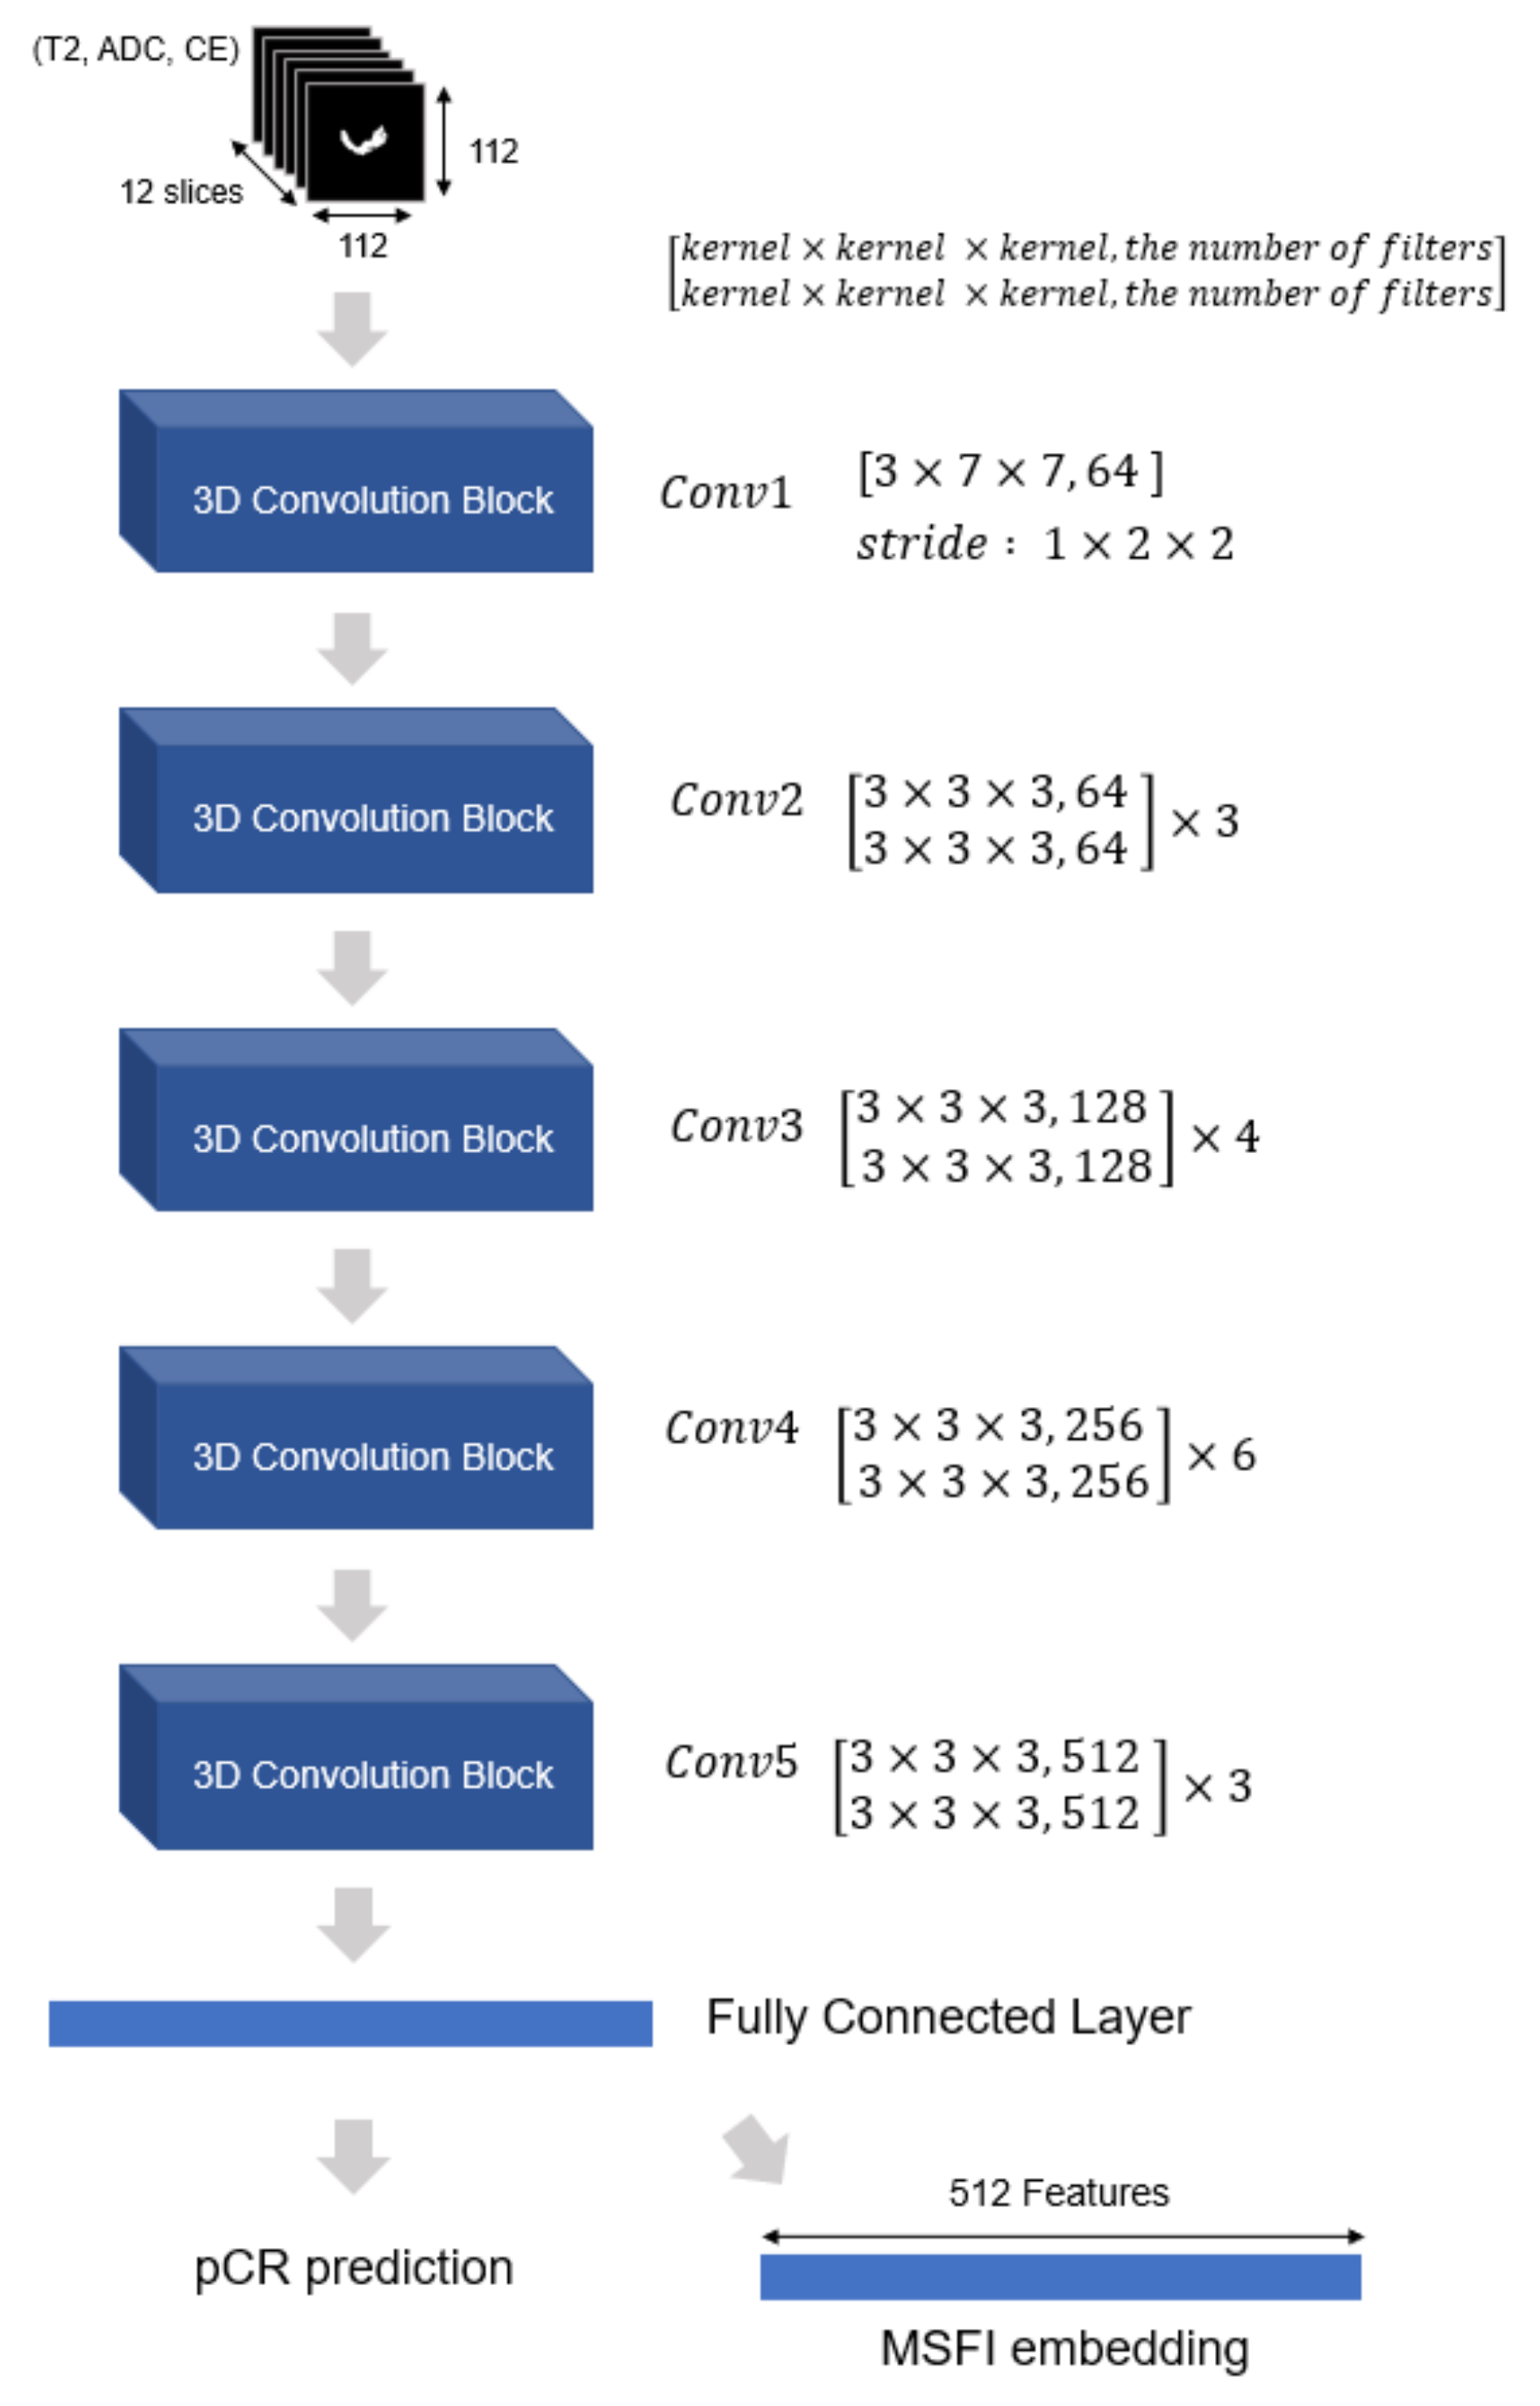
  • We propose a method for encapsulating multiple MRI sequences into an MSFI and generating MSFI embedding using 3D-CNN to extract novel volumetric features of tumors.
  • We introduce multi-parametric MRI embedding that contains diverse discriminative features of tumors by incorporating MSFI embedding and radiomics.
  • We show the superiority of the proposed method through extensive experiments using the pre-operative MRI sequences of 912 rectal cancer patients.

2. Related Works

2.1. Qualitative Evaluation of Rectal Cancer Using MRI

Various types of MRI sequences, such as T2, DWI, and CE, have been used by radiologists for the qualitative evaluation of rectal cancer. In particular, radiologists can assess rectal cancer more accurately by simultaneously examining multiple MRI sequences at the same time. T2 has been considered as the best MRI sequence for evaluating rectal cancer, while DWI can help predict pCR after nCRT because it shows rectal cancer in a scar more clearly [4,5,20]. Recently, it has been shown that by using both T2 and DWI, radiologists can predict pCR more accurately than using T2 alone, since DWI enables them to interpret qualitative characteristics of rectal cancer that are invisible in T2 [21]. CE is helpful in assessing rectal cancer by providing the perfusion properties of tumors [6,22].

2.2. Quantitative Evaluation of Rectal Cancer using Radiomics Features

Radiomics features are quantities that can be automatically extracted from medical images and used to assist clinical decision-making [23]. Given a sequence of medical images and tumor masks, 2D/3D radiomics features pertaining to the tumor shape, voxel intensity histogram, and texture of tumor areas (such as the gray-level co-occurrence matrix and gray-level size-zone matrix), can be extracted [24]. Since radiomics features effectively quantify both texture and non-texture characteristics of tumors, many prior studies have used them for pCR prediction.
Recently, in diagnosing pCR after nCRT, a random forest classifier on T2/Gabor radiomics features has shown higher performance (AUC = 0.93) than qualitative assessment of T2 and DWI by radiologists, based on a cohort of 114 rectal cancer patients [8]. Given the computerized tomography (CT) radiomics features of 222 patients, an MLP classifier (AUC = 0.72) was shown to outperform a logistic regression classifier (AUC = 0.59) and support vector machine (SVM) classifier (AUC = 0.62), because it can capture non-linear correlations between CT radiomics features and the pCR of rectal cancer [25].
Radiomics features obtained from multi-parametric MRI have been used to predict the pCR of rectal cancer. Multi-parametric MRI provides more comprehensive information on rectal tumor areas than a particular MRI sequence does. Given the radiomics features of multi-parametric MRI, {T2, DWI/ADC, and CE}, of 48 patients, a three-layer MLP classifier (AUC = 0.79) was shown to outperform conventional voxelized heterogeneity analysis by radiologists (AUC = 0.71) [10]. By fusing T2 and DWI radiomics features before and after the CRT of 152 patients and additional information, such as tumor length, one logistic regression classifier showed an AUC of 0.9756 in a validation cohort of 70 patients [11]. Using the radiomics features of T2, DWI, and CE obtained before and after nCRT of 186 patients, another logistic regression classifier achieved an AUC of 0.948 [12].

2.3. Quantitative Evaluation of Rectal Cancer using Deep Learning

While radiomics features capture the essential characteristics of rectal tumor areas, we can extract new discriminative features using various CNN architectures. Using features of CE MRI extracted by 2D-CNN pre-trained on non-medical images, logistic regression classifiers can effectively predict the pCR of breast cancer (AUC = 0.85 [13] AUC = 0.77 [14]). With the features of multi-parametric MRI, T2, and CE, extracted by pre-trained 2D-CNN, an SVM classifier can accurately predict the pCR of breast cancer (AUC = 0.87) [15]. Given the multi-parametric MRI of DWI/ADC and CE, an MLP classifier has been shown to achieve higher accuracy and robustness by exploiting both 2D-CNN embedding and radiomics features of MRI [16].
However, 2D-CNN cannot capture features of tumor volumes, because it analyzes each slice of MRI sequences separately. 3D-CNN can capture volumetric features by applying 3D filters across consecutive slices of an MRI sequence. Given 3D rectal CT/PET images of tumors, 3D-CNN has been used to extract volumetric features for pCR prediction [18]. This end-to-end deep learning method shows a 0.64 c-index score, which is higher than the Cox proportional hazards model (0.62) [26] and random survival forests (0.60) [27], based on a cohort of 84 patients. Given DWI/ADC MRI sequences obtained before nCRT, a logistic regression model on 3D-CNN embedding (AUC = 0.73) was shown to outperform a logistic regression model on its radiomics features (AUC = 0.64), based on a cohort of 43 rectal cancer patients [17].
Our method differs from these works in three aspects. First, we focus on extracting the discriminative volumetric features of rectal cancer by applying 3D-CNN to multi-parametric MRI. Next, we exploit both our novel volumetric features and radiomics features of multi-parametric MRI to generate multi-parametric MRI embedding for pCR prediction of rectal cancer. Lastly, our experimental evaluation is based on a large collection of multi-parametric MRI scans of 912 rectal cancer patients. To the best of our knowledge, very few studies have used a cohort of more than 200 rectal cancer patients.

3. Method

3.1. Data Preprocessing

In this study, we use pre-operative MRI sequences of 912 patients with rectal cancer after nCRT. To split the samples into train and test sets, we partition them into two disjoint cohorts based on surgery date. In this way, we want to predict the prognosis of future patients by using the data of past patients before a specific point in time. This data partitioning scheme is frequently used in medical research because it naturally reflects the actual disease incidence and prevents random selection bias.
The training set consists of MRI sequences of 592 patients, 114 pCR patients, and 478 non-pCR patients, and the test set contains the MRI sequences of 320 patients, of which 78 are pCR, and 242 are non-pCR patients. We excluded the MRI sequences of 13 patients because it was impossible to evaluate their MRI reliably due to metal artifacts caused by metal stents for rectal obstruction. The disease stage information is summarized in Table 1. During the MRI examination, we followed the MRI protocol described in Appendix A.
A board-certified abdominal radiologist with 6 years of experience registered multi-parametric MRI sequences. Fully automated co-registration was performed, and then the radiologist validated the co-registered MRI sequences. Automated co-registration of rectal MRI is known to be effective because rectum is in the pelvic cavity and, thus, moves much less during respiration. No manual correction was performed. Then, the radiologist drew the volume of interest (VOI) to include the whole tumor volume on T2 images semi-automatically using a 3D Slicer tool [28]. All VOIs were confirmed by a senior abdominal radiologist with 19 years of experience to ensure the quality of tumor annotations.
Disagreements on annotations were resolved by consensus-based discussion. The radiologists were blinded to the clinical and histopathologic data, except for information on the diagnosis of rectal cancer. During training, we oversampled pCR MRI images in the training set to alleviate the class imbalance between pCR and non-pCR [29].
Figure 1 shows snapshots of MRI sequences, {T2, DWI/ADC, and CE}, of a pCR patient (upper) and those of a non-pCR patient (lower). Yellow masks depict rectal tumor areas segmented and validated by radiologists. As the resolution or the number of slices may differ across MRI sequences, we executed MRI alignment and z-normalization as preprocessing steps.
To equalize the resolution of different MRI sequences, images were resampled to an isovoxel size of 1 mm 3 using the B-Spline method [30]. Then, the signal intensities of the images were converted to values in the range (−3, 3) using z-score normalization. These values were multiplied by 100 and converted to a value between (−300, 300). Radiomic features were extracted by assigning a bin size of 5 for grayscale discretization. Due to the lack of a standardized signal intensity scale of MRI, signal intensity normalization is recommended before comparing MRI images [31].
Grayscale normalization improves the robustness of radiomics features [32,33]. As with T2, we applied z-score normalization to the post contrast enhanced MRI during the preprocessing stage. All processes, including voxel resampling and signal intensity normalization, were performed using the functions implemented in pyradiomics. As the width and height of the interpolated MRI slices ranged from 224 to 230 after voxel size resampling, we cropped larger ones slightly to obtain slices of equal resolution. After data preprocessing, each MRI sequence has 30 slices of resolution (224 × 224).

3.2. Suggested Method

3.2.1. Representing Multiple MRI Sequences as MSFI Embedding

Figure 2 depicts our pCR prediction process used to transform given multi-parametric MRI sequences into embedding. To extract features of tumor volumes, we highlight tumor areas in each MRI image and select the MRI images related to the major tumor volume as follows. First, we highlight the tumor area in each MRI image by filling the region outside its tumor mask with zeros. Then, to select contiguous slices capturing tumor volume, we find the slice with the largest tumor area and pick five and six slices above and below the slice, respectively, in each MRI sequence.
If the tumor size exceeded 12 slices, a total of 12 slices were used above and below the central section with the largest tumor area. The reason is that after nCRT, the viable portion of the tumor is mainly found in the central region of the tumor, and the border region of the tumor has a very small volume or is observed as a streak-like fibrosis, making it difficult to represent the characteristics of the entire tumor volume.
In our study, the number of patients whose tumor size exceeded 12 slices is relatively small ( 22 / 592 in the training set and 17 / 320 in the test set). Lastly, since the input resolution of the 3D-CNN used for transfer learning is 112 × 112, we center-cropped each slice around the tumor area accordingly.
To alleviate data scarcity and avoid overfitting, we apply data augmentation techniques and transfer learning. We use data augmentation techniques, such as 3D-rotation and 3D-shift [34] during the training stage to increase the size and variety of the training set. We exclude some image augmentation techniques, such as adding Gaussian noise and applying a median filter, because they often distort the texture of tumor areas, which is an essential characteristic of tumors for pCR prediction [35].
In addition to extracting the diverse features from each MRI sequence, we aim to examine novel features that can be found only by considering multiple MRI sequences jointly. For this, we transform the given three MRI sequences, {T2, DWI/ADC, and CE}, into an MSFI. The MSFI is a sequence of slices containing 3D values ( v 1 , v 2 , v 3 ) , where v 1 , v 2 , and v 3 are from T2, DWI/ADC, and CE, respectively. After encapsulating three MRI sequences into the MSFI, we use it as an input for deep learning to represent it as MSFI embedding.
To extract the volumetric features of tumors, we use a 3D-CNN model that is known for its high classification performance on video data. Unlike 2D-CNN, 3D convolutional filters can identify patterns that appear across multiple image slices. As there are many 3D convolutional filters to tune in a deep 3D-CNN model, we perform transfer learning to improve generalization ability [36,37], instead of training randomly initialized 3D filters.
For this, we used 3D-ResNet [38] pre-trained on Kinetic [39], a large-scale, high-quality video dataset that contains 400 classes with at least 400 videos per class and is considered as a de facto standard for the research on 3D image processing. 3D-ResNet is known to distinguish 3D instances very effectively by reducing the gradient-vanishing effect through gradient flow. This means that its pre-trained 3D filters can already extract useful volumetric features from 3D instances. Therefore, by fine-tuning the pre-trained filters in 3D-ResNet, we can construct more effective 3D filters for MSFI embedding extraction. Figure 3 shows the architecture of 3D-ResNet, the 3D-CNN that we use for MSFI embedding extraction. We obtain MSFI embedding from the fully connected layer of the trained 3D-ResNet.

3.2.2. Extracting Radiomics Features

Given multi-parametric MRI, we seek to extract another set of features that can capture different aspects of tumor characteristics than MSFI embedding. Radiomics features have already demonstrated a high correlation with pCR after nCRT for rectal cancer. Thus, we merge radiomics features with MSFI embedding to further improve pCR prediction performance. Using the pyradiomics package [40], we extract radiomics features from tumor areas in multiple MRI sequences, {T2, DWI/ADC, and CE}.
Figure 4 shows 3740 radiomics features that were extracted from multiple MRI sequences, {T2, DWI/ADC, and CE}. From each MRI sequence, we extracted 2D/3D radiomics features on the tumor shape, voxel intensity histogram, texture of tumor areas, such as the gray-level co-occurrence matrix (GLCM), gray-level run-length matrix (GLRLM), gray-level size-zone matrix (GLSZM), and gray-level dependence matrix (GLDM). In addition, we applied filters, such as log and wavelet transform, to each MRI sequence to extract higher-order statistical features on rectal tumor areas [41]. To extract more diverse textual features from T2, we applied a Gabor filter with four angles, {0 , 45 , 90 , and 135 }.

3.2.3. Predicting pCR using Both MSFI Embedding and Radiomics Features

For effective pCR prediction, we seek to use diverse characteristics of tumor areas by considering both MSFI embedding and radiomics features. Radiomics features are extracted through mathematical analysis of each MRI sequence and mainly capture shapes, voxel intensity histograms, and the texture of tumor areas. MSFI embedding is generated through deep learning of multi-parametric MRI and consists of novel volumetric features highly related to pCR prediction.
Figure 5 presents an overview of our pCR prediction method. Given three MRI sequences, {T2, DWI/ADC, and CE}, we extracted 512-dimensional MSFI embedding and 3740 radiomics features, as shown in Figure 2 and Figure 4. Then, we obtained a novel multi-parametric MRI embedding, a compact and effective representation of multi-parametric MRI, by combining MSFI embedding and radiomics features and compressing them into 150 features using kernel principal component analysis (PCA) [42].
Kernel PCA is a dimension reduction method that modifies linear PCA [43] by replacing the linear kernel with a Gaussian kernel. Thus, non-linear transformation is performed so that feature vectors can be represented in a linearly separable feature space. We use this multi-parametric MRI embedding as input to a random forest classifier for pCR prediction [44]. We build our pCR classifier based on the random forest model, because random forest classifiers on radiomics features have shown high performance in predicting pCR after nCRT for rectal cancer—sometimes higher than qualitative MRI assessment by radiologists [8,45].
Note that a deep neural network classifier is likely to overfit when trained with multi-parametric MRI embeddings, because they are no longer images; thus, data augmentation or transfer learning cannot be applied.

4. Experiments

We evaluate the pCR prediction performance of the proposed method through the experiments listed as follows. Specifically, we investigate the impact of input MRI sequences, analyze the pCR prediction performance of the proposed method and compare it with existing methods.
  • Comparison of five types of input MRI sequences:
    (a)
    {T2}
    (b)
    {DWI/ADC}
    (c)
    {CE}
    (d)
    {T2, DWI/ADC} and
    (e)
    {T2, DWI/ADC, and CE} (ours).
  • Comparison of the proposed method with its variants that differ in two factors, MRI feature vector extraction and pCR classification:
    • Three MRI feature vectors: radiomics features, MSFI embedding, and multi-parametric MRI embedding (ours).
    • Six classification models: logistic regression, xgboost, lightgbm, random forest (ours), MLP, and ensemble of the five classifiers.
  • Comparative evaluation of the proposed method with four competing baselines:
    (a)
    SVM classifier on radiomics features [46],
    (b)
    RF classifier on radiomics features [8],
    (c)
    MLP classifier on radiomics features [25], and
    (d)
    3D-CNN classifier on MRI images [18].
To evaluate the overall pCR prediction performance, we use AUC (Area Under the ROC Curve), because it reflects the sensitivity and specificity of a classifier at the same time.
A U C ( f ) = t 0 D 0 t 1 D 1 1 [ f ( t 0 ) < f ( t 1 ) ] D 0 · D 1 .
For a classifier f, we estimate its AUC based on the Wilcoxon–Mann–Whitney statistic [47], as shown in Equation (1). D 0 and D 1 are the set of non-pCR patients and the set of pCR patients, respectively, and 1 [ f ( t 0 ) < f ( t 1 ) ] is an indicator function. We use an independent test cohort to measure the AUC of each classifier.

4.1. Experimental Setup

To generate MSFI embedding, we set the hyperparameters of 3D-ResNet as follows. The batch size was 2, and the number of training epochs was set to 100. We used the Radam optimizer [48] to alleviate the local minima convergence problem that may occur when an adaptive learning rate is used. Initial learning rate was 10 3 , and warmup-proportion was 0.1 . We used 512 as the dimension of MSFI embedding throughout the experiments.
The hyperparameters of existing pCR classifiers were set as follows. For tree-based classifiers, such as xgboost, lightgbm, and random forest, the number of decision trees was set to 1000 to obtain stable pCR prediction results. For a logistic regression classifier, we selected features with L2 regularization. For an MLP-based classifier, a two-layer MLP was used with ReLU as an activation function. We trained it using the Adam optimizer [49]. An ensemble classifier performs soft voting by averaging the pCR probabilities predicted by five classifiers: logistic regression, xgboost, lightgbm, random forest, and MLP.
We examine three different dimension reduction methods in {No dimension reduction, PCA, and Kernel PCA} and compare the AUC of an ensemble classifier.

4.2. Impact of Input MRI Sequences

To demonstrate the impact of the input MRI sequences on the pCR prediction performance, we compare the pCR prediction performance of five types of input MRI sequences in Table 2: {T2}, {DWI/ADC}, {CE}, {T2, DWI/ADC}, {T2, DWI/ADC, and CE}. Note that pCR prediction performance is affected not only by the input MRI sequences but also by the feature vector extraction method and the pCR classification model. For a fair comparison, we use both radiomics features and MSFI embedding extracted by the same architecture, 3D-ResNet, and apply different dimension reduction methods, as in {no dimension reduction, PCA, and Kernel PCA}. We report the AUC of an ensemble classifier because it corresponds to the average performance of five different pCR classification models.
Table 2 shows that the AUC of pCR prediction using three MRI sequences, {T2, DWI/ADC, and CE}, as the input is higher than that using one of these MRI sequences separately, regardless of the dimension reduction method. In particular, while T2 is widely known to be the most effective in evaluating rectal cancer, pCR prediction performance can be further improved when DWI/ADC and CE are used simultaneously. When comparing {T2, DWI/ADC} and {T2, DWI/ADC, and CE}, we observe that pCR prediction using three input MRI sequences, {T2, DWI/ADC, and CE}, outperforms {T2, DWI/ADC}.
Among the three possible pairs of MRI sequences from {T2, DWI/ADC, and CE}, we include only {T2, DWI/ADC} in Table 2, because using T2 and DWI together is already known to be highly effective in evaluating rectal cancer. Radiologists achieve higher pCR prediction accuracy by using both T2 and DWI than by using T2 alone [21] and simple classification methods, such as logistic regression and random forest on radiomics features from T2 and DWI, outperform MRI assessment by radiologists [8].

4.3. Analysis of Our pCR Prediction Model

We evaluated the effectiveness of the proposed pCR prediction method by examining two major factors: MRI feature vector extraction and pCR classification. Recall that for effective pCR classification, we suggest using multi-parametric MRI embedding as an input to a random forest classifier.
In the proposed pCR prediction method, we generate multi-parametric MRI embedding by concatenating MSFI embedding and radiomics features extracted from given MRI sequences, {T2, DWI/ADC, and CE}, and applying kernel PCA. To check the impact of multi-parametric MRI embedding, we apply nine different input vectors to a random forest classifier by combining a feature vector of {radiomics features, MSFI embedding, concatenation of both} and a dimension reduction method of {No dimension reduction, PCA, and Kernel PCA}.
Table 3 presents the pCR prediction performance of random forest classifiers using nine input vectors. We observe, among various input vectors, that with the input vector obtained by concatenating MSFI embedding and radiomics features and then applying kernel PCA, that is, our multi-parametric MRI embedding, random forest classifier achieved the highest AUC of 0.837.
From this, we observe that MSFI embedding extracts novel volumetric features that cannot be found in the pool of radiomics features. At the same time, radiomics features explain some essential characteristics of rectal cancer that MSFI embedding cannot represent. Thus, multi-parametric MRI embedding succeeds in capturing more diverse features from the given MRI sequences. We also observe that kernel PCA can extract discriminative features for pCR prediction from MSFI embedding and radiomics features.
Then, we compare the effectiveness of MSFI embedding and radiomics features. In Table 3, MSFI embedding shows a lower AUC than the radiomics features when used as the input to the random forest classifier. However, while we use 3D-ResNet only for MSFI embedding extraction, it should be noted that its pCR classification performance has already reached 0.807 just as (B4) in Section 4.4. Recall that the random forest classifier on radiomics features is known to be highly effective in pCR prediction for rectal cancer [8].
Given three MRI sequences, {T2, DWI/ADC, and CE}, we can obtain multi-parametric MRI embedding by concatenating MSFI embedding and radiomics features and performing kernel PCA. Through this novel embedding, we aim to show the effectiveness of our random forest classifier by comparing it with various classification models.
Table 4 presents the AUC of six pCR classifiers built on multi-parametric MRI embedding: logistic regression, xgboost, lightgbm, random forest, MLP, and an ensemble of all the classifiers. The random forest classifier outperforms all the other classifiers, including the ensemble, demonstrating an AUC of 0.837.

4.4. Comparison with Existing pCR Prediction Methods

To demonstrate the superiority of our method in predicting pCR after nCRT for rectal cancer, we compared it with four competing baselines: (B1) SVM classifier on radiomics features [46]; (B2) random forest classifier on radiomics features [8]; (B3) MLP classifier on radiomics features [25]; and (B4) 3D-CNN classifier on MRI images [18].
For a fair comparison, we re-implemented all the baselines to re-train them with our large training set containing three MRI sequences, {T2, DWI/ADC, and CE}, of 592 rectal cancer patients. As input to the three baselines, (B1)–(B3), we used 3740 radiomics features extracted as shown in Figure 4. We also re-implemented the 3D-CNN classifier [18], (B4), so that it could accept three MRI sequences, instead of CT/PET images, of rectal cancer as the input.
We compared the proposed method with four baselines by evaluating the overall pCR prediction performance using four measures: AUC, F1-score, specificity, and sensitivity. Specificity and sensitivity correspond to the true negative rate and true positive rate, respectively, and the F1-score is their harmonic mean.
In Table 5, we observe that the proposed method outperformed all competing baselines in terms of the AUC and F1-score. (B2) performed the best among (B1)–(B3) built on radiomics features. However, while the sensitivity of the proposed method was slightly lower, the overall performance of the proposed method was better than that of (B2). This implies that MSFI embedding successfully represents novel features of tumors that radiomics features cannot capture. Compared with (B4), all four measures of the proposed method were higher, which indicates that radiomics features contribute to the improved performance of the proposed method.

5. Discussion

This is the first study that fully exploits both radiomics features and a deep embedding network of multi-parametric MRI to predict pCR after nCRT in patients with locally advanced rectal cancer. We demonstrated the superiority of the proposed method by analyzing its pCR prediction performance and comparing it with competing baselines based on a large cohort of 912 rectal cancer patients.
Before analyzing the pCR prediction performance of our method, we showed that the average pCR prediction performance was the highest (AUC = 0.819) when using various features from the entire multi-parametric MRI (Table 2). Given multi-parametric MRI, we generated radiomics features and MSFI embedding and merged them through kernel PCA to obtain multi-parametric MRI embedding. The multi-parametric MRI embedding exhibited higher pCR prediction performance than radiomics features or MSFI embedding (Table 3).
This means that some tumor characteristics that are highly relevant to pCR prediction are captured by either radiomics features or MSFI embedding but not both. It also indicates that MSFI embedding can represent novel volumetric features of tumors in multi-parametric MRI. Given multi-parametric MRI embedding, we demonstrated that a random forest classifier was the most effective pCR prediction model (Table 4), as suggested in our method. Then, we confirmed that our method outperformed four competing baselines in terms of overall prediction performance (AUC = 0.837 and F1-score = 0.65) for pCR after nCRT for locally advanced rectal cancer (Table 5).
The 3740 radiomics features and 512 features in MSFI embedding are not equally important to the pCR prediction. Using kernel PCA, we performed non-linear dimensionality reduction over the vector of 4252 features to obtain a low-dimensional embedding that maximizes the variance. In our experiments, we selected 150 as the optimal number of components through hyperparameter tuning. Instead of tuning the output dimension manually, advanced feature selection techniques [50] that automatically determine the optimal number of features can be used. To explore non-linear combinations of features, we can also consider performing kernel PCA by fixing the variance threshold instead of specifying the number of components.
Our MRI data is heterogeneous as it was acquired from different patients using MRI scanners of various vendors, as stated in Appendix A. Due to the lack of a standardized signal intensity scale, heterogeneous MRI images are not directly comparable [31]. To deal with such heterogeneity, we used pyradiomics, the most widely used tool for reliable radiomics feature extraction. During preprocessing, we applied voxel size resampling and signal intensity normalization implemented in pyradiomics because these two techniques have been known to improve the robustness of radiomics features [32,33]. We used the preprocessed MRI data as an input to 3D-CNN for MSFI embedding to improve the robustness of MSFI embedding. We expect that we can further improve the pCR prediction performance by applying semi-supervised training techniques for heterogeneous medical image data [51].
Segmentation variability also affects the pCR prediction performance of the proposed method. As we performed semi-automatic VOI segmentation using 3D Slicer tool that requires manual adjustment, inter- and intra-observer variability still needs to be resolved. The proposed method uses features extracted from segmented VOI of multi-parametric MRI, and thus the pCR prediction performance will gradually drop as segmentation variability increases. While there is a lack of reliable and validated fully automatic VOI segmentation tools for MRI [52], there have been efforts to develop automated VOI segmentation tools based on deep learning [53,54,55]. By using automatic VOI segmentation, we can fully automate the proposed method and perform more reliable and consistent pCR prediction.
This study has clinical significance in that it increases the applicability of a new treatment method, such as “wait-and-see” without surgery [56,57] by achieving a higher prediction performance of pCR after nCRT based on a large number of patients. For the past decade, the two-step process of performing nCRT followed by surgery has been considered as the standard treatment. pCR is often achieved after nCRT only, although the surgery was unavoidable even in the case of pCR. This is because we can determine the presence or absence of pCR only after performing surgery.
Rectal cancer surgery often causes anal function loss and sexual dysfunction. Although these are not directly related to survival, they severely reduce the quality of life. If we can predict pCR after nCRT before surgery with higher accuracy than existing methods as shown in Table 5, this means that more patients can avoid surgery in the case of pCR. Therefore, it is important to predict pCR more accurately and reliably before surgery.
As the wait-and-see method is not included in the internationally standardized medical guidelines, it is currently being conducted only as a clinical study by some professors at our hospital and is not a routine process. Therefore, it is not mandatory for radiologists to provide information on the prediction of pCR. More studies on reliable pre-operative pCR prediction are necessary to establish clinical guidelines for pre-operative pCR prediction, and this study will contribute to it. The inability to compare the results of this study with clinical practice is a limitation of this study, and further research is needed.

6. Conclusions

Given pre-operative multiple MRI sequences, {T2, DWI/ADC, and CE}, of rectal cancer after nCRT, we proposed an effective pCR prediction method by building a random forest classifier through novel multi-parametric MRI embedding. We obtained multi-parametric MRI embedding by MSFI embedding and incorporating it with radiomics features. We extracted MSFI embedding using 3D-ResNet to capture novel volumetric features of tumors by considering multiple MRI sequences jointly.
Through extensive experiments, we demonstrated the superiority of the proposed method by demonstrating the effectiveness of (1) multiple input MRI sequences, (2) multi-parametric MRI embedding, and (3) the random forest pCR classifier. Then, we compared the proposed method with four competing baselines and showed that our method achieved the highest overall pCR prediction performance. Our experimental results are robust in that we used a large dataset of 912 patients’ MRI sequences, which is much larger than that of any existing work.

Author Contributions

Conceptualization, S.K.; methodology, S.K. and S.L.; software, S.K. and S.L.; validation, S.L., S.K. and H.H.; formal analysis, S.L.; investigation, S.L., S.K. and H.H.; resources, J.S., J.L. and S.K.; data curation, J.S., J.L. and S.K.; writing—original draft preparation, S.L., S.K. and H.H.; writing—review and editing, S.L., S.K. and H.H.; visualization, S.L.; supervision, H.H.; project administration, S.K.; funding acquisition, S.K. and H.H. All authors have read and agreed to the published version of the manuscript.

Funding

This study was supported by the National Research Foundation of Korea (NRF) grant funded by the Korea government (MSIT) (NRF-2019R1A2C1008743) and a Basic Science Research Program through the National Research Foundation of Korea (NRF) funded by the Ministry of Education (NRF-2018R1D1A1B07048179).

Institutional Review Board Statement

This study was approved by the Institutional Review Board of Severance Hospital, Yonsei University, College of Medicine, Seoul, Republic of Korea.

Informed Consent Statement

Informed consent was waived due to the retrospective nature of the study.

Data Availability Statement

Data sharing is not applicable.

Conflicts of Interest

The authors declare no conflict of interest.

Appendix A. MRI Protocol

MRI examinations [58] were performed with a 1.5-T scanner (Achieva, Philips Healthcare) or a 3.0-T MR scanner (Magnetom Tim Tio, Siemens Healthineers, Germany; or Ingenia, Philips Medical Systems, the Netherlands). For bowel preparation, 20 mg of scopolamine butylbromide (Buscopan; Boehringer Ingelheim) was injected intramuscularly, and sonography transmission gel (50–100 mL) was administered in the rectal lumen for the mass at the lower or middle rectum before MRI scanning.
The MRI sequences included high-resolution T2-weighted images using a respiratory-triggered fast spin echo (axial, sagittal, and oblique axial and coronal orientations), axial T1-weighted images, axial diffusion-weighted images using single-shot echo-planar imaging (the highest b-values 1000 s/mm 2 ), as well as gadolinium contrast enhanced T1 weighted images using a three-dimensional gradient-echo sequence. The oblique T2-weighted image sequence was obtained orthogonal or parallel to the long axis of the tumor. An intravenous bolus of gadobutrol (Gadovist; Bayer AG, Berlin, German: 0.1 mL/kg of body weight) or gadopentetate dimeglumine (Magnevist; Bayer Healthcare, Berlin, Germany: 0.2 mL/kg of body weight) was injected at a rate of 2.0 mL/s. The details on MRI sequences are summarized in Table A1.
The effectiveness of T2 and ADC in staging/restaging rectal cancer has been widely accepted. Regarding DCE, however, a consensus meeting of 14 abdominal imaging experts from the European Society of Gastrointestinal and Abdominal Radiology (ESGAR) recommended that, although some promising data are available, it should currently be considered as a research tool and not be adopted routinely [59]. Therefore, we acquired contrast enhanced T1 weighted gradient echo images but not DCE.
Table A1. The MRI parameters.
1.5 T3.0 T
Fast Spin-Echo T2-Weighted Image (T2)Diffusion-Weighted Image (DWI)3D T1-Weighted Gradient Echo (CE)Fast Spin-Echo T2-Weighted Image (T2)Diffusion-Weighted Image (DWI)3D T1-Weighted Gradient Echo (CE)
PlaneAxial, Sagittal, Oblique axial, Oblique coronalAxialAxialAxial, Sagittal, Oblique axial, Oblique coronalAxialAxial
Repetition time(ms)2740–42006900–91003.513800–55009500–12,0003.51
Echo time(ms)8064–901.4480–12062–951.44
Flip angle(degrees)13790 90–15090
B factor(s/mm 2 ) 0, 300, 1000 0, 300, 1000
Field of view(mm)180 or 240220240180 or 240220240
Matrix without interpolation304128 or 150240320–448126 or 153240
Slice thickness (mm)333333
Slice gap (mm)00 00
Echo train length16 17 or 35

References

  1. Jung, K.W.; Won, Y.J.; Kong, H.J.; Lee, E.S. Prediction of cancer incidence and mortality in Korea, 2019. Cancer Res. Treat. Off. J. Korean Cancer Assoc. 2019, 51, 431. [Google Scholar] [CrossRef] [PubMed]
  2. Renehan, A.G.; Malcomson, L.; Emsley, R.; Gollins, S.; Maw, A.; Myint, A.S.; Rooney, P.S.; Susnerwala, S.; Blower, A.; Saunders, M.P.; et al. Watch-and-wait approach versus surgical resection after chemoradiotherapy for patients with rectal cancer (the OnCoRe project): A propensity-score matched cohort analysis. Lancet Oncol. 2016, 17, 174–183. [Google Scholar] [CrossRef]
  3. Maas, M.; Lambregts, D.M.; Nelemans, P.J.; Heijnen, L.A.; Martens, M.H.; Leijtens, J.W.; Sosef, M.; Hulsewé, K.W.; Hoff, C.; Breukink, S.O.; et al. Assessment of clinical complete response after chemoradiation for rectal cancer with digital rectal examination, endoscopy, and MRI: Selection for organ-saving treatment. Ann. Surg. Oncol. 2015, 22, 3873–3880. [Google Scholar] [CrossRef] [PubMed] [Green Version]
  4. Patel, U.B.; Brown, G.; Rutten, H.; West, N.; Sebag-Montefiore, D.; Glynne-Jones, R.; Rullier, E.; Peeters, M.; Van Cutsem, E.; Ricci, S.; et al. Comparison of magnetic resonance imaging and histopathological response to chemoradiotherapy in locally advanced rectal cancer. Ann. Surg. Oncol. 2012, 19, 2842–2852. [Google Scholar] [CrossRef] [PubMed]
  5. Dzik-Jurasz, A.; Domenig, C.; George, M.; Wolber, J.; Padhani, A.; Brown, G.; Doran, S. Diffusion MRI for prediction of response of rectal cancer to chemoradiation. Lancet 2002, 360, 307–308. [Google Scholar] [CrossRef]
  6. Villers, A.; Puech, P.; Mouton, D.; Leroy, X.; Ballereau, C.; Lemaitre, L. Dynamic contrast enhanced, pelvic phased array magnetic resonance imaging of localized prostate cancer for predicting tumor volume: Correlation with radical prostatectomy findings. J. Urol. 2006, 176, 2432–2437. [Google Scholar] [CrossRef] [PubMed]
  7. Weiser, M.R.; Gollub, M.J.; Saltz, L.B. Assessment of clinical complete response after chemoradiation for rectal cancer with digital rectal examination, endoscopy, and MRI. Ann. Surg. Oncol. 2015, 22, 3769–3771. [Google Scholar] [CrossRef] [Green Version]
  8. Horvat, N.; Veeraraghavan, H.; Khan, M.; Blazic, I.; Zheng, J.; Capanu, M.; Sala, E.; Garcia-Aguilar, J.; Gollub, M.J.; Petkovska, I. MR imaging of rectal cancer: Radiomics analysis to assess treatment response after neoadjuvant therapy. Radiology 2018, 287, 833–843. [Google Scholar] [CrossRef] [Green Version]
  9. Lambregts, D.M.; Maas, M.; Riedl, R.G.; Bakers, F.C.; Verwoerd, J.L.; Kessels, A.G.; Lammering, G.; Boetes, C.; Beets, G.L.; Beets-Tan, R.G. Value of ADC measurements for nodal staging after chemoradiation in locally advanced rectal cancer—A per lesion validation study. Eur. Radiol. 2011, 21, 265–273. [Google Scholar] [CrossRef] [Green Version]
  10. Nie, K.; Shi, L.; Chen, Q.; Hu, X.; Jabbour, S.K.; Yue, N.; Niu, T.; Sun, X. Rectal cancer: Assessment of neoadjuvant chemoradiation outcome based on radiomics of multiparametric MRI. Clin. Cancer Res. 2016, 22, 5256–5264. [Google Scholar] [CrossRef] [Green Version]
  11. Liu, Z.; Zhang, X.Y.; Shi, Y.J.; Wang, L.; Zhu, H.T.; Tang, Z.; Wang, S.; Li, X.T.; Tian, J.; Sun, Y.S. Radiomics analysis for evaluation of pathological complete response to neoadjuvant chemoradiotherapy in locally advanced rectal cancer. Clin. Cancer Res. 2017, 23, 7253–7262. [Google Scholar] [CrossRef] [Green Version]
  12. Cui, Y.; Yang, X.; Shi, Z.; Yang, Z.; Du, X.; Zhao, Z.; Cheng, X. Radiomics analysis of multiparametric MRI for prediction of pathological complete response to neoadjuvant chemoradiotherapy in locally advanced rectal cancer. Eur. Radiol. 2019, 29, 1211–1220. [Google Scholar] [CrossRef]
  13. Huynh, B.Q.; Antropova, N.; Giger, M.L. Comparison of breast DCE-MRI contrast time points for predicting response to neoadjuvant chemotherapy using deep convolutional neural network features with transfer learning. In Proceedings of the Medical imaging 2017: Computer-Aided Diagnosis. International Society for Optics and Photonics, Orlando, FL, USA, 11–16 February 2017; Volume 10134, p. 101340. [Google Scholar]
  14. Ravichandran, K.; Braman, N.; Janowczyk, A.; Madabhushi, A. A deep learning classifier for prediction of pathological complete response to neoadjuvant chemotherapy from baseline breast DCE-MRI. In Proceedings of the Medical Imaging 2018: Computer-Aided Diagnosis, International Society for Optics and Photonics, Houston, TX, USA, 10–15 February 2018; Volume 10575, p. 105750C. [Google Scholar]
  15. Hu, Q.; Whitney, H.M.; Giger, M.L. A deep learning methodology for improved breast cancer diagnosis using multiparametric MRI. Sci. Rep. 2020, 10, 1–11. [Google Scholar] [CrossRef]
  16. Yun, J.; Park, J.E.; Lee, H.; Ham, S.; Kim, N.; Kim, H.S. Radiomic features and multilayer perceptron network classifier: A robust MRI classification strategy for distinguishing glioblastoma from primary central nervous system lymphoma. Sci. Rep. 2019, 9, 1–10. [Google Scholar] [CrossRef] [Green Version]
  17. Fu, J.; Zhong, X.; Li, N.; Van Dams, R.; Lewis, J.; Sung, K.; Raldow, A.C.; Jin, J.; Qi, X.S. Deep learning-based radiomic features for improving neoadjuvant chemoradiation response prediction in locally advanced rectal cancer. Phys. Med. Biol. 2020, 65, 075001. [Google Scholar] [CrossRef] [Green Version]
  18. Li, H.; Boimel, P.; Janopaul-Naylor, J.; Zhong, H.; Xiao, Y.; Ben-Josef, E.; Fan, Y. Deep convolutional neural networks for imaging data based survival analysis of rectal cancer. In Proceedings of the 2019 IEEE 16th International Symposium on Biomedical Imaging (ISBI 2019), Venice, Italy, 8–11 April 2019; pp. 846–849. [Google Scholar]
  19. Kornblith, S.; Shlens, J.; Le, Q.V. Do better imagenet models transfer better? In Proceedings of the IEEE Conference on Computer Vision and Pattern Recognition, Long Beach, CA, USA, 15–20 June 2019; pp. 2661–2671. [Google Scholar]
  20. Lubner, M.G.; Stabo, N.; Abel, E.J.; del Rio, A.M.; Pickhardt, P.J. CT textural analysis of large primary renal cell carcinomas: Pretreatment tumor heterogeneity correlates with histologic findings and clinical outcomes. Am. J. Roentgenol. 2016, 207, 96–105. [Google Scholar] [CrossRef]
  21. Park, J.H.; Seo, N.; Lim, J.S.; Hahm, J.; Kim, M.J. Feasibility of Simultaneous Multislice Acceleration Technique in Diffusion-Weighted Magnetic Resonance Imaging of the Rectum. Korean J. Radiol. 2020, 21, 77–87. [Google Scholar] [CrossRef] [Green Version]
  22. Gollub, M.; Gultekin, D.; Akin, O.; Do, R.; Fuqua, J.; Gonen, M.; Kuk, D.; Weiser, M.; Saltz, L.; Schrag, D.; et al. Dynamic contrast enhanced-MRI for the detection of pathological complete response to neoadjuvant chemotherapy for locally advanced rectal cancer. Eur. Radiol. 2012, 22, 821–831. [Google Scholar] [CrossRef]
  23. Gillies, R.J.; Kinahan, P.E.; Hricak, H. Radiomics: Images are more than pictures, they are data. Radiology 2016, 278, 563–577. [Google Scholar] [CrossRef] [Green Version]
  24. Lambin, P.; Rios-Velazquez, E.; Leijenaar, R.; Carvalho, S.; Van Stiphout, R.G.; Granton, P.; Zegers, C.M.; Gillies, R.; Boellard, R.; Dekker, A.; et al. Radiomics: Extracting more information from medical images using advanced feature analysis. Eur. J. Cancer 2012, 48, 441–446. [Google Scholar] [CrossRef] [Green Version]
  25. Bibault, J.E.; Giraud, P.; Housset, M.; Durdux, C.; Taieb, J.; Berger, A.; Coriat, R.; Chaussade, S.; Dousset, B.; Nordlinger, B.; et al. Deep Learning and Radiomics predict complete response after neo-adjuvant chemoradiation for locally advanced rectal cancer. Sci. Rep. 2018, 8, 1–8. [Google Scholar]
  26. Cox, D.R. Regression models and life-tables. J. R. Stat. Soc. Ser. (Methodol.) 1972, 34, 187–202. [Google Scholar] [CrossRef]
  27. Ishwaran, H.; Kogalur, U.B.; Blackstone, E.H.; Lauer, M.S. Random survival forests. Ann. Appl. Stat. 2008, 2, 841–860. [Google Scholar] [CrossRef]
  28. Pieper, S.; Halle, M.; Kikinis, R. 3D Slicer. In Proceedings of the 2004 2nd IEEE International Symposium on Biomedical Imaging: Nano to Macro (IEEE Cat No. 04EX821), Arlington, VA, USA, 15–18 April 2004; pp. 632–635. [Google Scholar]
  29. Gosain, A.; Sardana, S. Handling class imbalance problem using oversampling techniques: A review. In Proceedings of the 2017 International Conference on Advances in Computing, Communications and Informatics (ICACCI), Udupi, India, 13–16 September 2017; pp. 79–85. [Google Scholar]
  30. Unser, M.; Aldroubi, A.; Eden, M. B-spline signal processing. I. Theory. IEEE Trans. Signal Process. 1993, 41, 821–833. [Google Scholar] [CrossRef]
  31. Schwier, M.; van Griethuysen, J.; Vangel, M.G.; Pieper, S.; Peled, S.; Tempany, C.; Aerts, H.J.; Kikinis, R.; Fennessy, F.M.; Fedorov, A. Repeatability of multiparametric prostate MRI radiomics features. Sci. Rep. 2019, 9, 1–16. [Google Scholar] [CrossRef] [PubMed]
  32. Park, S.H.; Lim, H.; Bae, B.K.; Hahm, M.H.; Chong, G.O.; Jeong, S.Y.; Kim, J.C. Robustness of magnetic resonance radiomic features to pixel size resampling and interpolation in patients with cervical cancer. Cancer Imaging 2021, 21, 1–11. [Google Scholar] [CrossRef] [PubMed]
  33. Duron, L.; Balvay, D.; Vande Perre, S.; Bouchouicha, A.; Savatovsky, J.; Sadik, J.C.; Thomassin-Naggara, I.; Fournier, L.; Lecler, A. Gray-level discretization impacts reproducible MRI radiomics texture features. PLoS ONE 2019, 14, e0213459. [Google Scholar] [CrossRef] [PubMed]
  34. Hussain, Z.; Gimenez, F.; Yi, D.; Rubin, D. Differential data augmentation techniques for medical imaging classification tasks. In Proceedings of the AMIA Annual Symposium Proceedings, American Medical Informatics Association, Washington, DC, USA, 6–8 November 2017; Volume 2017, p. 979. [Google Scholar]
  35. Perez, F.; Vasconcelos, C.; Avila, S.; Valle, E. Data augmentation for skin lesion analysis. In OR 2.0 Context-Aware Operating Theaters, Computer Assisted Robotic Endoscopy, Clinical Image-Based Procedures, and Skin Image Analysis; Springer: Berlin, Germany, 2018; pp. 303–311. [Google Scholar]
  36. Shin, H.C.; Roth, H.R.; Gao, M.; Lu, L.; Xu, Z.; Nogues, I.; Yao, J.; Mollura, D.; Summers, R.M. Deep convolutional neural networks for computer-aided detection: CNN architectures, dataset characteristics and transfer learning. IEEE Trans. Med. Imaging 2016, 35, 1285–1298. [Google Scholar] [CrossRef] [Green Version]
  37. Almourish, M.H.; Saif, A.A.; Radman, B.M.; Saeed, A.Y. Covid-19 Diagnosis Based on CT Images Using Pre-Trained Models. In Proceedings of the 2021 International Conference of Technology, Science and Administration (ICTSA), Taiz, Yemen, 22–24 March 2021; pp. 1–5. [Google Scholar]
  38. Tran, D.; Wang, H.; Torresani, L.; Ray, J.; LeCun, Y.; Paluri, M. A closer look at spatiotemporal convolutions for action recognition. In Proceedings of the IEEE conference on Computer Vision and Pattern Recognition, Salt Lake City, UT, USA, 18–23 June 2018; pp. 6450–6459. [Google Scholar]
  39. Kay, W.; Carreira, J.; Simonyan, K.; Zhang, B.; Hillier, C.; Vijayanarasimhan, S.; Viola, F.; Green, T.; Back, T.; Natsev, P.; et al. The kinetics human action video dataset. arXiv 2017, arXiv:1705.06950. [Google Scholar]
  40. Van Griethuysen, J.J.; Fedorov, A.; Parmar, C.; Hosny, A.; Aucoin, N.; Narayan, V.; Beets-Tan, R.G.; Fillion-Robin, J.C.; Pieper, S.; Aerts, H.J. Computational radiomics system to decode the radiographic phenotype. Cancer Res. 2017, 77, e104–e107. [Google Scholar] [CrossRef] [Green Version]
  41. Rizzo, S.; Botta, F.; Raimondi, S.; Origgi, D.; Fanciullo, C.; Morganti, A.G.; Bellomi, M. Radiomics: The facts and the challenges of image analysis. Eur. Radiol. Exp. 2018, 2, 1–8. [Google Scholar] [CrossRef]
  42. Sarveniazi, A. An actual survey of dimensionality reduction. Am. J. Comput. Math. 2014, 4, 55–72. [Google Scholar] [CrossRef] [Green Version]
  43. Schölkopf, B.; Smola, A.; Müller, K.R. Kernel principal component analysis. In International Conference on Artificial Neural Networks; Springer: Berlin, Germany, 1997; pp. 583–588. [Google Scholar]
  44. Breiman, L. Random forests. Machine Learn. 2001, 45, 5–32. [Google Scholar] [CrossRef] [Green Version]
  45. Ospina, J.D.; Zhu, J.; Chira, C.; Bossi, A.; Delobel, J.B.; Beckendorf, V.; Dubray, B.; Lagrange, J.L.; Correa, J.C.; Simon, A.; et al. Random forests to predict rectal toxicity following prostate cancer radiation therapy. Int. J. Radiat. Oncol. Biol. Phys. 2014, 89, 1024–1031. [Google Scholar] [CrossRef]
  46. Petkovska, I.; Tixier, F.; Ortiz, E.J.; Pernicka, J.S.G.; Paroder, V.; Bates, D.D.; Horvat, N.; Fuqua, J.; Schilsky, J.; Gollub, M.J.; et al. Clinical utility of radiomics at baseline rectal MRI to predict complete response of rectal cancer after chemoradiation therapy. Abdom. Radiol. 2020, 45, 3608–3617. [Google Scholar] [CrossRef]
  47. Calders, T.; Jaroszewicz, S. Efficient AUC optimization for classification. In European Conference on Principles of Data Mining and Knowledge Discovery; Springer: Berlin, Germany, 2007; pp. 42–53. [Google Scholar]
  48. Liu, L.; Jiang, H.; He, P.; Chen, W.; Liu, X.; Gao, J.; Han, J. On the variance of the adaptive learning rate and beyond. arXiv 2019, arXiv:1908.03265. [Google Scholar]
  49. Kingma, D.P.; Ba, J. Adam: A method for stochastic optimization. arXiv 2014, arXiv:1412.6980. [Google Scholar]
  50. Comelli, A.; Stefano, A.; Coronnello, C.; Russo, G.; Vernuccio, F.; Cannella, R.; Salvaggio, G.; Lagalla, R.; Barone, S. Radiomics: A new biomedical workflow to create a predictive model. In Annual Conference on Medical Image Understanding and Analysis; Springer: Berlin, Germany, 2020; pp. 280–293. [Google Scholar]
  51. Marini, N.; Otálora, S.; Müller, H.; Atzori, M. Semi-supervised training of deep convolutional neural networks with heterogeneous data and few local annotations: An experiment on prostate histopathology image classification. Med. Image Anal. 2021, 73, 102165. [Google Scholar] [CrossRef]
  52. Granzier, R.; Verbakel, N.; Ibrahim, A.; van Timmeren, J.; van Nijnatten, T.; Leijenaar, R.; Lobbes, M.; Smidt, M.; Woodruff, H. MRI-based radiomics in breast cancer: Feature robustness with respect to inter-observer segmentation variability. Sci. Rep. 2020, 10, 1–11. [Google Scholar] [CrossRef]
  53. Ronneberger, O.; Fischer, P.; Brox, T. U-net: Convolutional networks for biomedical image segmentation. In International Conference on Medical Image Computing and Computer-Assisted Intervention; Springer: Berlin, Germany, 2015; pp. 234–241. [Google Scholar]
  54. He, K.; Gkioxari, G.; Dollár, P.; Girshick, R. Mask r-cnn. In Proceedings of the IEEE International Conference on Computer Vision, Venice, Italy, 22–29 October 2017; pp. 2961–2969. [Google Scholar]
  55. Comelli, A.; Dahiya, N.; Stefano, A.; Vernuccio, F.; Portoghese, M.; Cutaia, G.; Bruno, A.; Salvaggio, G.; Yezzi, A. Deep Learning-Based Methods for Prostate Segmentation in Magnetic Resonance Imaging. Appl. Sci. 2021, 11, 782. [Google Scholar] [CrossRef]
  56. Habr-Gama, A.; Perez, R.O.; Nadalin, W.; Sabbaga, J.; Ribeiro, U., Jr.; Silva e Sousa, A.H., Jr.; Campos, F.G.; Kiss, D.R.; Gama-Rodrigues, J. Operative versus nonoperative treatment for stage 0 distal rectal cancer following chemoradiation therapy: Long-term results. Ann. Surg. 2004, 240, 711. [Google Scholar] [CrossRef]
  57. Habr-Gama, A.; Perez, R.O.; Proscurshim, I.; Campos, F.G.; Nadalin, W.; Kiss, D.; Gama-Rodrigues, J. Patterns of failure and survival for nonoperative treatment of stage c0 distal rectal cancer following neoadjuvant chemoradiation therapy. J. Gastrointest. Surg. 2006, 10, 1319–1329. [Google Scholar] [CrossRef]
  58. Horvat, N.; Carlos Tavares Rocha, C.; Clemente Oliveira, B.; Petkovska, I.; Gollub, M.J. MRI of rectal cancer: Tumor staging, imaging techniques, and management. Radiographics 2019, 39, 367–387. [Google Scholar] [CrossRef]
  59. Beets-Tan, R.G.; Lambregts, D.M.; Maas, M.; Bipat, S.; Barbaro, B.; Curvo-Semedo, L.; Fenlon, H.M.; Gollub, M.J.; Gourtsoyianni, S.; Halligan, S.; et al. Magnetic resonance imaging for clinical management of rectal cancer: Updated recommendations from the 2016 European Society of Gastrointestinal and Abdominal Radiology (ESGAR) consensus meeting. Eur. Radiol. 2018, 28, 1465–1475. [Google Scholar] [CrossRef] [Green Version]
Figure 1. Three types of MRI images {T2, DWI/ADC, and CE} of a pCR patient (upper) and a non-pCR one (lower). Yellow masks are rectal tumor areas segmented and validated by radiologists.
Applsci 11 09494 g001
Figure 2. The pCR prediction process using the 3D-CNN classifier from which we extract MSFI embedding, given {T2, DWI/ADC, and CE} MRI sequences.
Applsci 11 09494 g002
Figure 3. Architecture of the 3D-CNN classifier for MSFI embedding extraction.
Applsci 11 09494 g003
Figure 4. Radiomics feature extraction.
Applsci 11 09494 g004
Figure 5. The overall pCR prediction method using both radiomics features and MSFI embedding, given three MRI sequences.
Applsci 11 09494 g005
Table 1. Disease stages of rectal cancer patients (total = 912).
Train (n = 592)Validation (n = 320)
Age (mean ± SD years)58.8 ± 12.159.5 ± 11.8
Male (n (%))/Female (n (%))388 (65.5)/204 (34.5)199 (62.2)/121 (37.8)
pCR (n (%))114 (19.3)78 (24.4)
ypT stage (n (%))
T0114 (19.3)78 (24.4)
Tis6 (1.0)8 (2.5)
T136 (6.1)14 (4.4)
T2145 (24.5)60 (18.8)
T3285 (48.1)156 (48.8)
T46 (1.0)4 (1.3)
ypN stage (n (%))
N0409 (69.1)231 (72.2)
N1139 (23.5)76 (23.8)
N244 (7.4)13 (4.1)
Table 2. Comparison of pCR prediction performance of five types of input MRI sequences. For a fair comparison, we extract both MSFI embedding and radiomics features from input MRI sequences, apply three different dimension reduction methods in {No dimension reduction, PCA, and Kernel PCA} and report the AUC of an ensemble classifier.
Input MRI SequencesNo Dimension ReductionPCAKernel PCA
{T2}0.7650.7910.787
{DWI/ADC}0.7210.8010.791
{CE}0.7160.8000.801
{T2, DWI/ADC}0.7640.7930.800
{T2, DWI/ADC, and CE}0.8110.8040.819
Table 3. Comparison of pCR prediction performance of various combinations of feature vectors and dimension reduction methods. Three types of feature vectors, {radiomics features, MSFI embedding, concatenation of both}, and three dimension reduction methods, {No dimension reduction, PCA, and Kernel PCA}, are considered. The pCR classification model is fixed to a random forest.
Feature VectorNo Dimension ReductionPCAKernel PCA
MSFI embedding0.7760.7390.732
Radiomics features0.8110.7540.819
Concatenation of both0.7960.7460.837
Table 4. Comparison of pCR prediction performance of various classifiers built on multi-parametric MRI embedding.
ClassifierLogistic
Regression
XgboostLightgbmRandom
Forest
MLPEnsemble
AUC0.8040.7830.7920.8370.7980.819
Table 5. Comparison of pCR prediction performance with competing baselines.
pCR Prediction MethodAUCF1-ScoreSpecificitySensitivity
(B1) SVM classifier (input = radiomics features) [46]0.7990.530.450.67
(B2) RF classifier (input = radiomics features) [8]0.8110.630.560.74
(B3) MLP classifier (input = radiomics features) [25]0.7630.540.490.62
(B4) 3D-CNN classifier (input = MRI images) [18]0.8070.630.590.68
Proposed Method0.8370.650.600.72
Publisher’s Note: MDPI stays neutral with regard to jurisdictional claims in published maps and institutional affiliations.

