
Very Fast RP–UHPLC–PDA Method for Identification and Quantification of the Cannabinoids from Hemp Oil


Abstract
:1. Introduction
2. Materials and Methods
2.1. Chemicals and Materials
2.2. Instrumentation
2.3. Chromatographic Condition
2.4. Standard and Quality Control (QS) Solutions Preparation
2.5. Test Materials and Sample Preparation
2.6. Method Validation Parameters
2.6.1. Specificity
2.6.2. Precision
2.6.3. Accuracy
2.6.4. Linearity
2.6.5. Limit of Detection (LOD) and Limit of Quantification (LOQ)
3. Results
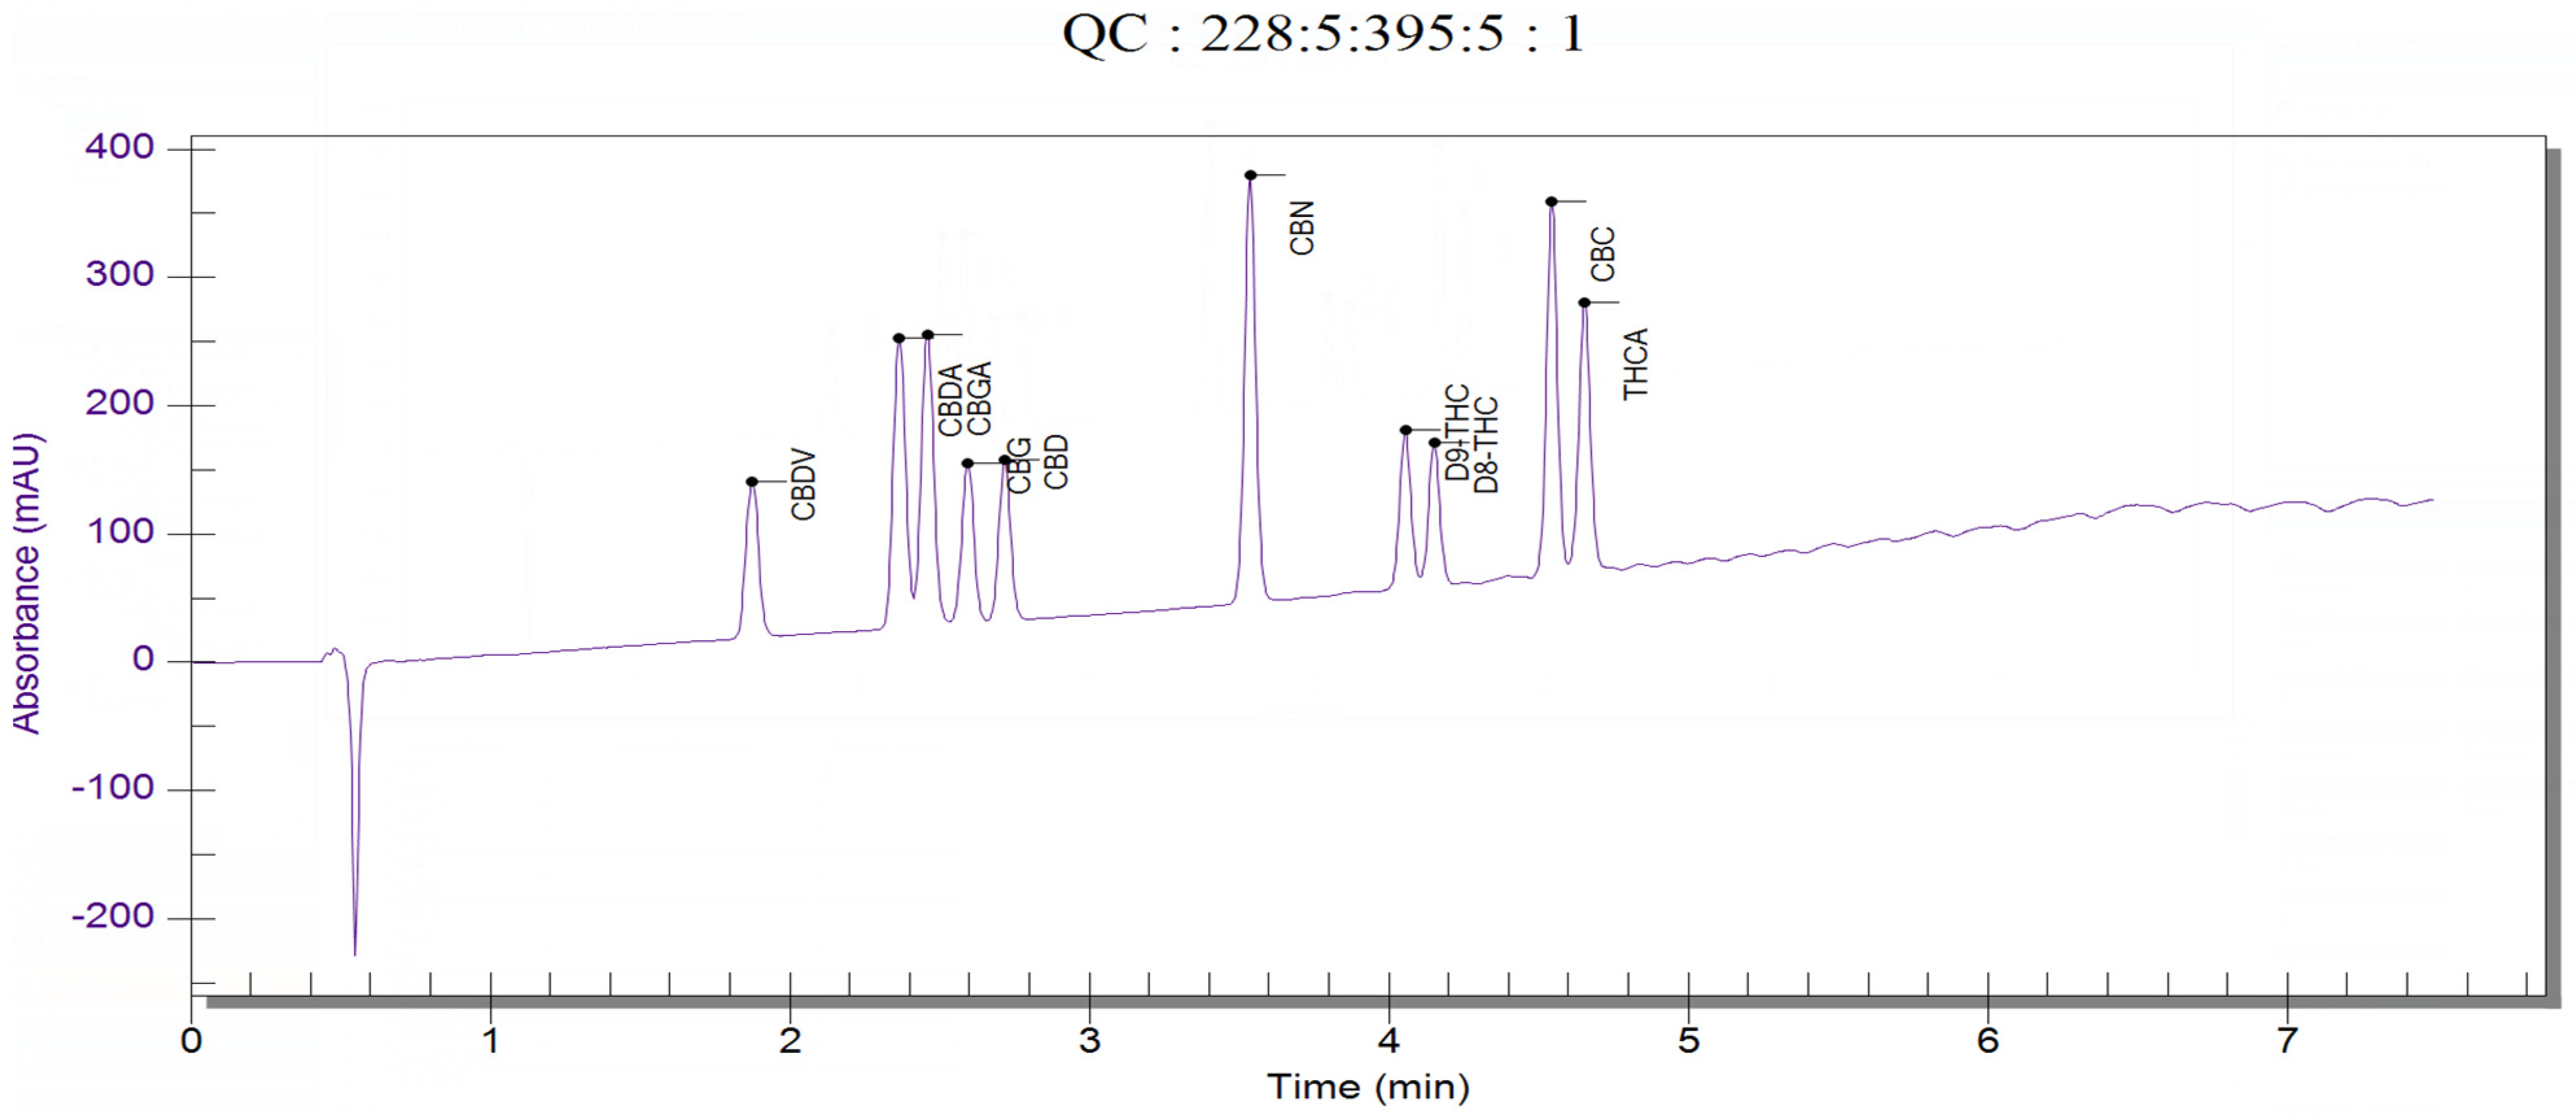
3.1. Specificity
3.2. Precision
3.3. Accuracy
3.4. Linearity
3.5. Limit of Detection (LOD) and Limit of Quantification (LOQ)
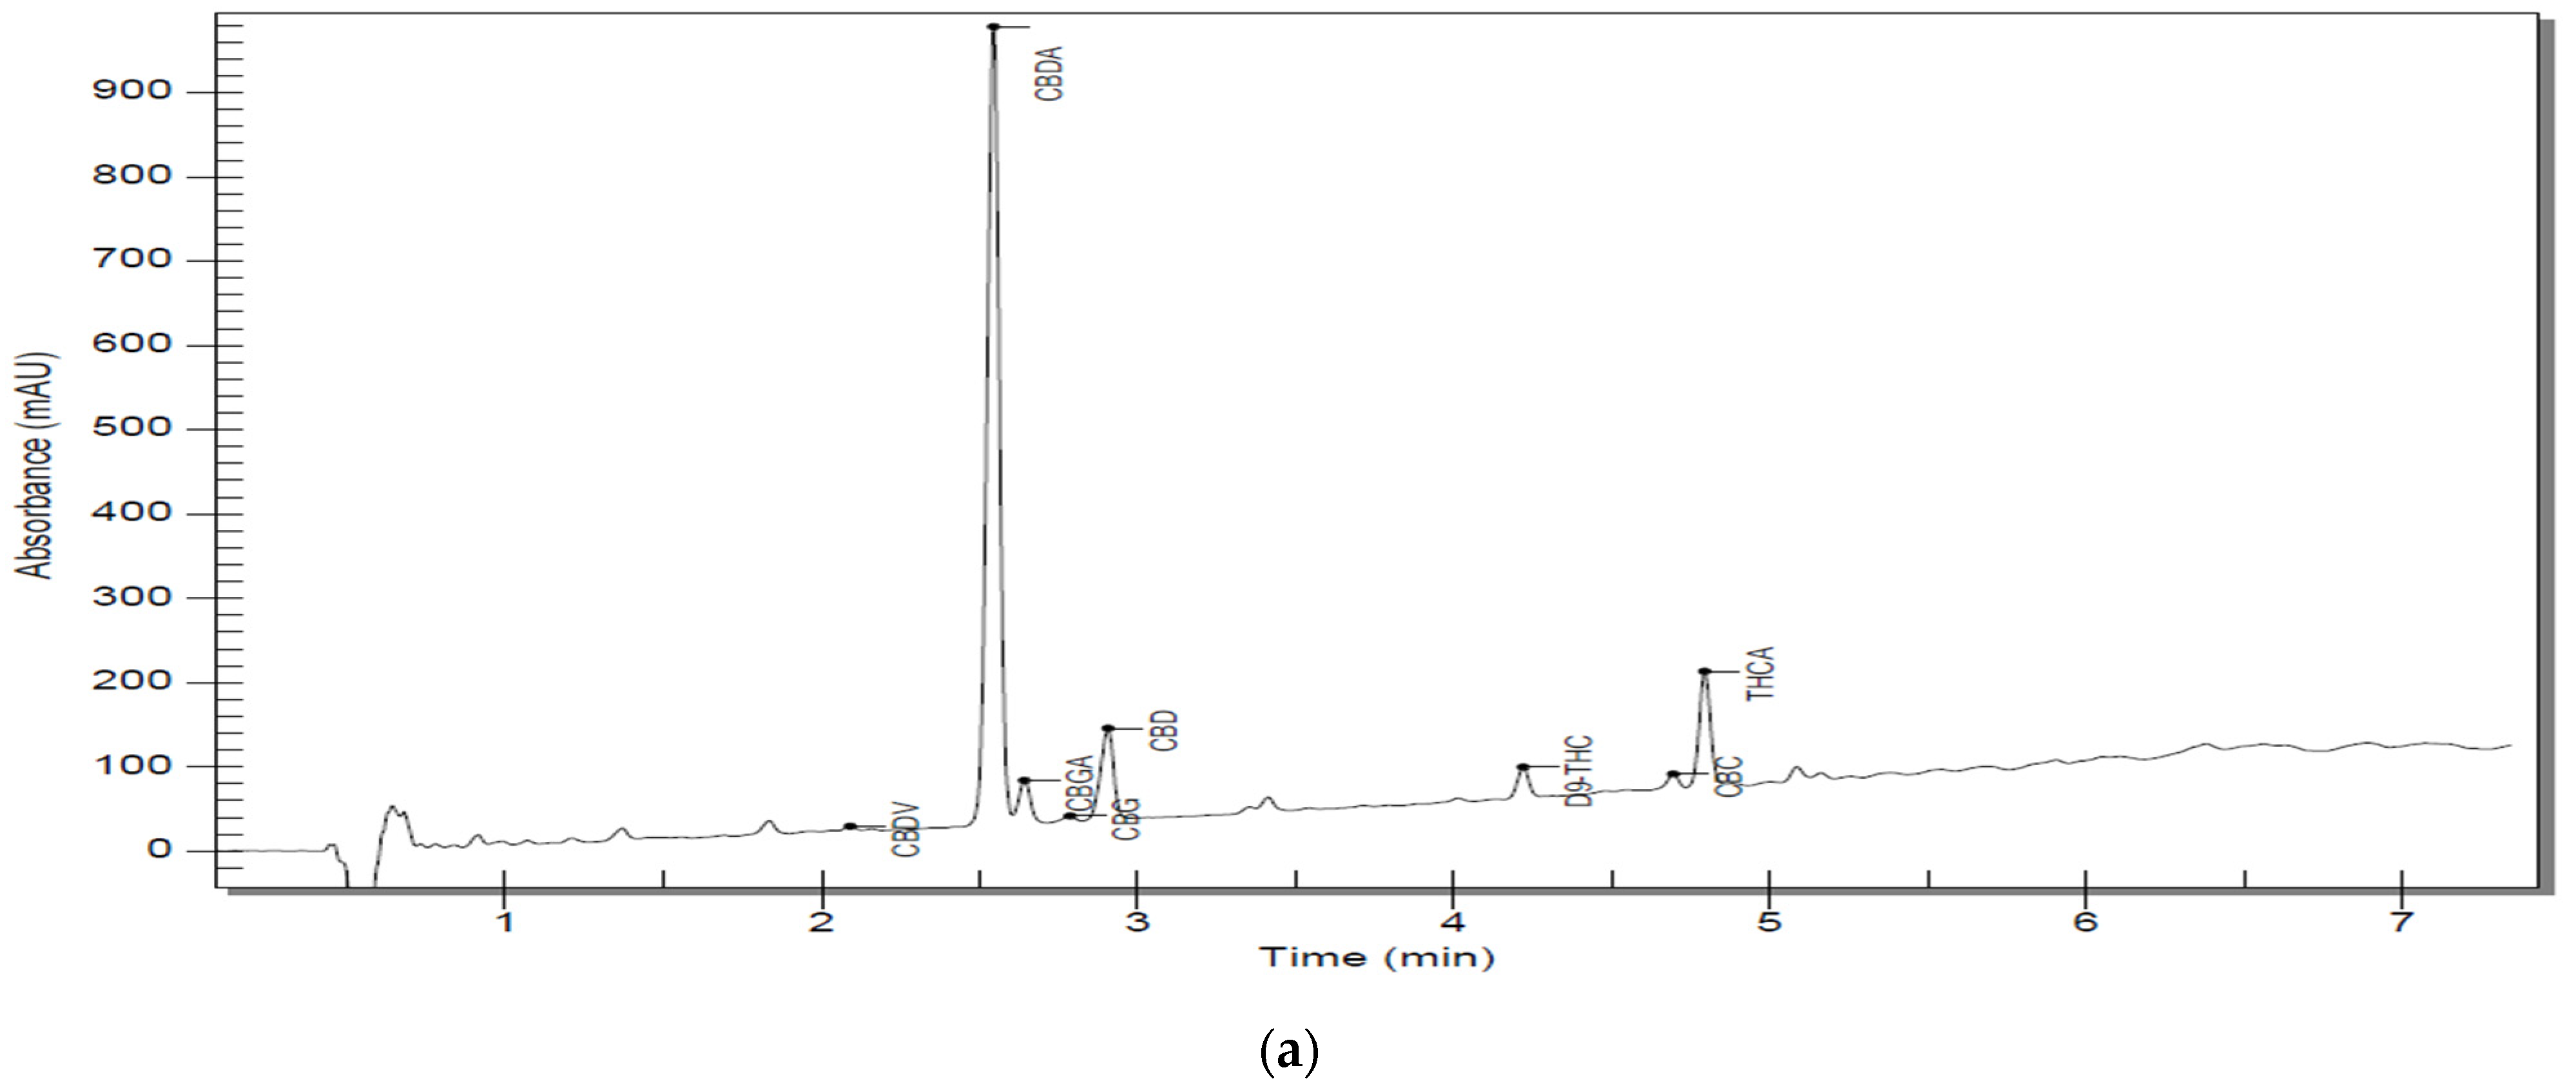
3.6. Cannabinoids in Hemp Oil
- 1× blank;
- 1× Calibration solution 2.5 µg/mL;
- 1× QC solution;
- 1× 3000-Fold samples;
- 1× 300-Fold samples;
- 1× QC every 10 samples;
- 1× QC after all samples;
- 1× Blank;
- 1× Wash.
4. Conclusions
Supplementary Materials
Author Contributions
Funding
Institutional Review Board Statement
Informed Consent Statement
Data Availability Statement
Acknowledgments
Conflicts of Interest
Abbreviations
| CBDV | Cannabidivarin |
| CBDA | Cannabidiolic acid |
| CBGA | Cannabigerolic acid |
| CBG | Cannabigerol |
| CBD | Cannabidiol |
| CBND | Cannabinodiol |
| CBE | Cannabielsoin |
| CBN | Cannabinol |
| ∆9-THC | Δ9-Tetrahydrocannabinol |
| Δ8-THC | Δ8-Tetrahydrocannabinol |
| CBC | Cannabichromene |
| THCA | Tetrahydrocannabinolic acid |
| CBL | Cannabicyclol |
| CBT | Cannabitriol |
References
- Lafaye, G.; Karila, L.; Blecha, L.; Benyamina, A. Cannabis, cannabinoids, and health. Dialogues Clin. Neurosci. 2017, 19, 309–316. [Google Scholar] [PubMed]
- Vlad, R.A.; Hancu, G.; Ciurba, A.; Antonoaea, P.; Rédai, E.M.; Todoran, N.; Muntean, D.L. Cannabidiol—Therapeutic and legal aspects. Pharmazie 2020, 75, 463–469. [Google Scholar] [PubMed]
- Bonini, S.A.; Premoli, M.; Tambaro, S.; Kumar, A.; Maccarinelli, G.; Memo, M.; Mastinu, A. Cannabis sativa: A comprehensive ethnopharmacological review of a medicinal plant with a long history. J. Ethnopharmacol. 2018, 5, 300–315. [Google Scholar] [CrossRef]
- Schluttenhofer, C.; Yuan, L. Challenges towards Revitalizing Hemp: A Multifaceted Crop. Trends Plant. Sci. 2017, 22, 917–929. [Google Scholar] [CrossRef] [PubMed] [Green Version]
- Namdar, D.; Mazuz, M.; Ion, A.; Koltai, H. Variation in the compositions of cannabinoid and terpenoids in Cannabis sativa derived from inflorescence position along the stem and extraction methods. Ind. Crop. Prod. 2018, 113, 376–382. [Google Scholar] [CrossRef]
- Eržen, M.; Košir, I.J.; Ocvirk, M.; Kreft, S.; Čerenak, A. Metabolomic Analysis of Cannabinoid and Essential Oil Profiles in Different Hemp (Cannabis sativa L.) Phenotypes. Plants 2021, 10, 966. [Google Scholar] [CrossRef] [PubMed]
- Hanuš, L.O.; Meyer, S.M.; Muñoz, E.; Taglialatela-Scafati, O.; Appendino, G. Phytocannabinoids: A unified critical inventory. Nat. Prod. Rep. 2016, 33, 1357–1392. [Google Scholar] [CrossRef] [Green Version]
- Hazekamp, A.; Choi, Y.H.; Verpoorte, R. Quantitative analysis of cannabinoids from Cannabis sativa using 1H-NMR. Chem. Pharm. Bull. 2004, 52, 718–721. [Google Scholar] [CrossRef] [Green Version]
- Sandler, L.N.; Beckerman, J.L.; Whitford, F.; Gibsonet, K.A. Cannabis as conundrum. Crop. Prot. 2019, 117, 37–44. [Google Scholar] [CrossRef]
- Blebea, N.M.; Bucur, L.A. Pharmacotherapeutic options in neoplastic diseases-part IV. Farmacist.ro 2021, 4, 15–18. [Google Scholar] [CrossRef]
- Ibarra-Lecue, I.; Mollinedo-Gajate, I.; Meana, J.J.; Callado, L.F.; Diez-Alarcia, R.; Uriguen, L. Chronic cannabis promotes pro-hallucinogenic signaling of 5-HT2A receptors through Akt/mTOR pathway. Neuropsychopharmacology 2018, 43, 2028–2035. [Google Scholar] [CrossRef]
- Aizpurua-Olaizola, O.; Soydaner, U.; Öztürk, E.; Schibano, D.; Simsir, Y.; Navarro, P.; Etxebarria, N.; Usobiaga, A. Evolution of the Cannabinoid and Terpene Content during the Growth of Cannabis sativa Plants from Different Chemotypes. J. Nat. Prod. 2016, 79, 324–331. [Google Scholar] [CrossRef]
- Berman, P.; Futoran, K.; Lewitus, G.M.; Mukha, D.; Benami, M.; Shlomi, T.; Meiri, D. A new ESI-LC/MS approach for comprehensive metabolic profiling of phytocannabinoids in Cannabis. Sci. Rep. 2018, 8, 14280. [Google Scholar] [CrossRef] [Green Version]
- VanDolah, H.J.; Bauer, B.; Mauck, K.F. Clinicians’ Guide to Cannabidiol and Hemp Oils. Mayo Clin. Proc. 2019, 94, 1840–1851. [Google Scholar] [CrossRef] [Green Version]
- Fischedick, J.T.; Hazekamp, A.; Erkelens, T.; Choi, Y.H.; Verpoorte, R. Metabolic fingerprinting of Cannabis sativa L., cannabinoids and terpenoids for chemotaxonomic and drug standardization purposes. Phytochemistry 2010, 71, 2058–2073. [Google Scholar]
- Dussy, F.E.; Hamberg, C.; Luginbühl, M.; Schwerzmann, T. Isolation of Delta9-THCA-A from hemp and analytical aspects concerning the determination of Delta9-THC in cannabis products. Forensic Sci. Int. 2005, 149, 3–10. [Google Scholar] [CrossRef]
- Fischedick, J.; Kooy, F.V.D.; Verpoorte, R. Cannabinoid receptor 1 binding activity and quantitative analysis of Cannabis sativa L. smoke and vapor. Chem. Pharm. Bull. 2010, 58, 201–207. [Google Scholar] [CrossRef] [PubMed] [Green Version]
- Corroon, J.; Kight, R. Regulatory Status of Cannabidiol in the United States: A Perspective. Cannabis Cannabinoid Res. 2018, 3, 190–194. [Google Scholar] [CrossRef] [PubMed]
- Aizpurua-Olaizola, O.; Omar, J.; Navarro, P.; Olivares, M.; Etxebarria, N.; Usobiaga, A. Identification and quantification of cannabinoids in Cannabis sativa L. plants by high performance liquid chromatography-mass spectrometry. Anal. Bioanal. Chem. 2014, 406, 7549–7560. [Google Scholar] [CrossRef] [PubMed]
- Blebea, N.M.; Negreș, S. Methods for quantification of the main cannabinoids in CBD oil. In Proceedings of the Geolinks International Conference on Environmental Sciences 2021, Online Conference on Environmental Sciences, Burgas, Bulgaria, 17–18 May 2021; pp. 57–64. [Google Scholar]
- Rodrigues, A.; Yegles, M.; Van Elsué, N.; Schneider, S. Determination of cannabinoids in hair of CBD rich extracts consumers using gas chromatography with tandem mass spectrometry (GC/MS-MS). Forensic Sci. Int. 2018, 292, 163–166. [Google Scholar] [CrossRef]
- Cardenia, V.; Gallina Toschi, T.; Scappini, S.; Rubino, R.C.; Rodriguez-Estrada, M.T. Development and validation of a Fast gas chromatography/mass spectrometry method for the determination of cannabinoids in Cannabis sativa L. J. Food Drug Anal. 2018, 26, 1283–1292. [Google Scholar] [CrossRef]
- Leghissa, A.; Hildenbrand, Z.L.; Foss, F.W.; Schug, K.A. Determination of cannabinoids from a surrogate hops matrix using multiple reaction monitoring gas chromatography with triple quadrupole mass spectrometry. J. Sep. Sci. 2018, 41, 459–468. [Google Scholar] [CrossRef]
- Patel, B.; Wene, D.; Fan, Z.T. Qualitative and quantitative measurement of cannabinoids in cannabis using modified HPLC/DAD method. J. Pharm Biomed. Anal. 2017, 146, 15–23. [Google Scholar] [CrossRef]
- Pellati, F.; Brighenti, V.; Sperlea, J.; Marchetti, L.; Bertelli, D. New Methods for the Comprehensive Analysis of Bioactive Compounds in Cannabis sativa L. (hemp). Molecules 2018, 23, 2639. [Google Scholar] [CrossRef] [PubMed] [Green Version]
- Ciolino, L.A.; Ranieri, T.L.; Taylor, A.M. Commercial cannabis consumer products part 2: HPLC-DAD quantitative analysis of cannabis cannabinoids. Forensic Sci. Int. 2018, 289, 438–447. [Google Scholar] [CrossRef] [PubMed]
- Rodríguez, E.; Szijj, J.; Inglott, A.; Azzopardi, L.M. Analytical Techniques Used for Analysis of Cannabinoids. Cannabis Sci. Technol. 2021, 4, 34–46. [Google Scholar]
- Blebea, N.M.; Costache, T.; Negreș, S. The qualitative and quantitative analysis of CBD in hemp oils by UHPLC with PDA and applications. Sci. Pap. Ser. D Anim. Sci. 2019, 62, 138–142. [Google Scholar]
- Raharjo, T.J.; Verpoorte, R. Methods for the analysis of cannabinoids in biological materials: A review. Phytochem. Anal. 2004, 15, 79–94. [Google Scholar] [CrossRef]
- Citti, C.; Braghiroli, D.; Vandelli, M.A.; Cannazza, G. Pharmaceutical and biomedical analysis of cannabinoids: A critical review. J. Pharm. Biomed. Anal. 2018, 147, 565–579. [Google Scholar] [CrossRef]
- Leghissa, A.; Hildenbrand, Z.L.; Schug, K.A. A review of methods for the chemical characterization of cannabis natural products. J. Sep. Sci. 2018, 41, 398–415. [Google Scholar] [CrossRef]
- Mandrioli, M.; Tura, M.; Scotti, S.; Toschi, T.G. Fast Detection of 10 Cannabinoids by RP-HPLC-UV Method in Cannabis sativa L. Molecules 2019, 4, 2113. [Google Scholar] [CrossRef] [Green Version]
- Pavlovic, R.; Nenna, G.; Calvi, L.; Panseri, S.; Borgonovo, G.; Giupponi, L.; Cannazza, G.; Giorgi, A. Quality Traits of “Cannabidiol Oils”: Cannabinoids Content, Terpene Fingerprint and Oxidation Stability of European Commercially Available Preparations. Molecules 2018, 23, 1230. [Google Scholar] [CrossRef] [PubMed] [Green Version]
- Hazekamp, A. The Trouble with CBD Oil. Med. Cannabis Cannabinoids 2018, 1, 65–72. [Google Scholar] [CrossRef]
- Winkler, P. The analysis of pesticides and cannabinoids in cannabis using LC-MS/MS. In Comprehensive Analytical Chemistry; Ferrer, I., Thurman, E.M., Eds.; Elsevier: Amsterdam, The Netherlands, 2020; Volume 90, pp. 277–313. [Google Scholar]
- Hazekamp, A.; Peltenburg, A.; Verpoorte, R.; Giroud, C. Chromatographic and Spectroscopic Data of Cannabinoids from Cannabis sativa L. J. Liq. Chromatogr. Relat. Technol. 2005, 28, 2361–2382. [Google Scholar] [CrossRef]
- Le, T.H.H.; Phung, T.H.; Le, D.C. Development and Validation of an HPLC Method for Simultaneous Assay of Potassium Guaiacolsulfonate and Sodium Benzoate in Pediatric Oral Powder. J. Anal. Methods Chem. 2019, 2019, 1–9. [Google Scholar] [CrossRef]
- Thompson, M.; Ellison, S.L.R.; Wood, R. Harmonized Guidelines for single-laboratory validation of method of analyses (IUPAC Technical Report). Pure Appl. Chem. 2002, 74, 835–855. [Google Scholar] [CrossRef]


| Analyte | CBDV | CBDA | CBGA | CBG | CBD | CBN | ∆9-THC | ∆8-THC | CBC | THCA |
|---|---|---|---|---|---|---|---|---|---|---|
| Rt (min) | 1.87 | 2.36 | 2.46 | 2.59 | 2.71 | 3.53 | 4.05 | 4.15 | 4.54 | 4.65 |
| Analyte | S1 | S2 | S3 | S4 | S5 | S6 | S7 | S8 | S9 |
|---|---|---|---|---|---|---|---|---|---|
| CBDV | 1.29 | 1.02 | N/A | 1.62 | 1.26 | N/A | 4.2 | 1.82 | 1.96 |
| CBDA | 1.09 | 1.45 | N/A | 1.36 | 1.48 | 1.68 | 1.33 | 1.57 | N/A |
| CBGA | 2.07 | N/A | N/A | N/A | 1.46 | 1.52 | 1.67 | N/A | N/A |
| CBG | 1.23 | 1.05 | N/A | N/A | 1.09 | N/A | 1.41 | N/A | N/A |
| CBD | 1.29 | 1.06 | 1.12 | 2.21 | 1.13 | 1.09 | 1.29 | 1.33 | 1.07 |
| CBN | N/A | 1.68 | 1.42 | 3.37 | N/A | N/A | 1.19 | N/A | N/A |
| ∆9-THC | 1.29 | 2.06 | 1.19 | N/A | 1.54 | 1.15 | 1.40 | N/A | N/A |
| ∆8-THC | N/A | N/A | N/A | 1.27 | N/A | N/A | N/A | N/A | N/A |
| CBC | 1.14 | 7.23 | 2.15 | 1.39 | 1.05 | 1.05 | N/A | N/A | N/A |
| THCA | 1.42 | 1.19 | N/A | N/A | 1.15 | 1.21 | N/A | N/A | N/A |
| Analyte | Theoretical Concentration (µg/mL) | Amount Recovered (µg/mL) | Recovery (Mean ± %RSD) |
|---|---|---|---|
| THCA | 16.69 | 16.69 | 100.12 ± 0.20 |
| 16.75 | |||
| 16.69 | |||
| CBDV | 16.71 | 16.88 | 101.38 ± 0.26 |
| 16.97 | |||
| 16.94 | |||
| CBDA | 16.70 | 16.92 | 101.38 ± 0.02 |
| 16.92 | |||
| 16.93 | |||
| CBGA | 16.71 | 16.92 | 101.29 ± 0.05 |
| 16.92 | |||
| 16.91 | |||
| CBG | 16.67 | 16.82 | 101.01 ± 0.12 |
| 16.82 | |||
| 16.85 | |||
| CBD | 16.71 | 16.83 | 100.89 ± 0.15 |
| 16.86 | |||
| 16.88 | |||
| CBN | 16.79 | 17.13 | 102.12 ± 0.15 |
| 17.17 | |||
| 17.13 | |||
| ∆9-THC | 16.65 | 17.01 | 102.00 ± 0.17 |
| 16.96 | |||
| 16.97 | |||
| ∆8-THC | 16.69 | 16.87 | 101.78 ± 0.80 |
| 16.94 | |||
| 17.13 | |||
| CBC | 16.67 | 16.88 | 101.05 ± 0.18 |
| 16.82 | |||
| 16.83 |
| Analyte | Regression Equation | R2 |
|---|---|---|
| CBDV | y = 22,747x + 11,129 | 0.9999 |
| CBDA | y = 37,845x + 26,076 | 0.9997 |
| CBGA | y = 39,081x + 26,087 | 0.9996 |
| CBG | y = 21,367x + 11,536 | 0.9999 |
| CBD | y = 21,100x + 10,921 | 0.9998 |
| CBN | y = 47,883x + 51,955 | 0.9990 |
| ∆9-THC | y = 18,904x + 14,026 | 0.9997 |
| ∆8-THC | y = 17,184x + 10,464 | 0.9998 |
| CBC | y = 44,184x − 6791.7 | 0.9998 |
| THCA | y = 34,511x − 7682.5 | 0.9997 |
| Analyte | LOD (µg/mL) | LOQ (µg/mL) | LOD (mg/g) | LOQ (mg/g) |
|---|---|---|---|---|
| CBDV | 0.70 | 2.12 | 0.21 | 0.64 |
| CBDA | 1.69 | 5.13 | 0.51 | 1.54 |
| CBGA | 1.78 | 5.39 | 0.53 | 1.62 |
| CBG | 0.67 | 2.03 | 0.20 | 0.61 |
| CBD | 0.63 | 1.92 | 0.19 | 0.58 |
| CBN | 3.31 | 10.04 | 0.99 | 3.01 |
| ∆9-THC | 0.75 | 2.27 | 0.22 | 0.68 |
| ∆8-THC | 0.82 | 2.50 | 0.25 | 0.75 |
| CBC | 1.30 | 3.93 | 0.39 | 1.18 |
| THCA | 1.84 | 5.59 | 0.55 | 1.68 |
| S1 HE + HSO | S2 HE + HSO | S3 INF + HO | S4 CBD + T + HSO | S5 HE + HSO | S6 HE + HSO | S7 SCO2 | S8 CBD + HSO | S9 CBD + MCT | ||||||||||
|---|---|---|---|---|---|---|---|---|---|---|---|---|---|---|---|---|---|---|
| Analyte | Rt | C | Rt | C | Rt | C | Rt | C | Rt | C | Rt | C | Rt | C | Rt | C | Rt | C |
| CBDV | 1.84 | <LOQ | 1.89 | 14.70 | N/A | <LOD | 1.96 | <LOQ | 2.09 | <LOQ | N/A | <LOD | 1.81 | 2.52 | 1.94 | <LOQ | 2.03 | <LOQ |
| CBDA | 2.38 | 50.06 | 2.38 | 18.77 | N/A | <LOD | 2.38 | 1.62 | 2.54 | 17.81 | 2.54 | 14.65 | 2.38 | 6.79 | 2.34 | <LOQ | N/A | <LOD |
| CBGA | 2.48 | 1.19 | N/A | <LOD | N/A | <LOD | N/A | <LOD | 2.64 | 0.98 | 2.64 | <LOQ | 2.47 | <LOQ | N/A | <LOD | N/A | <LOD |
| CBG | 2.61 | <LOQ < L | 2.61 | 2.13 | N/A | <LOD | N/A | <LOD | 2.78 | <LOQ | N/A | <LOD | 2.60 | <LOQ | N/A | <LOD | N/A | <LOD |
| CBD | 2.73 | 2.34 | 2.73 | 70.09 | 2.73 | 2.53 | 2.73 | <LOQ | 2.90 | 4.37 | 2.90 | 1.42 | 2.73 | 166.32 | 2.80 | 89.88 | 2.90 | 50.67 |
| CBN | N/A | <LOD | 3.55 | <LOQ | 3.52 | <LOQ | 3.62 | <LOQ | N/A | <LOD | N/A | <LOD | 3.54 | 4.57 | N/A | <LOD | N/A | <LOD |
| ∆9-THC | 4.07 | <LOQ | 4.07 | <LOQ | 4.06 | <LOQ | N/A | <LOD | 4.22 | 1.35 | 4.22 | <LOQ | 4.06 | 1.06 | N/A | <LOD | N/A | <LOD |
| ∆8-THC | N/A | <LOD | N/A | <LOD | N/A | <LOD | 4.11 | <LOQ | N/A | <LOD | N/A | <LOD | 4.16 | <LOD | N/A | <LOD | N/A | <LOD |
| CBC | 4.55 | <LOQ | 4.55 | <LOQ | 4.55 | <LOQ | 4.55 | <LOQ | 4.69 | <LOQ | 4.70 | <LOQ | 4.55 | <LOD | N/A | <LOD | N/A | <LOD |
| THCA | 4.66 | 2.01 | 4.65 | <LOQ | N/A | <LOD | 4.67 | <LOD | 4.79 | 2.75 | 4.79 | 1.80 | 4.65 | <LOD | N/A | <LOD | N/A | <LOD |
Publisher’s Note: MDPI stays neutral with regard to jurisdictional claims in published maps and institutional affiliations. |
© 2021 by the authors. Licensee MDPI, Basel, Switzerland. This article is an open access article distributed under the terms and conditions of the Creative Commons Attribution (CC BY) license (https://creativecommons.org/licenses/by/4.0/).
Share and Cite
Blebea, N.M.; Rambu, D.; Costache, T.; Negreș, S. Very Fast RP–UHPLC–PDA Method for Identification and Quantification of the Cannabinoids from Hemp Oil. Appl. Sci. 2021, 11, 9414. https://doi.org/10.3390/app11209414
Blebea NM, Rambu D, Costache T, Negreș S. Very Fast RP–UHPLC–PDA Method for Identification and Quantification of the Cannabinoids from Hemp Oil. Applied Sciences. 2021; 11(20):9414. https://doi.org/10.3390/app11209414
Chicago/Turabian StyleBlebea, Nicoleta Mirela, Dan Rambu, Teodor Costache, and Simona Negreș. 2021. "Very Fast RP–UHPLC–PDA Method for Identification and Quantification of the Cannabinoids from Hemp Oil" Applied Sciences 11, no. 20: 9414. https://doi.org/10.3390/app11209414
APA StyleBlebea, N. M., Rambu, D., Costache, T., & Negreș, S. (2021). Very Fast RP–UHPLC–PDA Method for Identification and Quantification of the Cannabinoids from Hemp Oil. Applied Sciences, 11(20), 9414. https://doi.org/10.3390/app11209414