Abstract
The deep learning (DL)-based approaches in tumor pathology help to overcome the limitations of subjective visual examination from pathologists and improve diagnostic accuracy and objectivity. However, it is unclear how a DL system trained to discriminate normal/tumor tissues in a specific cancer could perform on other tumor types. Herein, we cross-validated the DL-based normal/tumor classifiers separately trained on the tissue slides of cancers from bladder, lung, colon and rectum, stomach, bile duct, and liver. Furthermore, we compared the differences between the classifiers trained on the frozen or formalin-fixed paraffin-embedded (FFPE) tissues. The Area under the curve (AUC) for the receiver operating characteristic (ROC) curve ranged from 0.982 to 0.999 when the tissues were analyzed by the classifiers trained on the same tissue preparation modalities and cancer types. However, the AUCs could drop to 0.476 and 0.439 when the classifiers trained for different tissue modalities and cancer types were applied. Overall, the optimal performance could be achieved only when the tissue slides were analyzed by the classifiers trained on the same preparation modalities and cancer types.
1. Introduction
For decades, visual examination of hematoxylin-eosin (H&E)-stained tissue slides by pathologists has been the foundation of cancer diagnosis for different types of cancers [1]. However, it is well known that visual assessment of tissue slide is often subjective and thus intra- and inter-observer variabilities are unavoidable [2,3]. Automated computational methods can help to overcome such limitations and to supplement current pathology workflow by delivering reproducible diagnosis for various cancer types [4]. Furthermore, considering predicted shortage of pathologists in the near future and increased workload for the analysis of various molecular tests, automation on histopathologic diagnosis will be necessary to optimize workload in many pathology laboratories [5,6].
Recently, primary diagnosis on digitalized pathologic images was approved in the US and digitization of glass tissue slide into whole slide images (WSIs) has been exploding around the globe [7,8]. Therefore, massive amounts of digital pathology images are now available for researchers who have been interested in the automation of diagnosis for cancer tissues. Furthermore, the performance of computer-based image analysis has been much improved by the adoption of deep learning technology [9]. In contrast to other classic machine learning approaches, deep learning can learn relevant features for given tasks directly from raw input datasets, and thus eliminate the necessity of domain-specific feature extraction processes [10]. Combined with huge digital WSI datasets, deep learning has been rapidly adopted for the pathologic diagnosis tasks such as Gleason grading of prostate cancer [4], detection of invasive ductal carcinoma in breast cancer [11], detection of metastasis for breast cancer [12], and detection of tumor tissues in gastric cancer [13].
The generalizability of a deep learning system is an important issue for a developed system to be more widely applicable. Normal and tumor cells are thought to have some common differences in cell shape and nuclear morphology. Therefore, a deep learning system trained to discriminate normal/tumor tissues in a cancer type can be applied to other cancer types. However, previous studies were focused on tissues from a specific cancer type and the generalizability of deep learning systems on cancer diagnosis tasks is still unclear [14]. Since different cancers originate from different anatomical sites with specific structures, the diagnosis performance of a deep learning system may not necessarily extend beyond trained cancer type [15,16].
Therefore, in the present study, we built deep learning-based normal/tumor tissue classifiers for six different cancer types and cross-validated the performance of the classifiers to understand generalizability of deep learning-based cancer diagnosis system. Furthermore, it is well known that frozen and formalin-fixed paraffin-embedded (FFPE) tissues have different morphology because of freezing artifacts [17]. Thus, we also cross-validated the classifiers for the frozen and FFPE tissues of each cancer type. The results of the current study can clearly solve the undetermined question on the generalizability of deep learning-based normal/tumor tissue classifiers.
2. Materials and Methods
The Cancer Genome Atlas (TCGA) program provides frozen and FFPE tissue WSIs of various cancer types. We built deep learning-based normal/tumor classifiers, separately for the frozen and FFPE tissues of bladder (TCGA-BLCA), lung (TCGA-LUAD/LUSC), colon and rectum (TCGA-COAD/READ), stomach (TCGA-STAD), bile duct (TCGA-CHOL), and liver (TCGA-LIHC).
2.1. Tissue/Non-Tissue Classifier for the TCGA Tissue Datasets
Artifacts in tissue slides such as air-bubbles, blurring, compression artifacts, pen markings, and tissue folding could adversely affect the learning process of appropriate features for a given task and thus could limit the performance of a classifier. In few previous studies, specified algorithms to detect artifacts such as blur or tissue-folds were presented [18]. In the present study, we tried to classify the various artifacts into improper tissues all at once with a deep learning-based classifier. As it is impossible to analyze a WSI as a whole, WSIs are often sliced into small image patches for deep learning. Thus, we built a deep learning-based proper/improper tissue classifier for 360 × 360-pixel image patches at 20× magnification to remove all of these artifacts at once. From the TCGA WSI datasets, more than 100,000 proper and improper tissue patches each were collected. A simple convolutional neural network (CNN) was trained with the patches to discriminate between proper and improper tissue patches. We called it as a tissue/non-tissue classifier (Figure 1) and only tissue patches were used for normal/tumor classification. The CNN consisted of 12 [5 × 5] filters, 24 [5 × 5] filters and 24 [5 × 5] filters, each followed by a [2 × 2] max-pooling layer.
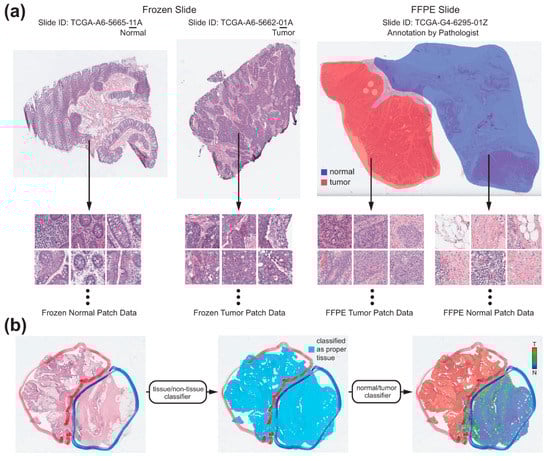
Figure 1.
The workflow of the fully automated normal/tumor classifiers for whole slide images (WSIs). (a) Collection of the normal and tumor tissue image patches. For the frozen tissue WSIs, normal and tumor patches were collected depending on the IDs of the WSIs. For the formalin-fixed paraffin-embedded (FFPE) tissue WSIs, two pathologists annotated the normal and tumor regions. Normal and tumor patches were collected depending on the annotations. (b) Classification process for a representative WSI. At first, only proper tissue patches were selected by the tissue/non-tissue classifier. Then, the tumor probabilities of the proper tissues were obtained by the normal/tumor classifier. Finally, a heatmap was drawn to demarcate the normal/tumor distribution.
2.2. Normal/Tumor Classifiers for the TCGA Tissue Datasets
We divided each TCGA dataset into training and test datasets with a 9:1 ratio. The division was patient-wise and thus no slide from patients in the training dataset was included in the test dataset. For the frozen tissue WSIs of the TCGA datasets, there are normal or tumor WSIs which consisted of almost exclusively normal or tumor tissues, respectively. The normal or tumor WSIs are distinguished by the IDs of the WSIs (Figure 1a). Therefore, the patches from the frozen WSIs were simply labeled depending on their IDs. On the contrary, the FFPE tissue WSIs contain both normal and tumor tissues. To discriminate between them, I.H.S. and S.H.L. annotated normal and tumor regions in a FFPE WSI with the Aperio ImageScope software (Leica Biosystems) using a freehand drawing tool (Figure 1a). As depicted in Figure 1a, the normal/tumor tissue patch datasets were collected based on the IDs of WSIs or normal/tumor annotation for the frozen and FFPE WSIs, respectively, to train the normal/tumor classifiers for the frozen and FFPE tissues each. As we included six different cancer types (TCGA-BLCA, TCGA-LUAD/LUSC, TCGA-COAD/READ, TCGA-STAD, TCGA-CHOL, and TCGA-LIHC), total 12 classifiers were trained. Unlike the tissue/non-tissue classifier, the Inception-v3 model was used without any parameter changes to train the normal/tumor classifiers for the 360 × 360-pixel patches at 20× magnification. We adopted the inception-v3 model because it was superior for the normal/tumor discrimination task than other CNN architectures in our previous study [13]. Deep neural networks were implemented using the TensorFlow deep learning library (http://tensorflow.org). We used a mini-batch size of 128, and the cross-entropy loss function was adopted as a loss function. For training, we used RMSProp optimizer, with initial learning rate of 0.1, weight decay of 0.9, momentum of 0.9, and epsilon of 1.0. To minimize overfitting, data augmentation techniques, including random horizontal/vertical flipping, random perturbation of the contrast and brightness, and random rotations by 90° were applied to the tissue patches during the training. Ten percent of the training data were used as a validation dataset for the early stopping of the training. Thus, the training session was terminated when the loss for the validation data started to increase. At least five models were trained for each dataset and the results from the most appropriate models were presented in the results section. Total six computer systems (one computer with dual NVIDIA Titan V GPUs, two computers with dual NVIDIA Titan RTX GPUs and three computers with dual NVIDIA RTX 2080ti GPUs) were used to train the models.
For the test WSIs, non-overlapping 360 × 360-pixel patches at 20× magnification were collected and the tissue/non-tissue and normal/tumor classifiers were sequentially applied (Figure 1b). Only patches which were classified as tissue by tissue/non-tissue classifier were passed to the normal/tumor classifiers. Then, heatmap for the normal/tumor probability of each tissue patch was overlaid on the WSIs to clearly demarcate the normal and tumor regions.
2.3. Cross-Validation between the Frozen and FFPE, and between Different Cancer Types
The main purpose of this study was to characterize the generalizability of the deep learning-based classifiers for normal/tumor tissues. First, we cross-validated the classification results of the classifiers for the frozen and FFPE tissues. Therefore, the frozen and FFPE WSIs for a cancer type were classified by the FFPE and frozen classifiers, respectively, for the same cancer type. Then, the classifiers for the FFPE tissues were applied to classify FFPE WSIs of different types of cancers.
2.4. External Validation of the Classifiers Trained with the TCGA Tissue Datasets
Next, to test the generalizability of the classifiers trained on the TCGA datasets for the tissues of completely different backgrounds, we evaluated the classification results of the classifiers trained with the TCGA-STAD and TCGA-COAD/READ FFPE tissues on the FFPE tissue slides of stomach and colorectal cancers from the Seoul St. Mary’s hospital (SMH-STAD and SMH-COAD/READ). The tissue slides were scanned with Philips IntelliSite Digital Pathology Solution (Philips). I.H.S. and S.H.L. annotated the normal and tumor regions on the slides. Then, the SMH-STAD and SMH-COAD/READ slides were classified by classifiers trained on the TCGA-STAD and TCGA-COAD/READ datasets, respectively.
2.5. Presentation of Classification Results
Area under the curve (AUC) for receiver operating characteristic (ROC) curve was presented for each classifier. ROC curves plot the true positive (sensitivity) versus the false positive (1-specificity) fraction by adjusting the threshold for normal/tumor discrimination, allowing sensitivity and specificity tradeoffs to be evaluated [19]. Representative heatmap images for the classification results were also presented.
3. Results
3.1. TCGA Frozen and FFPE Datasets
Normal/tumor classifiers for the six different cancer types were trained with the training datasets of the TCGA frozen and FFPE WSIs (Figure 1a). Then, the classifiers were applied to the test datasets to distinguish the tissue image patches from a WSI into normal or tumor patches. Based on the classification results for the whole tissue image patches of all the WSIs in the test datasets, patch-level ROC curves were drawn to describe the classification performance of the classifiers.
Figure 2a,b demonstrate the results for the TCGA-BLCA datasets. In the first two pictures of panel a, heatmaps for the representative classification results for the test datasets of the frozen normal and tumor tissues were presented. Then, the image of normal/tumor annotation and the heatmap for the classification results for a representative FFPE tissue from the test datasets were presented. In the first two graphs of panel b, the ROC curves for the patch-level classification results on all the frozen tissue image patches in the test datasets by the classifiers trained on the frozen and FFPE tissues were presented. The AUCs were 0.9995 and 0.9547 for the classifiers trained on the frozen and FFPE tissues, respectively. Then, the ROC curves for the patch-level classification results on the FFPE tissues by the classifiers trained on the FFPE and frozen tissues were presented. In this case, the AUCs were 0.9823 and 0.8118 for the classifiers trained on the FFPE and frozen tissues, respectively. Figure 2c,d adopt the same formats to demonstrate the results for the TCGA-LUAD/LUSC datasets. The AUCs for the patch-level classification results of the frozen and FFPE tissues were 0.9920 and 0.9892 for the classifiers trained on the frozen and FFPE tissues, respectively, and were 0.9147 and 0.9334 for the classifiers trained on the FFPE and frozen tissues, respectively. These results indicated that the classifiers could show optimal performance only when the classifiers were applied to the trained tissue preparation modalities.
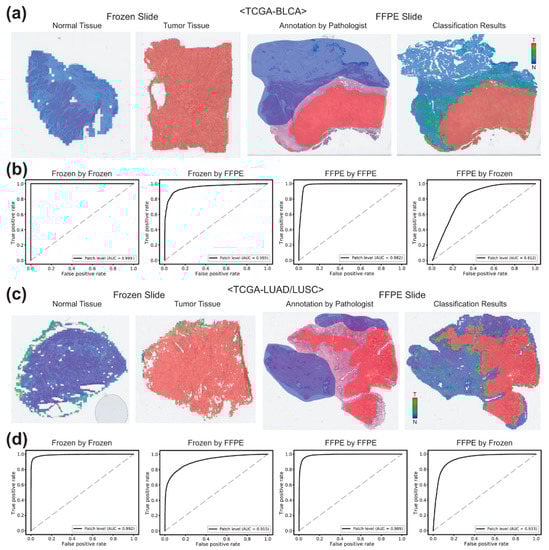
Figure 2.
Classification results for the frozen and FFPE tissues of bladder (TCGA-BLCA) and lung (TCGA-LUAD/LUSC) datasets. (a) Representative classification results. Heatmaps were drawn for the representative whole slide images (WSIs) of the normal and tumor frozen WSIs of the TCGA-BLCA dataset (left two images). For a representative formalin-fixed paraffin-embedded (FFPE) WSI, both pathologists’ annotation and the heatmap result were presented for the comparison. (b) Receiver operating characteristic (ROC) curves for the classification results. Left two graphs: the receiver operating characteristic (ROC) curves for the frozen tissues classified by the classifiers trained on frozen and FFPE tissues. Right two graphs: the ROC curves for the FFPE tissues classified by the classifiers trained on FFPE and frozen tissues. (c,d) are the same as (a,b), but the results were for the TCGA-LUAD/LUSC dataset.
In case of the TCGA-COAD/READ datasets (Figure 3a,b), the AUCs for the patch-level classification of the frozen tissues were 0.9959 and 0.9413 by the classifiers trained on the frozen and FFPE tissues, respectively. The AUCs for the FFPE tissues were 0.9986 and 0.7806 by the classifiers trained on the FFPE and frozen tissues, respectively. For the TCGA-STAD datasets (Figure 3c,d), the AUCs for the classification results of the frozen and FFPE tissues were 0.9895 and 0.9935 for the classifiers trained on the same preparation modalities and were 0.8952 and 0.8874 for the classifiers trained on different preparation modalities.
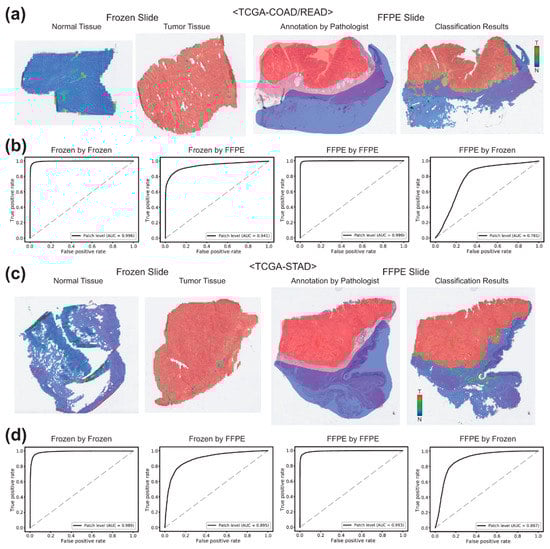
Figure 3.
Classification results for the TCGA-COAD/READ and TCGA-STAD datasets. (a) Representative classification results. Heatmaps were drawn for the representative whole slide images (WSIs) of the normal and tumor frozen WSIs of the TCGA-COAD/READ dataset (left two images). For a representative formalin-fixed paraffin-embedded (FFPE) WSI, both pathologists’ annotation and the heatmap result were presented for the comparison. (b) Receiver operating characteristic (ROC) curves for the classification results. Left two graphs: the ROC curves for the frozen tissues classified by the classifiers trained on frozen and FFPE tissues. Right two graphs: the ROC curves for the FFPE tissues classified by the classifiers trained on FFPE and frozen tissues. (c,d) are the same as (a,b), but the results were for the TCGA-STAD dataset.
Figure 4a,b demonstrate the results for the TCGA-CHOL datasets. The AUCs for the patch-level classification of the frozen tissues were 0.9994 and 0.8960 by the classifiers trained on the frozen and FFPE tissues, respectively. The AUCs for the FFPE tissues were 0.9964 and 0.4765 by the classifiers trained on the FFPE and frozen tissues, respectively. For the TCGA-LIHC datasets (Figure 4c,d), the AUCs for the classification results of the frozen and FFPE tissues were 0.9993 and 0.9910 for the classifiers trained on the same preparation modalities and were 0.6130 and 0.6222 for the classifiers trained on different preparation modalities.
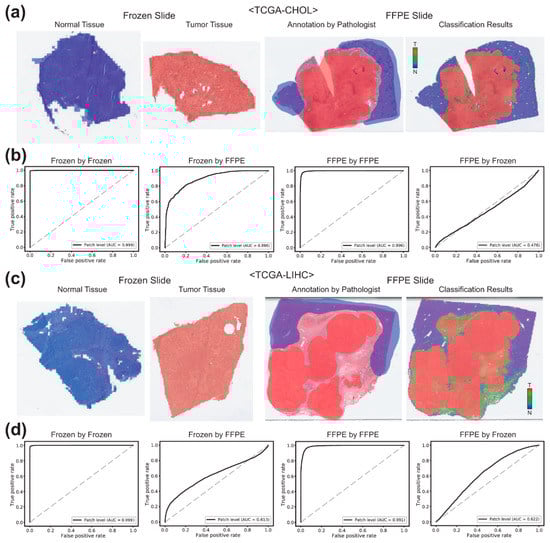
Figure 4.
Classification results for the bile duct (TCGA-CHOL) and liver (TCGA-LIHC) datasets. (a) Representative classification results. Heatmaps were drawn for the representative whole slide images (WSIs) of the normal and tumor frozen WSIs of the TCGA-CHOL dataset (left two images). For a representative formalin-fixed paraffin-embedded (FFPE) WSI, both pathologists’ annotation and the heatmap result were presented for the comparison. (b) Receiver operating characteristic (ROC) curves for the classification results. Left two graphs: the ROC curves for the frozen tissues classified by the classifiers trained on frozen and FFPE tissues. Right two graphs: the ROC curves for the FFPE tissues classified by the classifiers trained on FFPE and frozen tissues. (c,d) are the same as (a,b), but the results were for the TCGA-LIHC dataset.
3.2. Cross-Validation between the Different Cancer Types
It was clear that the classifiers could show optimal performance when the classifiers trained on the frozen tissues were applied for the frozen tissues and the classifiers trained on the FFPE tissues were applied for the FFPE tissues. Next, we tested the classification results between the cancer types. FFPE tissue slides of each cancer type were classified by the classifiers trained on the other five cancer types. The resultant AUCs were summarized in the Table 1. The AUCs by the classifiers for the same cancer types lie in the diagonal line. Basically, it clearly showed that the classifiers performed optimally for the trained datasets, because the AUCs were highest when the tissue-classifier combination were matched. Interestingly, the first four rows and columns including BLCA, LUAD/LUSC, COAD/READ, and STAD datasets demonstrated relatively high AUCs (all higher than 0.9), suggesting there are common features discriminating normal and tumor tissues between these cancer types. However, CHOL and LIHC generally showed poorer compatibility with other cancer types.

Table 1.
Cross-validation results for the TCGA-FFPE slides of the six different cancer types.
3.3. External Validation of the Tissue Classifiers
H&E-stained slides undergo multiple processing from formalin fixation to staining, resulting differences in color, brightness, and contrast [9]. Furthermore, differences in scanning devices and image compression methods could contribute to the differences in the WSIs [2]. Therefore, different cohorts of WSIs may have different appearances even for the same cancer types depending on the preparation processes and the scanning devices. Furthermore, ethnic differences may contribute to the differences in the tissue appearance in the different cohorts. Thus, we validated the classifiers trained on the TCGA-STAD and TCGA-COAD/READ FFPE WSIs datasets with the WSIs of the stomach and colorectal cancer FFPE tissue slides from the Seoul St. Mary’s hospital (SMH-STAD and SMH-COAD/READ). Figure 5a demonstrates the classification results for the SMH-COAD/READ dataset by the classifier trained with the TCGA-COAD/READ FFPE datasets. The AUC was 0.9926. For SMH-STAD dataset, the AUC was 0.9912 (Figure 5b). These results demonstrated that the classifiers trained for the FFPE WSIs of the TCGA datasets can discriminate normal and tumor tissues in the FFPE WSIs obtained from other institutes quite well.
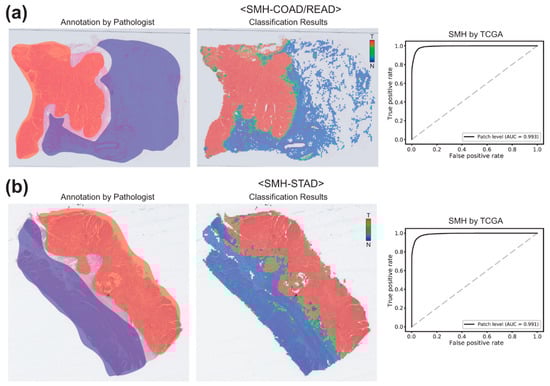
Figure 5.
Classification results for the SMH-COAD/READ and SMH-STAD datasets by the classifiers trained on the TCGA-COAD/READ and TCGA-STAD datasets, respectively. (a) Results for the SMH-COAD/READ dataset. For a representative formalin-fixed paraffin-embedded (FFPE) WSI, both pathologists’ annotation and the heatmap result were presented for the comparison (left two images). Then, receiver operating characteristic (ROC) curve for the classification results was presented. (b) Same as (a), but the results were for the SMH-STAD dataset.
4. Discussion
In the present study, deep learning-based normal/tumor classifiers for the tissue image patches of six different cancer types were separately built for the frozen and FFPE tissue WSIs. As presented in the figures, the AUCs for all the tissue image patches in the test datasets ranged from 0.989 to 0.999 for both frozen and FFPE tissue image patches, demonstrating excellent performance. Particularly, heatmaps of the FFPE WSIs showed that the classification results were well matched with the pathologists’ annotations. These results indicated that the deep learning systems can learn the appropriate features for the discrimination of the normal/tumor tissues regardless of cancer types.
The heatmaps of the WSIs clearly demarcated the distribution of normal and tumor tissues in the tissue slides. The clear normal/tumor demarcation can be highly informative for current pathology workflow because a clear mark-up of the tumor in the tissue section is often necessary for various molecular tests [1,2,6]. When the heatmap is presented, clear tumor regions can be more precisely selected for molecular tests. This may diminish the possibility of false negative test results by avoiding the selection of improper tissue regions with low tumor contents. Although we focused on the normal/tumor discrimination in this study, deep learning can also be applied for more complicated analysis tasks for cancer tissues, such as assessment of tumor mutational burden [20], detection of microsatellite instability [16,21], and detection of genetic mutations [22,23,24]. The classifiers for these tasks may perform best when the tissue patches for the classification came from the tumor regions because genetic perturbation can be most well presented in the tumor regions. Therefore, the development of reliable normal/tumor tissue classifiers would be prerequisite for various tissue analysis tasks. In the present study, we developed the normal/tumor classifiers for six different cancer types based on the TCGA WSI datasets and demonstrated that the classifiers can discriminate the respective normal/tumor tissues appropriately. However, there are many more cancer types that are not addressed in this study. When we cross-validated the classifiers between the cancer types and preparation modalities, it was clear that the generalizability of the deep learning-based classifiers is limited. Therefore, we concluded that each classifier should be developed separately for each target cancer tissue type to yield the best diagnosis performance.
Although the classifiers were not very compatible between cancer types, external validation with the SMH datasets demonstrated that the classifiers could perform well on the same types of cancer tissues obtained from different institutes. The TCGA and SMH datasets may differ in the ethnicity of patients, tissue preparation processes, and tissue scanning devices. Therefore, there could be differences in tissue properties. Nevertheless, the performance of the classifiers trained with the TCGA datasets was comparable between the TCGA and SMH datasets. These results indicated that the data augmentation techniques during the training were strong enough for the deep learning systems to overcome the differences and to learn the general features for the discrimination of the normal/tumor tissues in the trained cancer types.
There are also limitations in the current study. Deep learning systems are often criticized as non-interpretable black boxes because the decision rule of deep learning is not easy to be interpreted. The deep learning systems did not offer clear criteria for the discrimination of normal/tumor tissues. This unclear nature of deep learning systems could be a barrier to the adoption of the deep learning-based diagnosis support systems in the clinics. Second, the external validation datasets were limited to only two cancer types from a single institute. In a future study, WSIs from other institutes and more cancer types should be tested to validate the generalizability of the system more precisely.
5. Conclusions
Overall, this study demonstrated that the deep learning-based classification systems could be a reliable tool to discriminate the normal and tumor tissues. However, it also showed that the classifiers should be trained with the appropriate datasets for the target tasks. As there is no room for error in the clinics, we strongly suggest that a classifier trained for a desired task should be adopted to yield the best result for the task. If classifiers for most cancer types are established in the near future, they can be applied prospectively to rule out definitive cases from further review or retrospectively as a quality review for the decision made by humans. Therefore, the efficiency and accuracy of pathologic diagnosis could be improved with the adoption of various deep learning-based systems for tissue analysis.
Author Contributions
Conceptualization, H.-J.J. and S.H.L.; methodology, H.-J.J.; data collection, I.H.S. and S.H.L.; visualization, H.-J.J.; writing—original draft, H.-J.J.; writing—review and editing, I.H.S. and S.H.L.; funding acquisition, S.H.L. All authors have read and agreed to the published version of the manuscript.
Funding
The authors wish to acknowledge the financial support of the Catholic Medical Center Research Foundation made in the program year of 2020.
Institutional Review Board Statement
The study was approved by the Institutional Review Board of the College of Medicine at the Catholic University of Korea (KC20RISI0329).
Informed Consent Statement
Not applicable.
Data Availability Statement
The TCGA data presented in this study are openly available in GDC data portal (https://portal.gdc.cancer.gov/). The data from the Seoul St. Mary’s hospital are not publicly available due to privacy.
Conflicts of Interest
The authors declare no conflict of interest.
References
- Djuric, U.; Zadeh, G.; Aldape, K.; Diamandis, P. Precision histology: How deep learning is poised to revitalize histomorphology for personalized cancer care. NPJ Precis. Oncol. 2017, 1, 22. [Google Scholar] [CrossRef] [PubMed]
- Hamilton, P.W.; Bankhead, P.; Wang, Y.; Hutchinson, R.; Kieran, D.; McArt, D.G.; James, J.; Salto-Tellez, M. Digital pathology and image analysis in tissue biomarker research. Methods 2014, 70, 59–73. [Google Scholar] [CrossRef] [PubMed]
- Tizhoosh, H.R.; Pantanowitz, L. Artificial Intelligence and Digital Pathology: Challenges and Opportunities. J. Pathol. Inform. 2018, 9, 38. [Google Scholar] [CrossRef] [PubMed]
- Arvaniti, E.; Fricker, K.S.; Moret, M.; Rupp, N.; Hermanns, T.; Fankhauser, C.; Wey, N.; Wild, P.J.; Ruschoff, J.H.; Claassen, M. Automated Gleason grading of prostate cancer tissue microarrays via deep learning. Sci. Rep. 2018, 8, 12054. [Google Scholar] [CrossRef]
- Colling, R.; Pitman, H.; Oien, K.; Rajpoot, N.; Macklin, P.; CM-Path AI in Histopathology Working Group; Snead, D.; Sackville, T.; Verrill, C. Artificial intelligence in digital pathology: A roadmap to routine use in clinical practice. J. Pathol. 2019, 249, 143–150. [Google Scholar] [CrossRef]
- Serag, A.; Ion-Margineanu, A.; Qureshi, H.; McMillan, R.; Saint Martin, M.J.; Diamond, J.; O’Reilly, P.; Hamilton, P. Translational AI and Deep Learning in Diagnostic Pathology. Front. Med. 2019, 6, 185. [Google Scholar] [CrossRef]
- Saltz, J.; Gupta, R.; Hou, L.; Kurc, T.; Singh, P.; Nguyen, V.; Samaras, D.; Shroyer, K.R.; Zhao, T.; Batiste, R.; et al. Spatial Organization and Molecular Correlation of Tumor-Infiltrating Lymphocytes Using Deep Learning on Pathology Images. Cell Rep. 2018, 23, 181–193.e187. [Google Scholar] [CrossRef]
- Nam, S.; Chong, Y.; Jung, C.K.; Kwak, T.Y.; Lee, J.Y.; Park, J.; Rho, M.J.; Go, H. Introduction to digital pathology and computer-aided pathology. J. Pathol. Transl. Med. 2020, 54, 125–134. [Google Scholar] [CrossRef]
- Chang, H.Y.; Jung, C.K.; Woo, J.I.; Lee, S.; Cho, J.; Kim, S.W.; Kwak, T.Y. Artificial Intelligence in Pathology. J. Pathol. Transl. Med. 2019, 53, 1–12. [Google Scholar] [CrossRef]
- LeCun, Y.; Bengio, Y.; Hinton, G. Deep learning. Nature 2015, 521, 436–444. [Google Scholar] [CrossRef]
- Cruz-Roa, A.; Gilmore, H.; Basavanhally, A.; Feldman, M.; Ganesan, S.; Shih, N.N.C.; Tomaszewski, J.; Gonzalez, F.A.; Madabhushi, A. Accurate and reproducible invasive breast cancer detection in whole-slide images: A Deep Learning approach for quantifying tumor extent. Sci. Rep. 2017, 7, 46450. [Google Scholar] [CrossRef] [PubMed]
- Steiner, D.F.; MacDonald, R.; Liu, Y.; Truszkowski, P.; Hipp, J.D.; Gammage, C.; Thng, F.; Peng, L.; Stumpe, M.C. Impact of Deep Learning Assistance on the Histopathologic Review of Lymph Nodes for Metastatic Breast Cancer. Am. J. Surg. Pathol. 2018, 42, 1636–1646. [Google Scholar] [CrossRef] [PubMed]
- Cho, K.O.; Lee, S.H.; Jang, H.J. Feasibility of fully automated classification of whole slide images based on deep learning. Korean J. Physiol. Pharmacol. 2020, 24, 89–99. [Google Scholar] [CrossRef] [PubMed]
- Dimitriou, N.; Arandjelovic, O.; Caie, P.D. Deep Learning for Whole Slide Image Analysis: An Overview. Front. Med. 2019, 6, 264. [Google Scholar] [CrossRef] [PubMed]
- Cheng, J.; Mo, X.; Wang, X.; Parwani, A.; Feng, Q.; Huang, K. Identification of topological features in renal tumor microenvironment associated with patient survival. Bioinformatics 2018, 34, 1024–1030. [Google Scholar] [CrossRef]
- Kather, J.N.; Pearson, A.T.; Halama, N.; Jager, D.; Krause, J.; Loosen, S.H.; Marx, A.; Boor, P.; Tacke, F.; Neumann, U.P.; et al. Deep learning can predict microsatellite instability directly from histology in gastrointestinal cancer. Nat. Med. 2019, 25, 1054–1056. [Google Scholar] [CrossRef]
- Cooper, L.A.; Demicco, E.G.; Saltz, J.H.; Powell, R.T.; Rao, A.; Lazar, A.J. PanCancer insights from The Cancer Genome Atlas: The pathologist’s perspective. J. Pathol. 2018, 244, 512–524. [Google Scholar] [CrossRef]
- Komura, D.; Ishikawa, S. Machine Learning Methods for Histopathological Image Analysis. Comput. Struct. Biotechnol. J. 2018, 16, 34–42. [Google Scholar] [CrossRef]
- Glasziou, P. The statistical evaluation of medical tests for classification and prediction. Stat. Med. 2005, 24, 2582. [Google Scholar] [CrossRef]
- Xu, H.; Park, S.; Lee, S.; Hwang, T. Using transfer learning on whole slide images to predict tumor mutational burden in bladder cancer patients. bioRxiv 2019. [Google Scholar] [CrossRef]
- Echle, A.; Grabsch, H.I.; Quirke, P.; van den Brandt, P.A.; West, N.P.; Hutchins, G.G.A.; Heij, L.R.; Tan, X.; Richman, S.D.; Krause, J.; et al. Clinical-Grade Detection of Microsatellite Instability in Colorectal Tumors by Deep Learning. Gastroenterology 2020. [Google Scholar] [CrossRef] [PubMed]
- Coudray, N.; Ocampo, P.S.; Sakellaropoulos, T.; Narula, N.; Snuderl, M.; Fenyo, D.; Moreira, A.L.; Razavian, N.; Tsirigos, A. Classification and mutation prediction from non-small cell lung cancer histopathology images using deep learning. Nat. Med. 2018, 24, 1559–1567. [Google Scholar] [CrossRef] [PubMed]
- Chen, M.; Zhang, B.; Topatana, W.; Cao, J.; Zhu, H.; Juengpanich, S.; Mao, Q.; Yu, H.; Cai, X. Classification and mutation prediction based on histopathology H&E images in liver cancer using deep learning. NPJ Precis. Oncol. 2020, 4, 14. [Google Scholar] [CrossRef]
- Jang, H.J.; Lee, A.; Kang, J.; Song, I.H.; Lee, S.H. Prediction of clinically actionable genetic alterations from colorectal cancer histopathology images using deep learning. World J. Gastroenterol. 2020, 26, 6207–6223. [Google Scholar] [CrossRef] [PubMed]
Publisher’s Note: MDPI stays neutral with regard to jurisdictional claims in published maps and institutional affiliations. |
© 2021 by the authors. Licensee MDPI, Basel, Switzerland. This article is an open access article distributed under the terms and conditions of the Creative Commons Attribution (CC BY) license (http://creativecommons.org/licenses/by/4.0/).