Geothermal Assessment of Target Formations Using Recorded Temperature Measurements for the Alberta No. 1 Geothermal Project
Abstract
1. Introduction
2. Materials and Methods
2.1. BHT Data Filtering and Calculating Thermal Gradient
2.2. Selecting Formation Tops
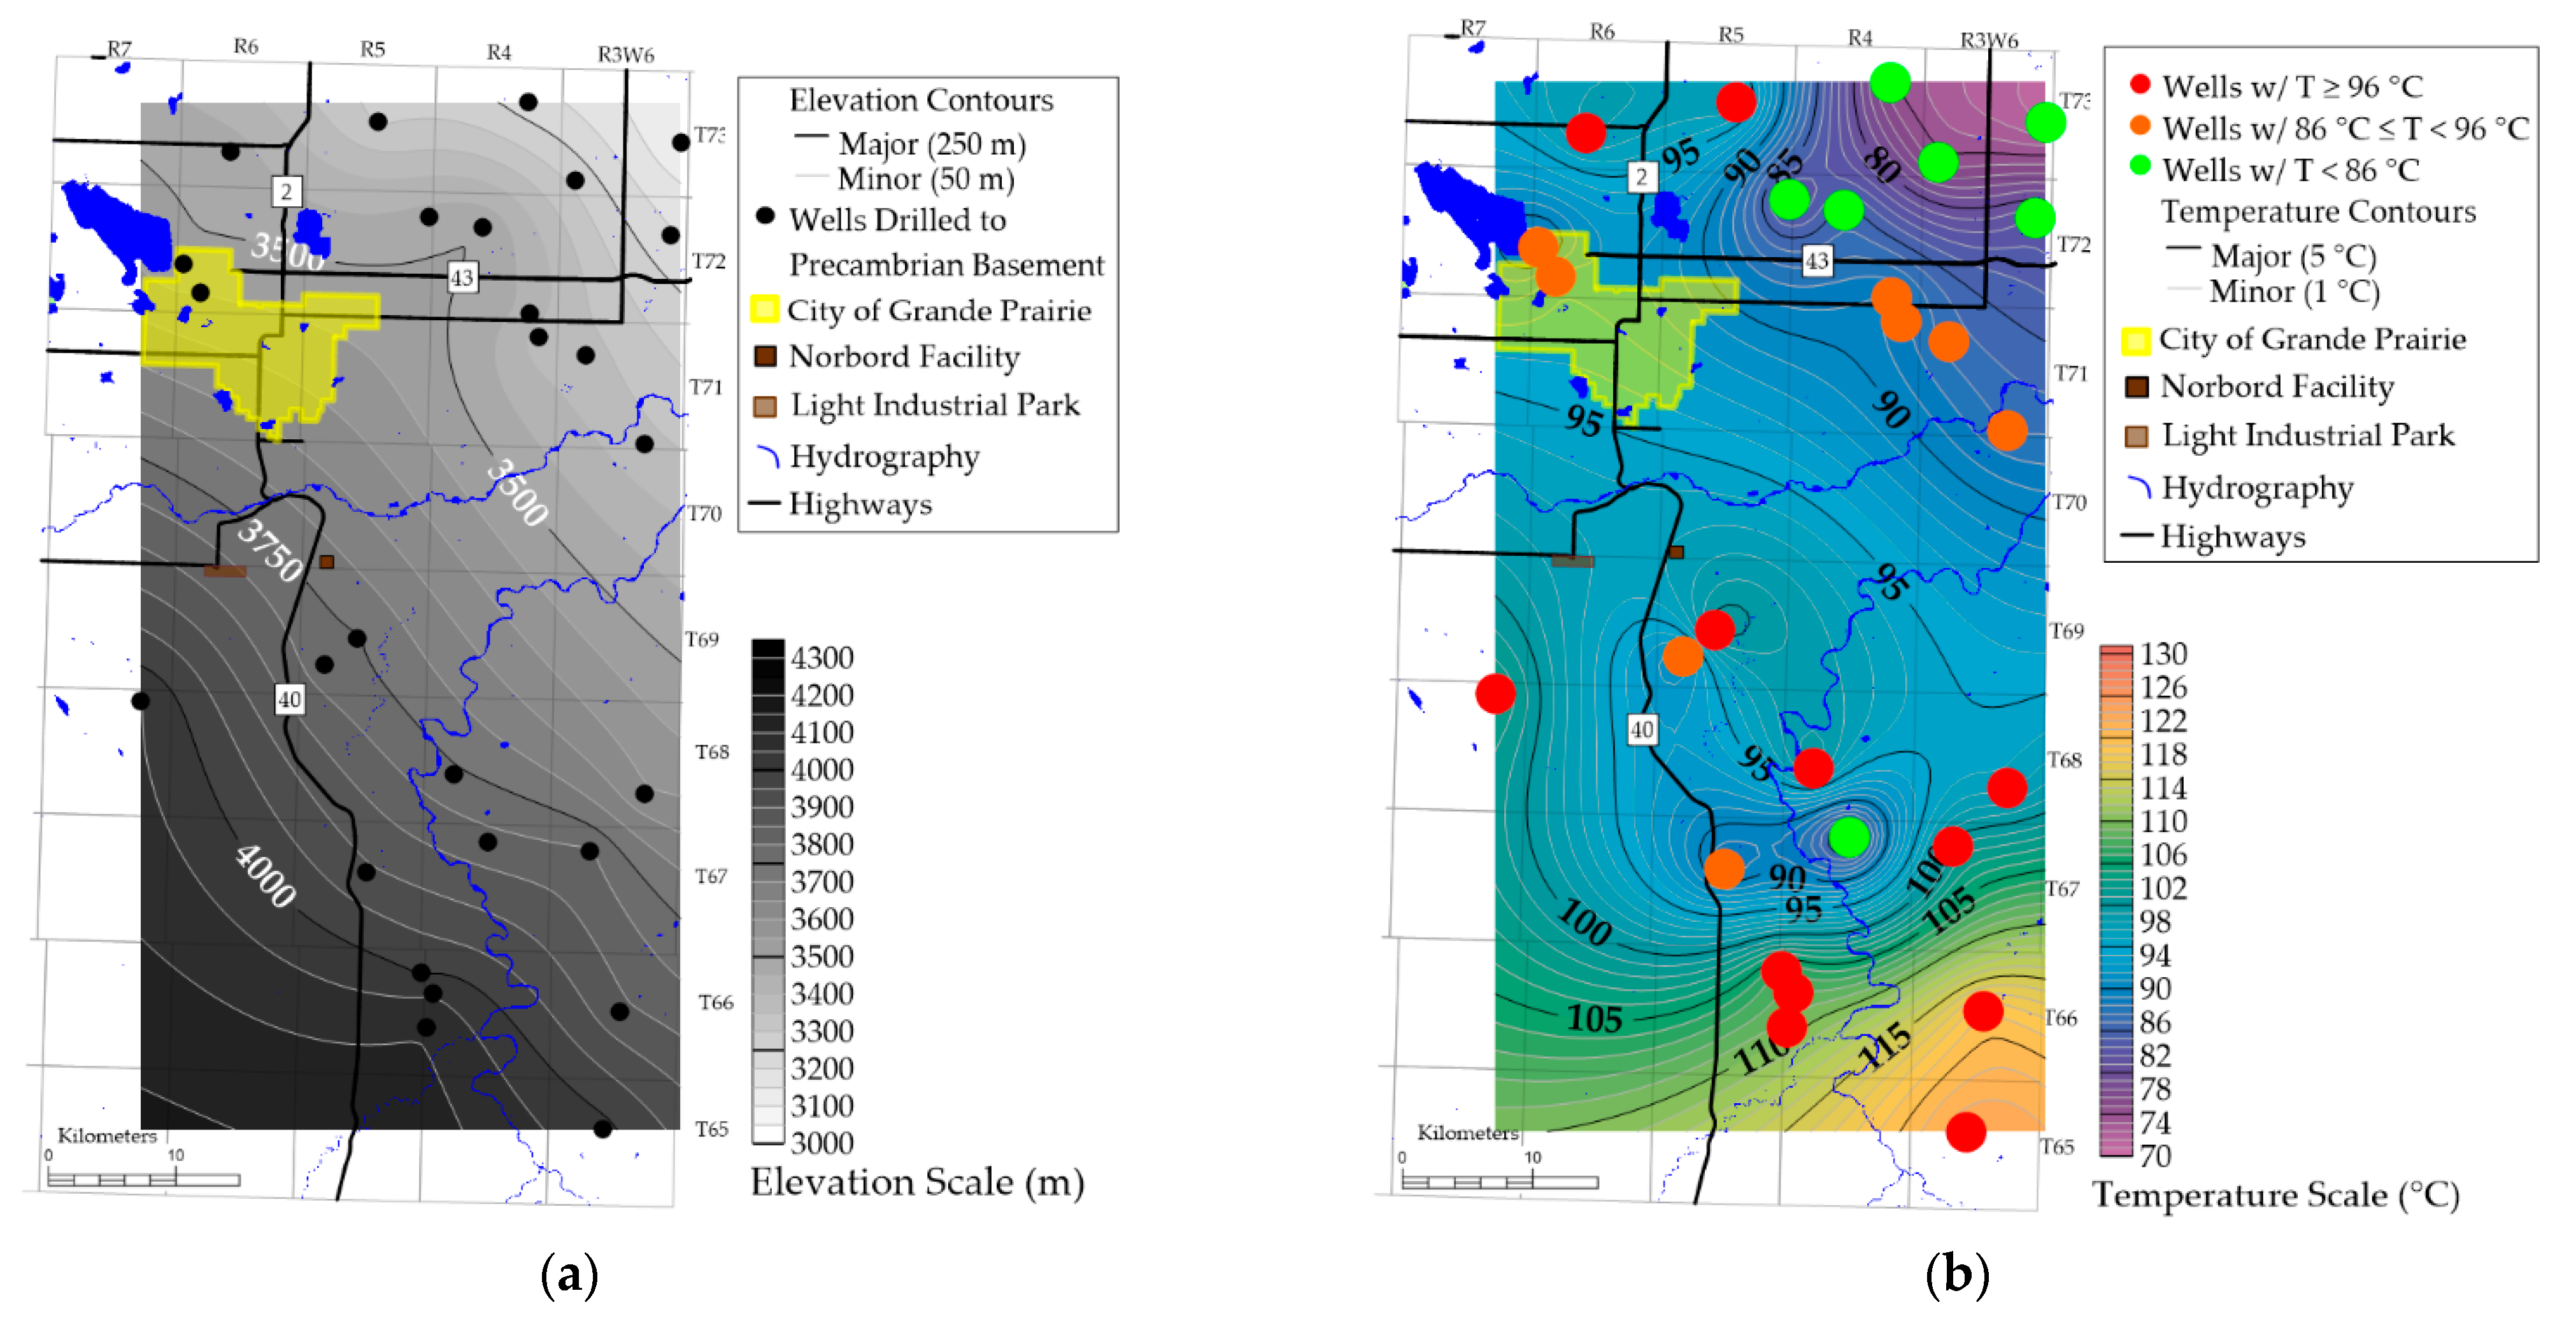
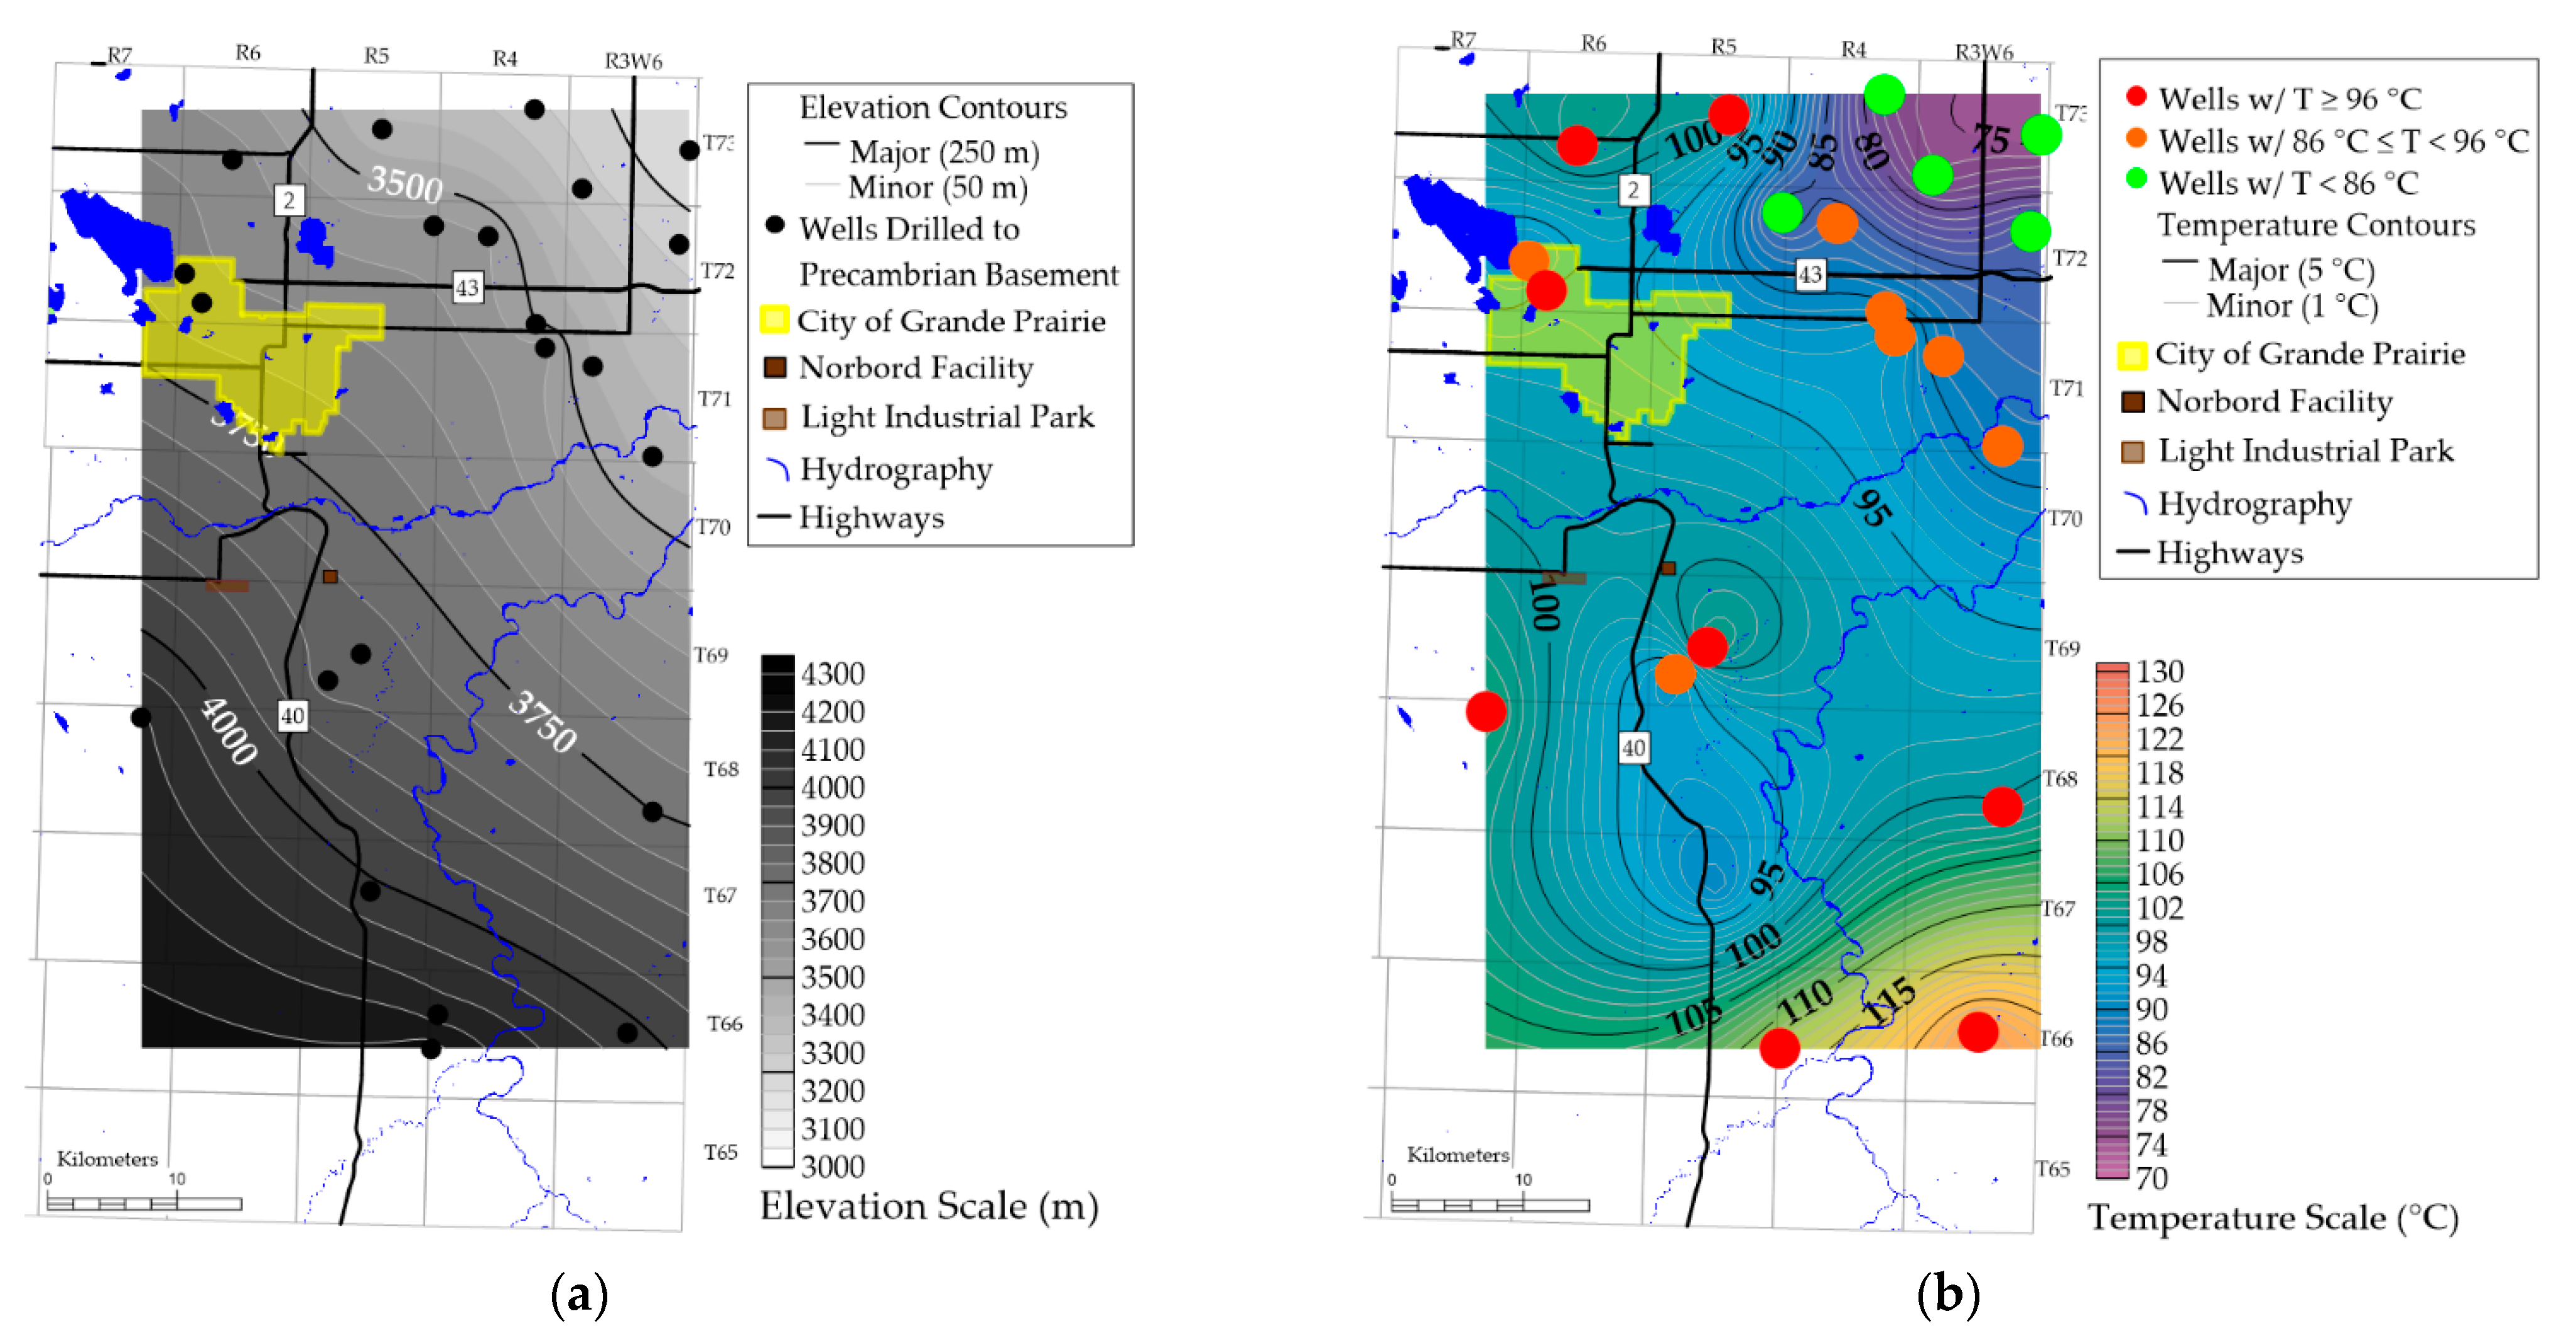
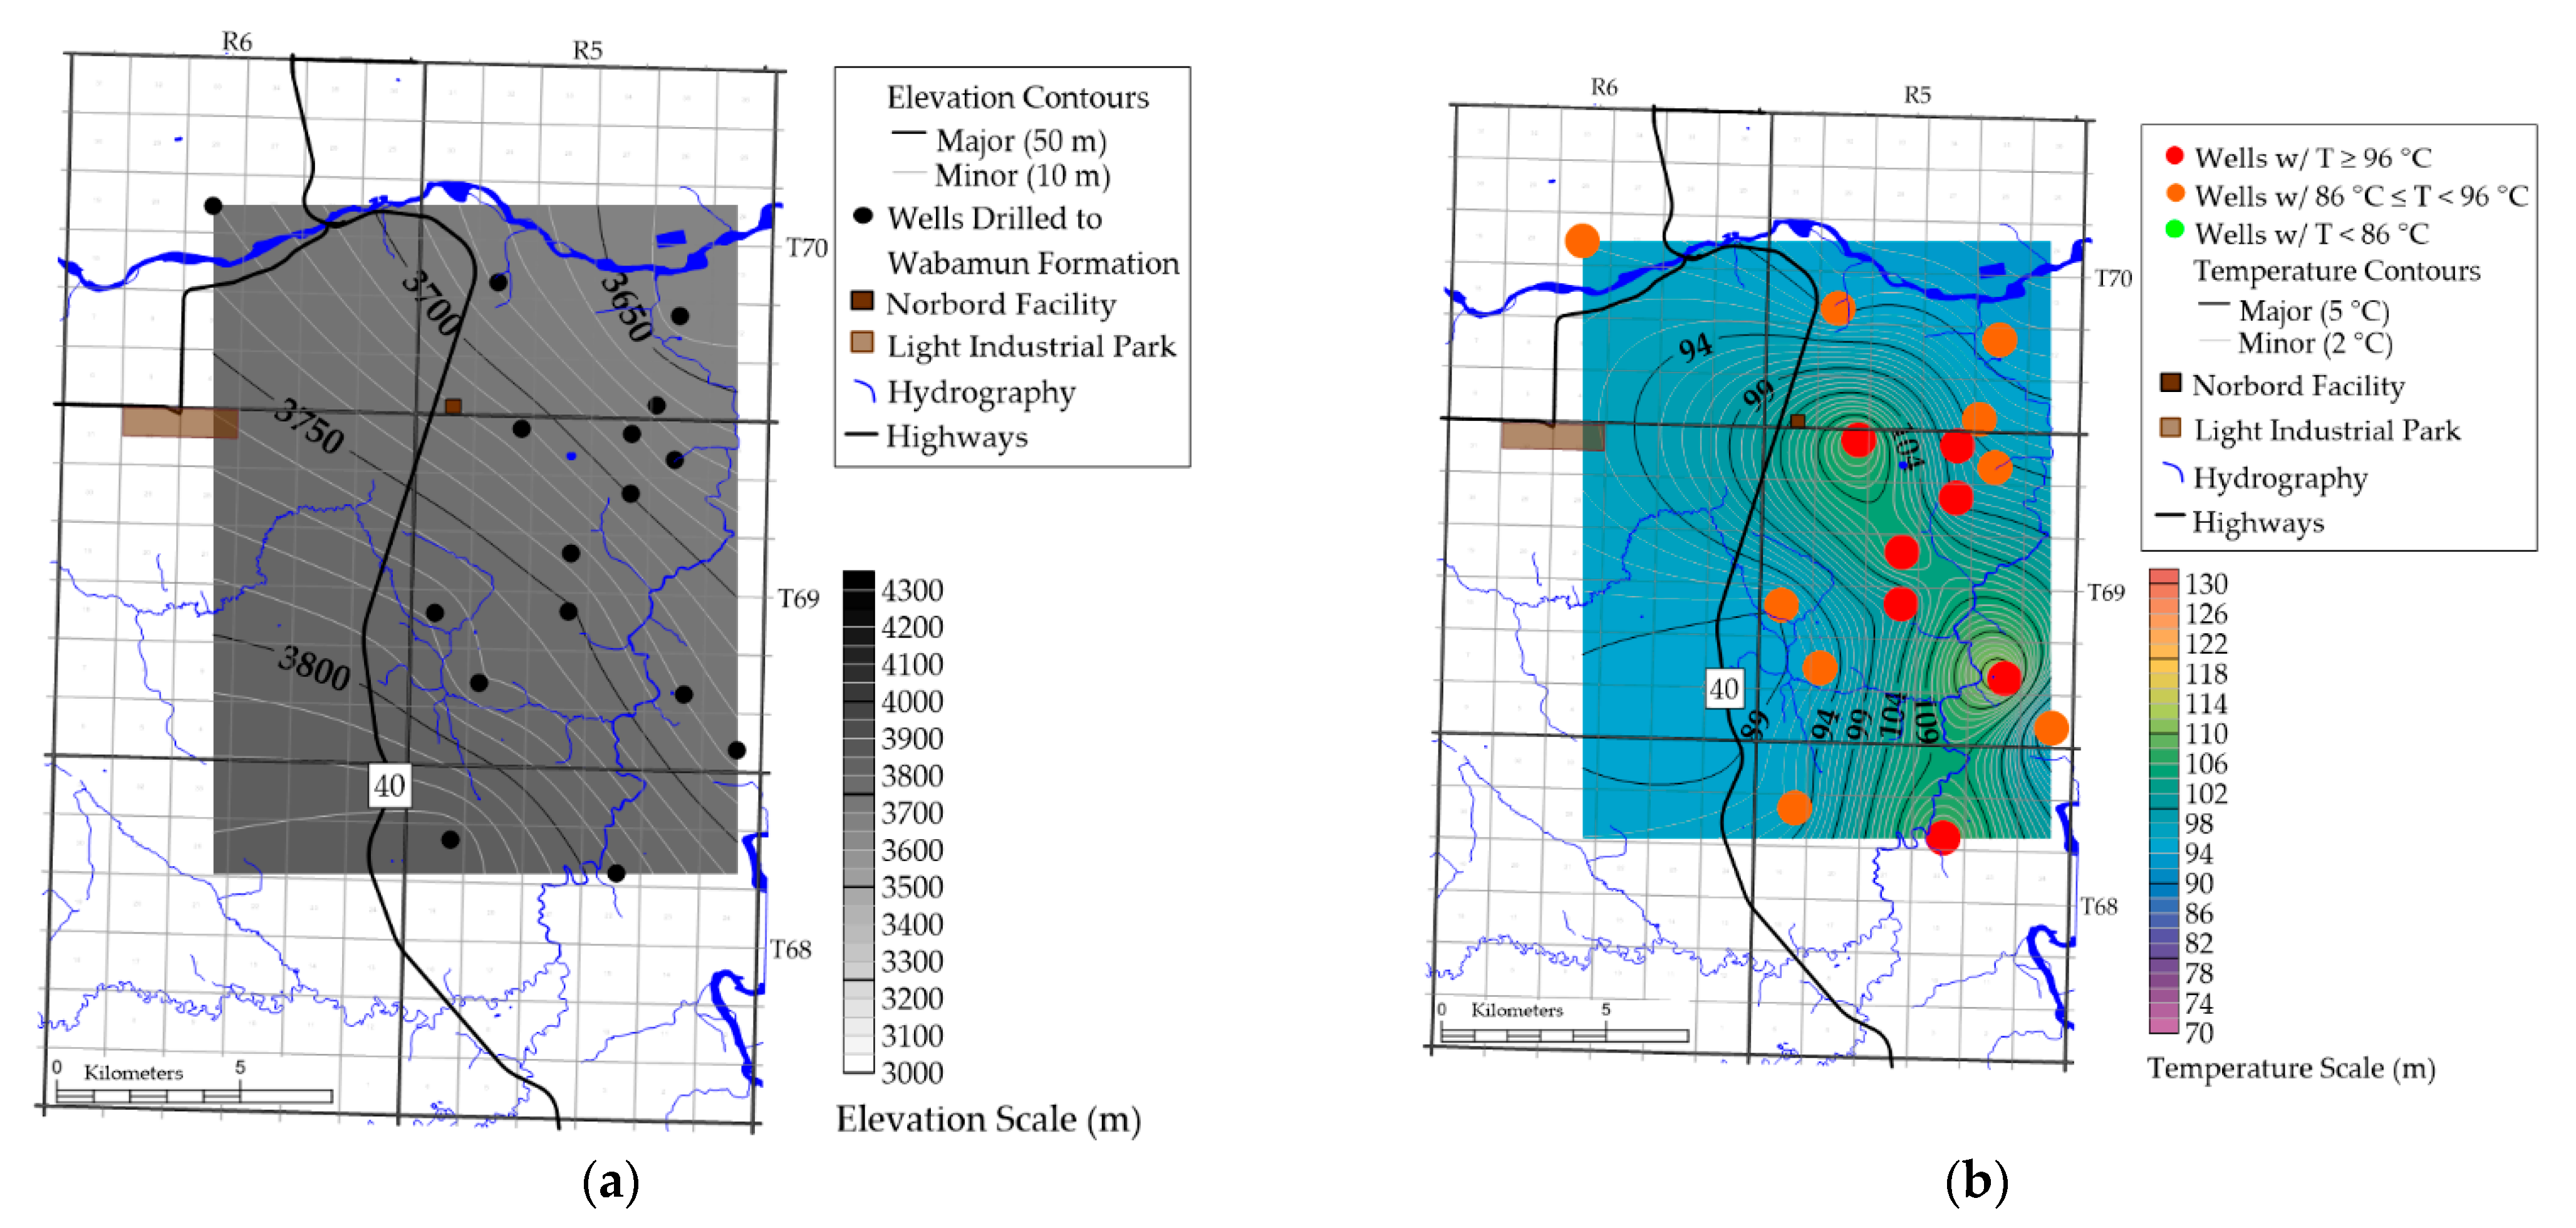
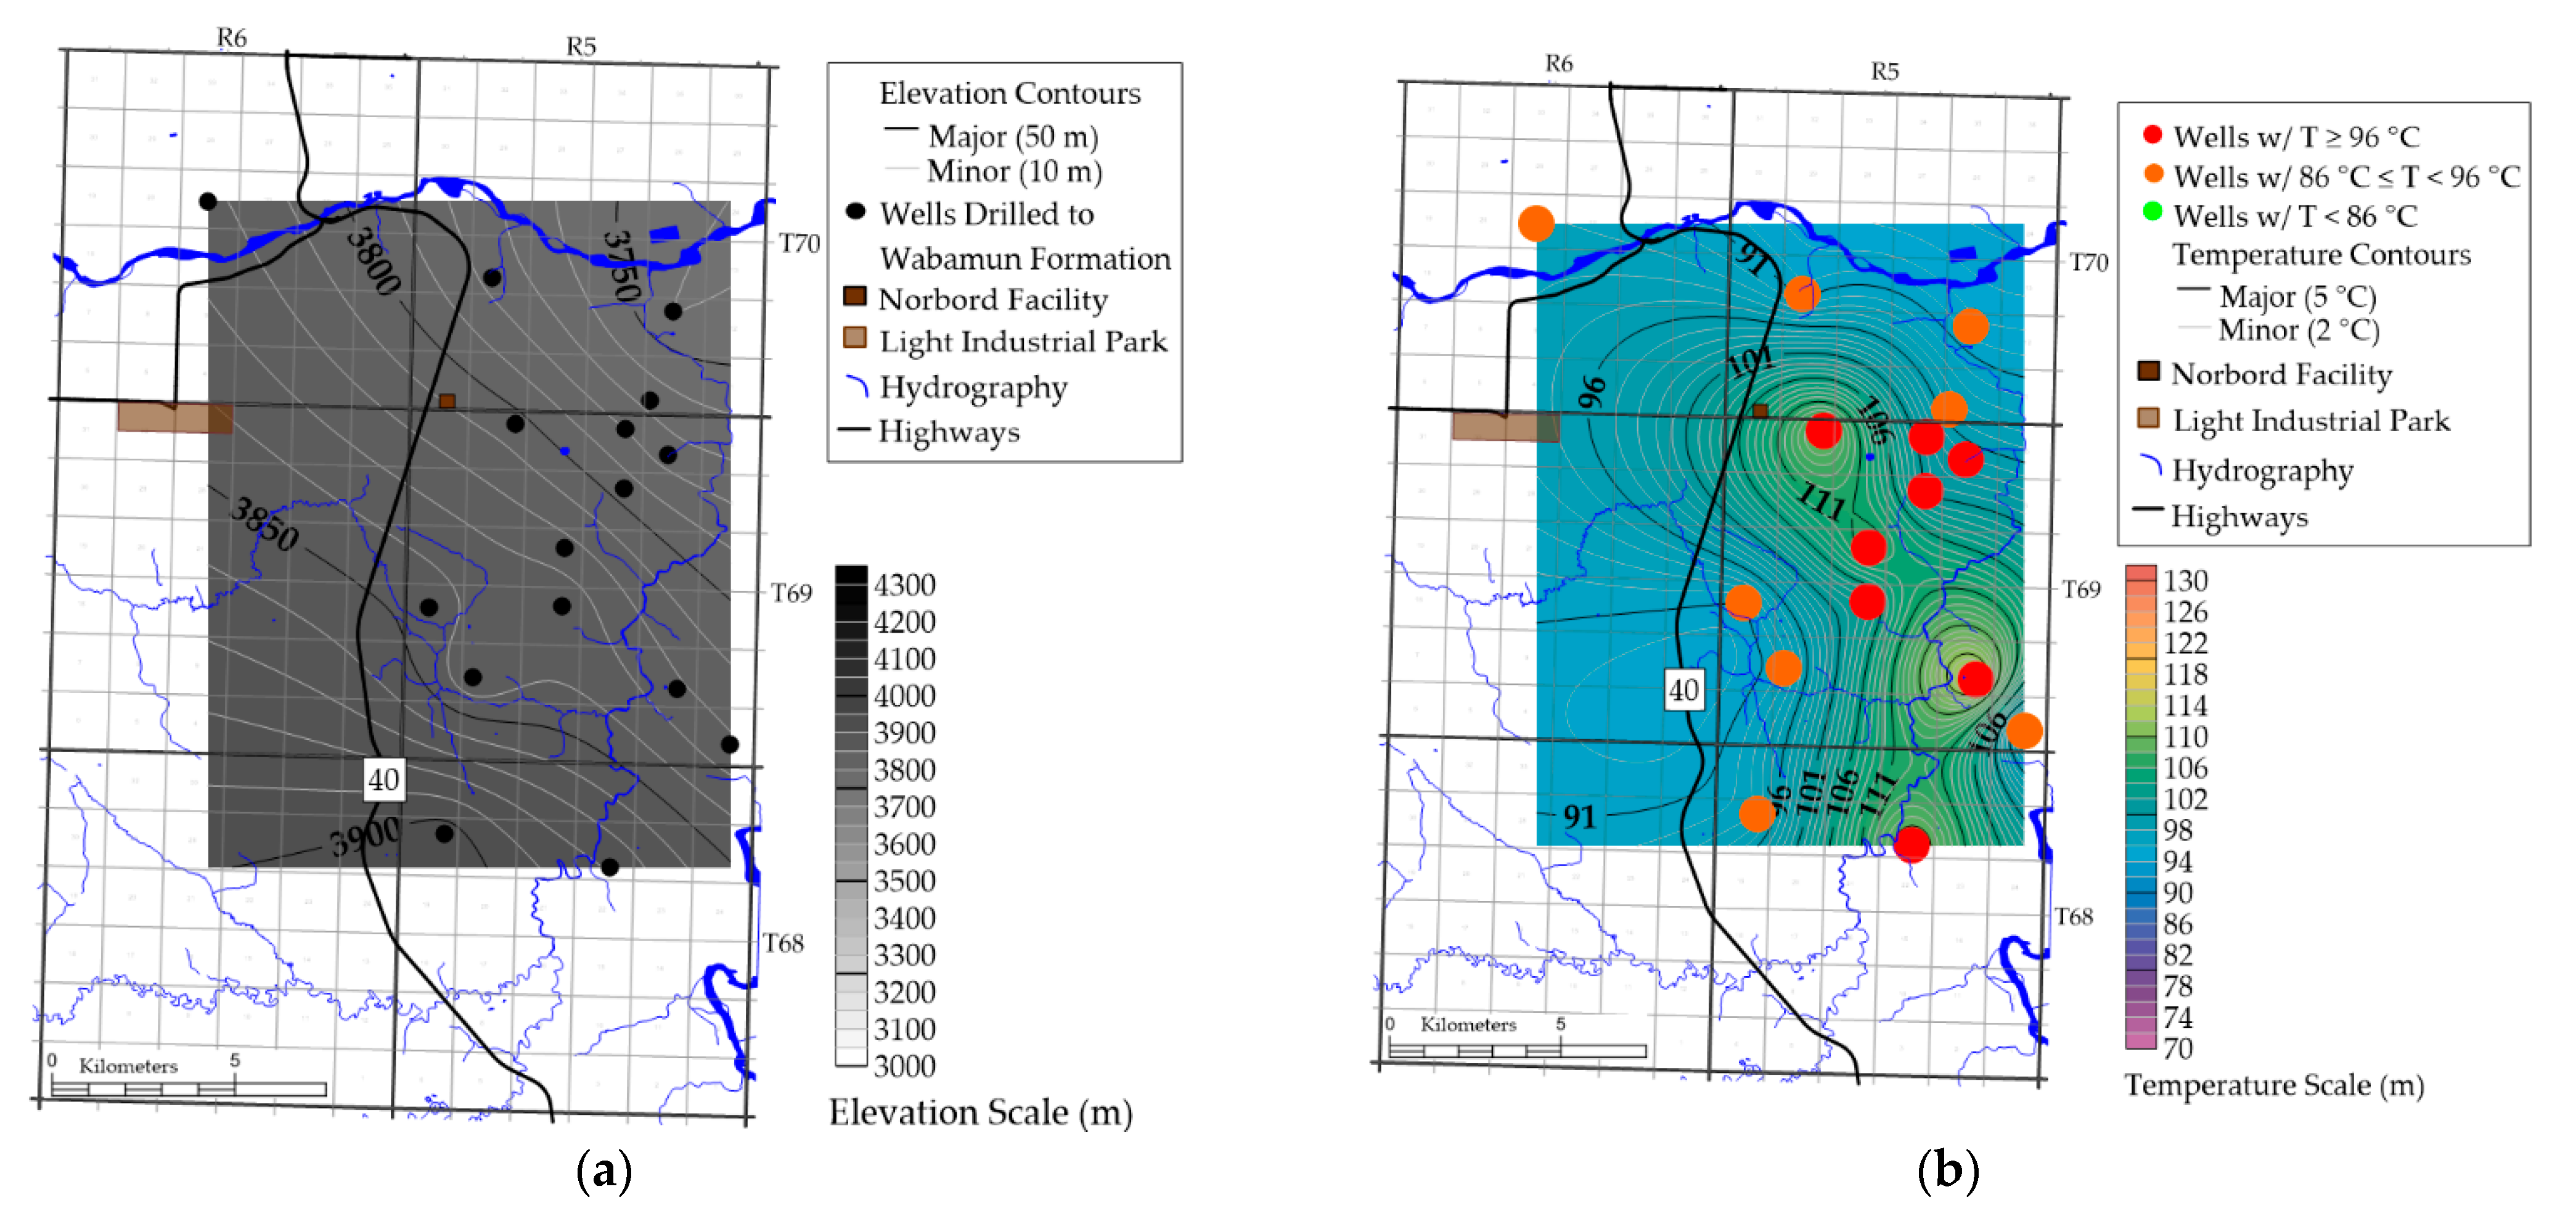
2.3. Temperature and Elevation Maps
3. Results
4. Conclusions
Author Contributions
Funding
Informed Consent Statement
Data Availability Statement
Acknowledgments
Conflicts of Interest
References
- Hickson, C.J.; Huang, K.; Cotterill, D.; Gosnold, W.; Benoit, D. Updated Resource Assessment; Alberta No. 1 Internal Report; Edmonton, AB, Canada, 2020. [Google Scholar]
- Davies, G.R.; Smith, L.B. Structurally controlled hydrothermal dolomite reservoir facies: An overview. AAPG Bull. 2006, 90, 1641–1690. [Google Scholar] [CrossRef]
- Alberta Geological Survey. Available online: https://ags.aer.ca/publication/alberta-table-formations (accessed on 25 October 2020).
- Harrison, W.E.; Luza, K.V.; Prater, M.L.; Chueng, P.K. Geothermal Resource Assessment of Oklahoma; Oklahoma Geological Survey, Special Publication 83-1; Oklahoma Geological Survey: Norman, OK, USA, 1983. [Google Scholar]
- Horner, D.R. Pressure Build-up in Wells. In Proceedings of the 3rd World Petroleum Congress, The Hague, The Netherlands, 28 May–6 June 1951. [Google Scholar]
- Stutz, G.; Williams, M.; Frone, Z.; Reber, T.; Blackwell, D.; Jordan, T.; Tester, J. A Well by Well Method for Estimating Surface Heat Flow for Regional Geothermal Resource Assessment. In Proceedings of the Thirty-Seventh Workshop on Geothermal Reservoir Engineering, Stanford, CA, USA, 30 January–1 February 2012. [Google Scholar]
- Gray, D.A.; Majorowicz, J.; Unsworth, M. Investigation of the geothermal state of sedimentary basins using oil industry thermal data: Case study from Northern Alberta exhibiting the need to systematically remove biased data. J. Geophys. Eng. 2012, 9, 534–548. [Google Scholar] [CrossRef]
- Grasby, S.E.; Allen, D.M.; Bell, S.; Chen, Z.; Ferguson, G.; Jessop, A.; Kelman, M.; Ko, M.; Majorowicz, J.; Moore, M.; et al. Geothermal Energy Resource Potential of Canada; Geological Survey of Canada, Open File 6914; Natural Resources Canada: Ottawa, ON, Canada, 2012. [Google Scholar] [CrossRef]
- Anglin, F.M.; Beck, A.E. Regional heat flow pattern in Western Canada. Can. J. Earth Sci. 1965, 2, 176–182. [Google Scholar] [CrossRef]
- Bachu, S.; Burwash, R.A. Geothermal regime in the Western Canadian Sedimentary Basin. In Geological Atlas of the Western Canada Sedimentary Basin; Mossop, G.D., Shetsen, I., Eds.; Canadian Society of Petroleum Geologists and Alberta Research Council: Calgary, AB, Canada, 1994. [Google Scholar]
- Ardakani, E.P. Regional Geophysical Study of the Athabasca Region, Northeastern Alberta: Implications for Geothermal Development. Ph.D. Thesis, University of Alberta, Edmonton, AB, Canada, 2016. [Google Scholar]
- Hackbarth, D.A. Groundwater temperatures in the Athabasca Oil Sands area, Alberta. Can. J. Earth Sci. 1978, 15, 1689–1700. [Google Scholar] [CrossRef]
- Jones, F.W.; Lam, H.L.; Majorowicz, J.A. Temperature distributions at the Paleozoic and Precambrian surfaces and their implications for geothermal energy recovery in Alberta. Can. J. Earth Sci. 1985, 22, 1774–1780. [Google Scholar] [CrossRef]
- Lam, H.L.; Jones, F.W. Geothermal gradients of Alberta in Western Canada. Geothermics 1984, 13, 181–192. [Google Scholar] [CrossRef]
- Majorowicz, J.A. Regional heat flow pattern and lithospheric geotherms in northeastern British Columbia and adjacent Northwest Territories, Canada. Bull. Can. Pet. Geol. 2005, 53, 51–66. [Google Scholar] [CrossRef]
- Majorowicz, J.; Gosnold, W.; Gray, A.; Safanda, J.; Klenner, R.; Unsworth, M. Implications of Post-Glacial Warming for Northern Alberta Heat Flow—Correcting for the Underestimate of the Geothermal Potential. In Proceedings of the GRC Transactions, Reno, NV, USA, 20 September–3 October 2012. [Google Scholar]
- Majorowicz, J.; Grasby, S.E. Deep geothermal energy in Canadian sedimentary basins VS. Fossils based energy we try to replace—Exergy [KJ/KG] compared. Renew. Energy 2019, 141, 259–277. [Google Scholar] [CrossRef]
- Majorowicz, J.; Nieuwenhuis, G.; Unsworth, M.; Phillips, J.; Verveda, R. High Temperatures Predicted in the Granitic Basement of Northwest Alberta—An Assessment of the EGS Energy Potential. In Proceedings of the Thirty-Ninth Workshop on Geothermal Reservoir Engineering, Standford, CA, USA, 24–26 February 2014. [Google Scholar]
- Majorowicz, J.; Unsworth, M.; Chacko, T.; Gray, A.; Heaman, L.; Potter, D.K.; Schmitt, D.; Babadagli, T. Geothermal energy as a source of heat for oil sands processing in Northern Alberta, Canada. In Heavy-Oil and Oil-Sand Petroleum Systems in Alberta and Beyond; Hein, F.J., Leckie, D., Larter, S., Suter, J., Eds.; American Association of Petroleum Geologists: Tulsa, OK, USA, 2013; pp. 1–22. [Google Scholar]
- Majorowicz, J.A.; Jessop, A.M. Regional heat flow patterns in the Western Canadian Sedimentary Basin. Tectonophysics 1981, 74, 209–238. [Google Scholar] [CrossRef]
- Majorowicz, J.A.; Garven, G.; Jessop, A.; Jessop, C. Present Heat Flow along a Profile Across the Western Canada Sedimentary Basin: The Extent of Hydrodynamic Influence. In Geothermics in Basin Analysis; Förster, A., Merriam, D.F., Eds.; Springer: Boston, MA, USA, 1999; pp. 61–79. [Google Scholar]
- Nieuwenhuis, G.; Lengyel, T.; Majorowicz, J.; Grobe, M.; Rostron, B.; Unsworth, M.J.; Weides, S. Regional-Scale Geothermal Exploration Using Heterogeneous Industrial Temperature Data; a Case Study from the Western Canadian Sedimentary Basin. In Proceedings of the World Geothermal Congress, Melbourne, Australia, 19–24 April 2015. [Google Scholar]
- Weides, S.; Majorowicz, J. Implications of Spatial Variability in Heat Flow for Geothermal Resource Evaluation in Large Foreland Basins: The Case of the Western Canada Sedimentary Basin. Energies 2014, 7, 2573–2594. [Google Scholar] [CrossRef]
- Weides, S.; Moeck, I.; Majorowicz, J.; Grobe, M. The Cambrian Basal Sandstone Unit in central Alberta—An investigation of temperature distribution, petrography, and hydraulic and geomechanical properties of a deep saline aquifer. Can. J. Earth Sci. 2014, 51, 783–796. [Google Scholar] [CrossRef]
- Weides, S.; Moeck, I.; Schmitt, D.; Majorowicz, J. Geothermal Assessment of Paleozoic Aquifers in the Central Alberta Basin, Canada. In Proceedings of the World Geothermal Congress, Melbourne, Australia, 19–24 April 2015. [Google Scholar]
- Weides, S.N.; Moeck, I.S.; Schmitt, D.R.; Majorowicz, J.A.; Ardakani, E.P. Characterization of Geothermal Reservoir Units in Northwestern Alberta by 3D Structural Geological Modelling and Rock Property Mapping. In Proceedings of the Thirty-Eighth Workshop on Geothermal Reservoir Engineering, Stanford, CA, USA, 11–13 February 2013. [Google Scholar]
- Huang, K.; Gosnold, W.; Hickson, C.; Benoit, D. Using Oil and Gas Data to Assess Geothermal Resources Within the Western Canadian Sedimentary Basin in Alberta. In Proceedings of the GRC Transactions, Virtual Conference, 19–23 October 2020. [Google Scholar]
- Schneider, R.R. Alberta’s Natural Subregions under a Changing Climate: Past, Present and Future; Report prepared for the Biodiversity Management and Climate Change Adaptation Project; AMBI: Edmonton, AB, Canada, 2013. [Google Scholar]
Publisher’s Note: MDPI stays neutral with regard to jurisdictional claims in published maps and institutional affiliations. |
© 2021 by the authors. Licensee MDPI, Basel, Switzerland. This article is an open access article distributed under the terms and conditions of the Creative Commons Attribution (CC BY) license (http://creativecommons.org/licenses/by/4.0/).
Share and Cite
Huang, K.Y.; Hickson, C.J.; Cotterill, D.; Champollion, Y. Geothermal Assessment of Target Formations Using Recorded Temperature Measurements for the Alberta No. 1 Geothermal Project. Appl. Sci. 2021, 11, 608. https://doi.org/10.3390/app11020608
Huang KY, Hickson CJ, Cotterill D, Champollion Y. Geothermal Assessment of Target Formations Using Recorded Temperature Measurements for the Alberta No. 1 Geothermal Project. Applied Sciences. 2021; 11(2):608. https://doi.org/10.3390/app11020608
Chicago/Turabian StyleHuang, Katherine Y., Catherine J. Hickson, Darrell Cotterill, and Yannick Champollion. 2021. "Geothermal Assessment of Target Formations Using Recorded Temperature Measurements for the Alberta No. 1 Geothermal Project" Applied Sciences 11, no. 2: 608. https://doi.org/10.3390/app11020608
APA StyleHuang, K. Y., Hickson, C. J., Cotterill, D., & Champollion, Y. (2021). Geothermal Assessment of Target Formations Using Recorded Temperature Measurements for the Alberta No. 1 Geothermal Project. Applied Sciences, 11(2), 608. https://doi.org/10.3390/app11020608


