Article

Refractive Indices of Ge and Si at Temperatures between 4–296 K in the 4–8 THz Region

1
National Physical Laboratory, Teddington TW11 0LW, UK
2
Advanced Technology Institute, University of Surrey, Guildford GU2 7XH, UK
3
The Paul Scherrer Institute, 5232 Villigen, Switzerland
*
Author to whom correspondence should be addressed.
Appl. Sci. 2021, 11(2), 487; https://doi.org/10.3390/app11020487
Submission received: 22 November 2020 / Revised: 1 January 2021 / Accepted: 4 January 2021 / Published: 6 January 2021
(This article belongs to the Special Issue Advances of THz Spectroscopy)

Abstract

:

Featured Application

Knowledge of temperature dependence of refractive indices of Ge and Si at THz frequencies is required in many applications where these materials are used for THz devices and optical components.

Abstract

Refractive indices of high resistivity Si and Ge were measured at temperatures between 4–296 K and at frequencies between 4.2–7.7 THz using a Fourier-transform spectrometer (FTS) in transmission mode. A phenomenological model of the temperature dependence of the refractive index is proposed.

1. Introduction

Optical science in the terahertz region (roughly 0.3–30 THz, although definitions vary) has developed rapidly in recent decades [1,2], with sensitive, coherent, and single-cycle pulse technologies causing a revolution in spectroscopy [3,4,5], imaging [6,7], nonlinear optics [8], quantum technologies [9], and a growing number of industrial applications [10]. However, techniques vary in the wavelength ranges available, and extending the bandwidths of current technologies such as terahertz time-domain spectroscopy (THz-TDS) to higher frequencies is a major topic of research [11,12,13]. As part of this endeavour, novel semiconductor materials are of interest [11]. Furthermore, in applications such as solid-state THz lasers and quantum devices (e.g., impurity-implanted silicon cubits), the knowledge of temperature variation of the refractive index of substrate material can be essential for the design of such devices. It is therefore important to find methods to accurately measure refractive index in frequency regions above 3 THz which the most popular technologies (e.g., THz time-domain spectroscopy and vector network analyser-based) find challenging, to perform such measurements as a function of temperature, and to establish relationships between refractive index, frequency, and temperature.
We have previously reported on a relatively simple measurement technique which obtains the complex refractive index spectrum of a solid from only its power transmission spectrum, taking advantage of the Fabry–Perot interference effect [14]. While this type of method can be applied to almost any measurement of the transmission spectrum of a plane-parallel sample, it is most useful in the terahertz region above 3 THz, where THz-TDS and other terahertz technologies are still limited. We report in this work on measurements using Fourier-transform spectroscopy (FTS), which is especially useful due to its wide bandwidth and high frequency resolution. Since FTS paired with cryogenics provides access to higher frequencies than does THz-TDS [15], it is an obvious choice for the present work. Furthermore, we demonstrate in this work how accurate refractive index values may be extracted from FTS transmission data by combining two calculation approaches, taking advantage of complementarity between different algorithms to overcome the limitations of the toolbox reported in our previous work, as explained below [14].
This study was driven by the realisation that there is scarce data available on the temperature dependence of refractive indices of Si and Ge at THz frequencies, and that such data are necessary for a number of applications. In this work, we measure the refractive indices of high purity commercial single-crystal Si and Ge plates in the THz region between 4.2–7.7 THz (140–257 cm−1, 71–38 µm) as a function of temperature between 4–296 K.

2. Materials and Methods

Commercial Si and Ge samples were purchased with thicknesses appropriate for the technique: 1.060 mm for Si and 0.575 mm for Ge. The Si sample has been reported on previously using the same technique, measured at room temperature [14].
Transmission through the samples was measured using a Bruker IFS125HR FTS at a nominal resolution of 0.3 GHz (0.01 cm−1) in the range of 2–10 THz (67–334 cm−1) with the samples mounted in an Oxford Instruments continuous flow helium cryostat. The FTS instrument uses an f/8 focused beam with the sample at the focus, which is the image of the source aperture. As such, the wavefront at the sample plane is approximately planar. The effect of off-axis beams in the sample is small, as confirmed by the constant amplitude of the oscillation over many interference orders (see Figure 1a).
The radiation source in the FTS is a SiC (silicon carbide) glow bar, and the detector is a He-cooled composite Si bolometer. The cryostat windows are polypropylene and the bolometer window is high-density polyethylene.
The reference scan for each sample was taken with the sample removed from the cryostat mount, but with the cryostat present in the system. Transmission spectra, i.e., frequency-dependent ratios of sample and reference signals were calculated from interferograms by the OPUS software package provided by the manufacturer, using standard processing methods. Absorption bands in the window of the detector caused sections of the measurement band to be dominated by noise (notably, the regions 3.8–4.2 THz, 7.7–8.2 THz) and so in the analysis, only the region 4.2–7.7 THz (140–257 cm−1) was used.
To recover the real part of the refractive index, we used the Fourier-transform based methods which we previously reported in detail [14], with the additional details published under a GNU Open License (Version 1, 2018, University of Surrey, freely available source code) [16]. These methods improve on the traditional calculations that use fringe separation in that they also implement a Fourier windowing analysis together with the equations for the transmittance of an absorbing Fabry–Perot cavity. This combination of techniques enables us to obtain both real and imaginary parts of the complex refractive index (under defined experimental conditions), without recourse to reflection measurements or Kramers–Kronig analysis. The software package for extracting n(f) is robust to noise, to errors arising from insufficient frequency or amplitude resolution, and to amplitude errors where the transmission exceeds unity.
The main limitation of these methods is the requirement of an initial condition (as explained below). We took advantage of the different assumptions of two techniques in the package to find good estimates for initial conditions. The “fringe” method finds the locations of peaks (“fringes”) in the data and applies an extrapolation technique to deduce the absolute refractive index. This approach assumes that the refractive index remains constant between peak maxima, and produces an exact value in the absence of dispersion, i.e., when dn/df = 0; whereas in the presence of dispersion the result is only approximate [14]. The initial condition (assumption) is therefore negligible dispersion dn/df. The “phase” method takes advantage of phase information encoded in the data to find dn/df, and numerically integrates from a known n at any f within the measurement bandwidth as the initial condition.
We used the fringe method to estimate the initial starting point of the phase method (i.e., to determine n at some f), using as an assumed “flat” region a few fringes near 5 THz. Figure 1a shows an example of transmission for Ge at 4 K and 296 K, where Fabry–Perot fringes are clearly visible. The period of the fringes is smaller at 296 K than at 4 K due to higher refractive index. The amplitude of the fringes is also reduced at room temperature due to increased absorption losses. The results of the fringe method as applied to Ge are presented in Figure 1b, where the entire extracted spectrum is shown for different temperatures. The main difference between the two algorithms is that the “phase” method is more robust and yields a smoother, more densely sampled spectrum [14] so only these results are presented here. The lack of refractive index dispersion in this region signals low absorption and the absence of resonances, either carrier or phonon.
The calculated refractive index n(f) was averaged over the data at each temperature. The uncertainty was taken to be the range of the data at each temperature. The main remaining source of uncertainty in the analysis is the systematic error due to the uncertainty in the thickness of the samples. Samples were mounted in a fixed holder aligned normal to the transmitted beam, ensuring normal incidence in all measurements. Thickness variation due to linear thermal expansion was accounted for by using literature values for the thermal expansion coefficient of each material as a function of temperature [17,18], and these corrections to the thickness are of the order of 0.25% for Si and 0.5% for Ge.

3. Results and Discussion

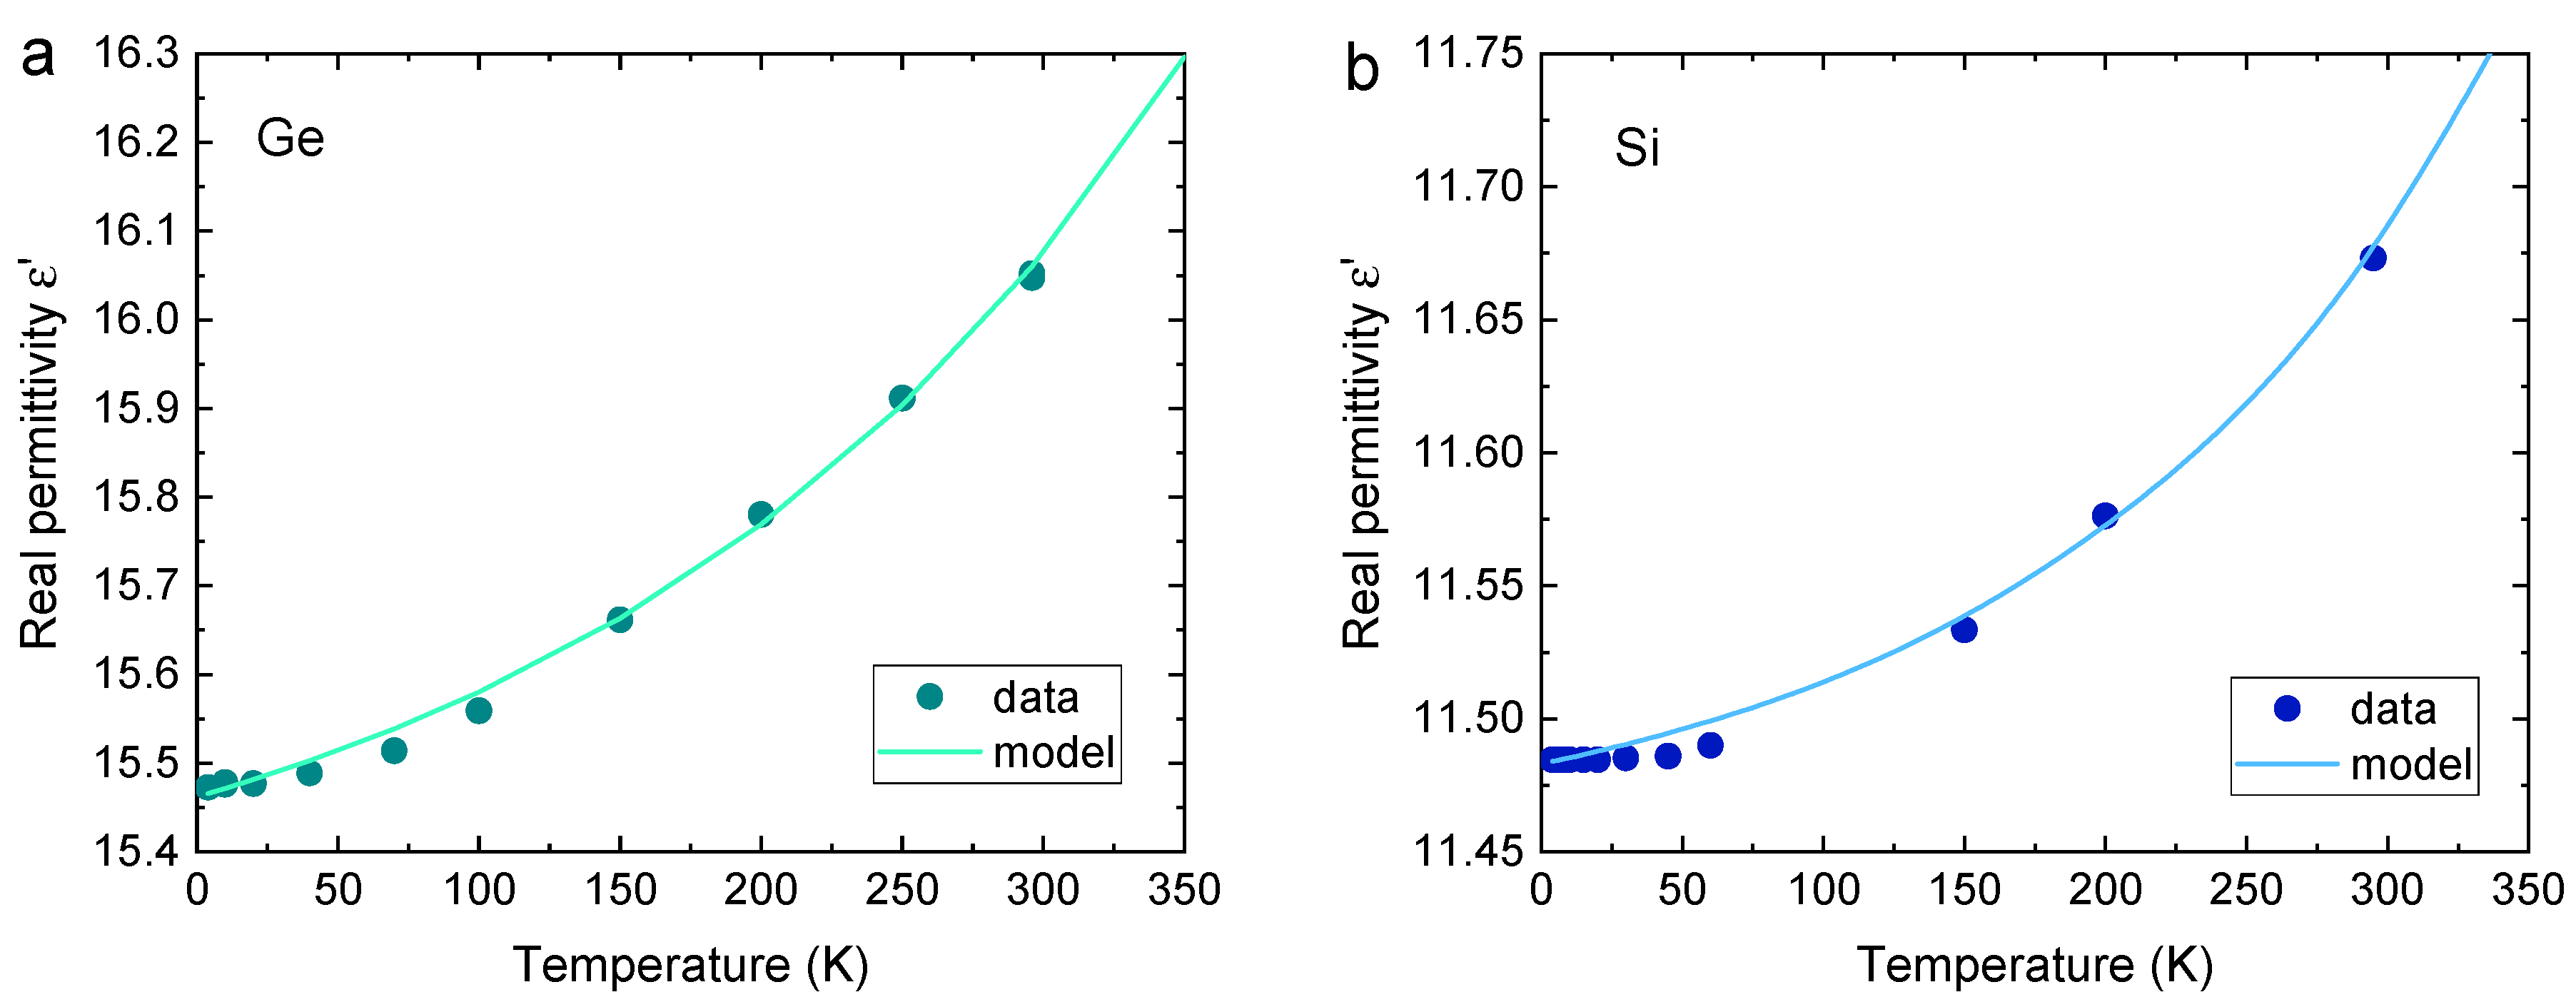
Figure 2 shows the mean refractive indices of Ge and Si as a function of temperature. The refractive index values are averages over 4.2–7.7 THz. It is seen that in both materials the refractive index increases with temperature, and that in Ge the increase is approximately twice as large as in Si.
The measured refractive index values are similar to those reported in the literature. The refractive index of Ge at 4 K was determined to be 3.934 ± 0.003. It was reported as 3.925 ± 0.02 at 1.5 K in [19]; and at 4 K as 3.929 ± 0.03 [20] and 3.924 ± 0.02 [21]. At 295 K it was measured as 4.006 ± 0.003; whereas it was reported as 4.006 ± 0.002 [19], and 4.005 ± 0.001 [22] at 300 K. The refractive index of Si at 4 K was measured as 3.389 ± 0.03; and reported at 1.5 K as 3.386 ± 0.002 [19]. At 295 K it was found to be 3.417 ± 0.003; whereas it was reported at 300 K as 3.420 ± 0.002 [19], 3.418 ± 0.001 [22] and 3.4175 ± 0.0003 [23].
As seen in Figure 2, the slope dn/dT increases with temperature. A model that describes the behaviour and allows one to interpolate and extrapolate the experimental data would therefore be useful. A simple phenomenological model may be proposed by considering that the refractive index arises from material polarizability, as given by the Lorentz–Lorenz relationship [24]:
ε 1 ε + 2 = 4 π 3 N p
where ε′ is the real permittivity, p is the polarizability of the material, and N is the number of molecules per unit of volume. When absorption is low, as is the case in Ge and Si, then permittivity is related to the refractive index by ε′ = n2. The temperature dependence of the refractive index may therefore be attributed to the temperature effect on polarizability.
Polarizability is determined by spatial distribution of charges and bonds, and their response to electromagnetic fields. Therefore, its dominant component is temperature-invariant, as is seen in Figure 2 where the temperature variation of refractive index between 4 K and 296 K is <2% for Ge and <1% for Si. The temperature-dependent component of polarizability may be considered in the light of the fact that some physical parameters have temperature dependence that is exponential in kT (e.g., viscosity), and therefore it may be hypothesised that polarizability may have an exponential component. Hence, a phenomenological relationship having the form below may be considered:
p ( T ) =   p 0 + A ( e β T 1 )
where p0 is polarizability at 0 K, and A and β are parameters dependent on the material properties.
The solid lines in Figure 2 are a fit to the model in Equations (1) and (2). The model gives a good fit at temperatures above 70 K. The fitting parameters are:
for Ge:
4 π 3 N p = 0.8282 + 0.00200   ( e 0.00455 T 1 ) ,      R 2 = 0.99716
for Si:
4 π 3 N p = 0.7775 + 0.000572   ( e 0.00636 T 1 ) ,      R 2 = 0.99459

4. Conclusions

We have measured refractive indices of high resistivity Si and Ge at temperatures between 4–296 K in the frequency range between 4.2–7.7 THz. Si and Ge are two of the most technologically important semiconductors, which are also widely used in cryogenic environments such as quantum research. To our knowledge, this is the first report of refractive indices of Si and Ge at THz frequencies and at cryogenic temperatures. The frequency region addressed in this study is a particularly difficult region of the terahertz spectrum, where other topical techniques such as THz-TDS struggle to obtain high signal–noise ratio, and cryogenic measurements are quite uncommon. While the measurement technique we used has been previously reported [14], we have combined elements of that toolbox in novel ways to overcome some of its inherent limitations. Our measurements show a systematic change in refractive index as a function of temperature. We propose a phenomenological model that describes the observed behaviour and allows one to interpolate the data.

Author Contributions

Conceptualisation, all authors; methodology and investigation, G.M.; software and data curation, S.C.; formal analysis, S.C. and M.N.; validation, S.C., M.N., and B.M.; writing—original draft preparation, S.C. and M.N.; writing—review and editing, M.N. and B.M.; visualisation, M.N. All authors have read and agreed to the published version of the manuscript.

Funding

Funded by the Engineering and Physical Sciences Research Council (EPSRC), UK, under grant [COMPASSS/ADDRFSS, Grant No. EP/M009564/1].

Institutional Review Board Statement

Not applicable.

Informed Consent Statement

Not applicable.

Data Availability Statement

Data is contained within the article.

Conflicts of Interest

The authors declare no conflict of interest.

References

  1. Dhillon, S.S.; Vitiello, M.S.; Linfield, E.H.; Davies, A.G.; Hoffmann, M.C.; Booske, J.; Paoloni, C.; Gensch, M.; Weightman, P.; Williams, G.P.; et al. The 2017 terahertz science and technology roadmap. J. Phys. D Appl. Phys. 2017, 50, 043001. [Google Scholar] [CrossRef]
  2. Mittleman, D.M. Perspective: Terahertz science and technology. J. Appl. Phys. 2017, 122, 230901. [Google Scholar] [CrossRef]
  3. Jepsen, P.U.; Cooke, D.G.; Koch, M. Terahertz spectroscopy and imaging—Modern techniques and applications. Laser Photonics Rev. 2011, 5, 124–166. [Google Scholar] [CrossRef]
  4. Neu, J.; Schmuttenmaer, C. Tutorial: An introduction to terahertz time domain spectroscopy (THz-TDS). J. Appl. Phys. 2018, 124, 231101. [Google Scholar] [CrossRef] [Green Version]
  5. Hwang, H.Y.; Fleischer, S.; Brandt, N.C.; Perkins, B.G., Jr.; Liu, M.; Fan, K.; Sternbach, A.; Zhang, X.; Averitt, R.D.; Nelson, K.A. A review of non-linear terahertz spectroscopy with ultrashort tabletop-laser pulses. J. Mod. Opt. 2014, 62, 1447–1479. [Google Scholar] [CrossRef]
  6. Mittleman, D.M. Twenty years of terahertz imaging [Invited]. Opt. Express 2018, 26, 9417–9431. [Google Scholar] [CrossRef]
  7. Guerboukha, H.; Nallappan, K.; Skorobogatiy, M. Toward real-time terahertz imaging. Adv. Opt. Photonics 2018, 10, 843–938. [Google Scholar] [CrossRef]
  8. Nicoletti, D.; Cavalleri, A. Nonlinear light–matter interaction at terahertz frequencies. Adv. Opt. Photonics 2016, 8, 401–464. [Google Scholar] [CrossRef]
  9. Chick, S.; Stavrias, N.; Saeedi, K.; Redlich, B.; Greenland, P.T.; Matmon, G.; Naftaly, M.; Pidgeon, C.R.; Aeppli, G.; Murdin, B. Coherent superpositions of three states for phosphorous donors in silicon prepared using THz radiation. Nat. Commun. 2017, 8, 16038. [Google Scholar] [CrossRef] [Green Version]
  10. Naftaly, M.; Vieweg, N.; Deninger, A. Industrial Applications of Terahertz Sensing: State of Play. Sensors 2019, 19, 4203. [Google Scholar] [CrossRef] [Green Version]
  11. Kohlhaas, R.B.; Breuer, S.; Liebermeister, L.; Nellen, S.; Deumer, M.; Schell, M.; Semtsiv, M.P.; Masselink, W.T.; Globisch, B. 637 μW emitted terahertz power from photoconductive antennas based on rhodium doped InGaAs. Appl. Phys. Lett. 2020, 117, 131105. [Google Scholar] [CrossRef]
  12. Piccoli, R.; Rovere, A.; Jeong, Y.-G.; Jia, Y.; Zanotto, L.; Légaré, F.; Schmidt, B.E.; Morandotti, R.; Razzari, L. Extremely broadband terahertz generation via pulse compression of an Ytterbium laser amplifier. Opt. Express 2019, 27, 32659–32665. [Google Scholar] [CrossRef] [PubMed]
  13. Vicario, C.; Ruchert, C.; Hauri, C.P. High field broadband THz generation in organic materials. J. Mod. Opt. 2013, 62, 1480–1485. [Google Scholar] [CrossRef]
  14. Chick, S.; Murdin, B.N.; Matmon, G.; Naftaly, M. Metrology of complex refractive index for solids in the terahertz regime using frequency domain spectroscopy. Metrologia 2018, 55, 771–781. [Google Scholar] [CrossRef]
  15. Parrott, E.P.J.; Zeitler, J.A. Terahertz Time-Domain and Low-Frequency Raman Spectroscopy of Organic Materials. Appl. Spectrosc. 2015, 69, 1–25. [Google Scholar] [CrossRef]
  16. Supporting Data for “Metrology of Complex Refractive Index for Solids in the Terahertz Regime Using Frequency Domain Spectroscopy”. Available online: https://doi.org/10.5281/zenodo.1237819 (accessed on 5 January 2021).
  17. Carr, R.H.; McCammon, R.D.; White, G.K. Thermal expansion of germanium and silicon at low temperatures. Philos. Mag. 1965, 12, 157–163. [Google Scholar] [CrossRef]
  18. White, G.K.; Minges, M.L. Thermophysical properties of some key solids: An update. Int. J. Thermophys. 1997, 18, 1269–1327. [Google Scholar] [CrossRef]
  19. Loewenstein, E.V.; Smith, D.R.; Morgan, R.L. Optical Constants of Far Infrared Materials 2: Crystalline Solids. Appl. Opt. 1973, 12, 398–406. [Google Scholar] [CrossRef]
  20. Nelson, E.; Withers, S.; Muravjov, A.V.; Strijbos, R.; Peale, R.E.; Pavlov, S.G.; Shastin, V.N.; Fredricksen, C. High-resolution study of composite cavity effects for p-Ge lasers. IEEE J. Quantum Electron. 2001, 37, 1525–1530. [Google Scholar] [CrossRef]
  21. Muravjov, A.V.; Withers, S.H.; Strijbos, R.C.; Pavlov, S.G.; Shastin, V.N.; Peale, R.E. Actively mode-locked p-Ge laser in Faraday configuration. Appl. Phys. Lett. 1999, 75, 2882–2884. [Google Scholar] [CrossRef] [Green Version]
  22. Randall, C.M.; Rawcliffe, R.D. Refractive Indices of Germanium, Silicon, and Fused Quartz in the Far Infrared. Appl. Opt. 1967, 6, 1889–1895. [Google Scholar] [CrossRef] [PubMed]
  23. Dai, J.; Zhang, J.; Zhang, W.; Grischkowsky, D. Terahertz time-domain spectroscopy characterization of the far-infrared absorption and index of refraction of high-resistivity, float-zone silicon. J. Opt. Soc. Am. B 2004, 21, 1379–1386. [Google Scholar] [CrossRef] [Green Version]
  24. Duffy, J.A. Bonding, Energy Levels and Bands in Inorganic Solids; Longman Scientific & Technical: New York, NY, USA, 1990. [Google Scholar]
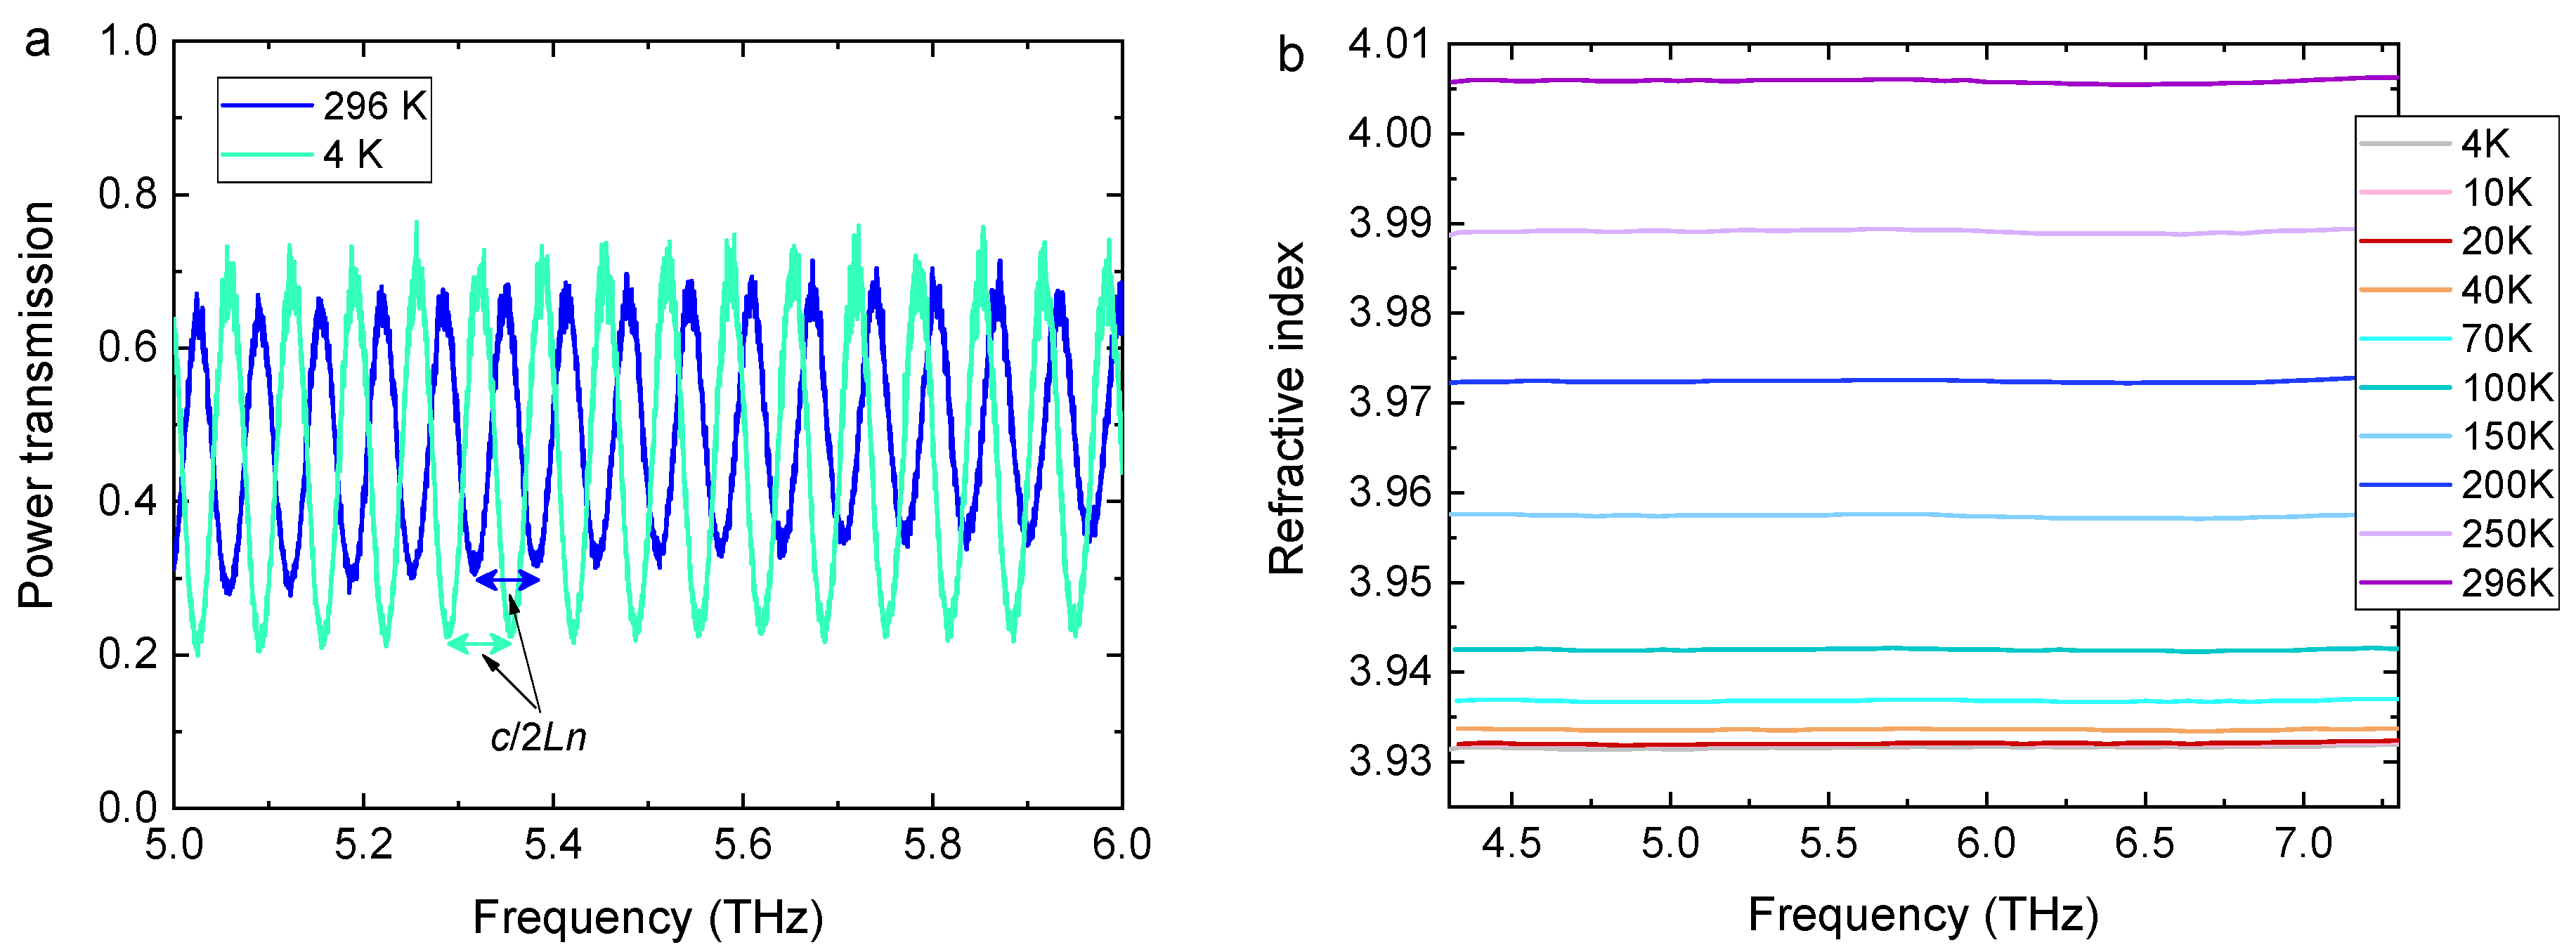
Figure 1. (a) Part of the transmission spectrum of Ge at 4 K and 296 K, showing Fabry–Perot fringes used in calculating the refractive index. (b) Calculated refractive index of Ge at different temperatures.
Applsci 11 00487 g001
Figure 2. Temperature dependence of the refractive index in (a) Ge and (b) Si. The refractive index values are mean averages over 4.2–7.7 THz. (The errors, taken as standard deviation of the mean refractive index, are smaller than the size of the symbols.) Solid lines are a fit to Equations (1) and (2); the fitting parameters are given in Equations (3) and (4).
Applsci 11 00487 g002
Publisher’s Note: MDPI stays neutral with regard to jurisdictional claims in published maps and institutional affiliations.