Article

Modeling and Spatiotemporal Mapping of Water Quality through Remote Sensing Techniques: A Case Study of the Hassan Addakhil Dam

1
Functional Ecology and Environmental Engineering Laboratory, Faculty of Science and Technology, Sidi Mohamed Ben Abdellah University, Fez BP2202, Morocco
2
Department of Geology, Laboratory of Geoengineering and Environment, Research Group “Water Sciences and Environment Engineering”, Faculty of Sciences, Moulay Ismail University Zitoune, Meknes BP11201, Morocco
3
Guir-Ziz-Rheris Hydraulic Basin Agency, Errachidia BP52000, Morocco
4
Interreg Italia-Malta-Project, Pocket Beach Management & Remote Surveillance System (BESS), University of Messina, 31-98166 Messina, Italy
5
Institute of Agricultural Engineering, University of Hohenheim, 70599 Stuttgart, Germany
6
GeoloGIS s.r.l. Spin Off of Università degli Studi di Messina, 31-98166 Messina, Italy
7
Dipartimento di Scienze Matematiche e Informatiche, Scienze Fisiche e Scienze della Terra, Università degli Studi di Messina, 31-98166 Messina, Italy
*
Author to whom correspondence should be addressed.
Appl. Sci. 2021, 11(19), 9297; https://doi.org/10.3390/app11199297
Submission received: 11 July 2021 / Revised: 24 September 2021 / Accepted: 30 September 2021 / Published: 7 October 2021
(This article belongs to the Special Issue Sustainable Agriculture and Advances of Remote Sensing)

Abstract

:
With its high water potential, the Ziz basin is one of the most important basins in Morocco. This paper aims to develop a methodology for spatiotemporal monitoring of the water quality of the Hassan Addakhil dam using remote sensing techniques combined with a modeling approach. Firstly, several models were established for the different water quality parameters (nitrate, dissolved oxygen and chlorophyll a) by combining field and satellite data. In a second step, the calibration and validation of the selected models were performed based on the following statistical parameters: compliance index R2, the root mean square error and p-value. Finally, the satellite data were used to carry out spatiotemporal monitoring of the water quality. The field results show excellent quality for most of the samples. In terms of the modeling approach, the selected models for the three parameters (nitrate, dissolved oxygen and chlorophyll a) have shown a good correlation between the measured and estimated values with compliance index values of 0.62, 0.56 and 0.58 and root mean square error values of 0.16 mg/L, 0.65 mg/L and 0.07 µg/L for nitrate, dissolved oxygen and chlorophyll a, respectively. After the calibration, the validation and the selection of the models, the spatiotemporal variation of water quality was determined thanks to the multitemporal satellite data. The results show that this approach is an effective and valid methodology for the modeling and spatiotemporal mapping of water quality in the reservoir of the Hassan Addakhil dam. It can also provide valuable support for decision-makers in water quality monitoring as it can be applied to other regions with similar conditions.

1. Introduction

Over the last two decades, Morocco, as a Mediterranean country affected by climate change, has pursued an economic and social policy characterized by numerous development programs such as the policy of dam construction [1]. These hydraulic infrastructures provide a variety of services to both humans and the environment by organizing agricultural practice [2,3], as well as ensuring an efficient mobilization of water resources and improving the living conditions and environment of citizens [3]. These dams also provide habitat for fauna and flora and play a very important role in the global carbon cycle and climate change [4,5]. However, they are facing the interannual variability of precipitation and the succession of droughts and floods [6,7,8,9]. In order to monitor the water quality and observe the biophysical and biochemical conditions of the Hassan Addakhil dam and to prevent serious damage from occurring to the ecological system, the Guir-Ziz-Rheris Hydraulic Basin Agency (HBAGZR), in charge of water resources management in the Errachidia region, conducts in situ measurement surveys. The implemented system of in situ measurement (Figure 1) and monitoring is not practical due to its limitations in time and space [10]. It is expensive and has deficiencies that prevent accurate and complete results. Therefore, it is essential to have a complete, accurate, fast and inexpensive monitoring system to follow the water quality of the dam in order to avoid any degradation by applying prompt treatments.
Recently, geospatial tools have been widely used for the spatiotemporal monitoring of environmental phenomena [6,11,12], especially the monitoring of lake water quality parameters [3,13,14,15,16,17,18,19,20,21,22,23,24,25,26,27,28,29,30]. Such application is mainly enabled by the high spatial resolution data [21,24,26] as well as the temporal resolution. However, this aspect has always encountered problems due to the lack of appropriate sensors [31,32]. Moreover, moderate resolution sensors that are characterized by frequent revisit time and high radiometric resolution have been used [31], but the spatial resolution of these sensors does not allow for small lakes [31]. Several works have been carried out using Landsat TM and ETM+ data, but these satellites are limited in terms of revisit time [21,31] for very frequent monitoring. However, with the availability of new satellites with higher spatial, spectral and temporal resolution, such as Landsat OLI and Sentinel-2, retrieval and mapping of water quality from the satellite orbit has become more accessible. In 2008, Kallio et al. [31] conducted a study with the main purpose of monitoring turbidity and colored dissolved organic matter (CDOM) through ETM+ images in lakes in two river basins in southern Finland. The results showed that despite limitations in spectral and radiometric resolution, these images can be an effective and useful tool for water quality monitoring of small lakes (<1 km2). Toming and his collaborators [18] conducted a study in Estonia in which they evaluated Sentinel-2 Multispectral Imager (MSI) data in the mapping of different lake water quality parameters such as chlorophyll a (Chl-a), water color, CDOM and dissolved organic carbon (DOC). Therefore, field data of different parameters were compared to the Sentinel-2 derived band ratio algorithms. The obtained results showed a strong correlation between the Sentinel-2 MSI ratio bands and the different lake water quality parameters such as Chl-a (R2 = 0.83). In the Czech Republic, a study was carried out by Saberioon and his collaborators [33]. It aimed at developing a semiempirical model for predicting water quality parameters such as Chl-a and total suspended solids (TSS) by combining Sentinel-2A data and machine learning methods. The results showed an adequate prediction accuracy for both Chl-a (R2 = 0.85, RMSEp = 48.57) and TSS (R2= 0.80, RMSEp = 19.55).
Jerry C. Ritchie et al. [29] conducted a study aimed at providing the capability of remote sensing technology in mapping water quality parameters (suspended sediments (turbidity), chlorophyll and temperature). As a result, in situ measurements have been used to assess water quality, and empirical relationships between spectral properties and water quality parameters have been established. Another study was carried out by Carly Hyatt Hansen et al. [30] in the USA at three lakes in the Great Salt Lake surface water system (namely the Great Salt Lake, Farmington Bay and Utah Lake), the objective of which was to improve techniques for the development of algal mapping models through the use of field sampling methods. This study has shown that Landsat, SENTINEL-2 and MODIS sensors are suitable for monitoring water quality in the lake system. In some cases, temporal variability may be an obstacle to detecting short-term events, but it may be sufficient in other areas where short-term variability is lower.
In Morocco and in another context, El Hafyani et al. [34] conducted a study in the Tafilalet plain aiming at modeling and mapping soil salinity through Landsat Oli images. The results showed a strong fitting of this technique with R2 of models ranging from 0.53 to 0.75 and root mean square error of 0.62 to 0.82 dS/m. Karaoui et al. [3] carried out a study aiming at estimating and mapping the water quality parameters in the Bin El Ouidane reservoir through better understanding the relationship between the latter and digital data. The correlation results showed that all the studied parameters have an R2 greater than 0.52 and that they can be transformed into predictive models by stepwise regression. This work carried out at the Bin El Ouidane reservoir is of considerable importance for the water resource managers of the Oum Er-Rbia Hydraulic Agency. Thus, the present study was carried out at the level of the Hassan Addakhil dam, in collaboration with the Guir-Ziz-Rheris Hydraulic Basin Agency (HBAGZR). It aims at the validation of this method and the strengthening of its results by comparing them with other studies in the same context.
The objective of this study is to conduct modeling and spatiotemporal mapping of water quality of the Hassan Addakhil reservoir by combining the high spatial resolution data (Sentinel-2) and field measurements. In fact, 20 samples were collected on 14 March 2021, at the same Sentinel-2 satellite transit time. Measurements of nitrate, dissolved oxygen and Chl-a were carried out. Next, a statistical study was performed to select the bands correlated with the quality measurements, and a stepwise regression analysis was elaborated to model each parameter. Finally, a spatiotemporal mapping was made for water quality.

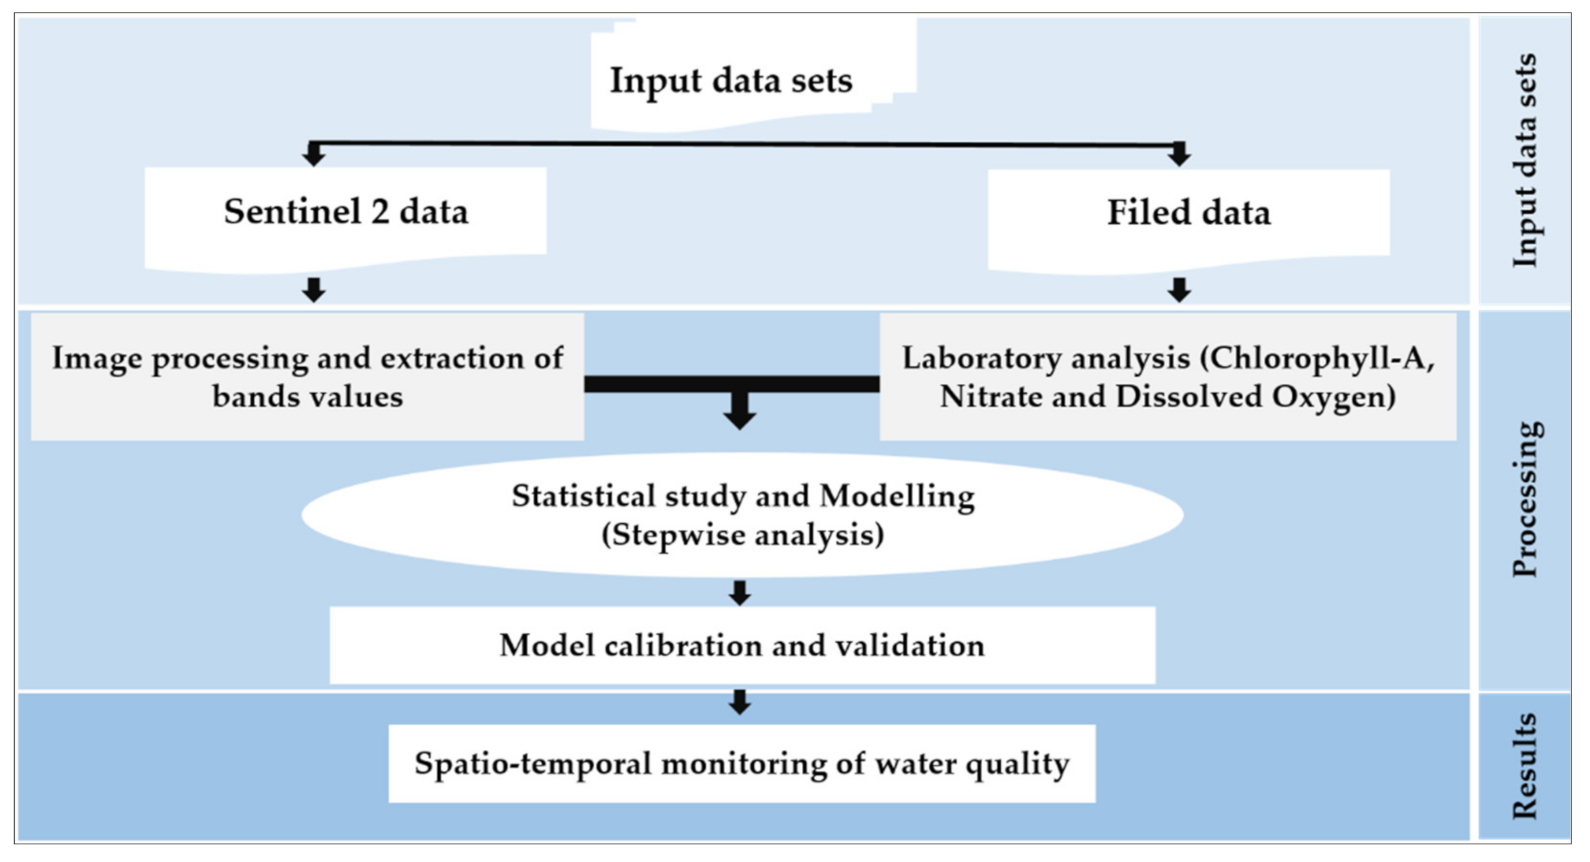
2. Materials and Methods
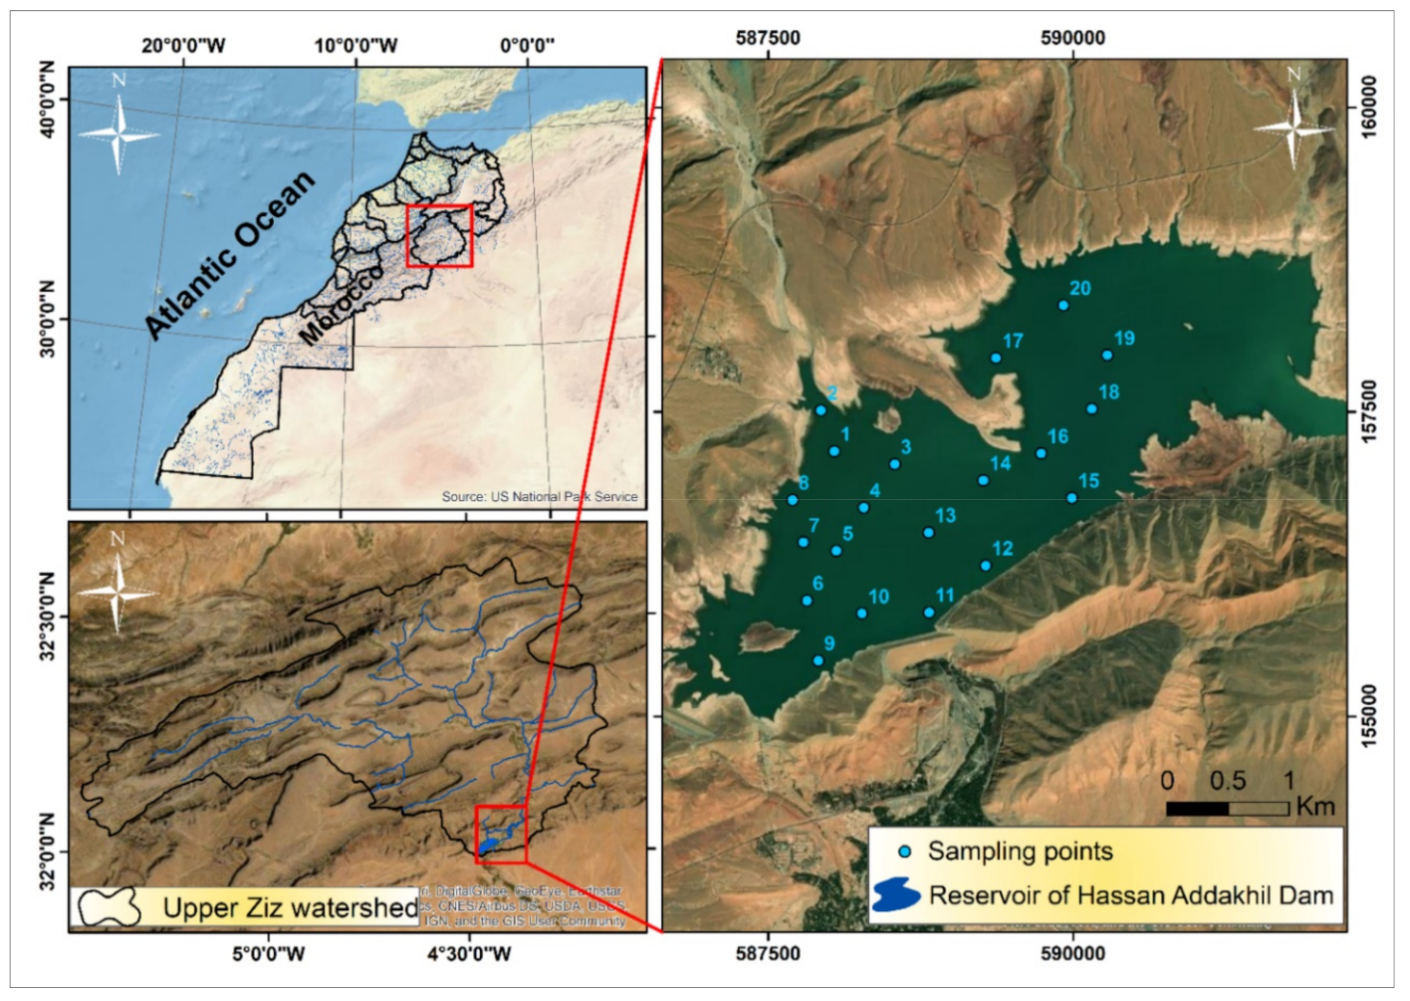
2.1. Study Area

The Hassan Addakhil reservoir is located in the southeast of Morocco at a longitude of 4°28′50.98″ W, latitude of 31′01′00.44″ N and altitude of 1125 m (Figure 2). It accurately lays at Foum Rhiour on the Ziz River, to the north of Errachidia city. It was built in 1970, five years after the devastating flood of October 1965, which ravaged the Ziz valley, leaving 25,000 people homeless. Its retention capacity is 312.8 million m3. The objective of its construction was to ensure protection against floods and to achieve agricultural development of the Ziz valley and the Tafilalet plain by regulating its floods. This dam receives the water of the Ziz River and its tributaries, which drain the Upper Ziz watershed. The latter is rich in fertile valleys but with low development of perennial courses. The geology is of Jurassic type [35] with limestone and dolomitic limestone formations that constitute good water reservoirs [36,37,38,39]. The climate is semiarid with short and brutal precipitation. The rainwater that escapes infiltration and evapotranspiration flows into the Hassan Addakhil dam (Figure 3). Downstream of the dam, aridity increases and evaporation phenomena increase. The dry period often lasts up to eight months, with maximum temperatures obtained during the months of June, July and August. The winter is relatively wet and very cold with minimum temperatures in January [40].

2.2. Data

2.2.1. Ground Data

Ground truth samples were taken at 20 points distributed over the reservoir of Hassan Addakhil dam (Figure 2), where nitrate, dissolved oxygen and Chl-a were measured by chemical process at the laboratory of the Guir-Ziz-Rheris Hydraulic Basin Agency in Errachidia and Gaya Laboratory in Rabat, Morocco, according to the Moroccan law adopted for aquatic waters [41] (Table 1). The Chl-a indicates the stage of eutrophication in the reservoir, while the nitrates’ concentration is directly related to the agricultural practices upstream of the reservoir, as well as to wastewater discharge.
Dissolved oxygen was measured in situ using a portable dissolved oxygen meter (BANTE Instruments 821). For the determination of Chl-a, a volume of samples between 0.1 and 2 L was first filtered under vacuum through a glass fiber filter without organic binder with a diameter greater than 1 µm, depending on the algal content, after shaking. Then we proceed to the extraction step by pouring a small volume of acetone (20 mL to 30 mL) into the tube containing the filtered pieces. This step was followed by shaking the extract contained in the extraction tubes for at least 3 min. Finally, we proceeded to the reading of a part of the clear extract by UV-Vis spectrophotometry (Lovibond), which provides double-beam operation with a scattered light rate of 0.01%, wavelength accuracy of +/−0.1 nm and stability of 0.00015. The measurements were made at two wavelengths, A1 = 665 nm and A2 = 750 nm, by comparison with a reference cell filled with acetone.
The determination of nitrates was done by UV-Vis spectrophotometric calibration (Lovibond). In fact, after the preparation of the solution noted, it was smothered by dissolving 129 mg of ammonium nitrate (of raw formula NH4NO3) in 1.0 L of distilled water. A solution of mass concentration (or content) equal to 100 mg L–1 was then obtained. Then, we subtracted the absorbance of the blank from the absorbance of each standard solution and plotted the calibration curve showing absorbance versus mass of nitrate, in milligrams per liter. Finally, the nitrate concentration C was determined from the UV–visible calibration curve, established following the Beer–Lambert law.
The analyses of the samples were measured in three replicates, and the average was calculated. The Table 1 shows the average of the three measured values.

2.2.2. Satellite Data

Twelve images obtained from the Sentinel-2 sensor of the European Space Agency (https://sentinel.esa.int/web/sentinel/sentinel-data-access (accessed on 10 August 2021)) were used in this study. These images are characterized by a high spatial resolution of 10 to 60 m from the visible to mid-infrared range and a revisit time of 10 days (Table 2). The March image was used for calibration with field data and model validation, while the other images were used for spatiotemporal monitoring of different parameters. These images have been uploaded for the period April 2020–March 2021 (Table 3). The QGIS software was used to process the Sentinel-2 satellite images through the interface (Semi-Automatic Classification Plugin) developed by Luca Congedo [42]. There were several preprocessing steps, including the conversion of digital number (DN) to top of atmosphere reflectance (TOA) and the subsequent atmospheric correction by the dark object subtraction (DOS) algorithm [43].

2.3. Methodology

Figure 4 shows the different phases of this work. A field mission was carried out in the Hassan Addakhil dam on the same day of the satellite visit in order to calibrate the extracted models for the different water quality parameters, for which the image of 14 March 2021 has been used. This mission was done in collaboration with the staff of the Guir-Ziz-Rheris Hydraulic Basin Agency, and the analyses were realized in its laboratory. Later on, a statistical study was carried out to extract the different correlated bands with the different parameters, and a multiple stepwise analysis modeling approach was used in order to set the models. Several models were extracted for the different parameters, and the selection of a suitable one was made on the basis of the compliance index R2, the root mean square error (RMSE) and p-value. Finally, after the models’ validation and the extraction of their equations, spatiotemporal monitoring of the reservoir water quality was performed through multitemporal images.

3. Results

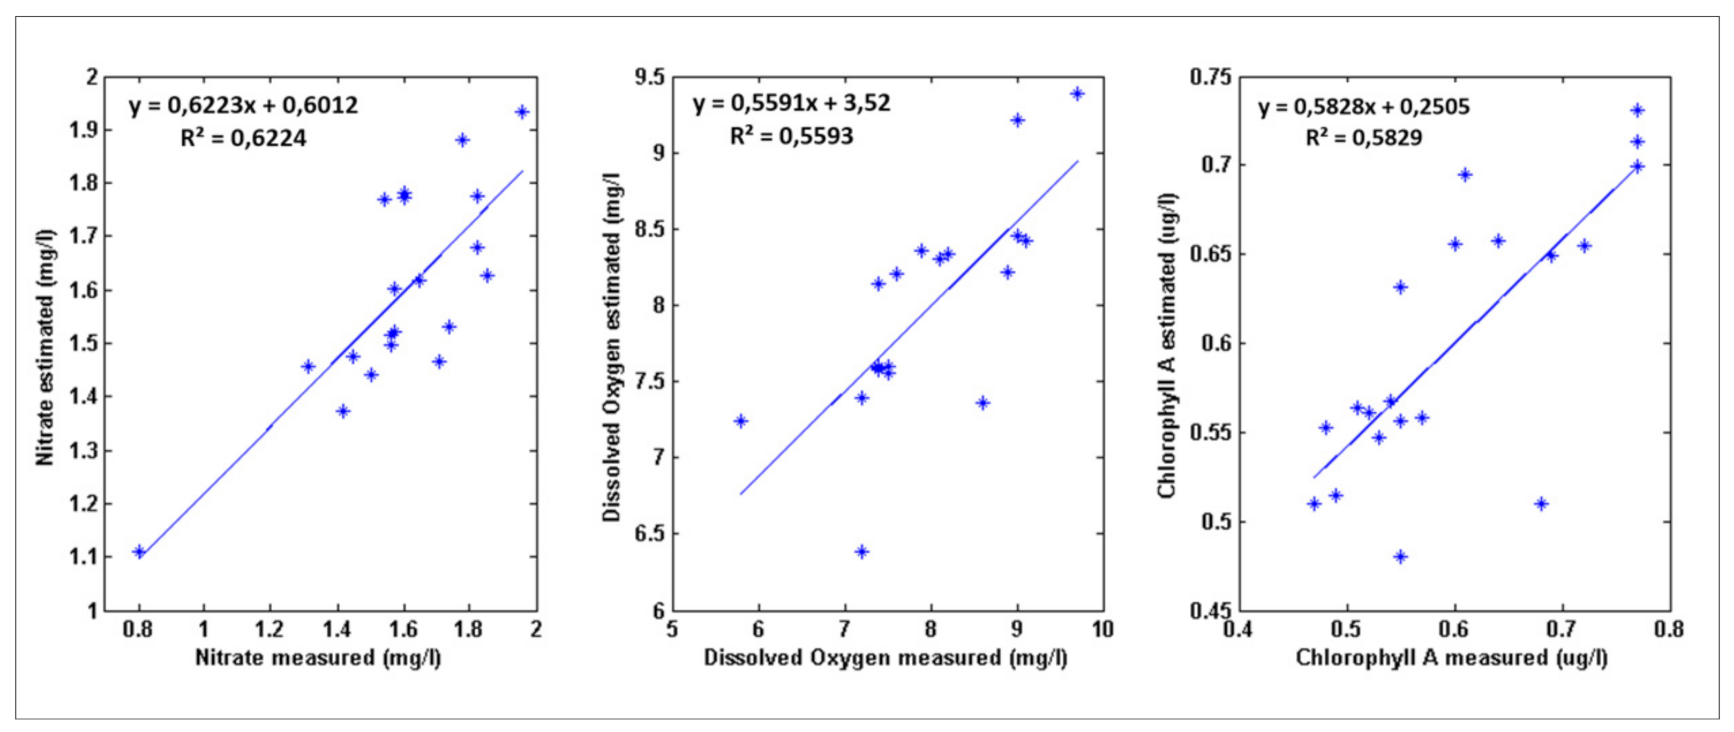
3.1. Model Assessment and Validation

Modeling is a representation of reality in order to demonstrate some of its properties. Therefore, there are several types of models, such as stochastic models, optimization models, dynamic simulation models and empirical statistical models, that allow predicting the outcome of a categorical variable using a set of quantitative and/or qualitative predictors.
In this case, a statistical model based on a stepwise multiple regression analysis was developed for the models’ creation in order to estimate different water quality parameters using the RStudio open source software, using the following equation:
Y = b0 + b1 × X1 + b2 × X2 + … + bk × Xk
Y is the predicted variable with regression coefficients b1 to k and Y-intercept b0 when the values for the predictor variables are X1 to k.
Firstly, a correlation study was conducted between the different water quality parameters and the satellite image bands in order to select the appropriate bands for the elaboration of the models (Table 4). For Chl-a, bands B5, B6 and B7 showed a strong correlation with this band with correlation coefficients of 0.81, 0.71 and 0.73, respectively. The bands B1, B3 and B4 showed a strong correlation with nitrates with correlation coefficients of 0.73, 0.69, and 0.73, respectively. Dissolved oxygen measurements showed a positive correlation with bands B2 and B3 with correlation coefficients of 0.71 and 0.75, respectively. The bands that were chosen in the first step were later integrated into the equations of the different models (Table 5). The choice of the suitable model was based on the three statistical parameters, namely the compliance index R2, the root mean square error (RMSE) and p-value. The priority of choice was given to the models that have the strongest conformity index and the lowest root mean square error, while the threshold of p-value was fixed at a value of 0.05. Table 5 represents the different developed models along with their equations and the different statistical parameters for each. For dissolved oxygen, the chosen model is the one that combines band 2 and band 3, with a compliance index R2 of 0.56, a root mean square error of about 0.65 mg/L and a p-value of about 0.0009. For nitrates, the chosen model is the one that combines band 1, band 3 and band 4, with a compliance index R2 of 0.62, a root mean square error of about 0.16 mg/L and a p-value of about 0.0011. Lastly, for Chl-a, the chosen model is the one that groups band 5, band 6 and band 8, with a compliance index R2 of 0.58, a root mean square error of the order of 0.07 µg/L and a p-value of the order of 0.0024.
In order to verify the accuracy of the proposed models, the measured values in the field and the observed values of the different parameters were presented with their equations (Figure 5).

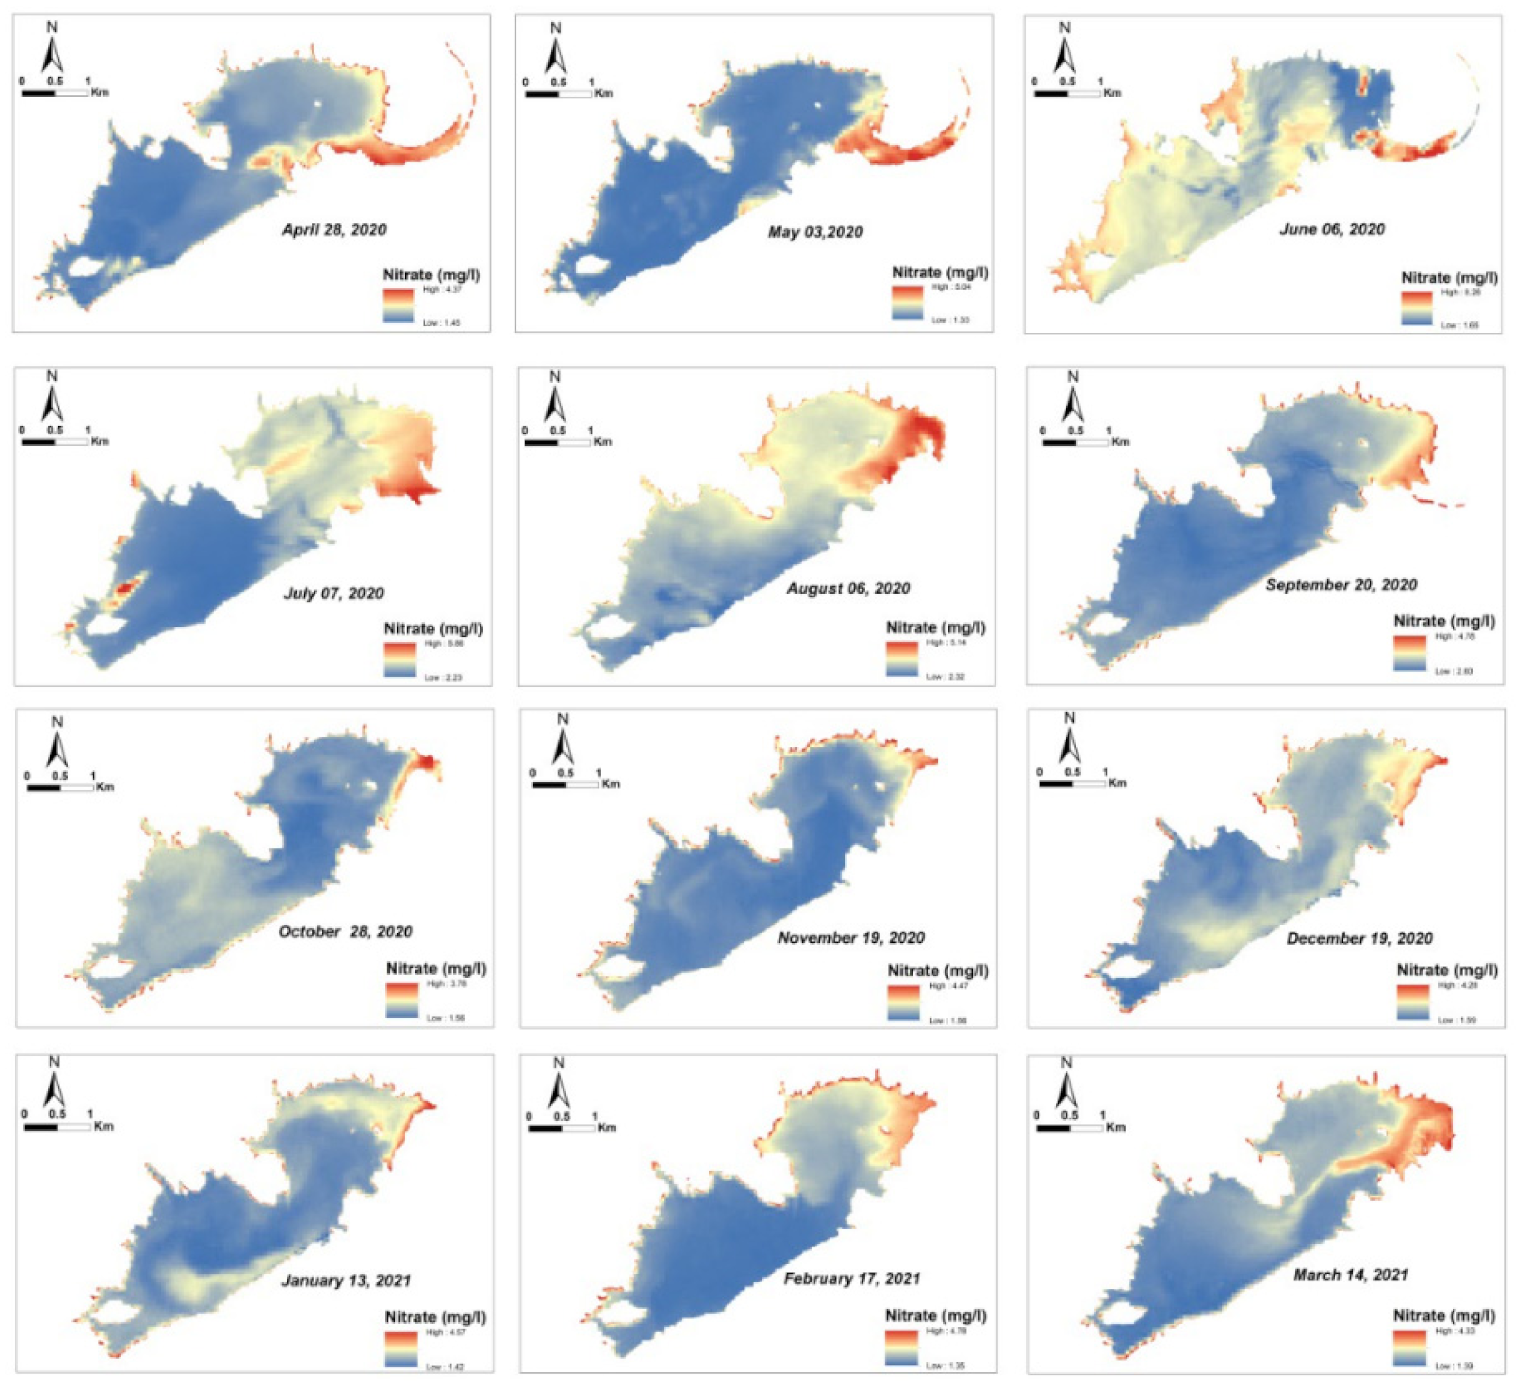
3.2. Spatial Variation of Water Quality

The dissolved oxygen levels measured during the field campaign vary between 5.8 and 9.7 mg/L, while the values estimated by the model show a minimum value of 6.39 mg/L and a maximum one of 9.39 mg/L (Figure 6). The spatial variation of this parameter shows a well-oxygenated zone in the northeast of the reservoir. This area represents the water inlet to the reservoir. For the spatiotemporal variation, the maps of different months show high values in the northeastern part of the reservoir with a decrease moving away from this area (Figure 6). Except for few months such as January, October and December, this variation can be explained by the coincidence of these periods with that of water supply for agriculture downstream of the dam which allows the movement of water in the reservoir and consequently an agitation of the water leading to an increase in the values of this parameter.
Generally, the samples showed an excellent quality from the point of view of the nitrate parameter with values ranging between 0.8 and 1.96 mg/L. The estimated values for the model are between 1.11 and 1.96 mg/L (Figure 7). The spatial variation of nitrate shows a decrease in values from the northeastern part of the reservoir, representing the outlet, to the southeastern part (Figure 7).
The temporal variation shows that nitrate values do not exceed 10 mg/L throughout the year. This proves the excellent water quality of this reservoir. This variation in the reservoir can be explained by the leaching from agricultural soils and also by domestic discharges of the agglomerations upstream.
Generally, the samples show an excellent quality compared to the quality standards for surface water in Morocco with Chl-a concentrations varying between 0.47 and 0.77 µg/L. The estimated values for the model range between 0.48 and 0.73 µg/L (Figure 8).

4. Discussion

The combination of field data, high spatial resolution images and modeling shows a strong efficiency in the spatiotemporal monitoring of water quality at the reservoir scale. On the other hand, the measured values of the different proposed models showed in most cases a strong correlation with those measured in the field. Three water quality parameters were selected in this study: dissolved oxygen, nitrates and Chl-a. The choice of these parameters is based on their importance in the eutrophication of fresh or coastal water [44,45]. The most visible phenomena are the appearance in spring and summer of the green tides in coastal marine water and the water in lakes and rivers. These manifestations correspond to an ecological imbalance linked to excessive inputs of phosphorus (including in the form of phosphate PO43-) and nitrogen (nitrate NO3-). In fact, these inputs lead to an explosion in the development of aquatic plants, which leads to an excessive local accumulation of biomass and is the cause of various undesirable effects such as impoverishment of biodiversity, visual and olfactory nuisance, inconvenience for bathing, difficulties in water treatment (drinking water), gas emissions and colonization by algae producing toxins such as certain Cyanophyceae.
Several estimation models have been developed based on the multiple stepwise regression analysis, while the choice of the suitable model was based on the largest compliance index (R2) and the smallest root mean square error (RMSE). The estimation of nitrate was done by applying the model that groups bands B1, B3 and B4 with the largest R2 and the smallest RMSE among all the extracted models (R2 = 0.62, RMSE = 0.16 mg/L). For the estimation of dissolved oxygen, the model chosen is the one that combines the two bands B2 and B3 (with R2 = 0.56 and RMSE = 0.65 mg/L). For Chl-a, the model chosen is the one that includes the bands B5, B6 and B8 (with R2 = 0.58 and RMSE= 0.07 µg/L).
The choice of the bands integrated into the model was made on the basis of a statistical study that was carried out between in situ measurements and satellite data. For chlorophyll a, a correlation was obtained between the in situ measurements of this parameter and band 5 of the Sentinel-2 sensor, which is located in the 704.1 nm spectral range. This result is in agreement with the results obtained by Toming [18], who used the peak reflectance between 700 and 720 nm for the estimation of this parameter. For nitrate, this study showed that the estimation of this parameter is very efficient when using the spectral interval from 442.7 to 664.6 nm (Table 4). For the estimation of the dissolved oxygen, the results show that the spectral interval of 492.4 to 559.8 nm is more appropriate (Table 4). Another work that was carried out by Vanhellemont and Ruddick [23] has shown that one of the main advantages of Sentinel-2 over Landsat-8 is the presence of the band B5 (704.1 nm) with a spatial resolution of 20 m to determine chlorophyll absorption. Eventually, these images will be useful for many aquatic water quality monitoring applications, and they can also be combined into a virtual constellation to improve temporal coverage.
In Morocco, satellite images have been widely used for modeling and spatiotemporal monitoring of several environmental phenomena, but the application of satellite images in spatiotemporal monitoring of lake water quality is still not well developed. The only study is the one carried out by Karaoui and his collaborators in 2019 [3], which aimed to map water quality parameters using Sentinel images. Indeed, the spectral interval from 559.8 to 740.5 nm for the mapping of Chl-a, the spectral interval from 832.8 to 1373.5 nm for dissolved oxygen and the spectral interval from 442.7 to 864.7 nm for nitrate had R2 indices of 0.78, 0.74 and 0.67, respectively. Therefore, our work involves a complementarity and a recognition of what has been done by these authors, obviously applying it with a different approach and in a different context, adding the aspect of spatiotemporal monitoring which allows for continuous survey throughout the year.
In addition, the results can contribute indirectly to the quantification of the impact of both the agriculture and the discharges in the upstream part of the reservoir. This system represents a very effective and economical solution for monitoring water quality and could be applied by hydraulic basin agencies under several restrictions to travel or other activities or in periods that require remote work (e.g., at the time of COVID-19). Ultimately, this approach is more efficient and not only can be used under similar conditions but also provides vital information on water quality parameters in a faster, more accurate and less computationally expensive way. As a perspective, a seasonal analysis is required to evaluate, calibrate and validate the models obtained in a temporal way.

5. Conclusions

In this study, a new method of combining high-resolution and field data was applied for the spatiotemporal mapping of certain surface water quality parameters, namely nitrate, dissolved oxygen and Chl-a in the Hassan Addakhil dam in southeastern Morocco. The field results show an excellent quality for most of the samples. In terms of the modeling approach, the models selected for the three parameters have shown a good correlation between the measured and estimated values with compliance index values of 0.62, 0.56 and 0.58 and root mean square error values of 0.16 mg/L, 0.65 mg/L and 0.07 µg/L for nitrate, dissolved oxygen and Chl-a, respectively. After the calibration, the validation and the selection of the models, the spatiotemporal variation of water quality was determined thanks to the multitemporal satellite data.
In summary, this research represents an efficient and useful solution for the hydraulic basin agency in charge of water resources management in the region. Indeed, it will help to minimize the costs of quality surveys carried out throughout the year. It can also contribute to decision-making regarding agricultural profitability and its relation with water quality, as well as to the development of strategies for efficient water resources management.

Author Contributions

Conceptualization, A.E.O., A.L., M.E.H. and A.R.; data curation, A.E.O. and F.E.H.; formal analysis, A.E.O., M.E.H. and A.R.; methodology, A.E.O., M.E.H. and A.R.; project administration, A.L. and A.E.; resources, A.E.O.; software, A.E.O., M.E.H. and A.R.; supervision, A.L. and A.E.; validation, A.E.O., M.E.H. and A.R.; visualization, A.E.O., M.E.H., S.L., G.R., D.S.P., A.M. and A.R.; writing—original draft, A.E.O. and A.R.; writing—review and editing, A.E.O., M.E.H., A.R., A.E., A.L., S.L., G.R., D.S.P. and A.M. All authors have read and agreed to the published version of the manuscript.

Funding

This research received no external funding.

Institutional Review Board Statement

Not Applicable.

Informed Consent Statement

Not Applicable.

Acknowledgments

The authors gratefully acknowledge the support of the staff of the Guir-Ziz-Rheris Hydraulic Basin Agency and Gaya Laboratory in Rabat for equipment and field mission assistance.

Conflicts of Interest

The authors declare that they have no conflict of interest.

References

  1. Haut-Commissariat au Plan. Prospective Maroc 2030—Eveil aux problématiques du Maroc 2030—Rapport; Haut-Commissariat au Plan: Casablanca, Morocco, 2007.
  2. Brönmark, C.; Hansson, L.A. Environmental issues in lakes and ponds: Current state and perspectives. Environ. Conserv. 2002, 29, 290–307. [Google Scholar] [CrossRef] [Green Version]
  3. Karaoui, I.; Abdelghani, B.; Arioua, A.; Hssaisoune, M.; Sabri, E.M.; Ait Ouhamchich, K.; Elhamdouni, D.; El Amrani, I.; Nouaim, W. Evaluating the potential of Sentinel-2 satellite images for water quality characterization of artificial reservoirs: The Bin El Ouidane Reservoir case study (Morocco). Meteorol. Hydrol. Water Manag. 2019, 7, 31–39. [Google Scholar] [CrossRef]
  4. Tranvik, L.J.; Downing, J.A.; Cotner, J.B.; Loiselle, S.A.; Striegl, R.G.; Ballatore, T.J.; Dillon, P.; Knoll, L.B.; Kutser, T.; Larsen, S.; et al. Lakes and reservoirs as regulators of carbon cycling and climate. Limn. Oceanogr. 2009, 56, 2298–2314. [Google Scholar] [CrossRef] [Green Version]
  5. Moss, T. Spatial fit, from panacea to practice: Implementing the EU Water Framework Directive. Ecol. Soc. 2012, 17, 1–12. [Google Scholar] [CrossRef] [Green Version]
  6. El Hafyani, M.; Essahlaoui, A.; Van Rompaey, A.; Mohajane, M.; El Hmaidi, A.; El Ouali, A.; Moudden, F.; Serrhini, N.-E. Assessing Regional Scale Water Balances through Remote Sensing Techniques: A Case Study of Boufakrane River Watershed, Meknes Region, Morocco. Water 2020, 12, 320. [Google Scholar] [CrossRef] [Green Version]
  7. Driouech, F.; Déqué, M.; Sánchez-Gómez, E. Weather Regimes-Moroccan Precipitation Link in a Regional Climate Change Simulation. Glob. Planet. Chang. 2010, 72, 1–10. [Google Scholar] [CrossRef]
  8. El Moçayd, N.; Kang, S.; Eltahir, E.A.B. Climate Change impacts on the Water Highway project in Morocco. Hydrol. Earth Syst. Sci. Discuss. 2019, 24, 1467–1483. [Google Scholar] [CrossRef] [Green Version]
  9. Ouatiki, H.; Boudhar, A.; Tramblay, Y.; Jarlan, L.; Benabdelouhab, T.; Hanich, L.; El Meslouhi, M.R.; Chehbouni, A. Evaluation of TRMM 3B42 V7 Rainfall Product over the Oum Er Rbia Watershed in Morocco. Climate 2017, 5, 1. [Google Scholar] [CrossRef]
  10. Philipson, P.; Kratzer, S.; Ben Mustapha, S.; Strombeck, N.; Stelzer, K. Satellite-based water quality monitoring in Lake Vanern, Sweden. Int. J. Remote Sens. 2016, 37, 3938–3960. [Google Scholar] [CrossRef] [Green Version]
  11. Krtolica, I.; Cvijanović, D.; Obradović, Đ.; Novković, M.; Milošević, D.; Savić, D.; Vojinović-Miloradov, M.; Radulović, S. Water quality and macrophytes in the Danube River: Artificial neural network modelling. Ecol. Indic. 2021, 121, 107076. [Google Scholar] [CrossRef]
  12. Liarico, A.J.M.; Dávila, V.O.R.; Tapia, Á.M.F.; Valdivia, J.Q.; Medina, S.A.Z. Bioenergetic and water quality modeling for eutrophication assessment of El Pañe Reservoir, Peru. Ecohyd. Hydrobiol. 2021, 21, 114–128. [Google Scholar] [CrossRef]
  13. Basnyat, P.; Teeter, L.D.; Lockaby, B.G.; Flynn, K.M. The use of remote sensing and GIS in watershed level analyses of non-point source pollution problems. For. Ecol. Manag. 2000, 128, 65–73. [Google Scholar] [CrossRef]
  14. Oseke, F.I.; Anornu, G.K.; Adjei, K.A.; Eduvie, M.O. Assessment of water quality using GIS techniques and water quality index in reservoirs affected by water diversion. Water-Energy Nexus 2021, 4, 25–34. [Google Scholar] [CrossRef]
  15. Pierson, D.C.; Strömbeck, N. A modelling approach to evaluate preliminary remote sensing algorithms: Use of water quality data from Swedish Great Lakes. Geophysica 2000, 36, 177–202. [Google Scholar]
  16. Wang, X.; Ma, T. Application of remote sensing techniques in monitoring and assessing the water quality of Taihu Lake. Bull. Environ. Contam. Toxicol. 2001, 67, 863–870. [Google Scholar] [CrossRef]
  17. Yang, M.; Merry, C.J.; Sykes, R.M. Integration of water quality modeling, remote sensing, and GIS. J. Am. Water Resour. Assoc. 1999, 35, 253–263. [Google Scholar] [CrossRef]
  18. Toming, K.; Kutser, T.; Laas, A.; Sepp, M.; Paavel, B.; Nõges, T. First Experiences in Mapping Lake Water Quality Parameters with Sentinel-2 MSI Imagery. Remote Sens. 2016, 8, 640. [Google Scholar] [CrossRef] [Green Version]
  19. Olmanson, L.G.; Bauer, M.E.; Brezonik, P.L. A 20-year Landsat water clarity census of Minnesota’s 10,000 lakes. Remote Sens. Environ. 2008, 112, 4086–4097. [Google Scholar] [CrossRef]
  20. Palmer, S.C.J.; Kutser, T.; Hunter, P.D. Remote sensing of inland waters: Challenges, progress and future directions. Remote Sens. Environ. 2015, 157, 1–8. [Google Scholar] [CrossRef] [Green Version]
  21. Brezonik, P.; Menken, K.D.; Bauer, M. Landsat-based remote sensing of lake water quality characteristics, including chlorophyll and colored dissolved organic matter (CDOM). Lake Reserv. Manag. 2005, 21, 373–382. [Google Scholar] [CrossRef]
  22. Kallio, K.; Kutser, T.; Hannonen, T.; Koponen, S.; Pulliainen, J.; Vepsälainen, J.; Pyhälahti, T. Retrieval of water quality from airborne imaging spectrometry of various lake types in different seasons. Sci. Total Environ. 2001, 268, 59–77. [Google Scholar] [CrossRef]
  23. Vanhellemont, Q.; Ruddick, K. Acolite for Sentinel-2: Aquatic applications of MSI imagery. In Proceedings of the ESA Living Planet Symposium, Prague, Czech Republic, 9–13 May 2016; pp. 9–13. [Google Scholar]
  24. Ansper, A.; Alikas, K. Retrieval of Chlorophyll a from Sentinel-2 MSI Data for the European Union Water Framework Directive Reporting Purposes. Remote Sens. 2019, 11, 64. [Google Scholar] [CrossRef] [Green Version]
  25. Brezonik, P.; Olmanson, L.G.; Finlay, J.C.; Bauer, M. Factors affecting the measurement of CDOM by remote sensing of optically complex inland waters. Remote Sens. Environ. 2015, 157, 199–215. [Google Scholar] [CrossRef]
  26. Toming, K.; Kutser, T.; Uiboupin, R.; Arikas, A.; Vahter, K.; Paavel, B. Mapping Water Quality Parameters with Sentinel-3 Ocean and Land Colour Instrument imagery in the Baltic Sea. Remote Sens. 2017, 9, 1070. [Google Scholar] [CrossRef] [Green Version]
  27. Soomets, T.; Uudeberg, K.; Jakovels, D.; Brauns, A.; Zagars, M.; Kutser, T. Validation and Comparison of Water Quality Products in Baltic Lakes Using Sentinel-2 MSI and Sentinel-3 OLCI Data. Sensors 2020, 20, 742. [Google Scholar] [CrossRef] [Green Version]
  28. Hansen, C.H.; Burian, S.J.; Dennison, P.E.; Williams, G.P. Spatiotemporal Variability of Lake Water Quality in the Context of Remote Sensing Models. Remote Sens. 2017, 9, 409. [Google Scholar] [CrossRef] [Green Version]
  29. Ritchie, J.C.; Zimba, P.V.; Everitt, J.H. Remote sensing techniques to assess water quality. Photogrammetric engineering & remote sensing. Photogramm. Eng. Remote Sens. 2003, 69, 695–704. [Google Scholar]
  30. Gholizadeh, M.H.; Melesse, A.M.; Reddi, L. A Comprehensive Review on Water Quality Parameters Estimation Using Remote Sensing Techniques. Sensors 2016, 16, 1298. [Google Scholar] [CrossRef] [Green Version]
  31. Kallio, K.; Attila, J.; Härmä, P.; Koponen, S.; Pulliainen, J.; Hyytiäinen, U.M.; Pyhälahti, T. Landsat ETM+ images in the estimation of seasonal lake water quality in boreal river basins. Environ. Manag. 2008, 42, 511–522. [Google Scholar] [CrossRef]
  32. Verpoorter, C.; Kutser, T.; Seekel, D.; Tranvik, L.J. A global inventory of lakes based on high-resolution satellite imagery. Geophys. Res. Lett. 2014, 41, 639–642. [Google Scholar] [CrossRef]
  33. Saberioon, M.; Brom, J.; Nedbal, V.; Soucek, P.; Cisar, P. Chlorophyll-a and total suspended solids retrieval and mapping using Sentinel-2A and machine learning for inland waters. Ecol. Indic. 2020, 113, 106236. [Google Scholar] [CrossRef]
  34. El Hafyani, M.; Essahlaoui, A.; Teodoro, A.C.; Mohajane, M. Modeling and mapping of soil salinity in Tafilalet plain (Morocco). Arab. J. Geosci. 2019, 12, 35. [Google Scholar] [CrossRef]
  35. El Ouali, A.; Mudry, J.; Mania, J.; Chauve, P.; Elyamine, N.; Marzouk, M. Present recharge of an aquifer in a semi-arid region: An example from the Turonian limestones of the Errachidia basin, Morocco. Environ. Geol. 1999, 38, 171–176. [Google Scholar] [CrossRef]
  36. Nouayti, N.; Khattach, D.; Hilali, M. Cartographie des zones potentielles pour le stockage des eaux souterraines dans le haut bassin du Ziz (Maroc): Apport de la télédétection et du système d’information géographique. Bull. Inst. Sci. Rabat Sect. Sci. Terre 2017, 39, 45–57. [Google Scholar]
  37. Muzirafuti, A.; Boualoul, M.; Barreca, G.; Allaoui, A.; Bouikbane, H.; Lanza, S.; Crupi, A.; Randazzo, G. Fusion of Remote Sensing and Applied Geophysics for Sinkholes Identification in Tabular Middle Atlas of Morocco (the Causse of El Hajeb): Impact on the Protection of Water Resource. Resources 2020, 9, 51. [Google Scholar] [CrossRef]
  38. El-Ouardi, H.; Boualoul, M.; Ouhaddach, H.; Habib, M.; Muzarafuti, A.; Allaoui, A.; Amine, A. Fault analysis and its relationship with karst structures affecting lower Jurassic limestone in the Agourai plateau (Middle Atlas, Morocco). Geogaceta 2018, 63, 119–122. [Google Scholar]
  39. Muzirafuti, A.; Boualoul, M.; Randazzo, G.; Lanza, S.; Allaoui, A.; El Ouardi, H.; Habibi, M.; Ouhaddach, H. The use of remote sensing for water protection in the karst environment of the Tabular Middle Atlas/the cause of El Hajeb/Morocco. In Earth Observation Advancements in a Changing World; AIT Series, Trends in Earth Observation; Chirici, G., Gianinetto, M., Eds.; Italian Society of Remote Sensing: Firenze, Italy, 2019. [Google Scholar]
  40. Lehner, B.; Liermann, C.R.; Revenga, C.; Vörösmarty, C.; Fekete, B.; Crouzet, P.; Döll, P.; Endejan, M.; Frenken, K.; Magome, J.; et al. High-resolution mapping of the world’s reservoirs and dams for sustainable river-flow management. Front. Ecol. Environ. 2011, 9, 494–502. [Google Scholar] [CrossRef] [Green Version]
  41. Dahir n°1-16-113 du 6 Kaada 1437 Portant Promulgation de la loi n°36-15 Relative à l’eau. Available online: http://www.sgg.gov.ma/Portals/0/lois/Loi_36-15_Fr.pdf?ver=2018-11-28-153115-853 (accessed on 24 September 2021).
  42. Congedo, L. Semi-Automatic Classification Plugin Documentation. Available online: http://rgdoi.net/10.13140/RG.2.2.25480.65286/1 (accessed on 1 October 2021).
  43. Chavez, P.S., Jr. An Improved Dark-Object Subtraction Technique for Atmospheric Scattering Correction of Multispectral Data. Remote Sens. Environ. 1988, 24, 459–479. [Google Scholar] [CrossRef]
  44. Schalles, J.F.; Gitelson, A.A.; Yacobi, Y.Z.; Kroenke, A.E. Estimation of Chlorophyll a from time series measurements of high spectral resolution reflectance in an eutrophic lake. J. Phycol. 1998, 34, 383–390. [Google Scholar] [CrossRef]
  45. Honeywill, C.; Paterson, D.N.; Hagerthey, S.E. Determination of microphytobenthic biomass using pulse-amplitude modulated minimum fluorescence. Eur. J. Phycol. 2002, 37, 485–492. [Google Scholar] [CrossRef]
Figure 1. In situ measurement and monitoring of the Hassan Addakhil dam with (a) fieldwork data collection equipment and (b) laboratory data analysis.
Applsci 11 09297 g001
Figure 2. Location of study area and sampling points.
Applsci 11 09297 g002
Figure 3. Correlation between volume of rainfall and dam’s contributions.
Applsci 11 09297 g003
Figure 4. Flowchart of the methodology used.
Applsci 11 09297 g004
Figure 5. Water quality parameters measured versus estimated through the models (best models’ performance).
Applsci 11 09297 g005
Figure 6. Obtained maps of dissolved oxygen using best model.
Applsci 11 09297 g006
Figure 7. Obtained maps of nitrate using best model.
Applsci 11 09297 g007
Figure 8. Obtained maps of Chl-a using best model.
Applsci 11 09297 g008
Table 1. On-ground data sample characterizations.
Sampling Data IDDissolved Oxygen
(mg/L)
Nitrates
(mg/L)
Chl-a (µg/L)Sampling Data IDDissolved Oxygen
(mg/L)
Nitrates
(mg/L)
Chl-a (µg/L)
017.41.820.55117.51.570.47
0291.570.771291.560.55
037.61.560.51139.11.60.69
048.21.650.611491.820.57
057.91.310.48158.61.540.64
065.81.450.77169.71.780.52
078.11.50.54177.41.740.72
087.41.420.60187.51.960.68
097.41.60.49197.21.710.77
107.20.80.53208.91.850.55
Table 2. Sentinel-2 satellite image characteristics.
Sentinel-2 BandsWavelength (nm)Spatial Resolution (m)
Coastal Aerosol442.760
Blue492.410
Green559.810
Red664.610
Vegetation red edge704.120
Vegetation red edge740.520
Vegetation red edge782.820
NIR832.810
Narrow NIR864.720
Water vapor945.160
SWIR-Cirrus1373.560
SWIR1613.720
SWIR2202.420
Table 3. Sentinel-2 satellite image acquisition dates.
ImageAcquisition Dates
128 April 2020
23 May 2020
36 June 2020
47 July 2020
56 August 2020
620 September 2020
728 October 2020
819 November 2020
919 December 2020
1013 January 2021
1117 February 2021
1214 March 2021
Table 4. Correlation between satellite bands and water quality parameters.
B1B2B3B4B5B6B8
Chl-a----0.810.710.73
Nitrates0.73-0.690.73---
Dissolved Oxygen-0.710.75----
Table 5. Statistical parameters of the best performance models.
Model EquationsRMSE R2p-Value
Nitrate0.00372 × B01 − 3.050.19 (mg/L)0.390.0030
0.00895 × B03 + 0.310.24 (mg/L)0.060.2945
0.00114 × B04 + 0.6300.19 (mg/L)0.390.0031
0.00372 × B01 − (3.056 × 10⁻⁷) × B03 − 3.05930.20 (mg/L)0.390.0140
0.00273 × B01 + 0.00084 × B04 − 2.532640.17 (mg/L)0.580.0067
0.000412 × B03 + 0.00125 × B04 + 1.12730.20 (mg/L)0.400.0127
0.003099 × B01 − 0.000944 × B03 +0.0010509 × B04 − 1.810.16(mg/L)0.620.0011
Dissolved Oxygen0.0128 × B02 - 8.3240.75 (mg/L)0.300.0040
0.0102 × B03 - 6.7040.63 (mg/L)0.550.0001
0.00075 × B02 + 0.00989 × B03 − 7.090.65(mg/L)0.560.0009
Chl-a0.0007071 × B05 + 0.1840.07 (µg/L)0.410.0022
0.0010213 × B06 + 0.30660.08 (µg/L)0.370.0042
0.002332 × B08 − 0.156550.07 (µg/L)0.450.0011
0.0004766 × B05 + 0.000591 × B06 + 0.1449030.07 (µg/L)0.490.0029
0.000423 × B05 + 0.001572 × B08 − 0.15890.07 (µg/L)0.550.0010
0.000574 × B06 + 0.00167 × B08 − 0.10760.07 (µg/L)0.530.0015
0.0003214 × B05 + 0.000378 × B06 + 0.0013207 × B08 − 0.1260.07(µg/L)0.580.0024
Publisher’s Note: MDPI stays neutral with regard to jurisdictional claims in published maps and institutional affiliations.

