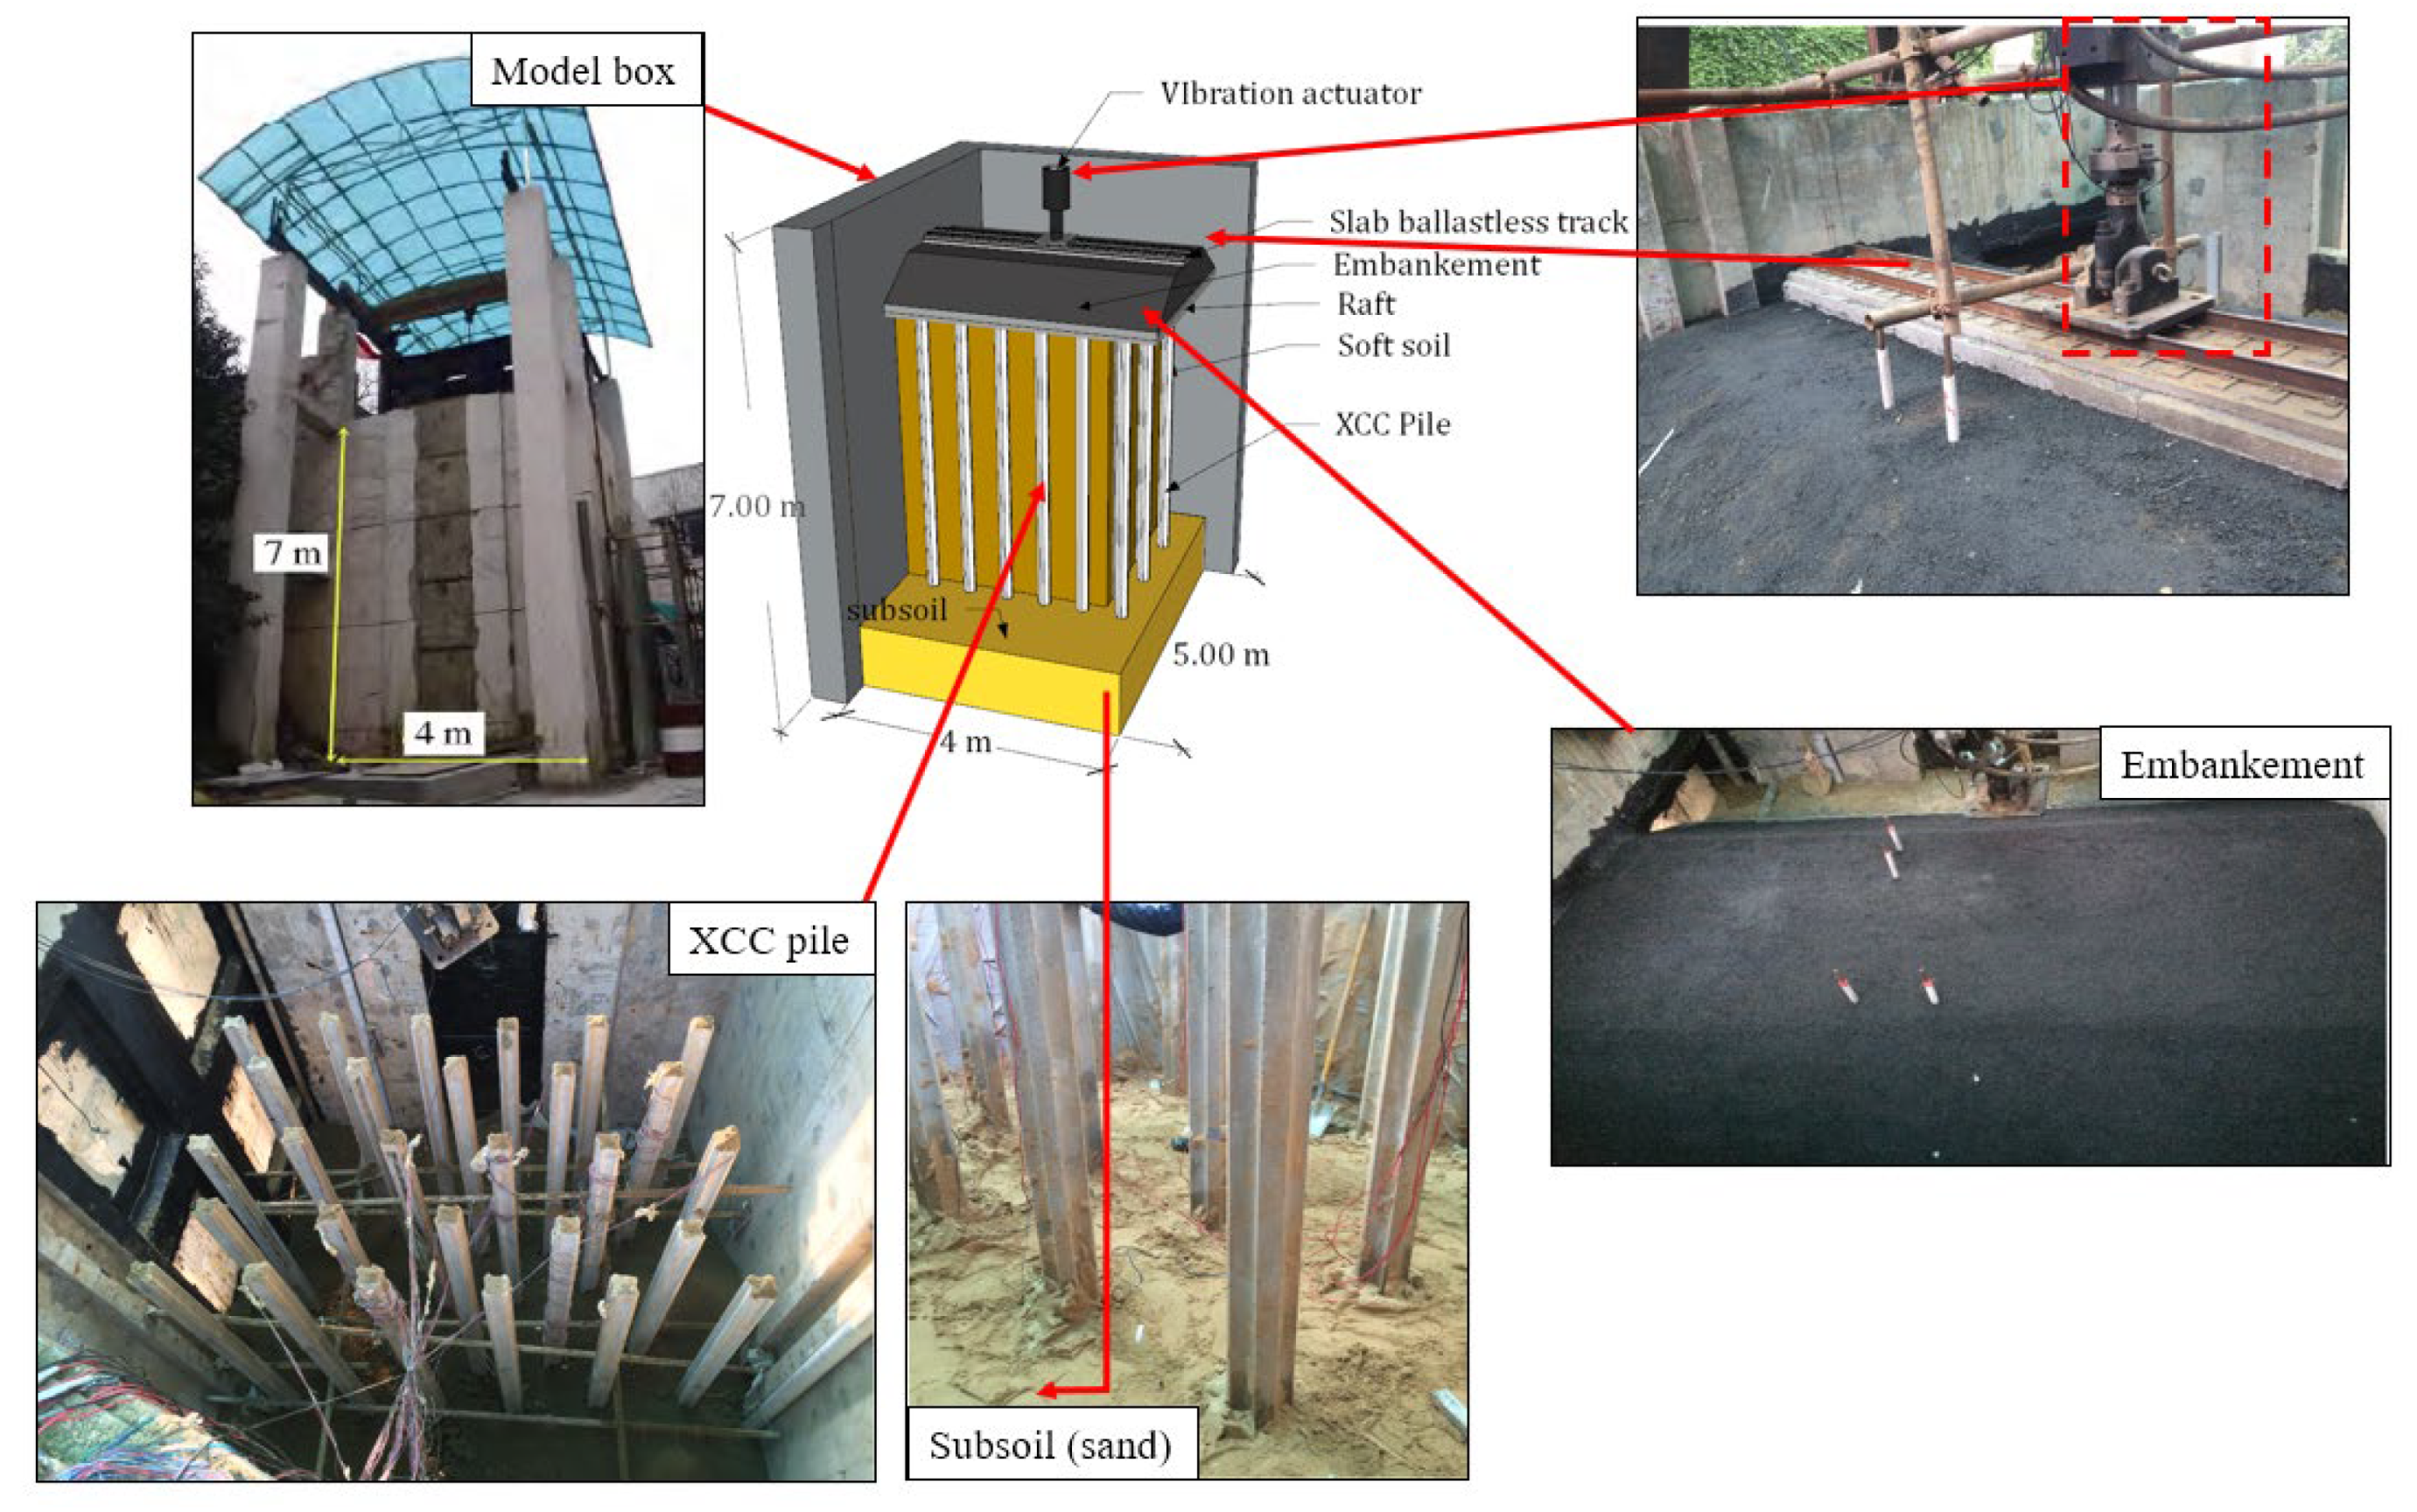
Figure 1.
Physical model of ballastless track embankment and XCC pile–raft foundation.
Figure 1.
Physical model of ballastless track embankment and XCC pile–raft foundation.
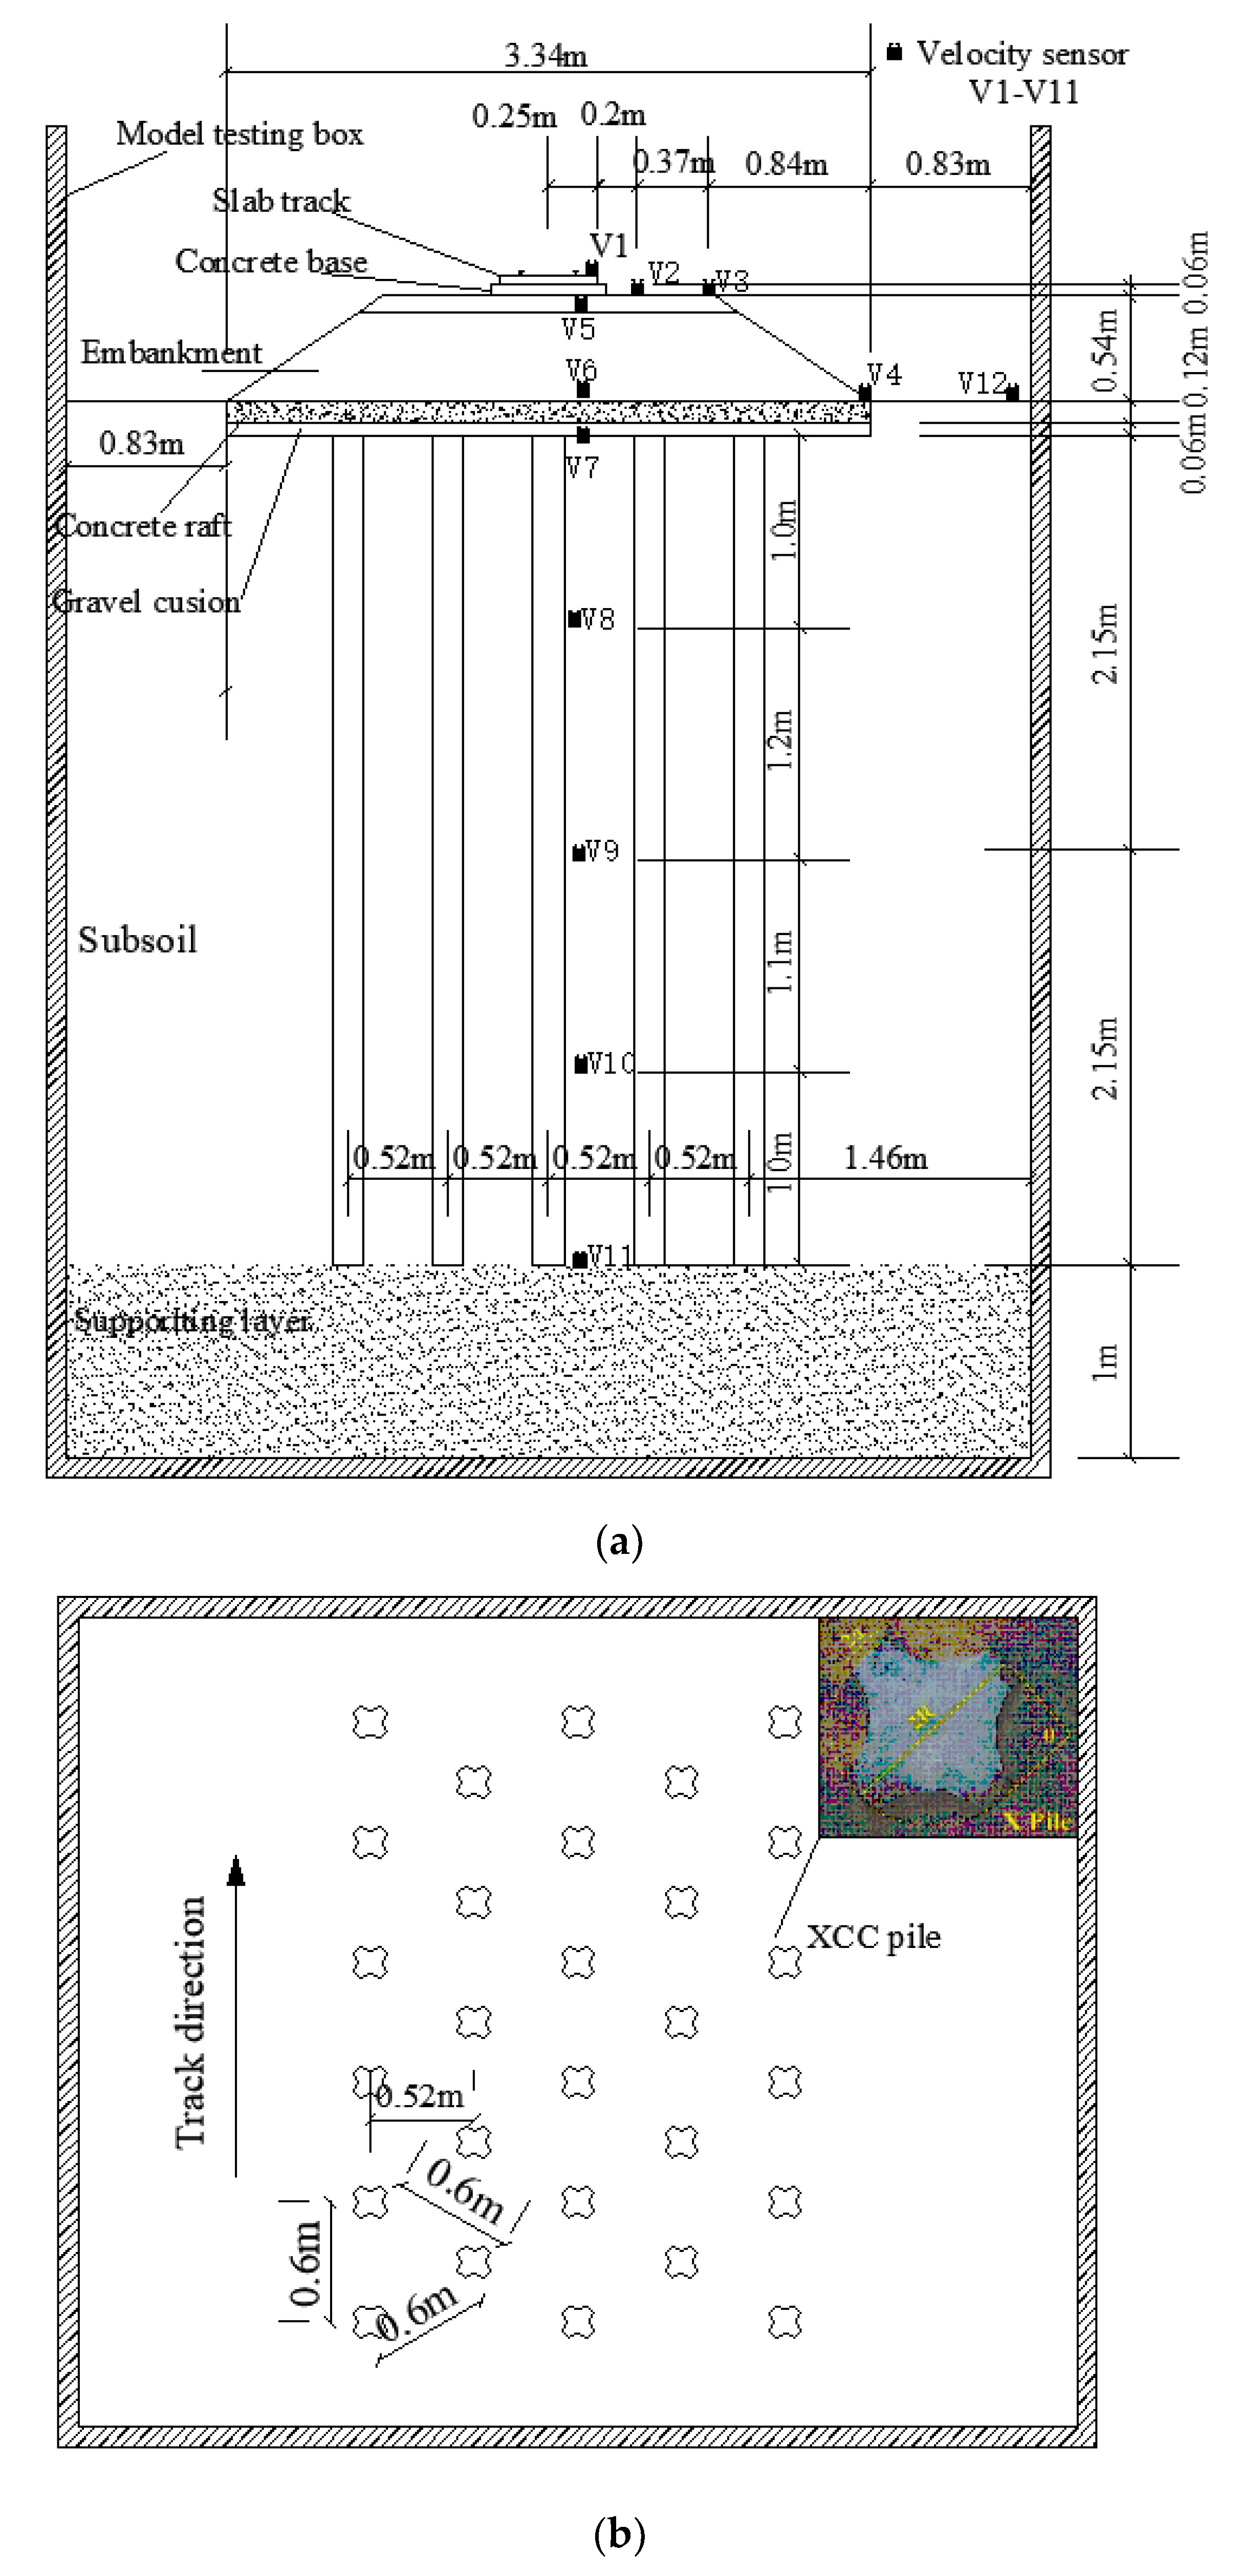
Figure 2.
Geometry and instrument layout of the physical model test. (a) cross-sectional view, (b) plane view.
Figure 2.
Geometry and instrument layout of the physical model test. (a) cross-sectional view, (b) plane view.
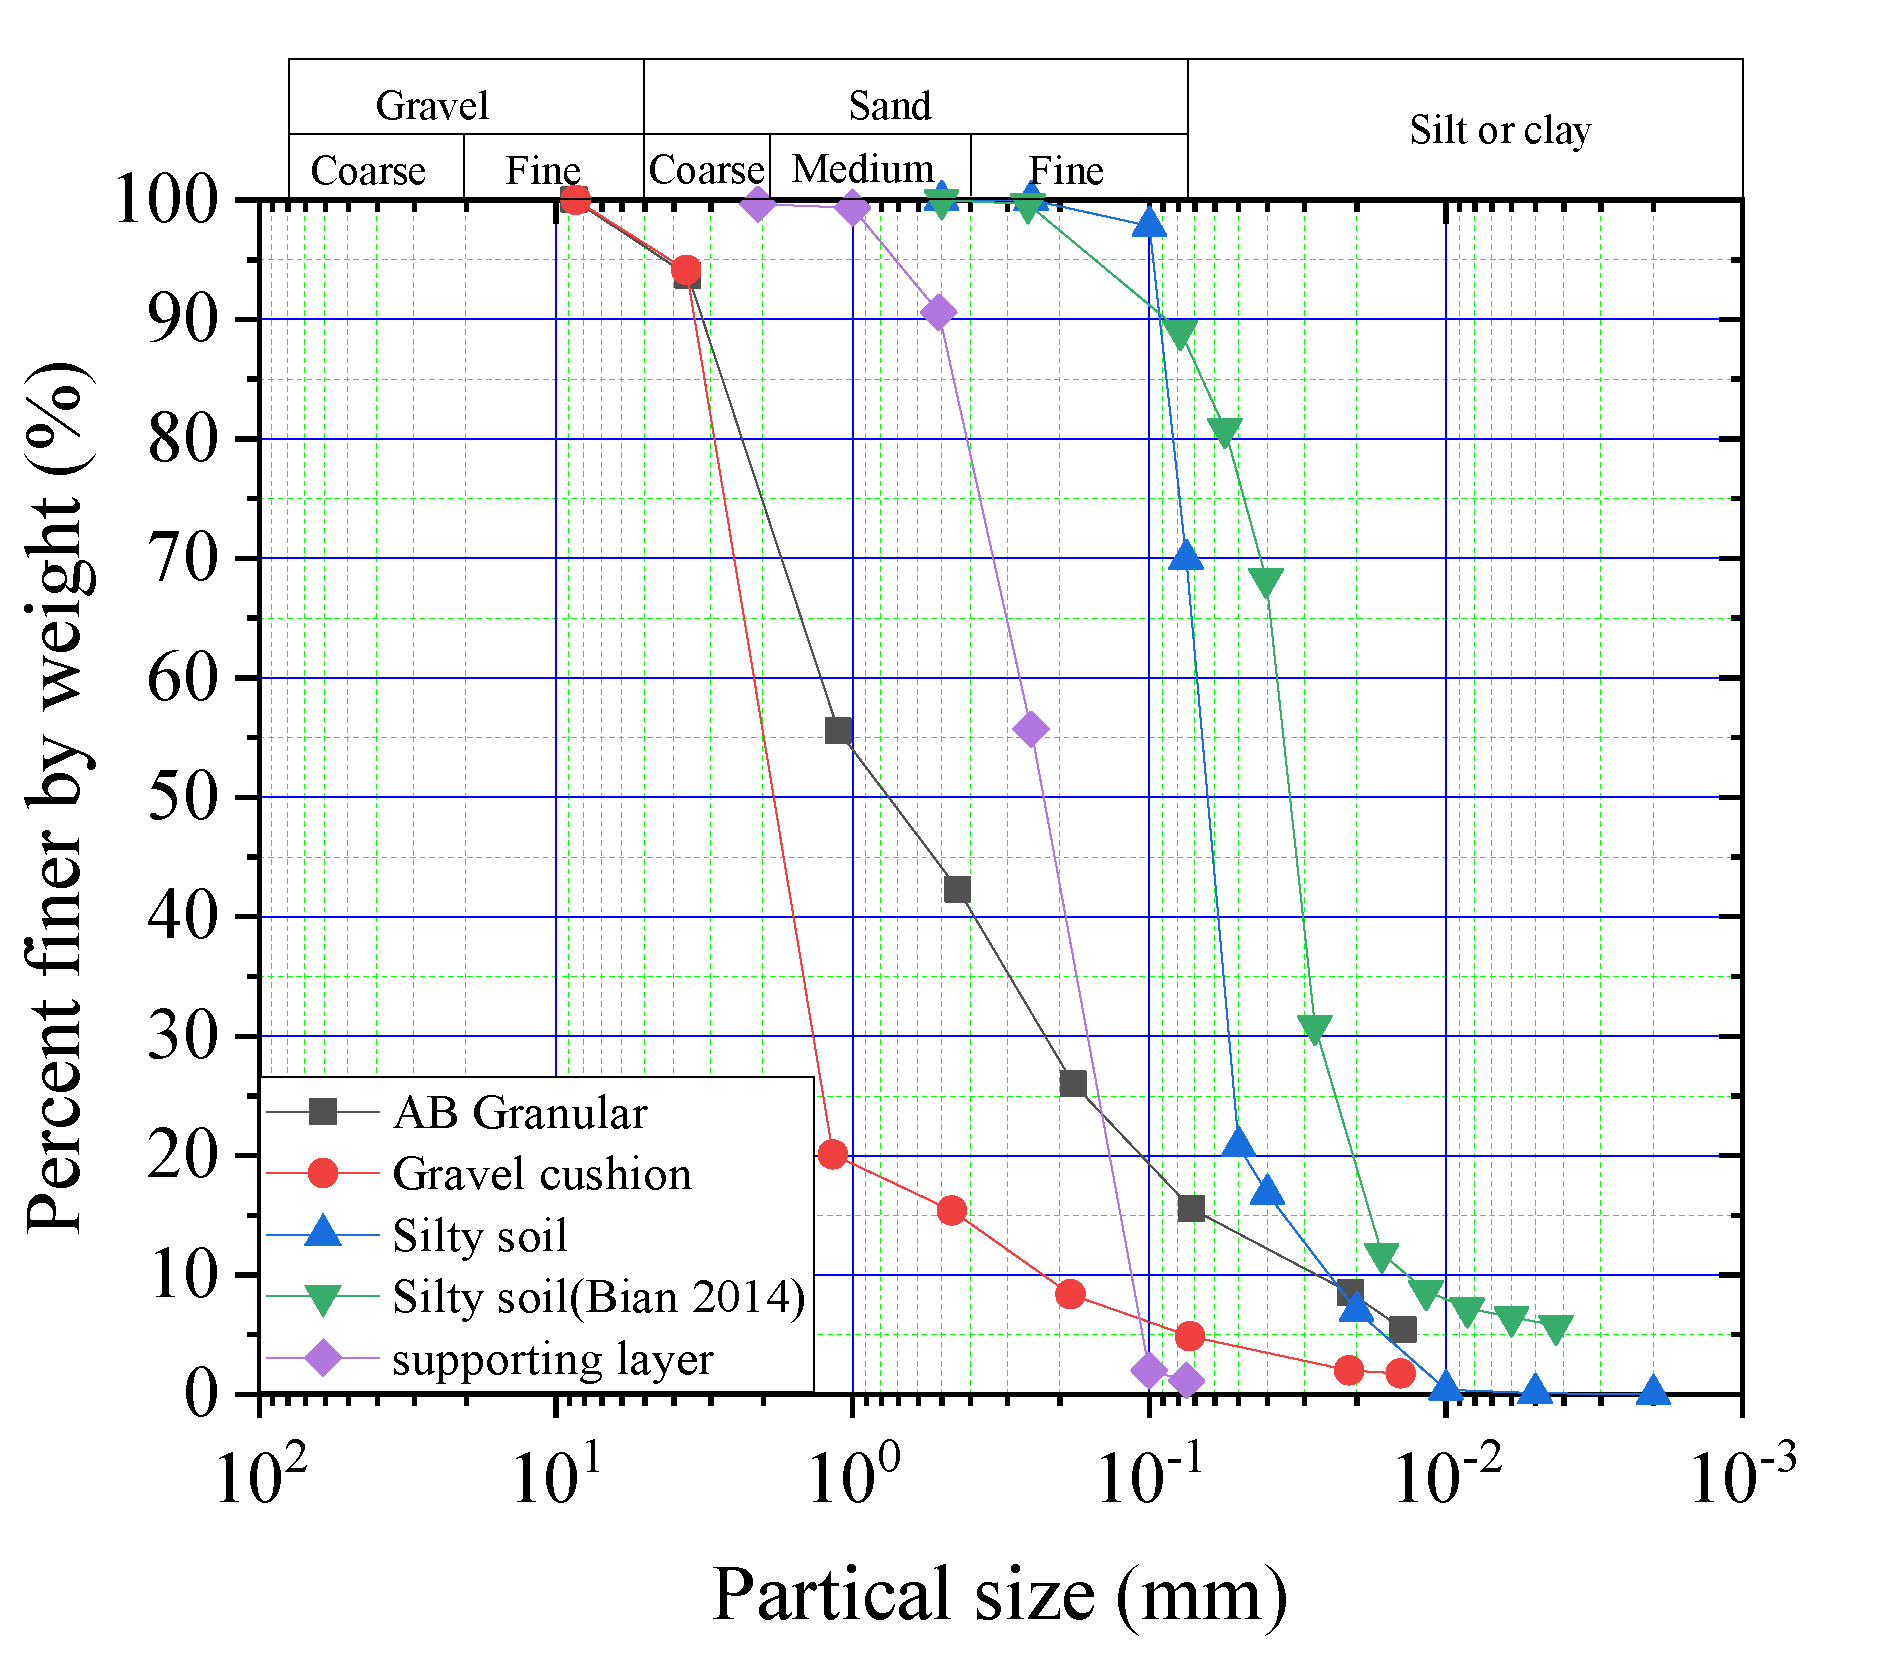
Figure 3.
Grain-size distributions of geomaterials in ballastless railways.
Figure 3.
Grain-size distributions of geomaterials in ballastless railways.
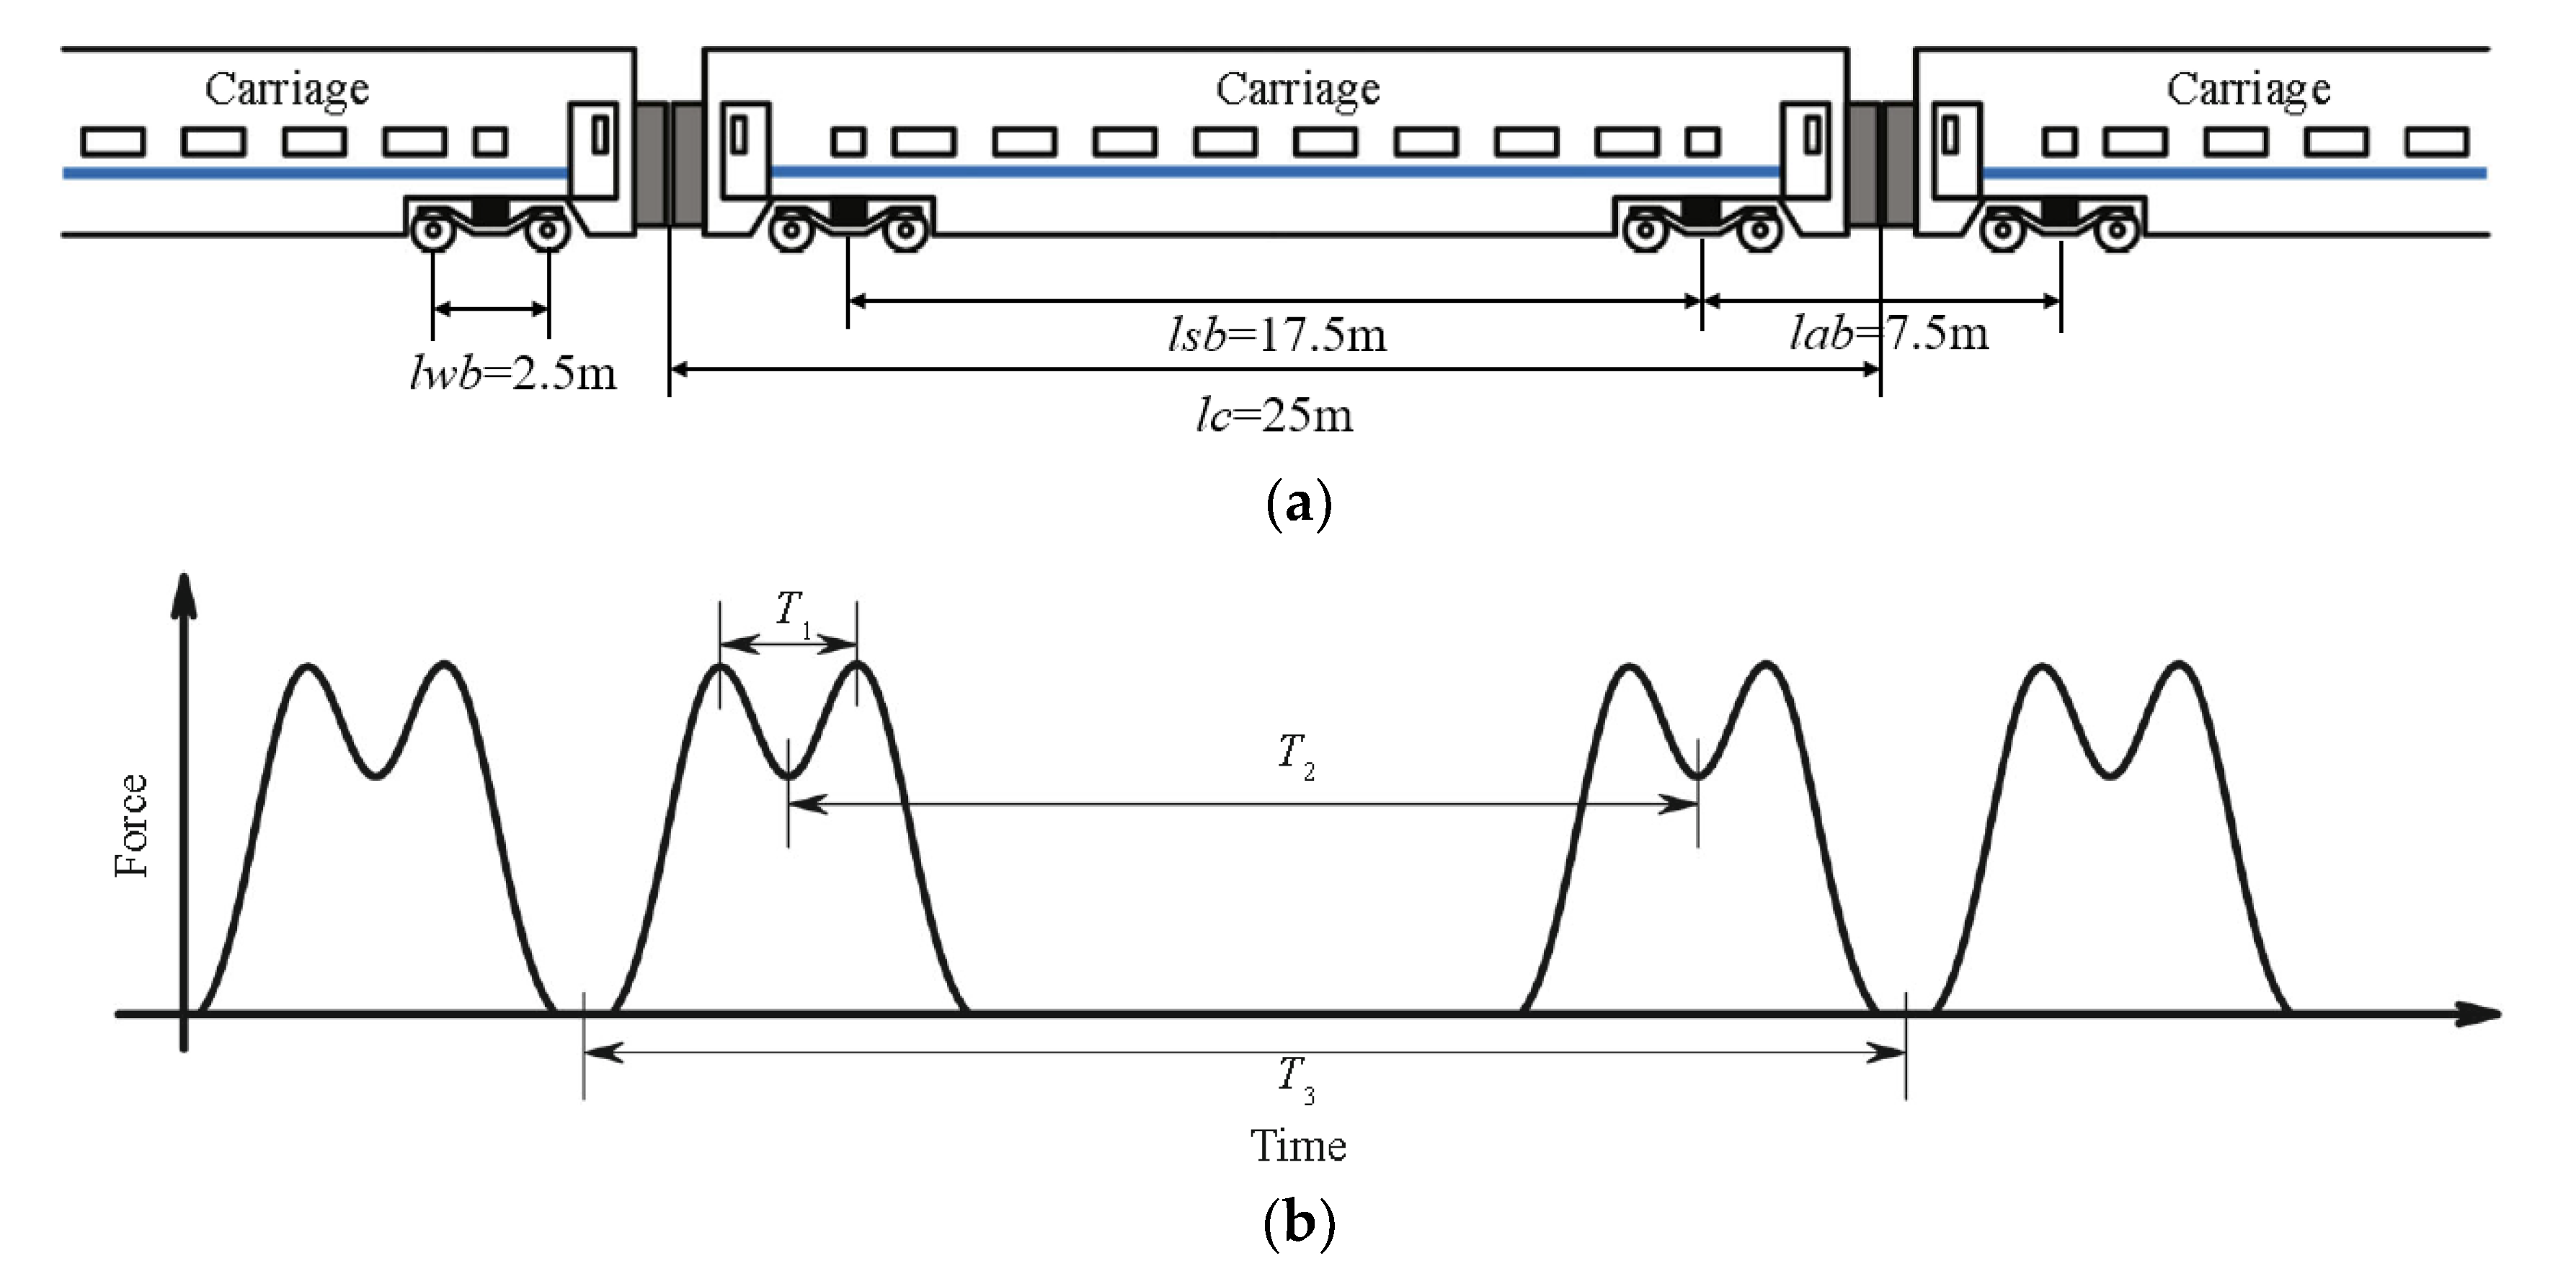
Figure 4.
Geometry configuration of the high-speed trains and M-shaped wave. (a) Geometry configuration of the high-speed trains, (b) M-shaped wave.
Figure 4.
Geometry configuration of the high-speed trains and M-shaped wave. (a) Geometry configuration of the high-speed trains, (b) M-shaped wave.
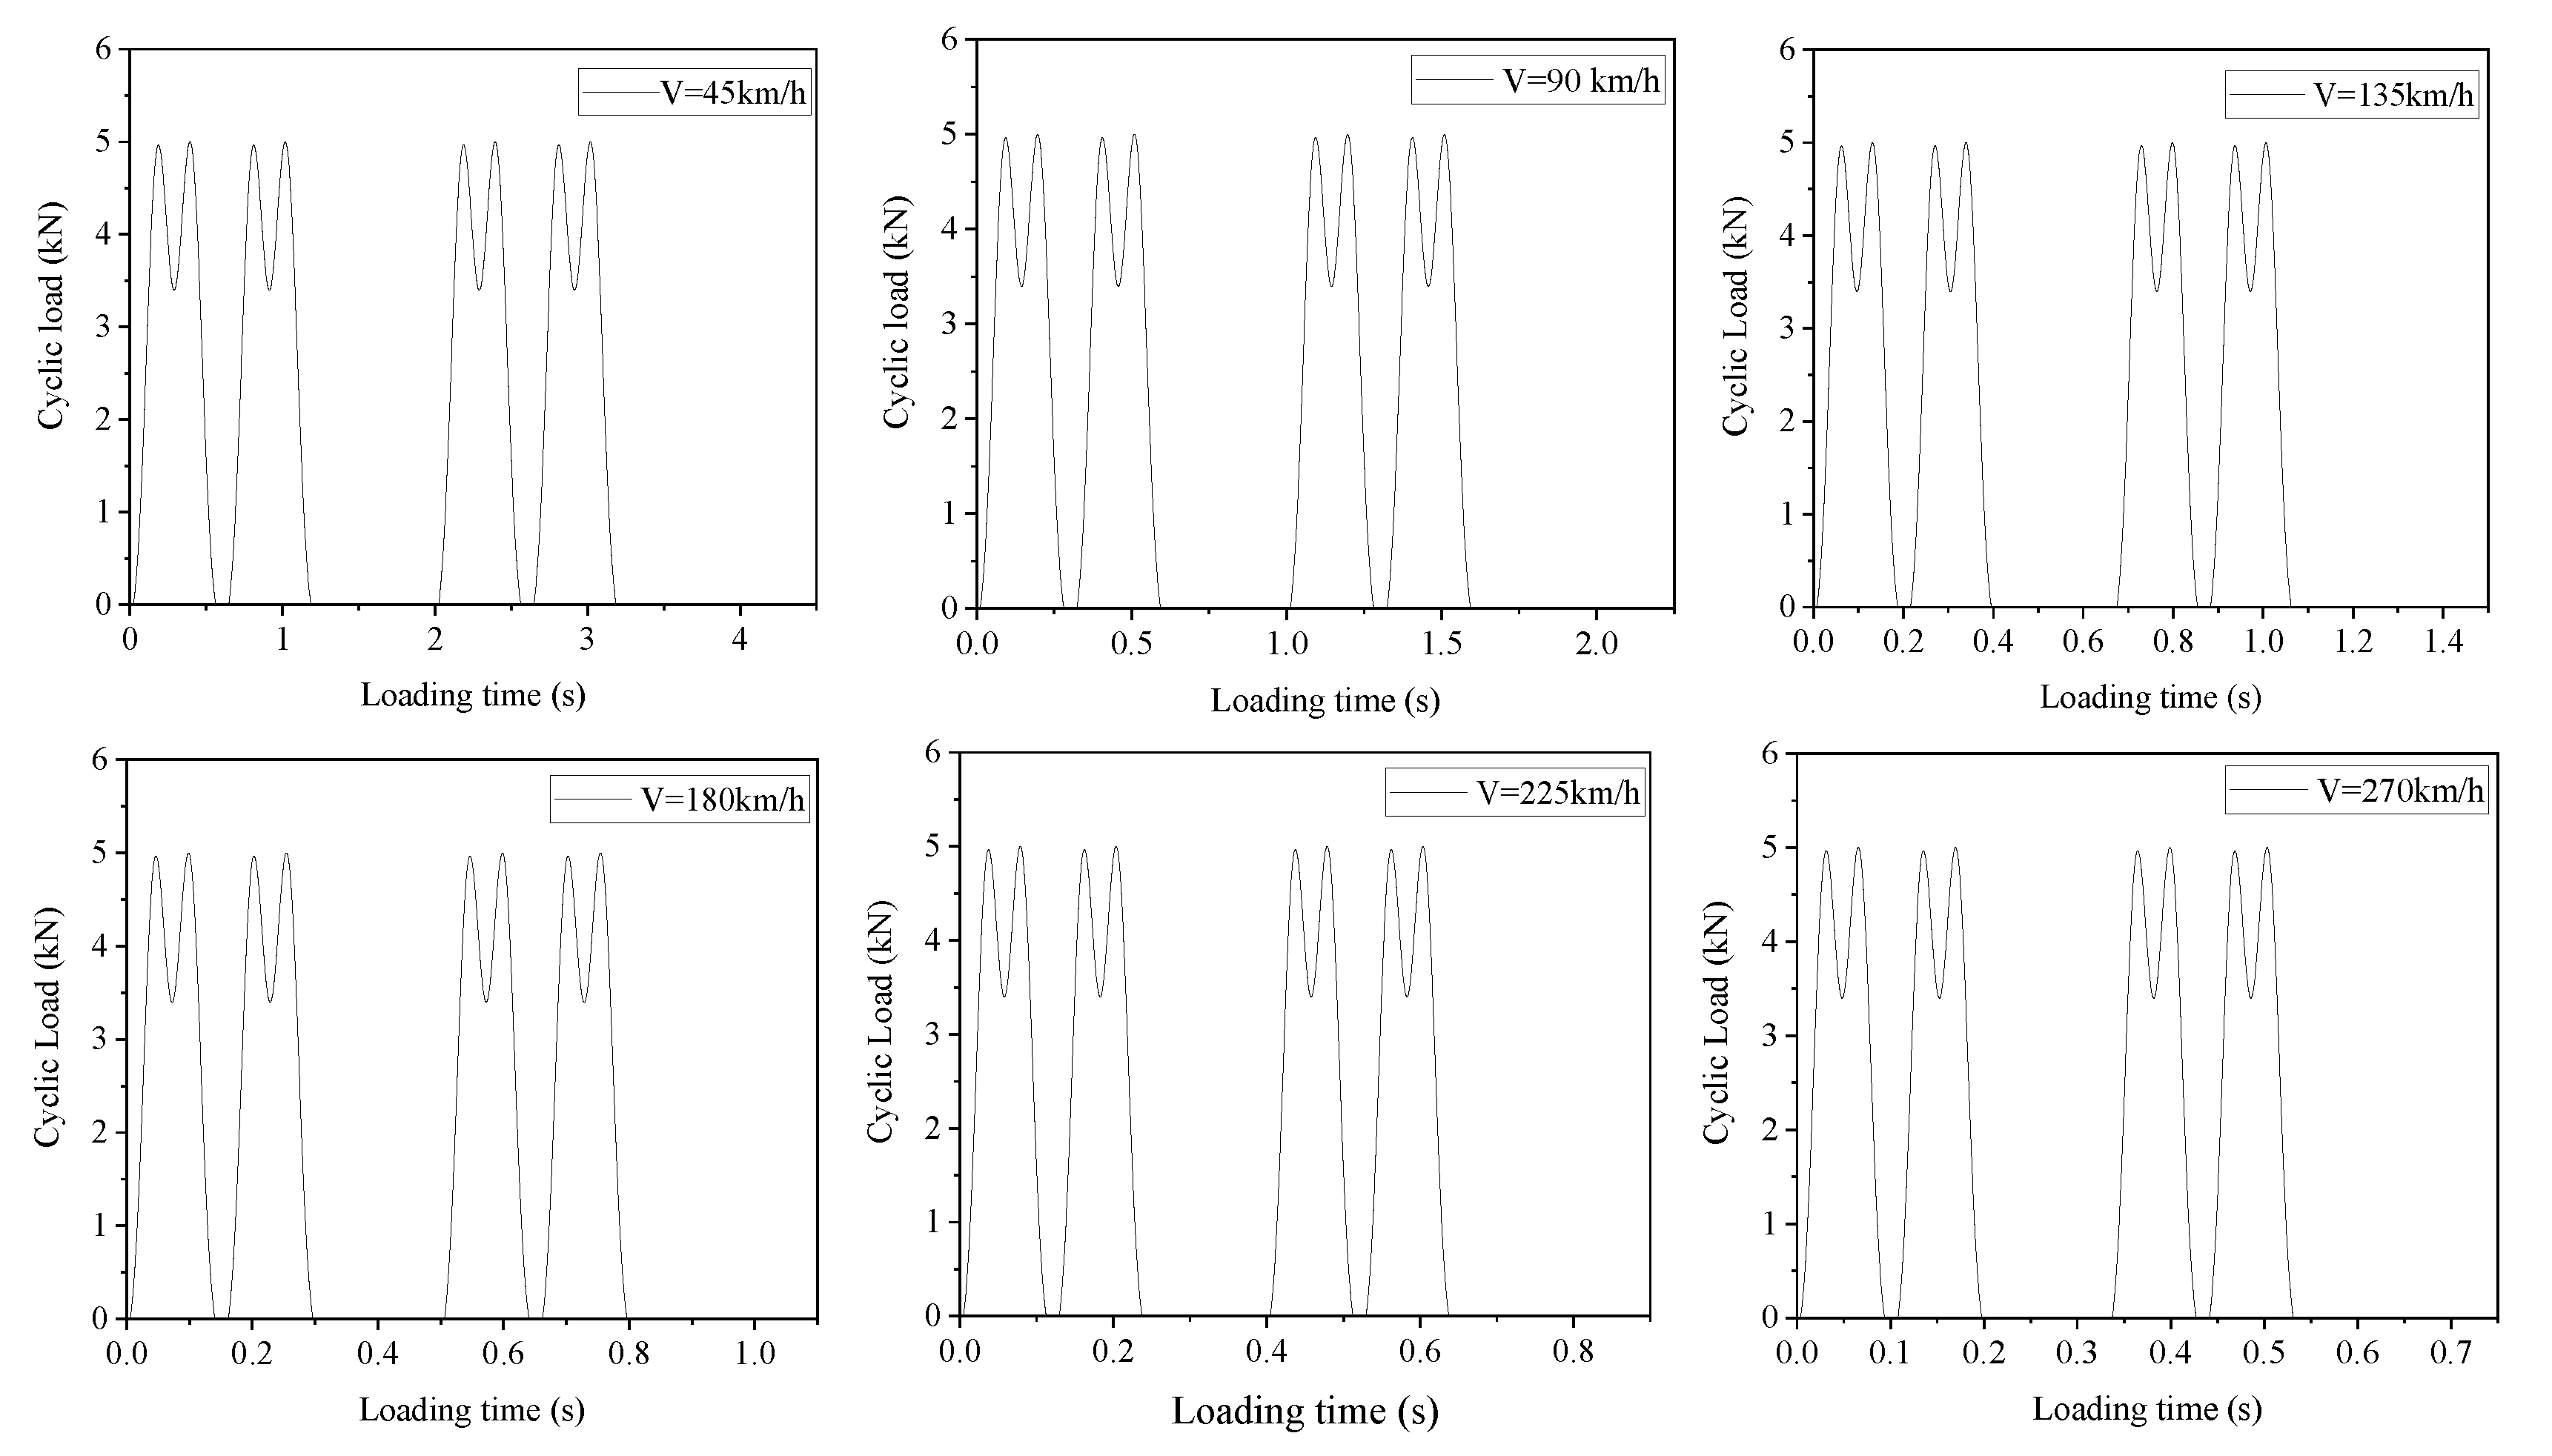
Figure 5.
Actuator loading time–history curves at a reduced scale for different train speeds.
Figure 5.
Actuator loading time–history curves at a reduced scale for different train speeds.
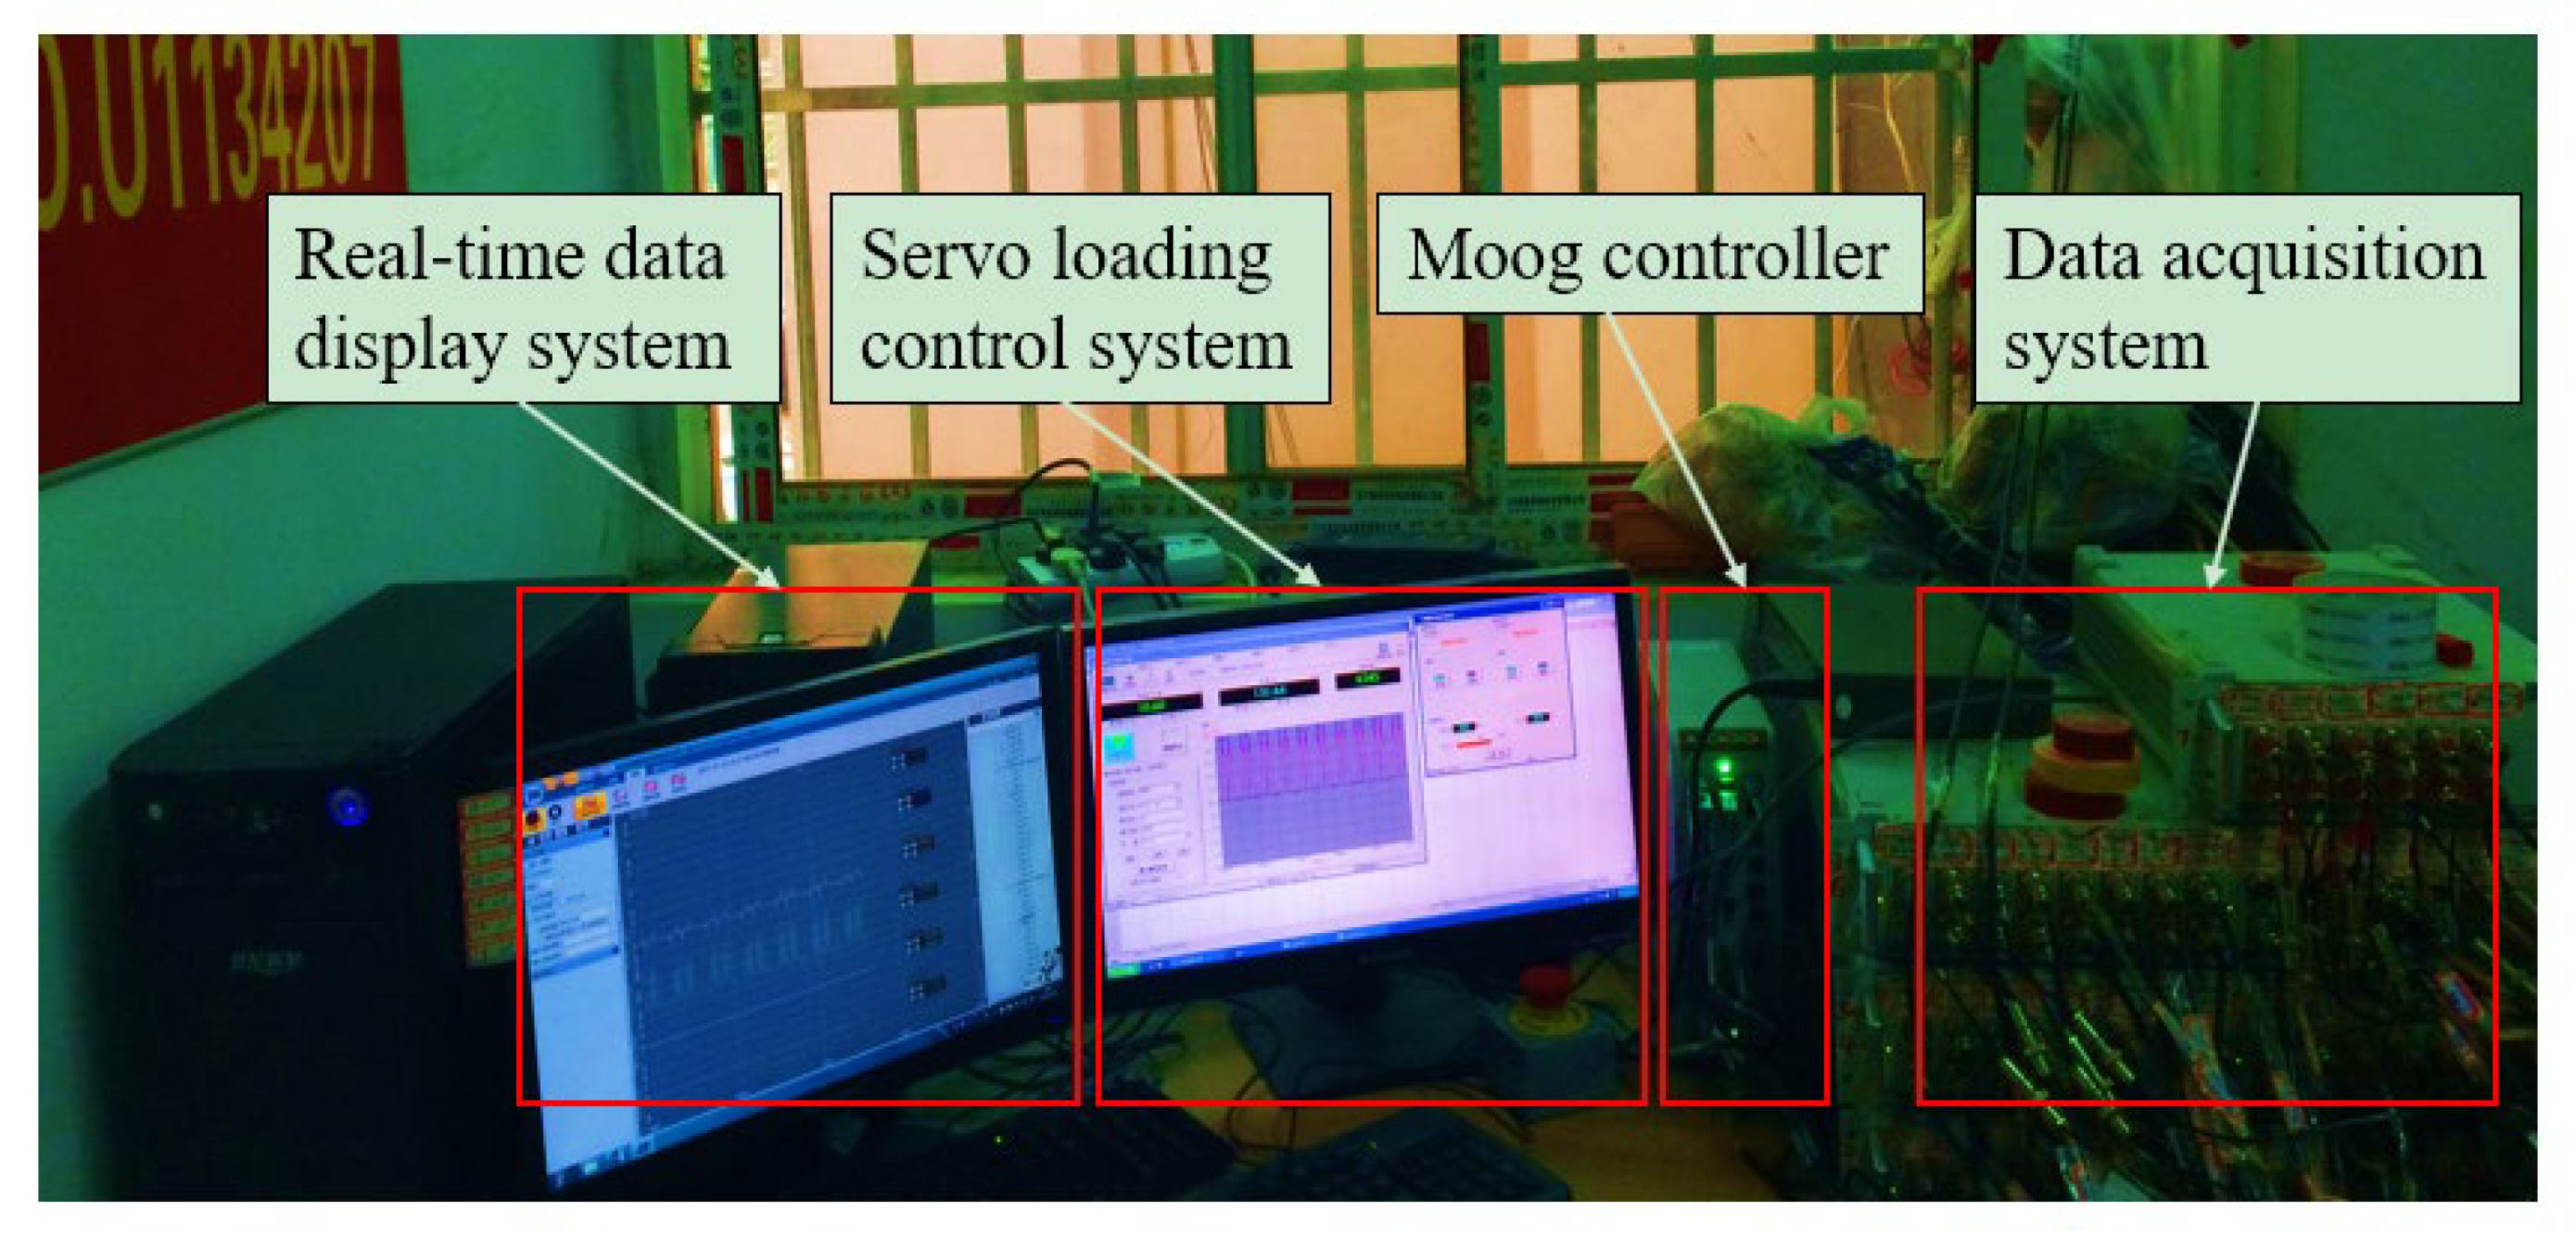
Figure 6.
Dynamic loading hydraulic servo control and digital data acquisition system.
Figure 6.
Dynamic loading hydraulic servo control and digital data acquisition system.
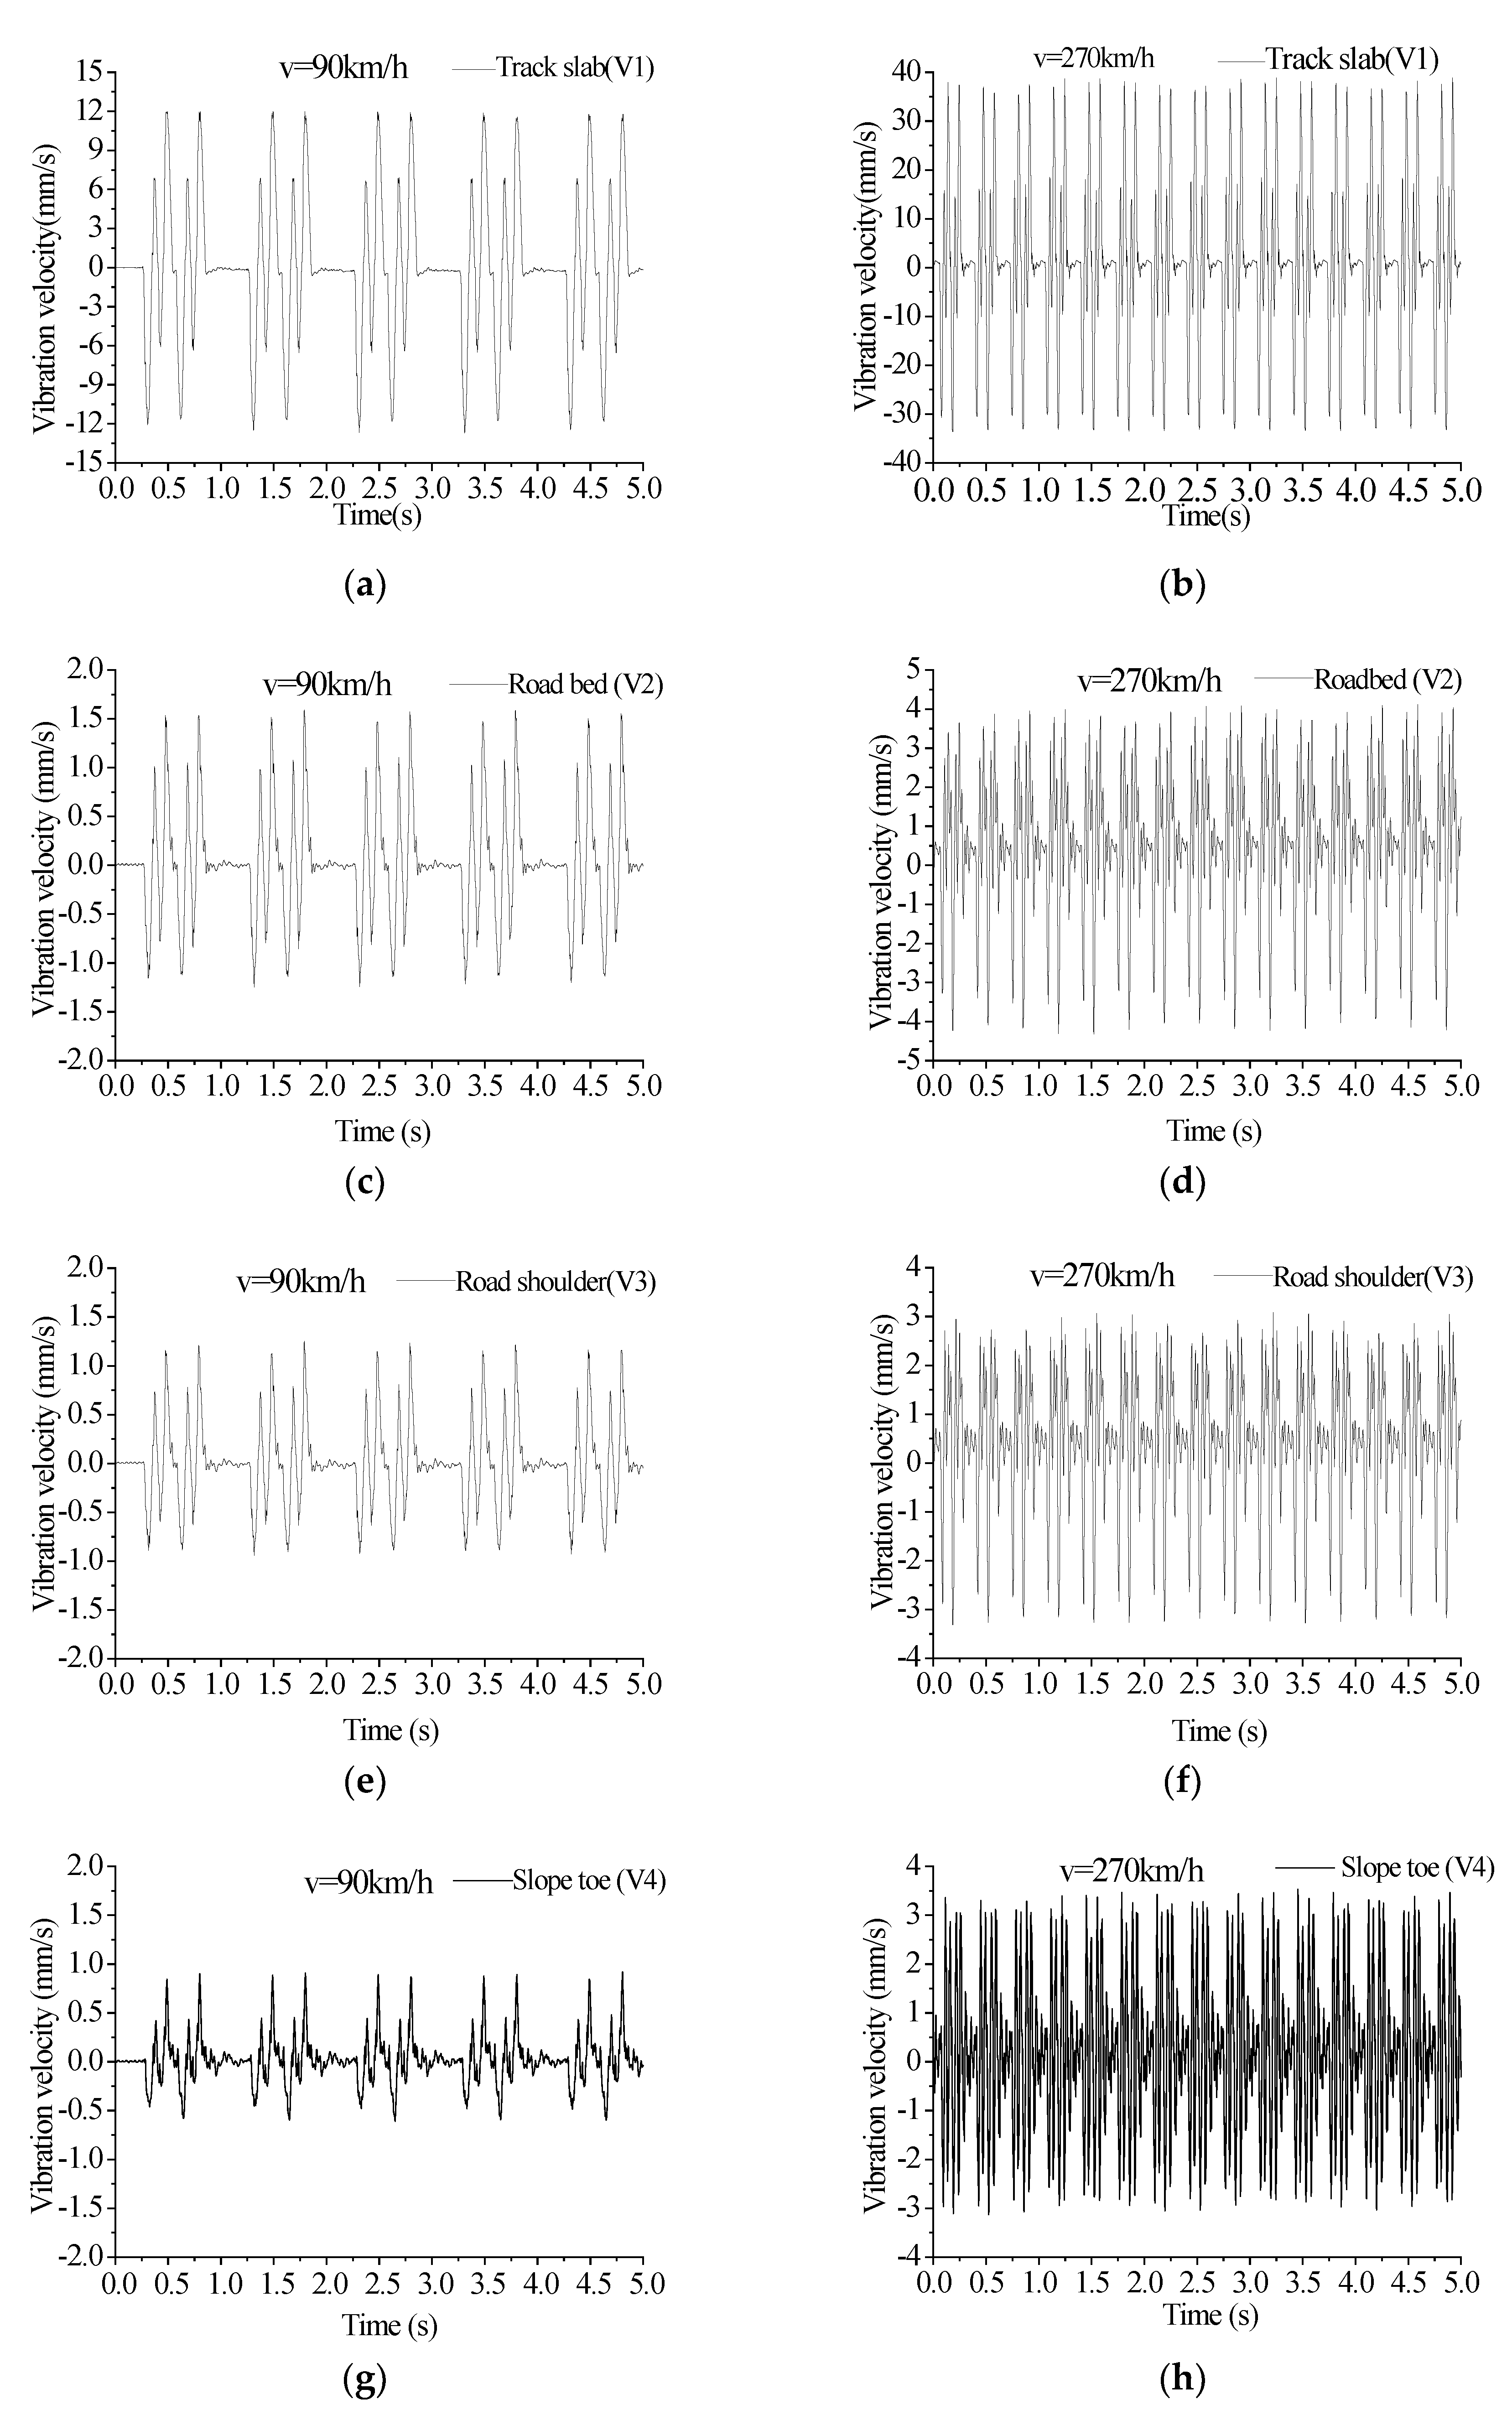
Figure 7.
Time history curves of the vibration velocities at the track slab, roadbed, road shoulder, and slope toe for different train speeds. (a) Track slab (V1, v = 90 km/h), (b) Track slab (V1, v = 270 km/h), (c) Roadbed (V2, v = 90 km/h), (d) Roadbed (V2, v = 270 km/h), (e) Road shoulder (V3, v = 90 km/h), (f) Road shoulder (V3, v = 270 km/h), (g) Slop toe (V4, v = 90 km/h), (h) Slop toe (V4, v = 270 km/h).
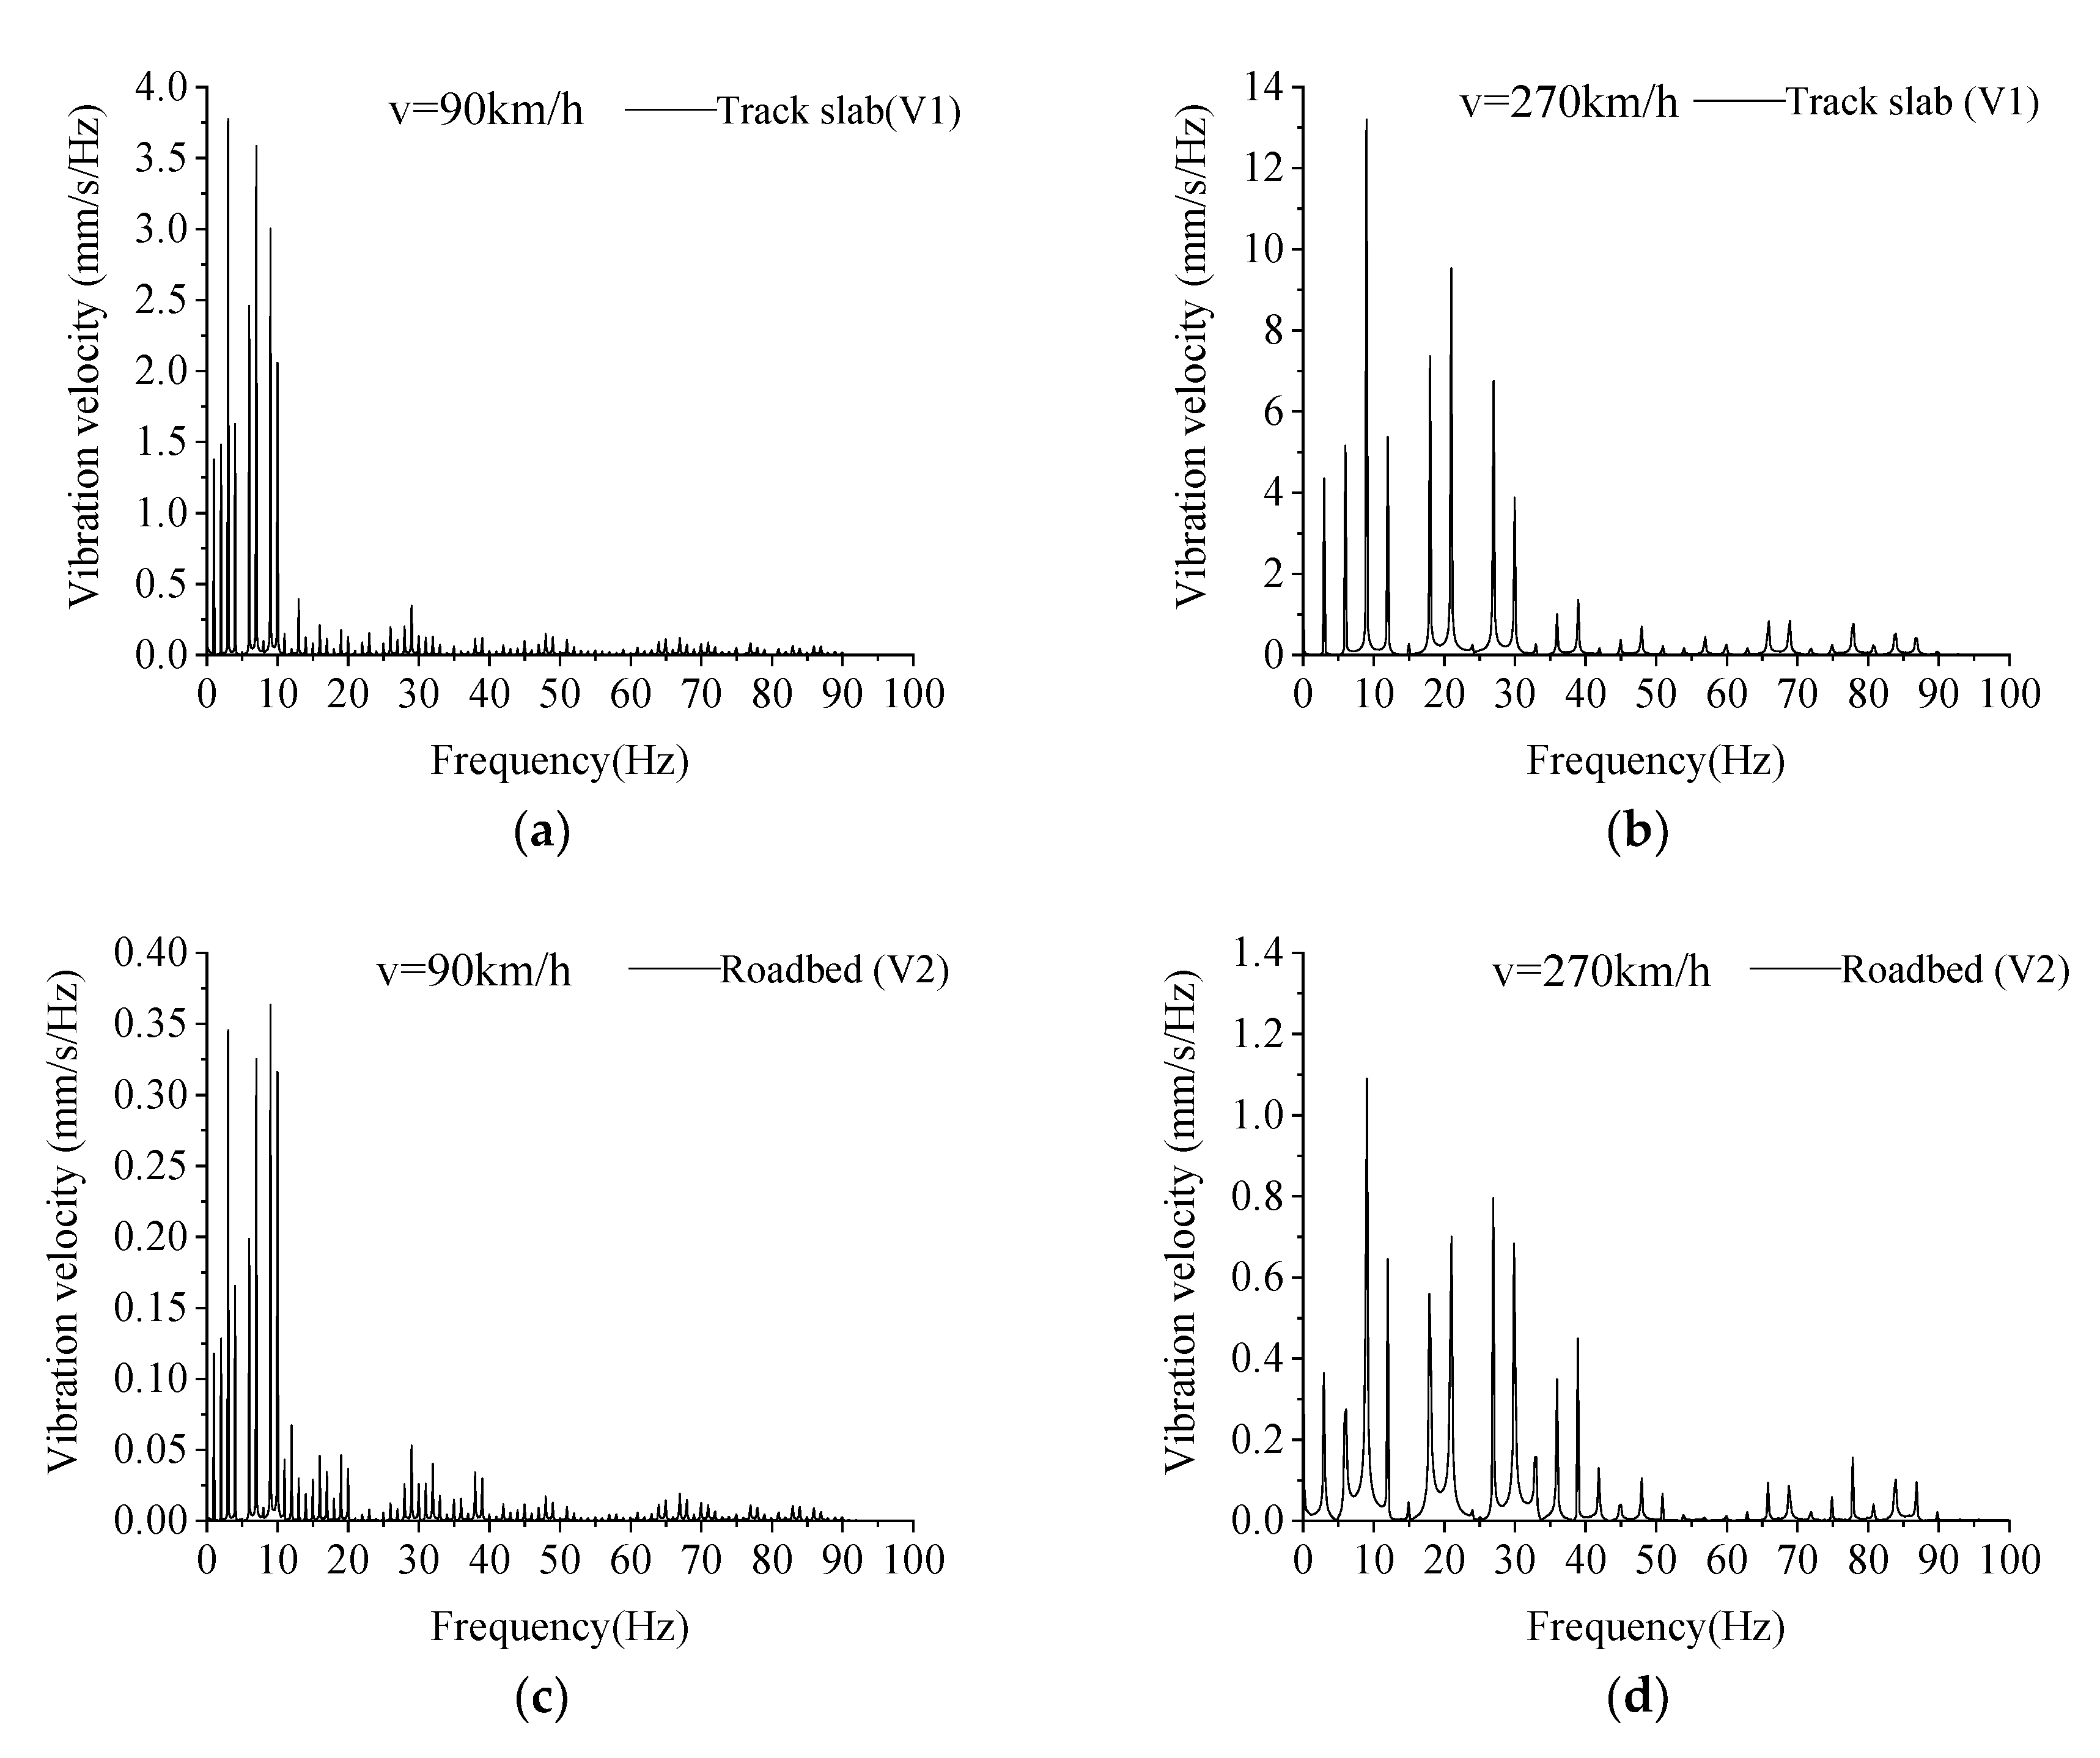
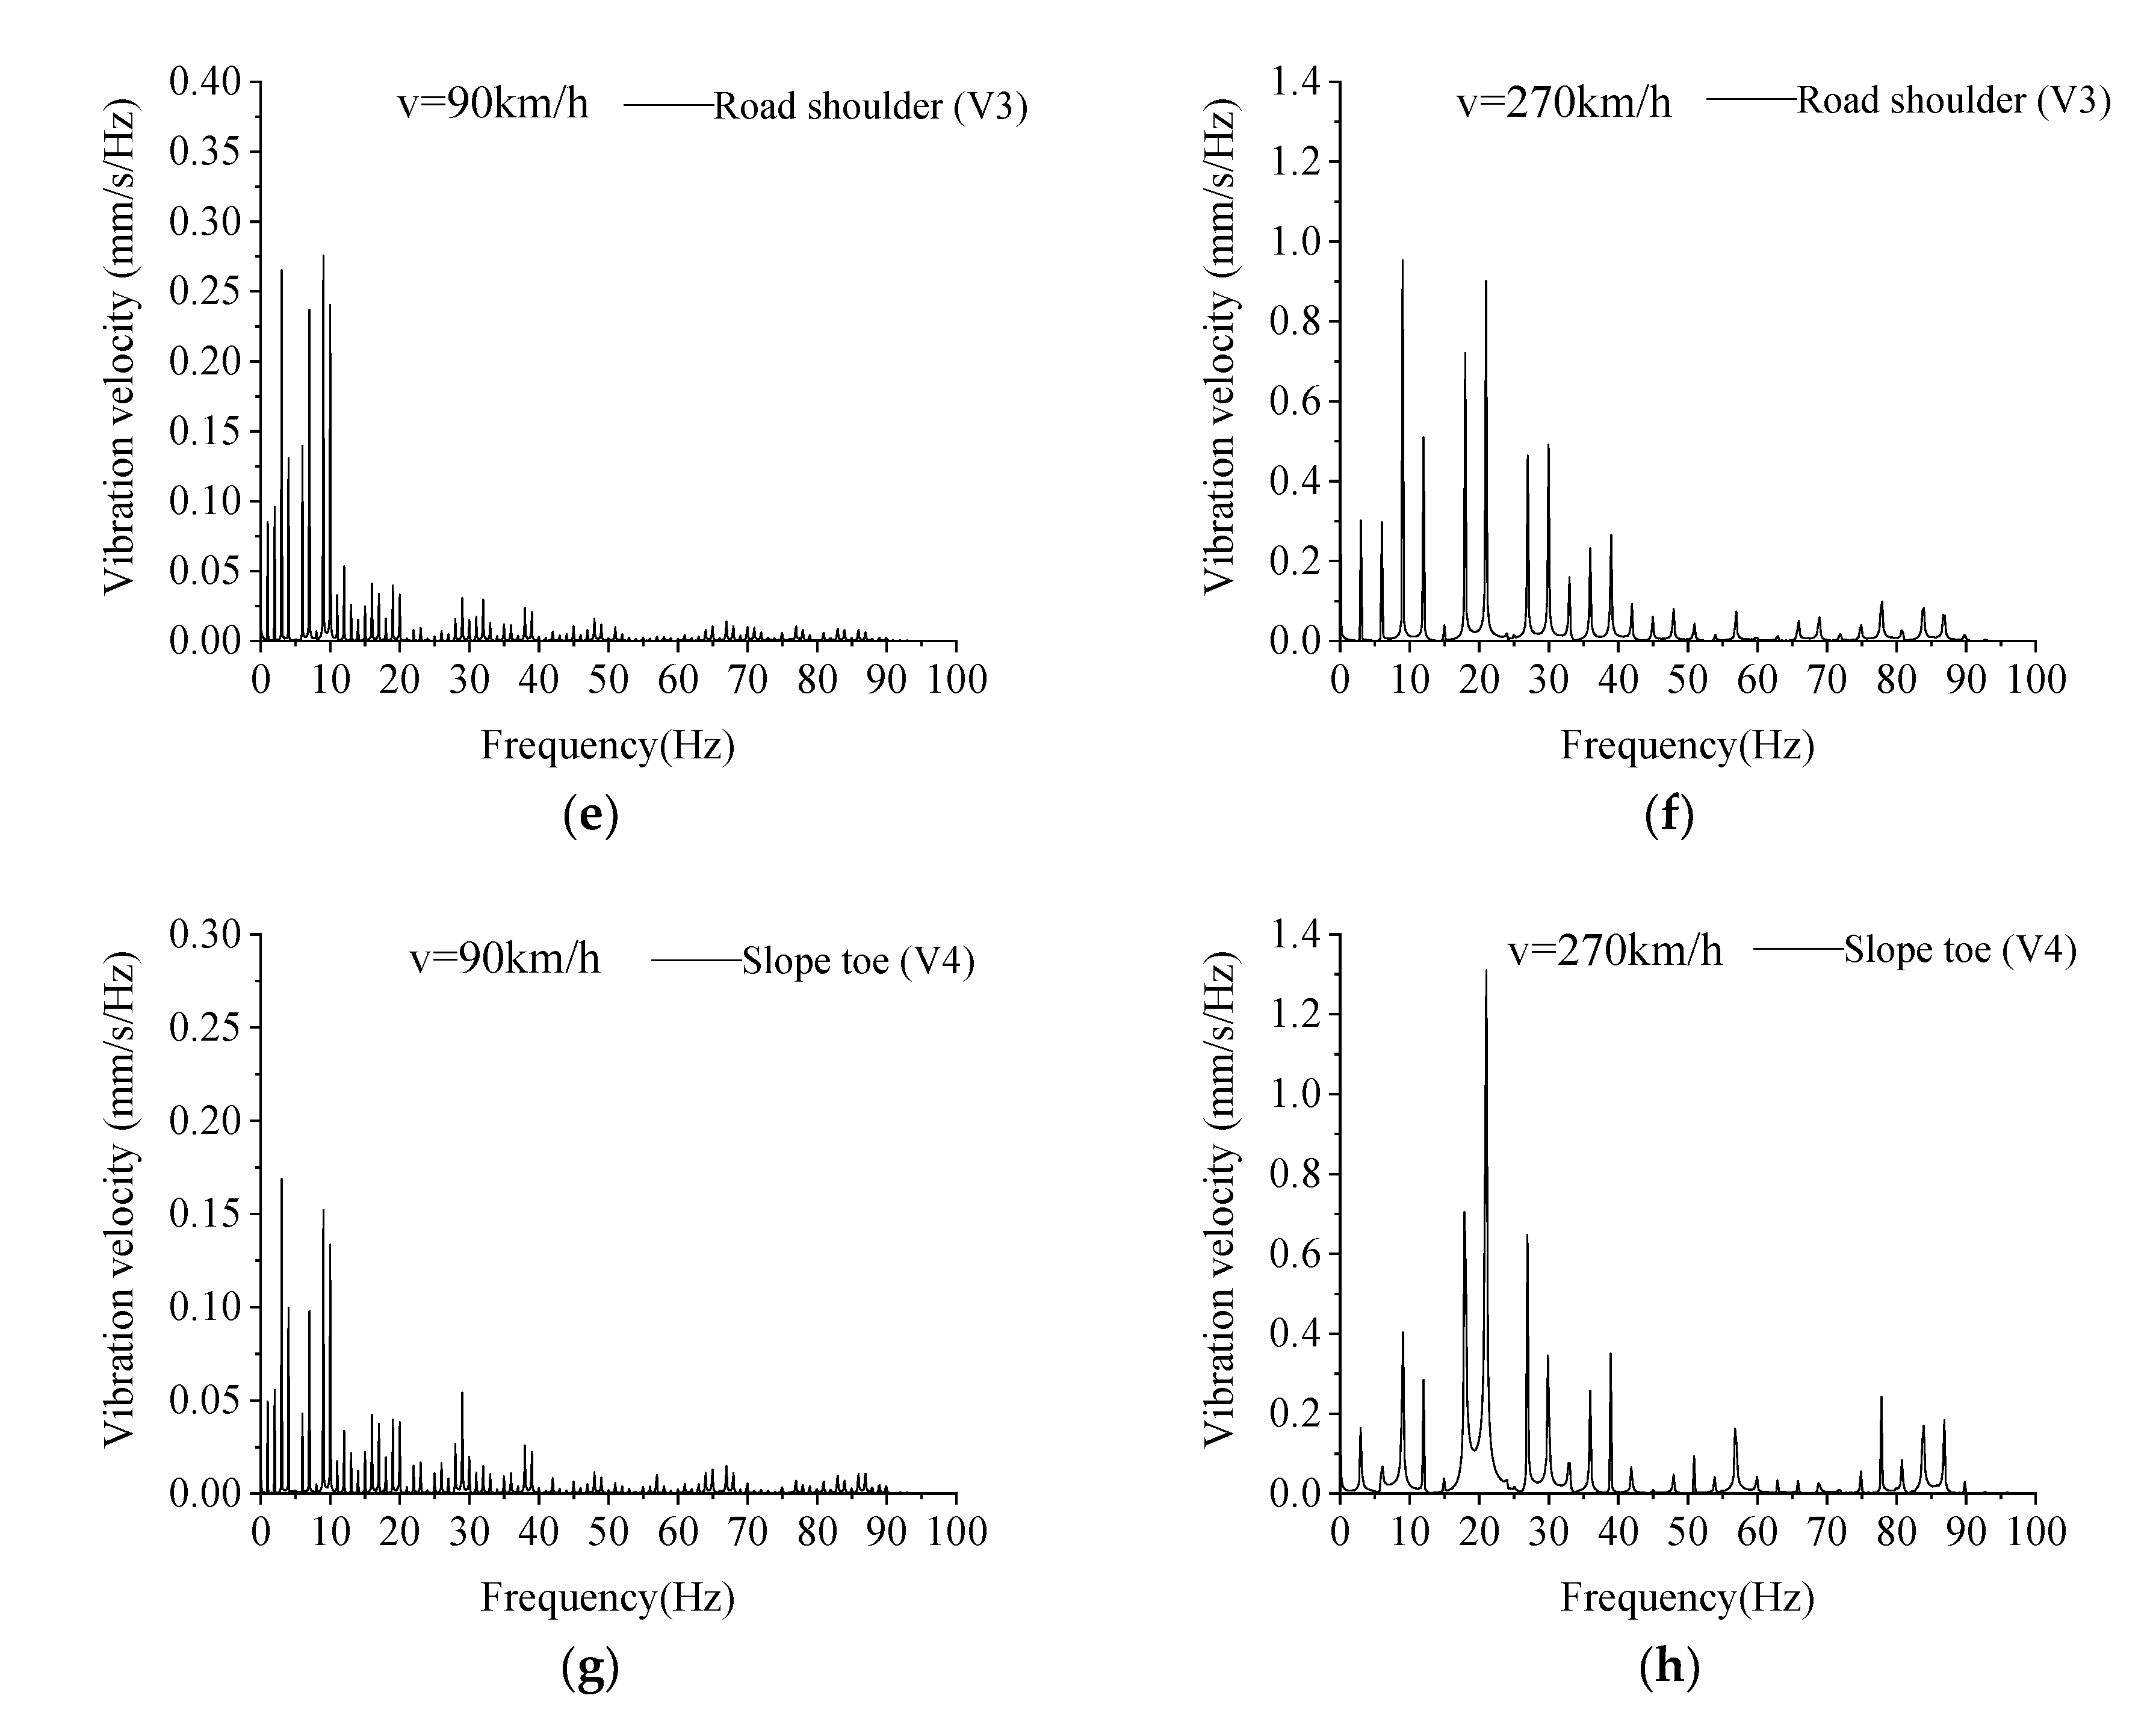
Figure 8.
Frequency spectrum analysis of vibration velocities at the track slab, roadbed, road shoulder, and slope toe for different train speeds. (a) Track slab (V1, v = 90 km/h), (b) Track slab (V1, v = 270 km/h), (c) Roadbed (V2, v = 90 km/h), (d) Roadbed (V2, v = 270 km/h), (e) Road shoulder (V2, v = 90 km/h), (f) Road shoulder (V3, v = 270 km/h), (g) Slop toe (V4, v = 90 km/h), (h) Slop toe (V4, v = 270 km/h).
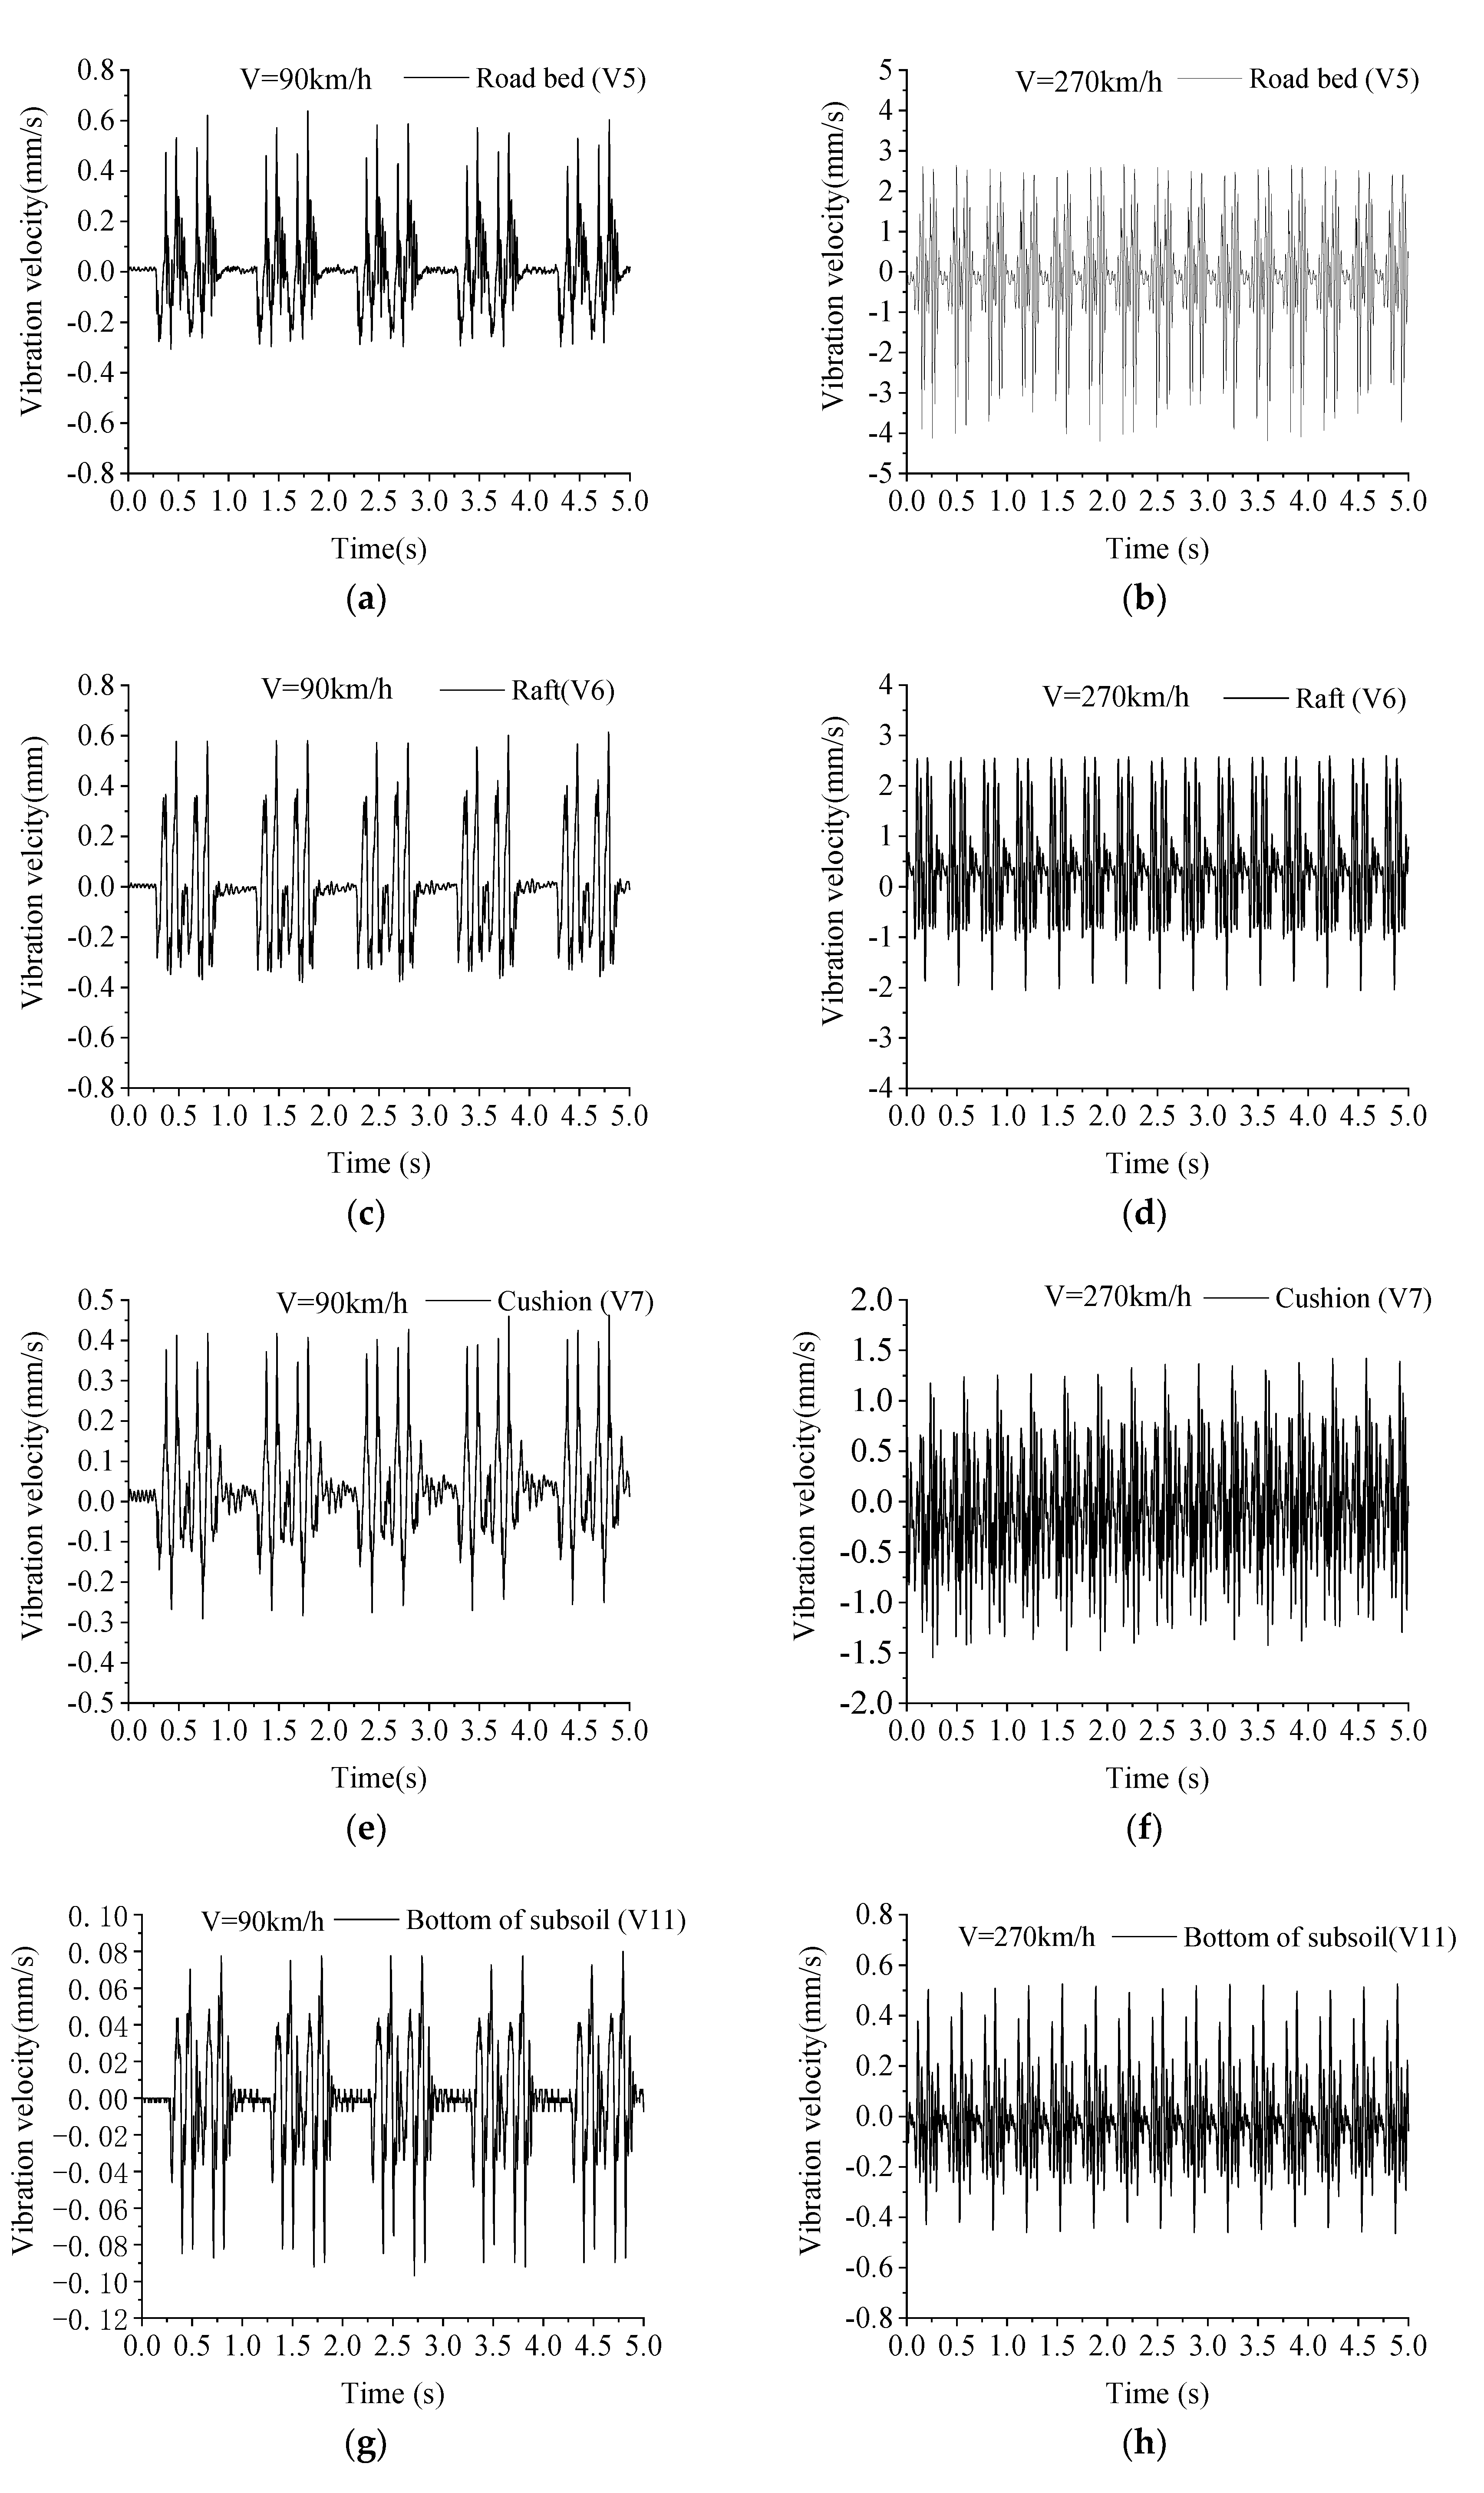
Figure 9.
Time history curves of vibration velocities at different locations of the pile–raft foundation. (a) Roadbed (V5, v = 90 km/h), (b) Roadbed (V5, v = 270 km/h), (c) Raft (V6, v = 90 km/h), (d) Raft (V6, v = 270 km/h), (e) Cushion (V7, v = 90 km/h), (f) Cushion (V7, v = 270km/h), (g) Bottom of subsoil (V11, v = 90 km/h), (h) Bottom of subsoil (V11, v = 270 km/h).
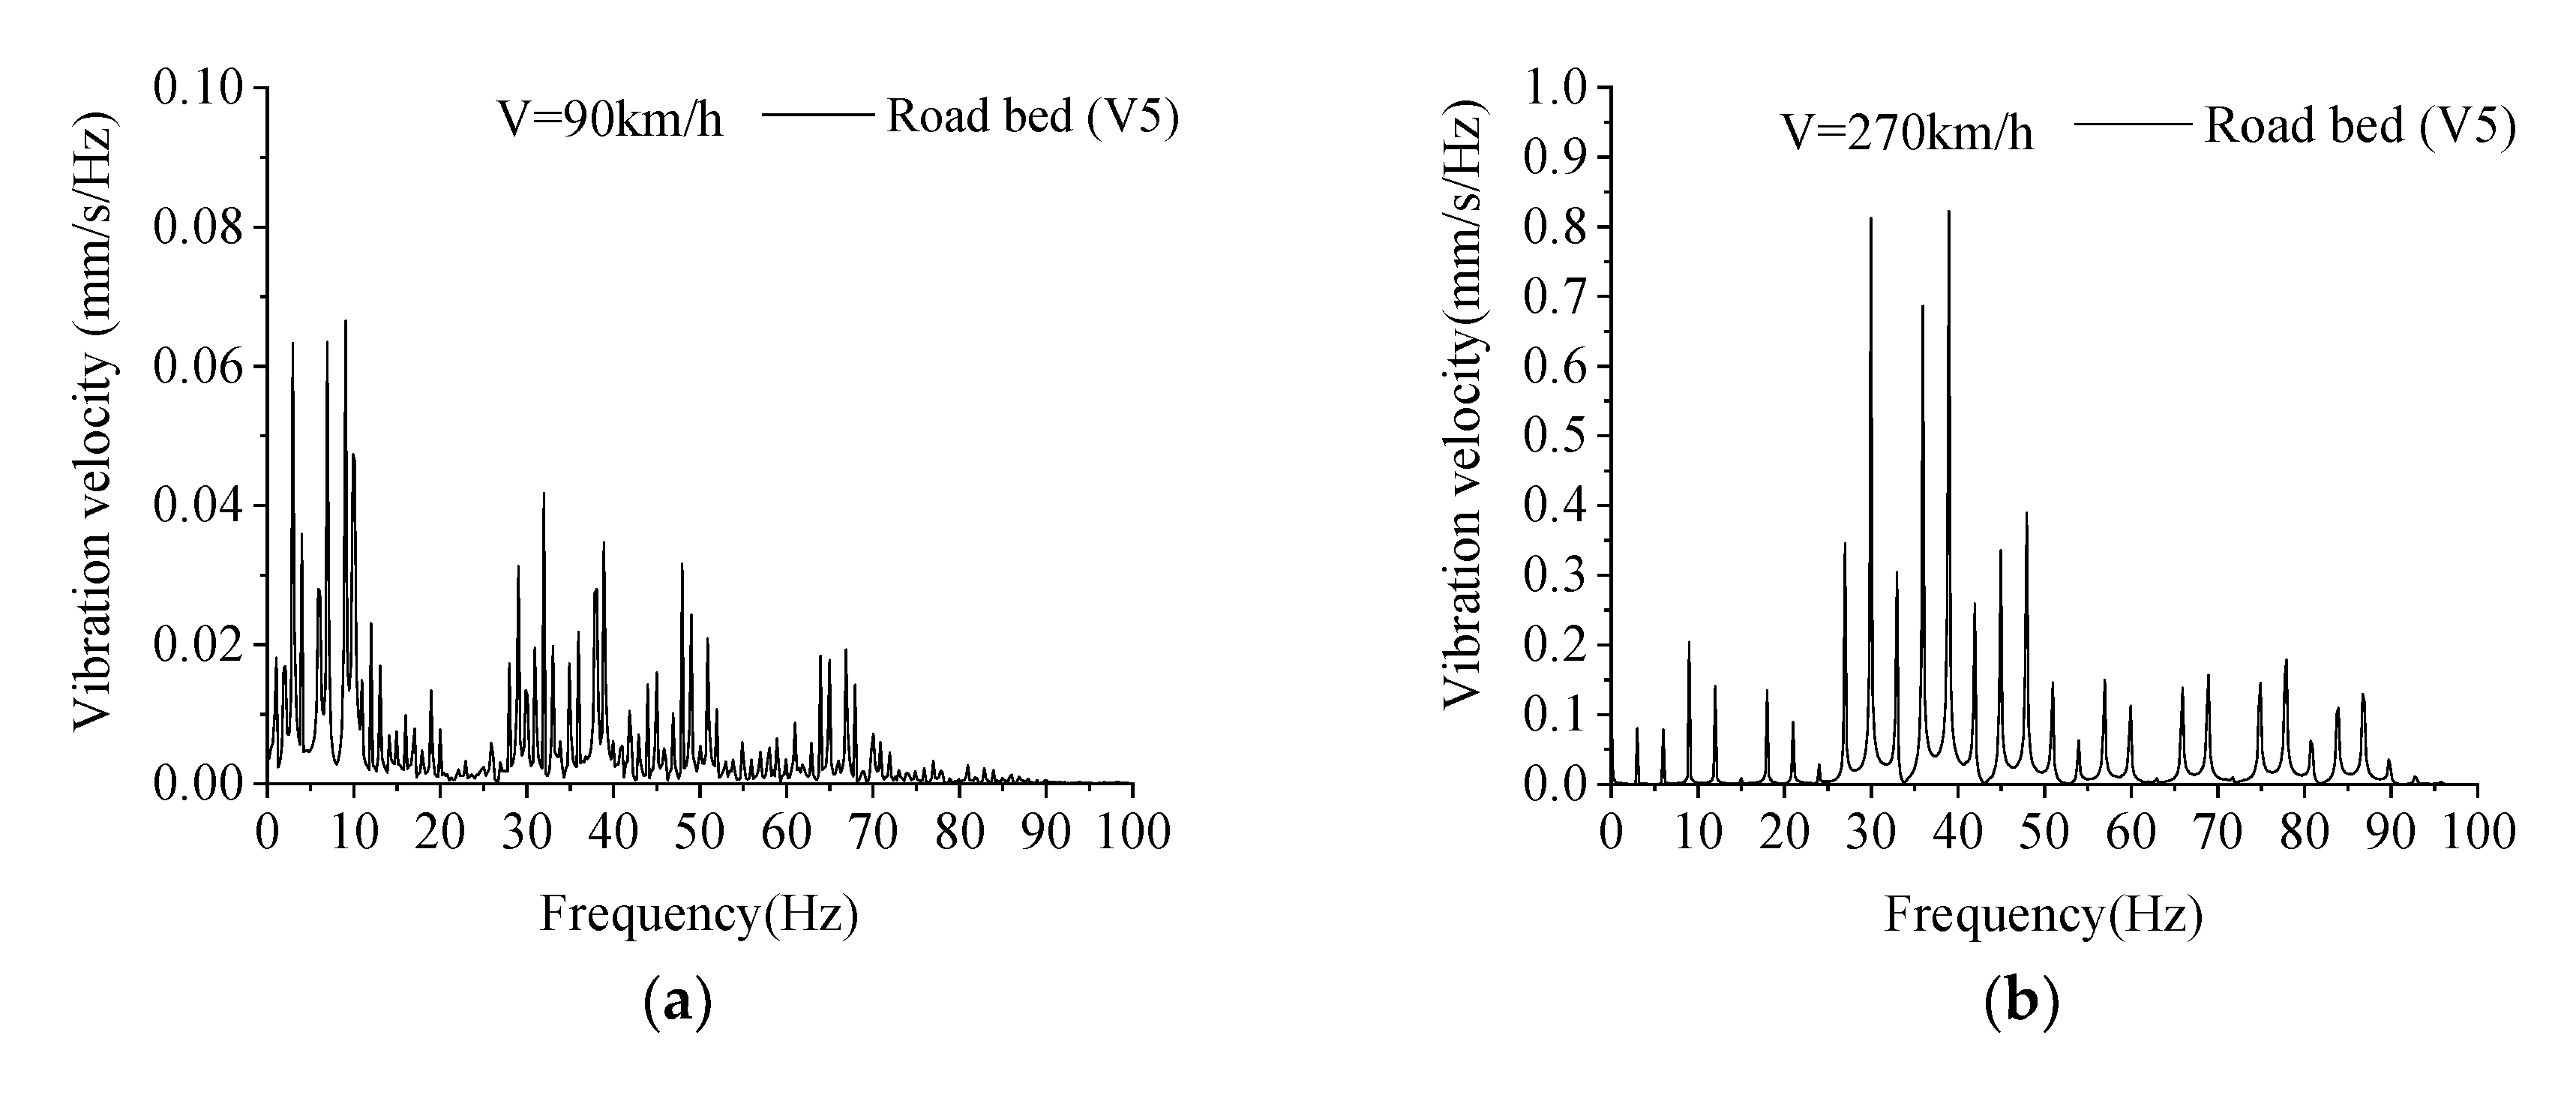
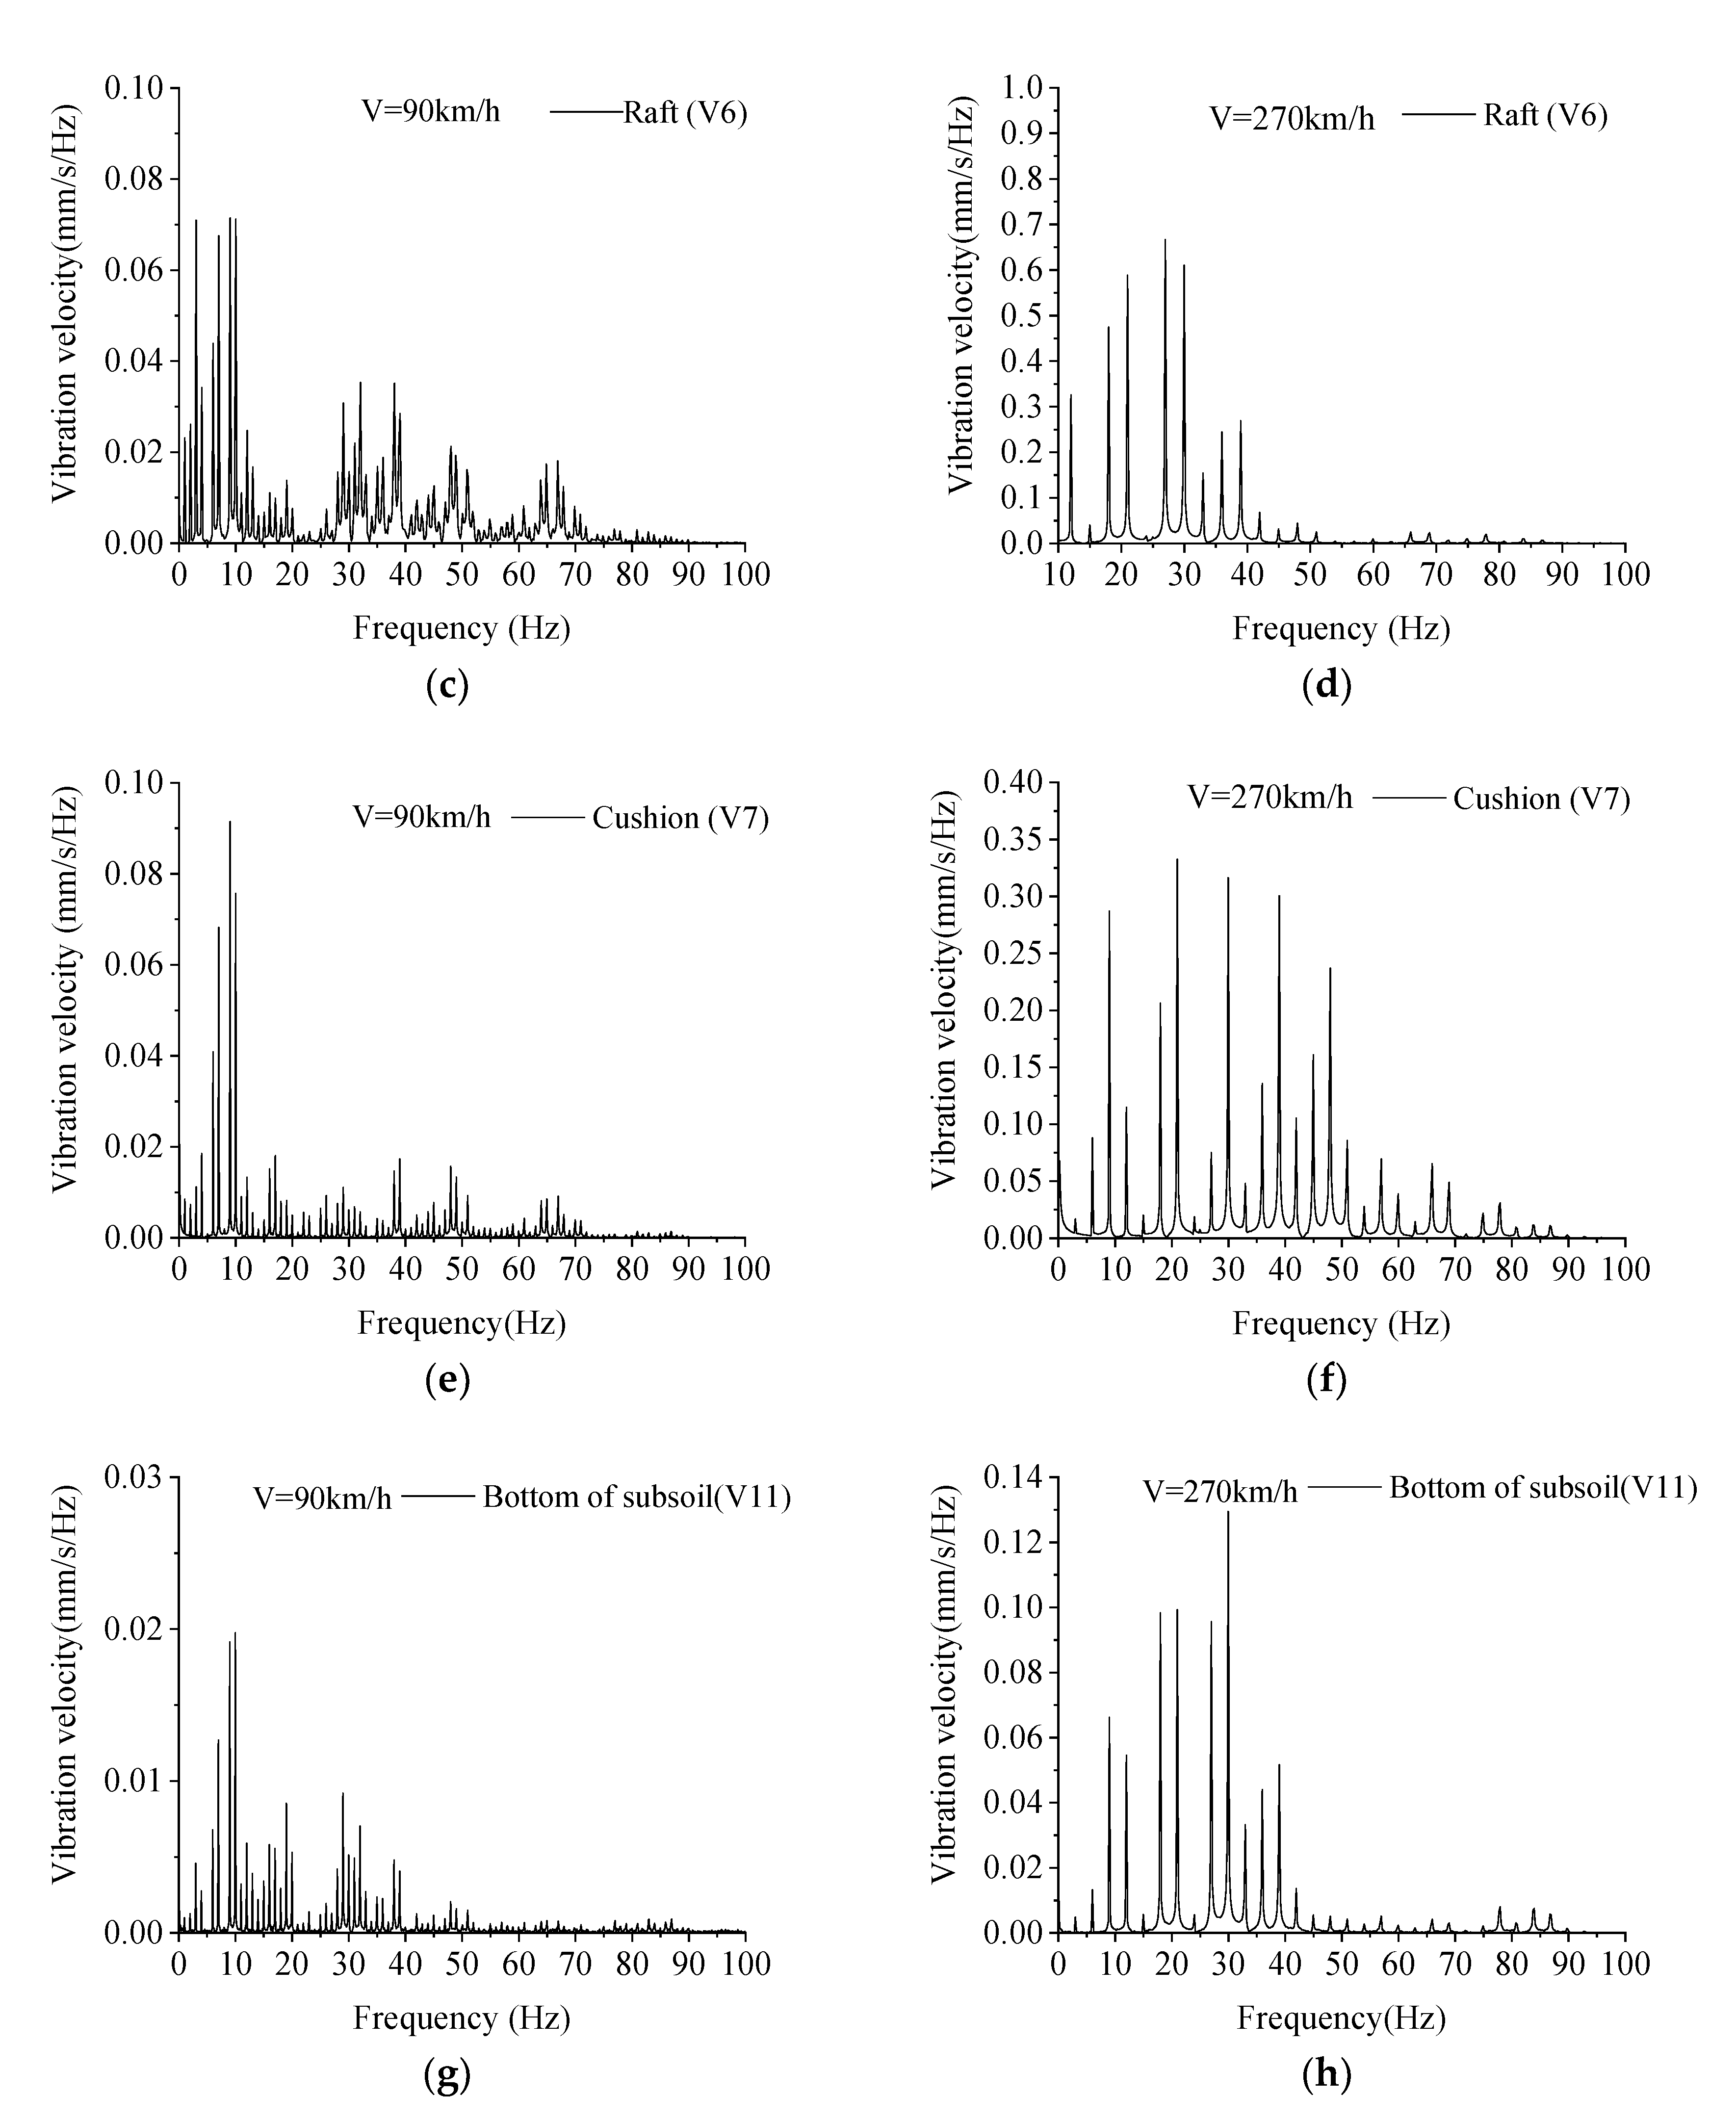
Figure 10.
Frequency spectrum analysis of vibration velocities at different locations of a track embankment pile–raft foundation. (a) Roadbed (V5, v = 90 km/h), (b) Roadbed (V5, v = 270 km/h), (c) Raft (V6, v = 90 km/h), (d) Raft (V6, v = 270 km/h), (e) Cushion (V7, v = 90 km/h), (f) Cushion (V7, v = 270 km/h), (g) Bottom of subsoil (V11, v = 90 km/h), (h) Bottom of subsoil (V11, v = 270 km/h).
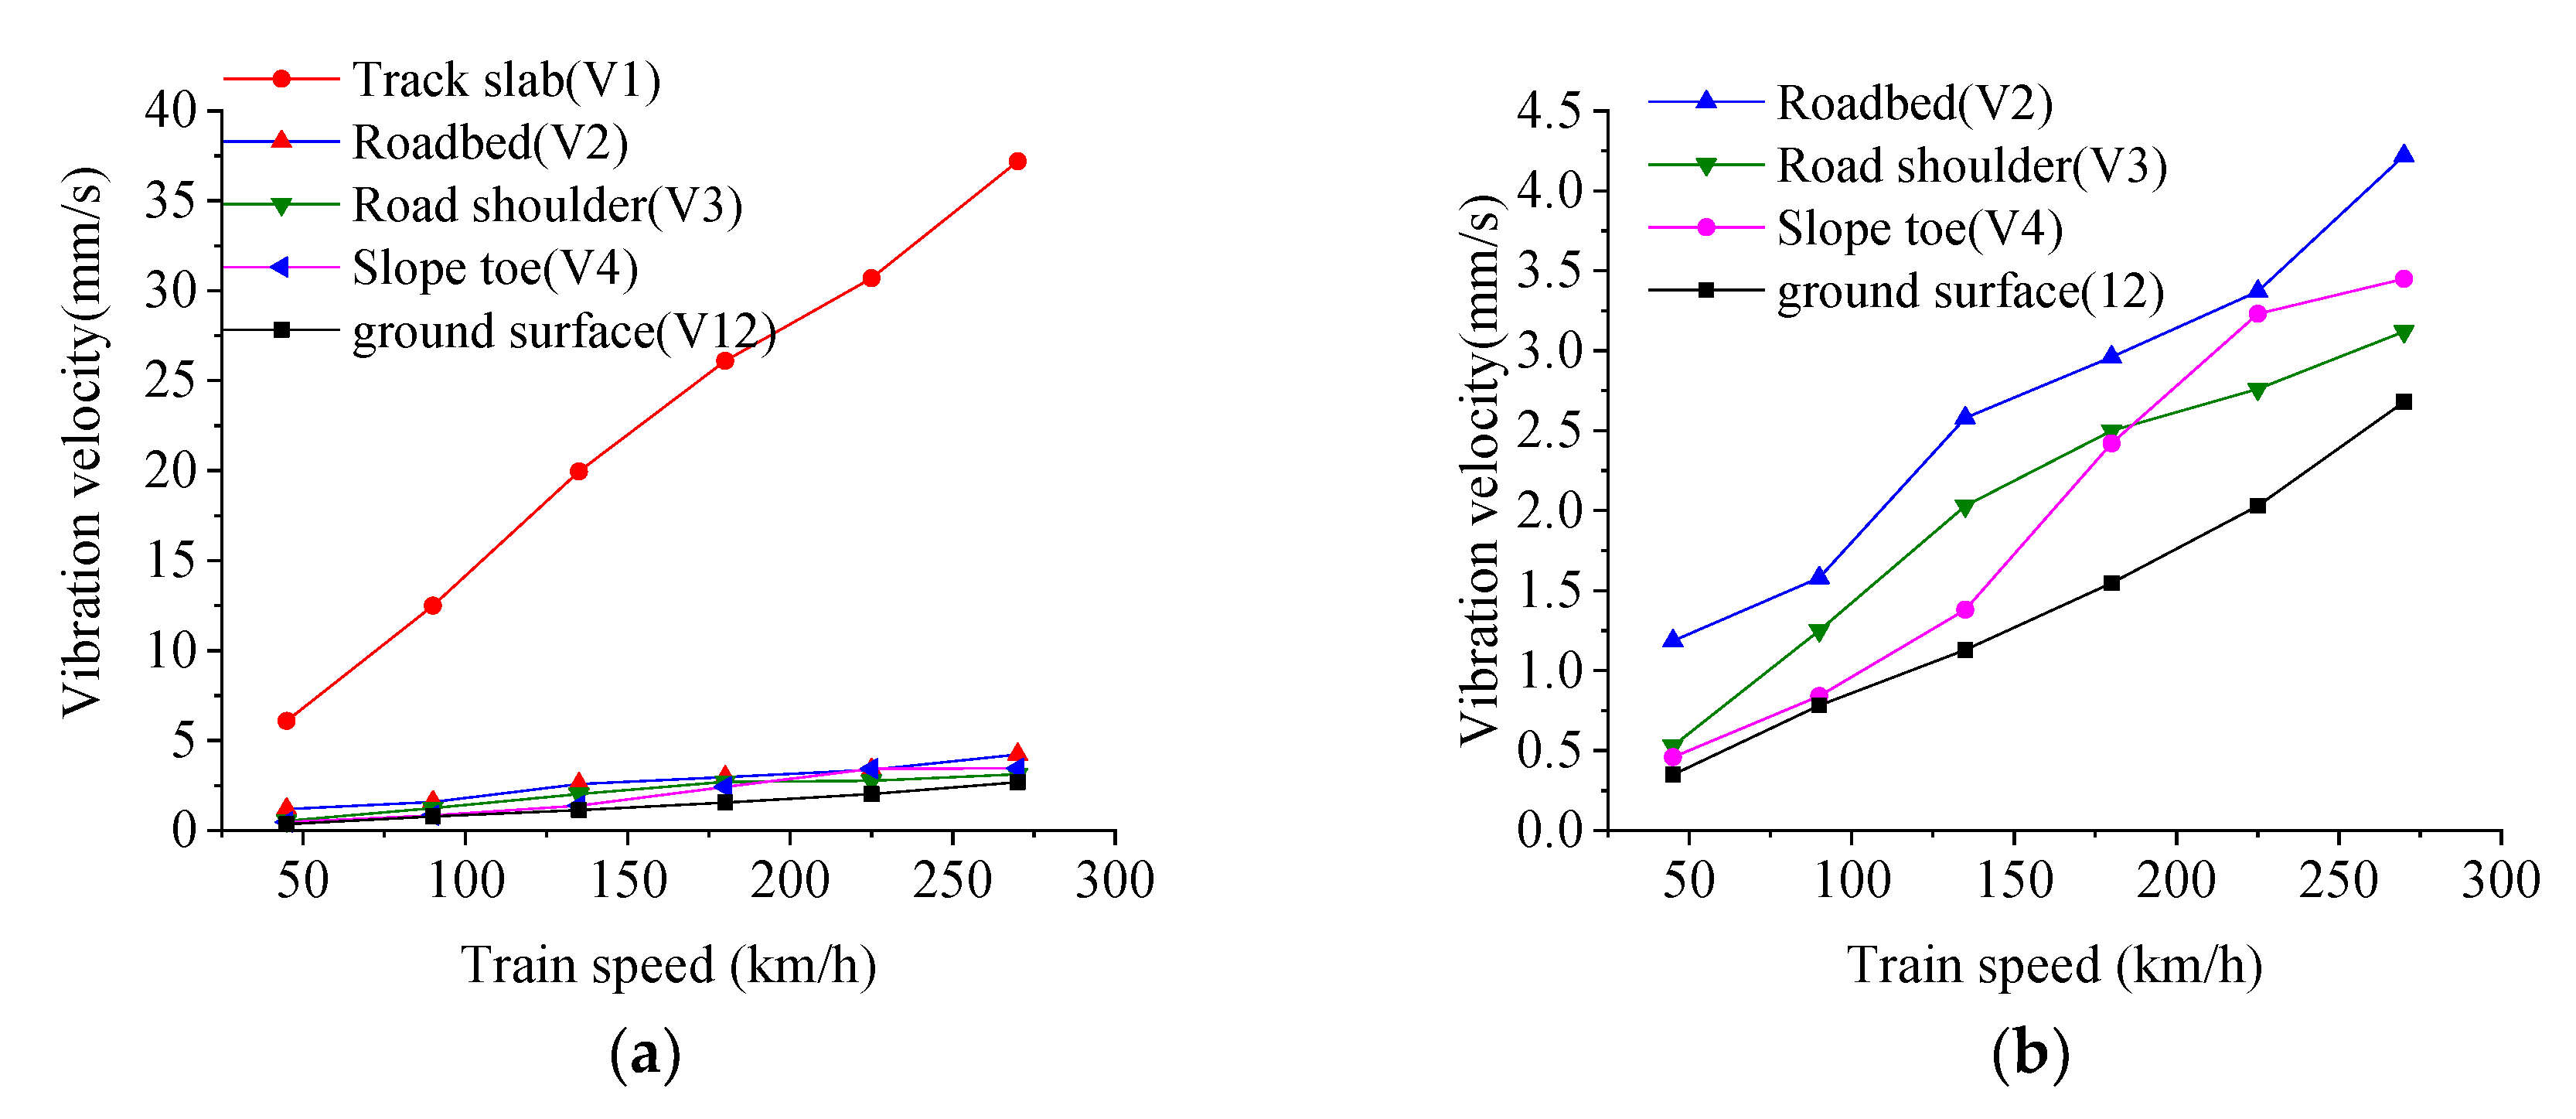
Figure 11.
Relationship between the vibration velocity and train speeds in the model test. (a) V1, V2, V3, V4, V12, (b) V2, V3, V4, V12.
Figure 11.
Relationship between the vibration velocity and train speeds in the model test. (a) V1, V2, V3, V4, V12, (b) V2, V3, V4, V12.
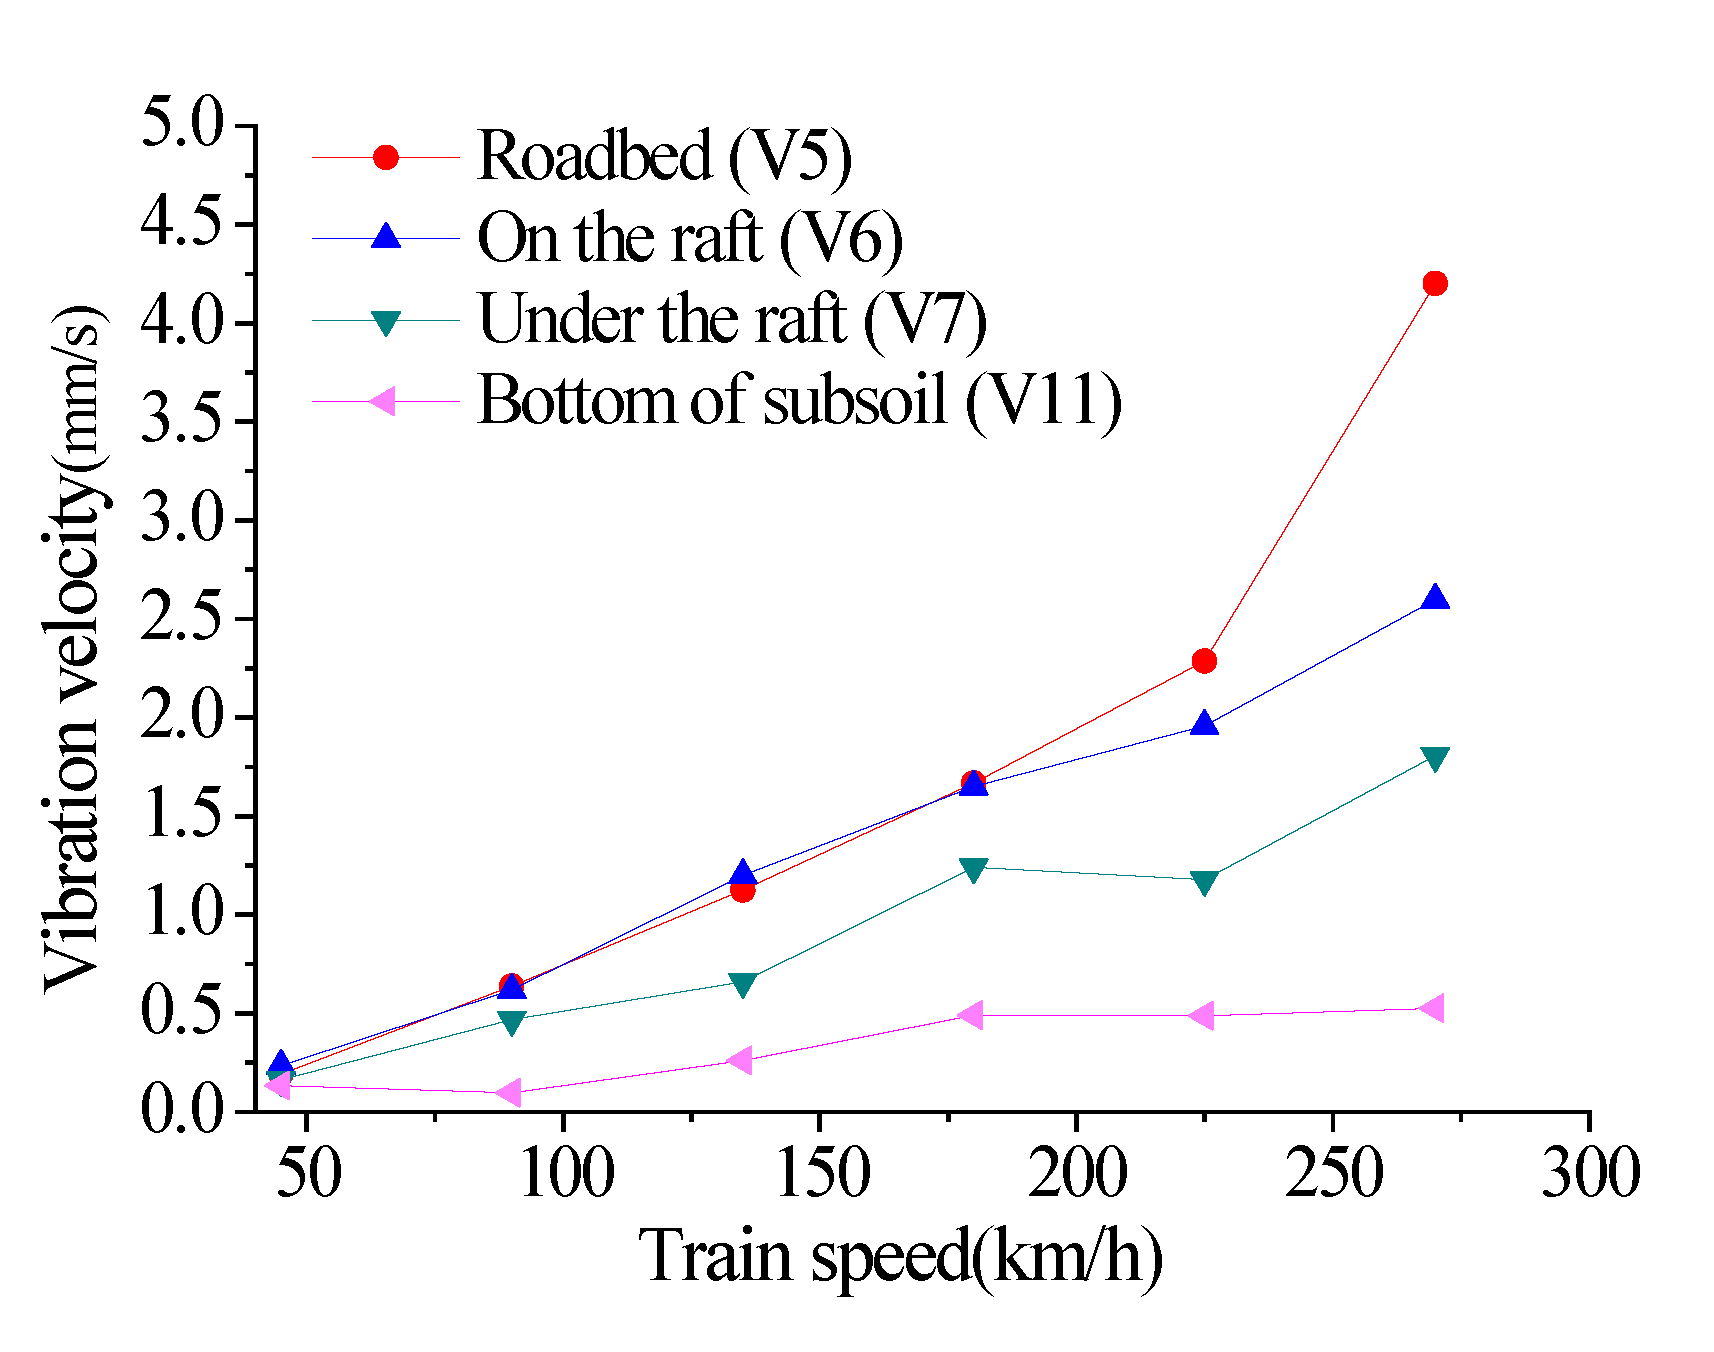
Figure 12.
Relationship between the vibration velocity and train speed at the locations V5, V6, V7, and V11.
Figure 12.
Relationship between the vibration velocity and train speed at the locations V5, V6, V7, and V11.
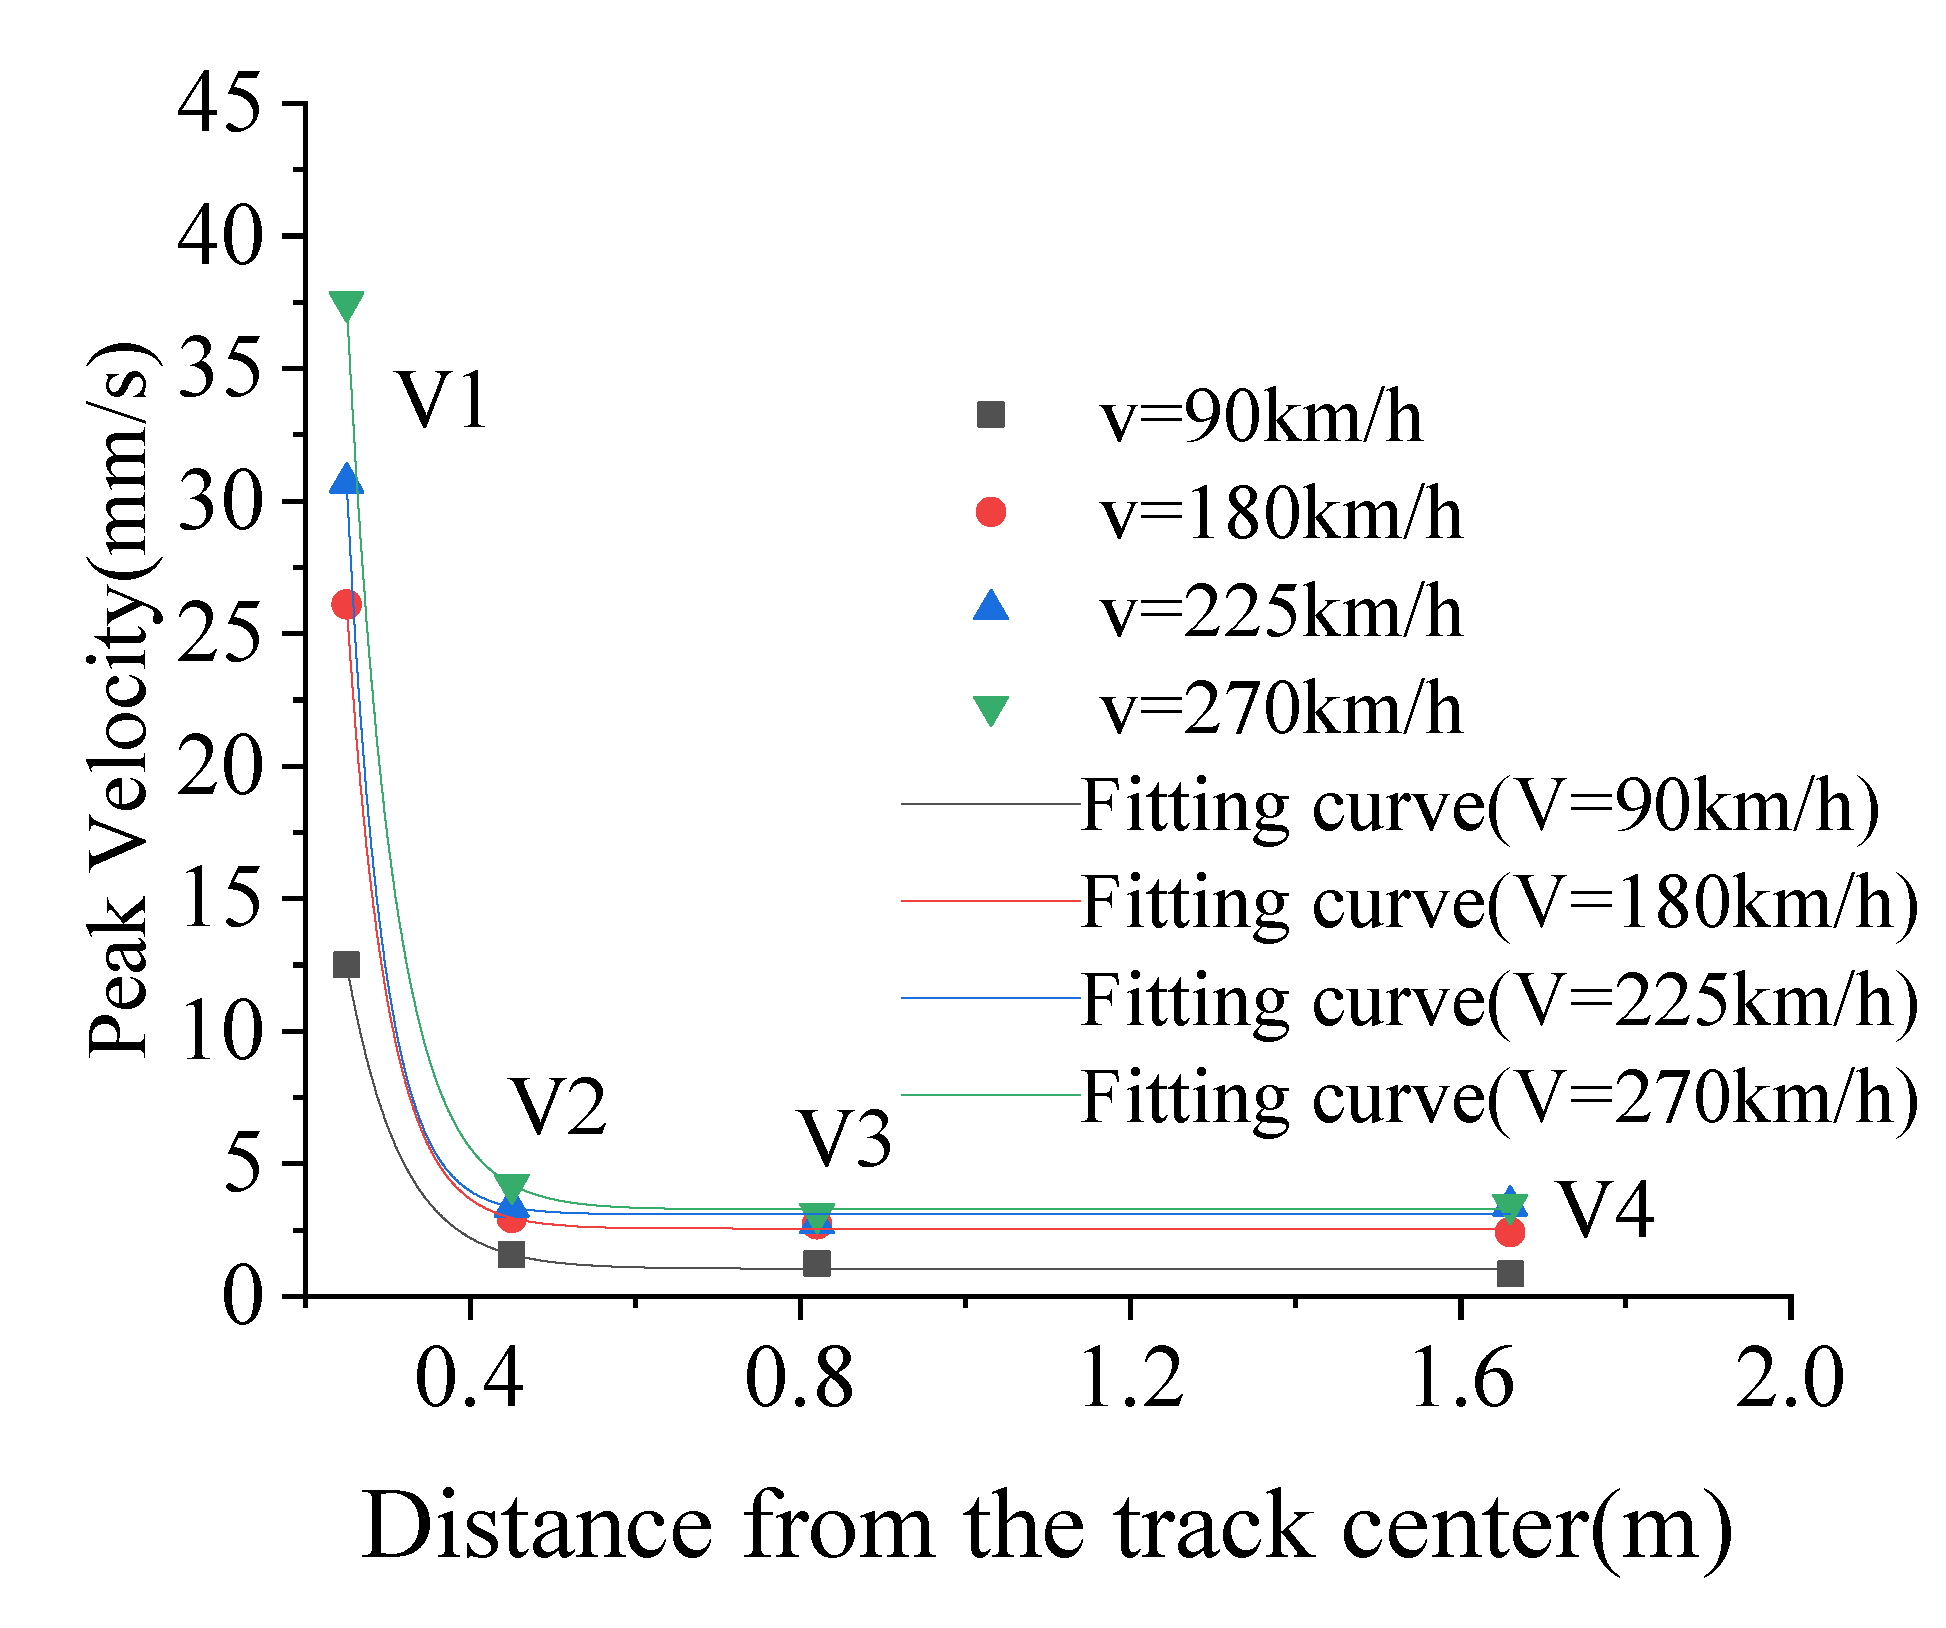
Figure 13.
Distribution of the vibration velocity in the horizontal direction from the track center.
Figure 13.
Distribution of the vibration velocity in the horizontal direction from the track center.
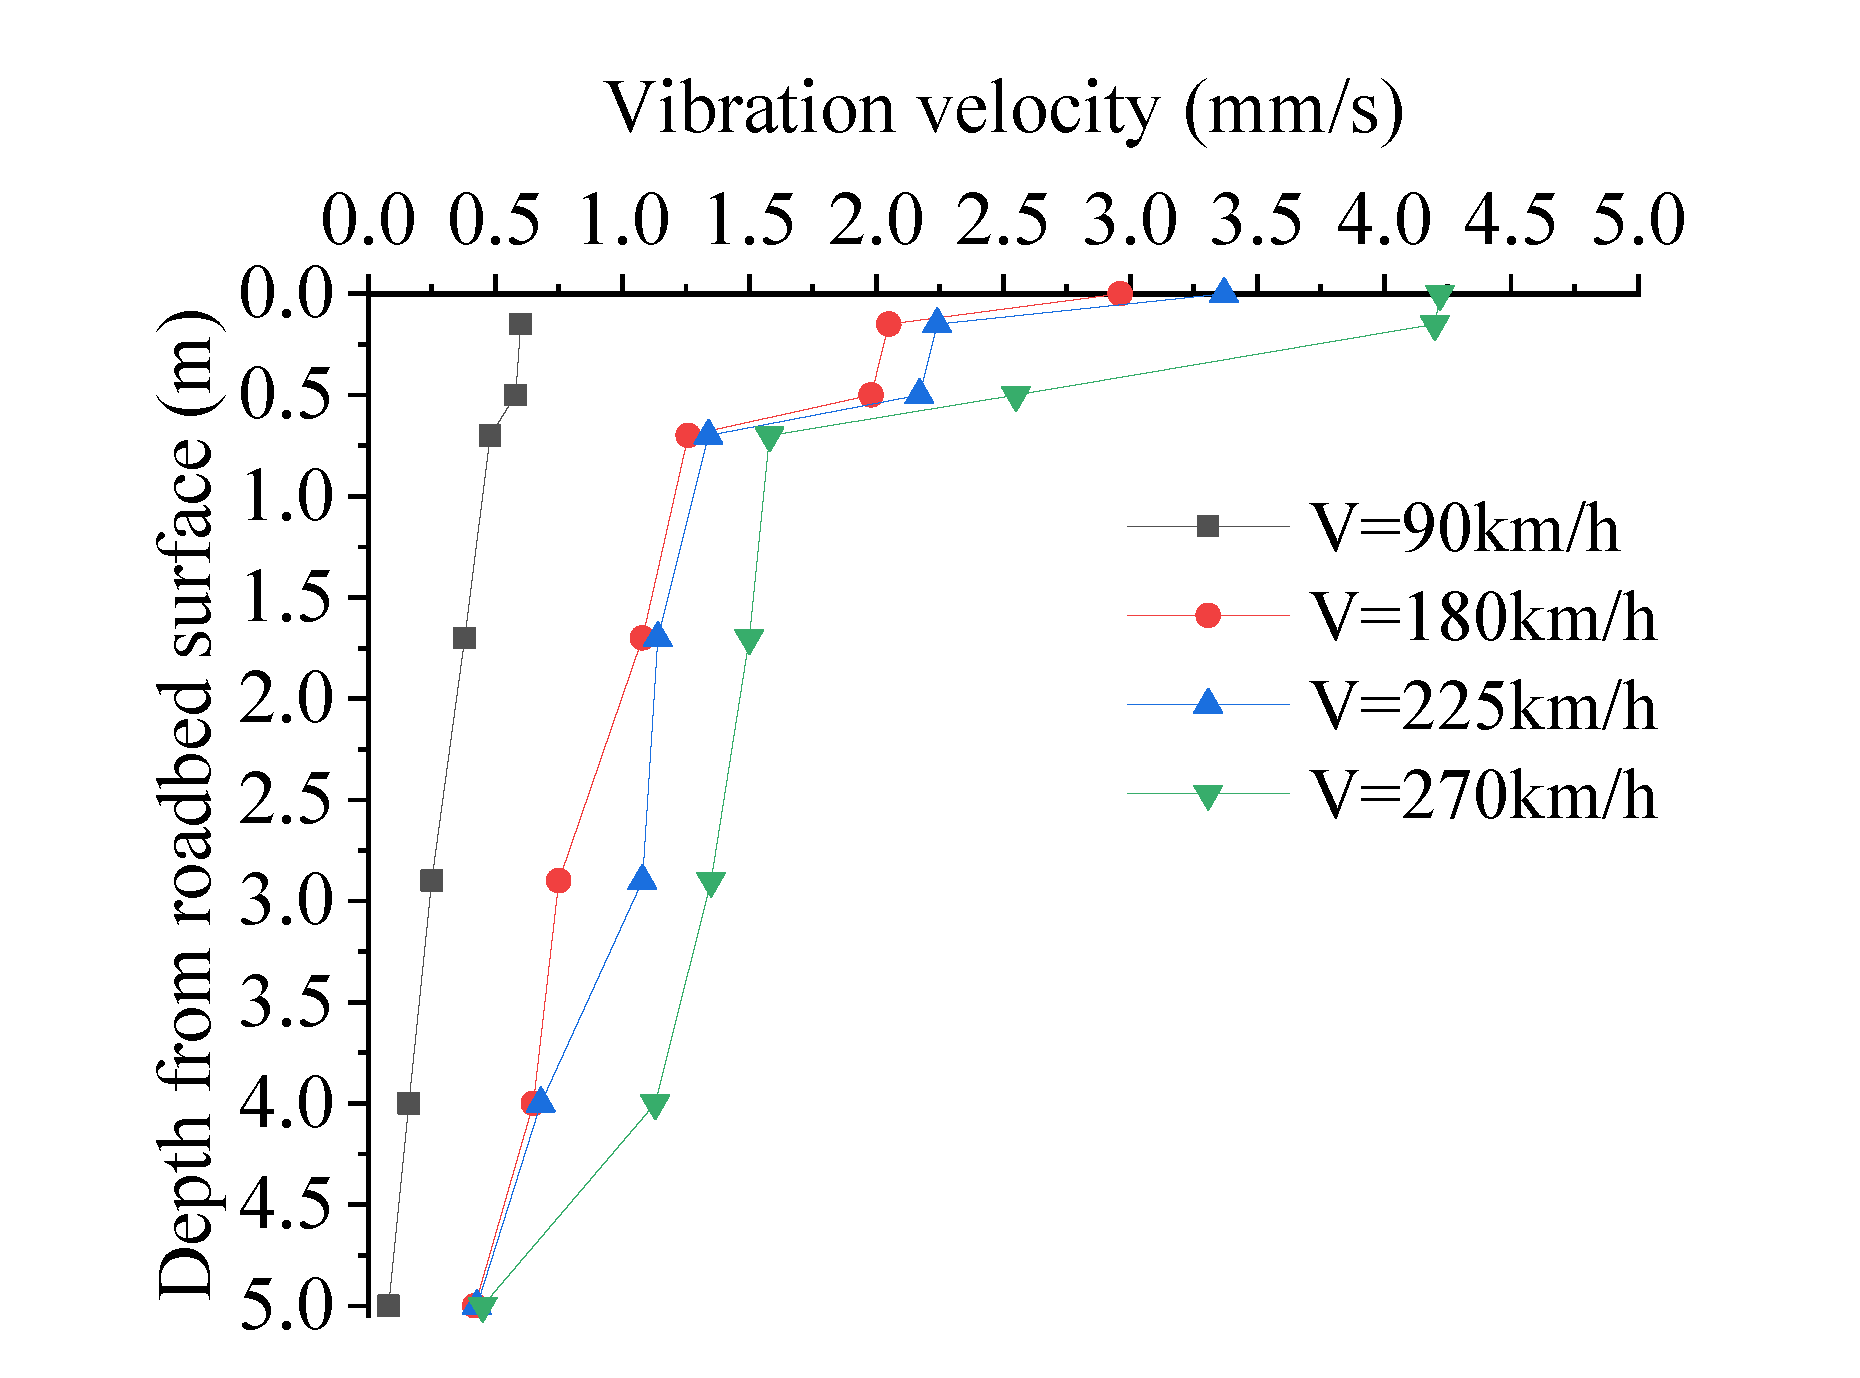
Figure 14.
Distribution of the vibration velocity amplitude along the vertical direction from the roadbed.
Figure 14.
Distribution of the vibration velocity amplitude along the vertical direction from the roadbed.
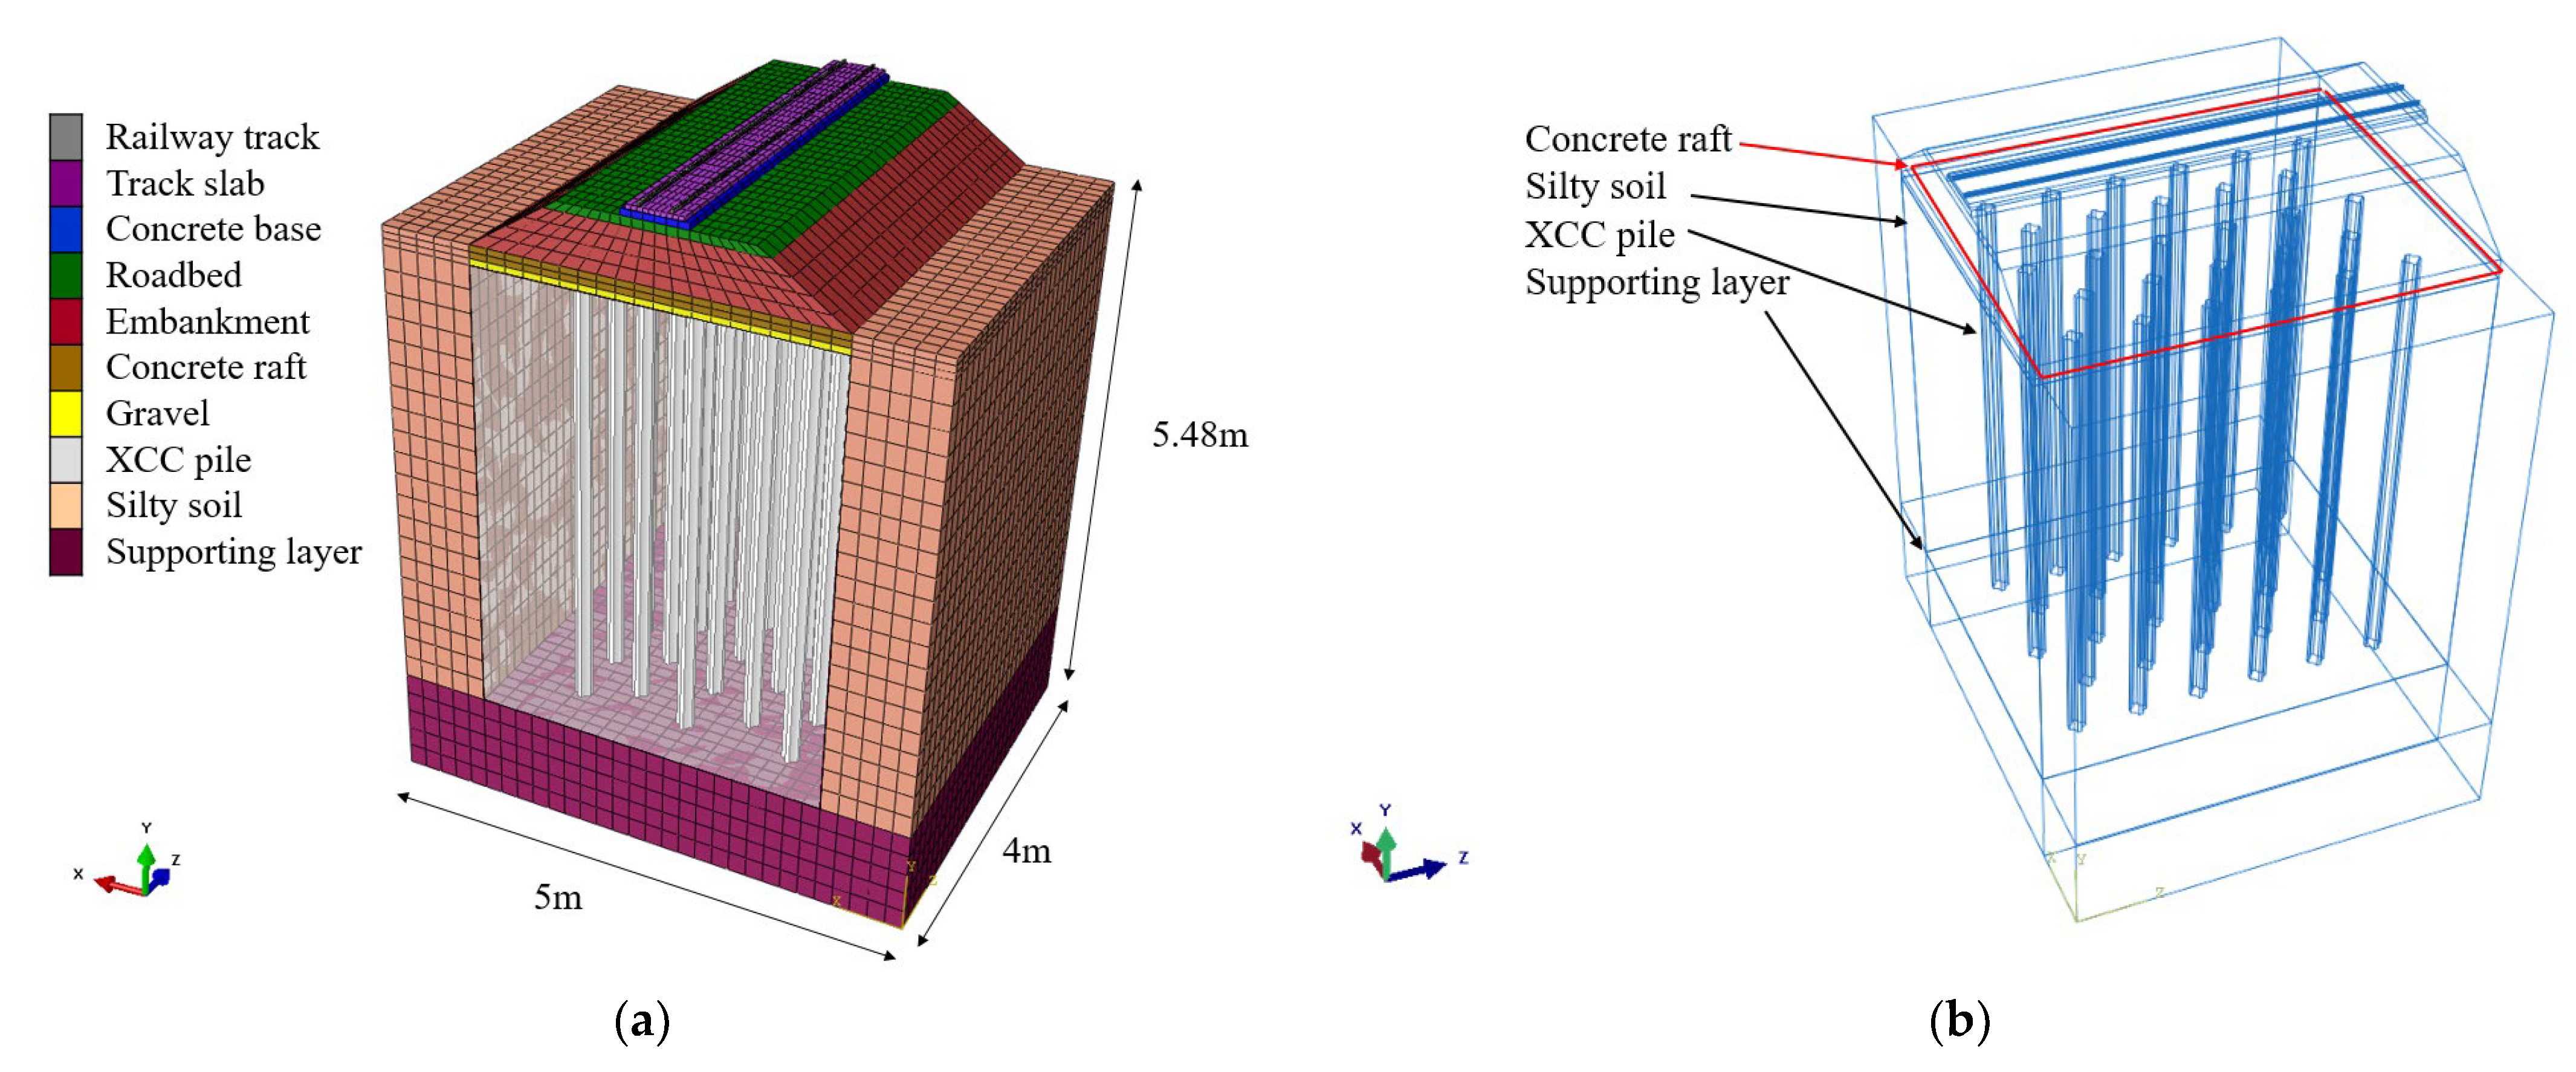
Figure 15.
Finite element model of the pile–raft composite foundation. (a) finite element mesh, (b) wireframe of the model.
Figure 15.
Finite element model of the pile–raft composite foundation. (a) finite element mesh, (b) wireframe of the model.
Figure 16.
Dynamic loading wave (v = 270 km/). (a) waveform of dynamic loading wave, (b) frequency distribution of dynamic loading wave.
Figure 16.
Dynamic loading wave (v = 270 km/). (a) waveform of dynamic loading wave, (b) frequency distribution of dynamic loading wave.
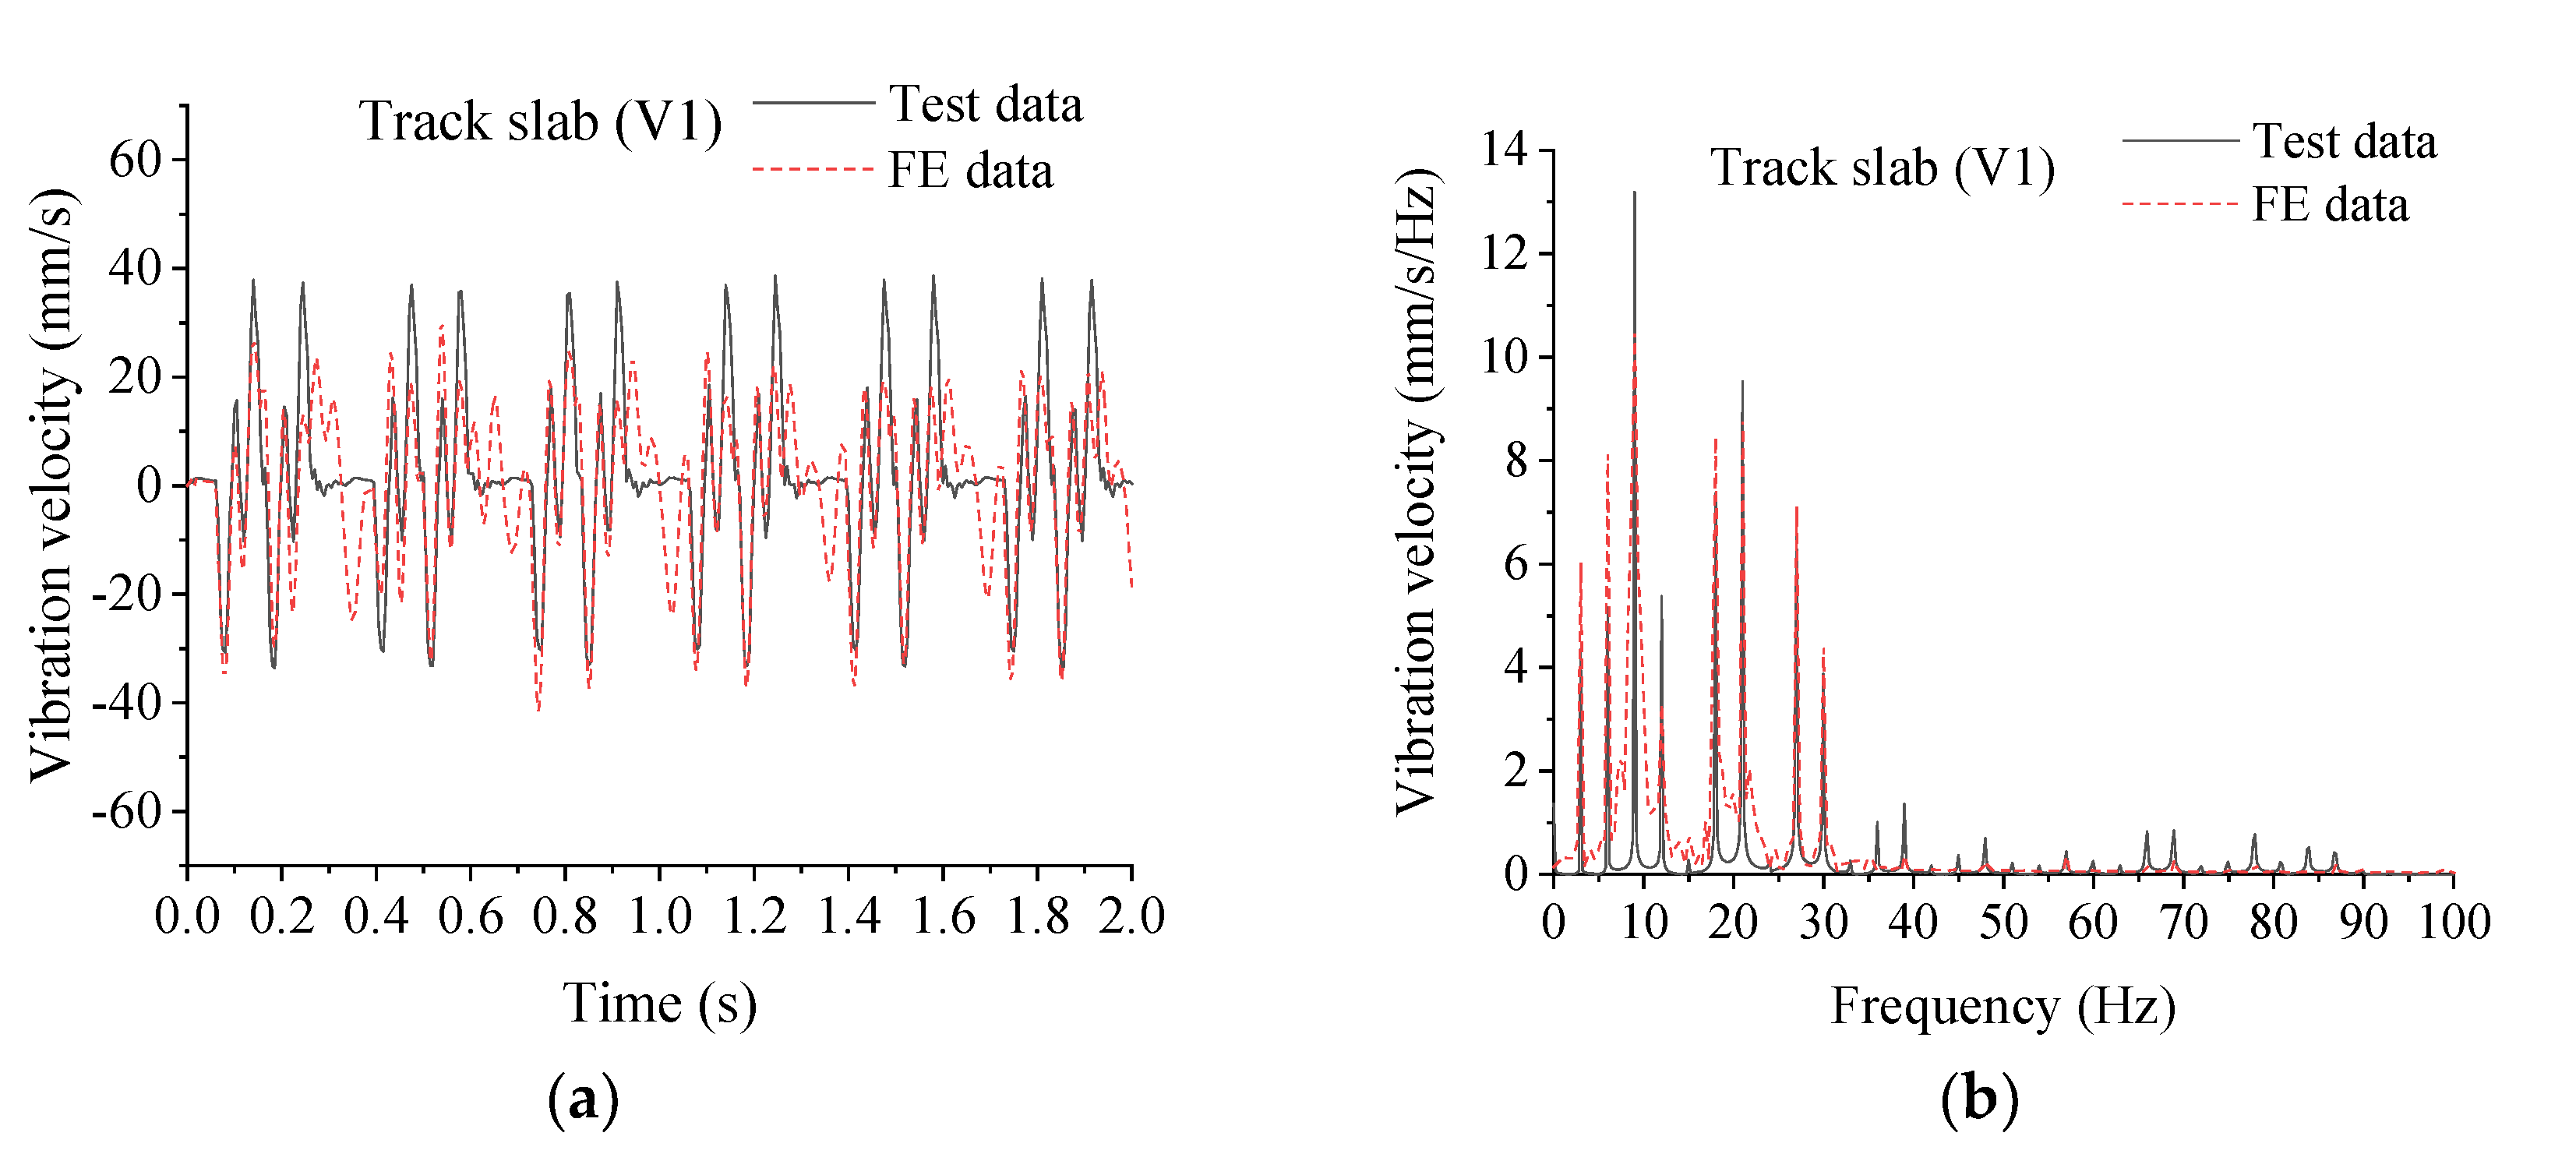
Figure 17.
Comparisons of the vibration velocity between the FE and test results for train speed v = 270 km/h. (a) Track slab (V1, time domain), (b) Track slab (V1, frequency domain), (c) Roadbed (V5, time domain), (d) Roadbed (V5, frequency domain), (e) Raft (time domain), (f) Raft (frequency domain), (g) Cushion (time domain), (h) Cushion (frequency domain), (i) Bottom of subsoil (time domain), (j) Bottom of subsoil (frequency domain).
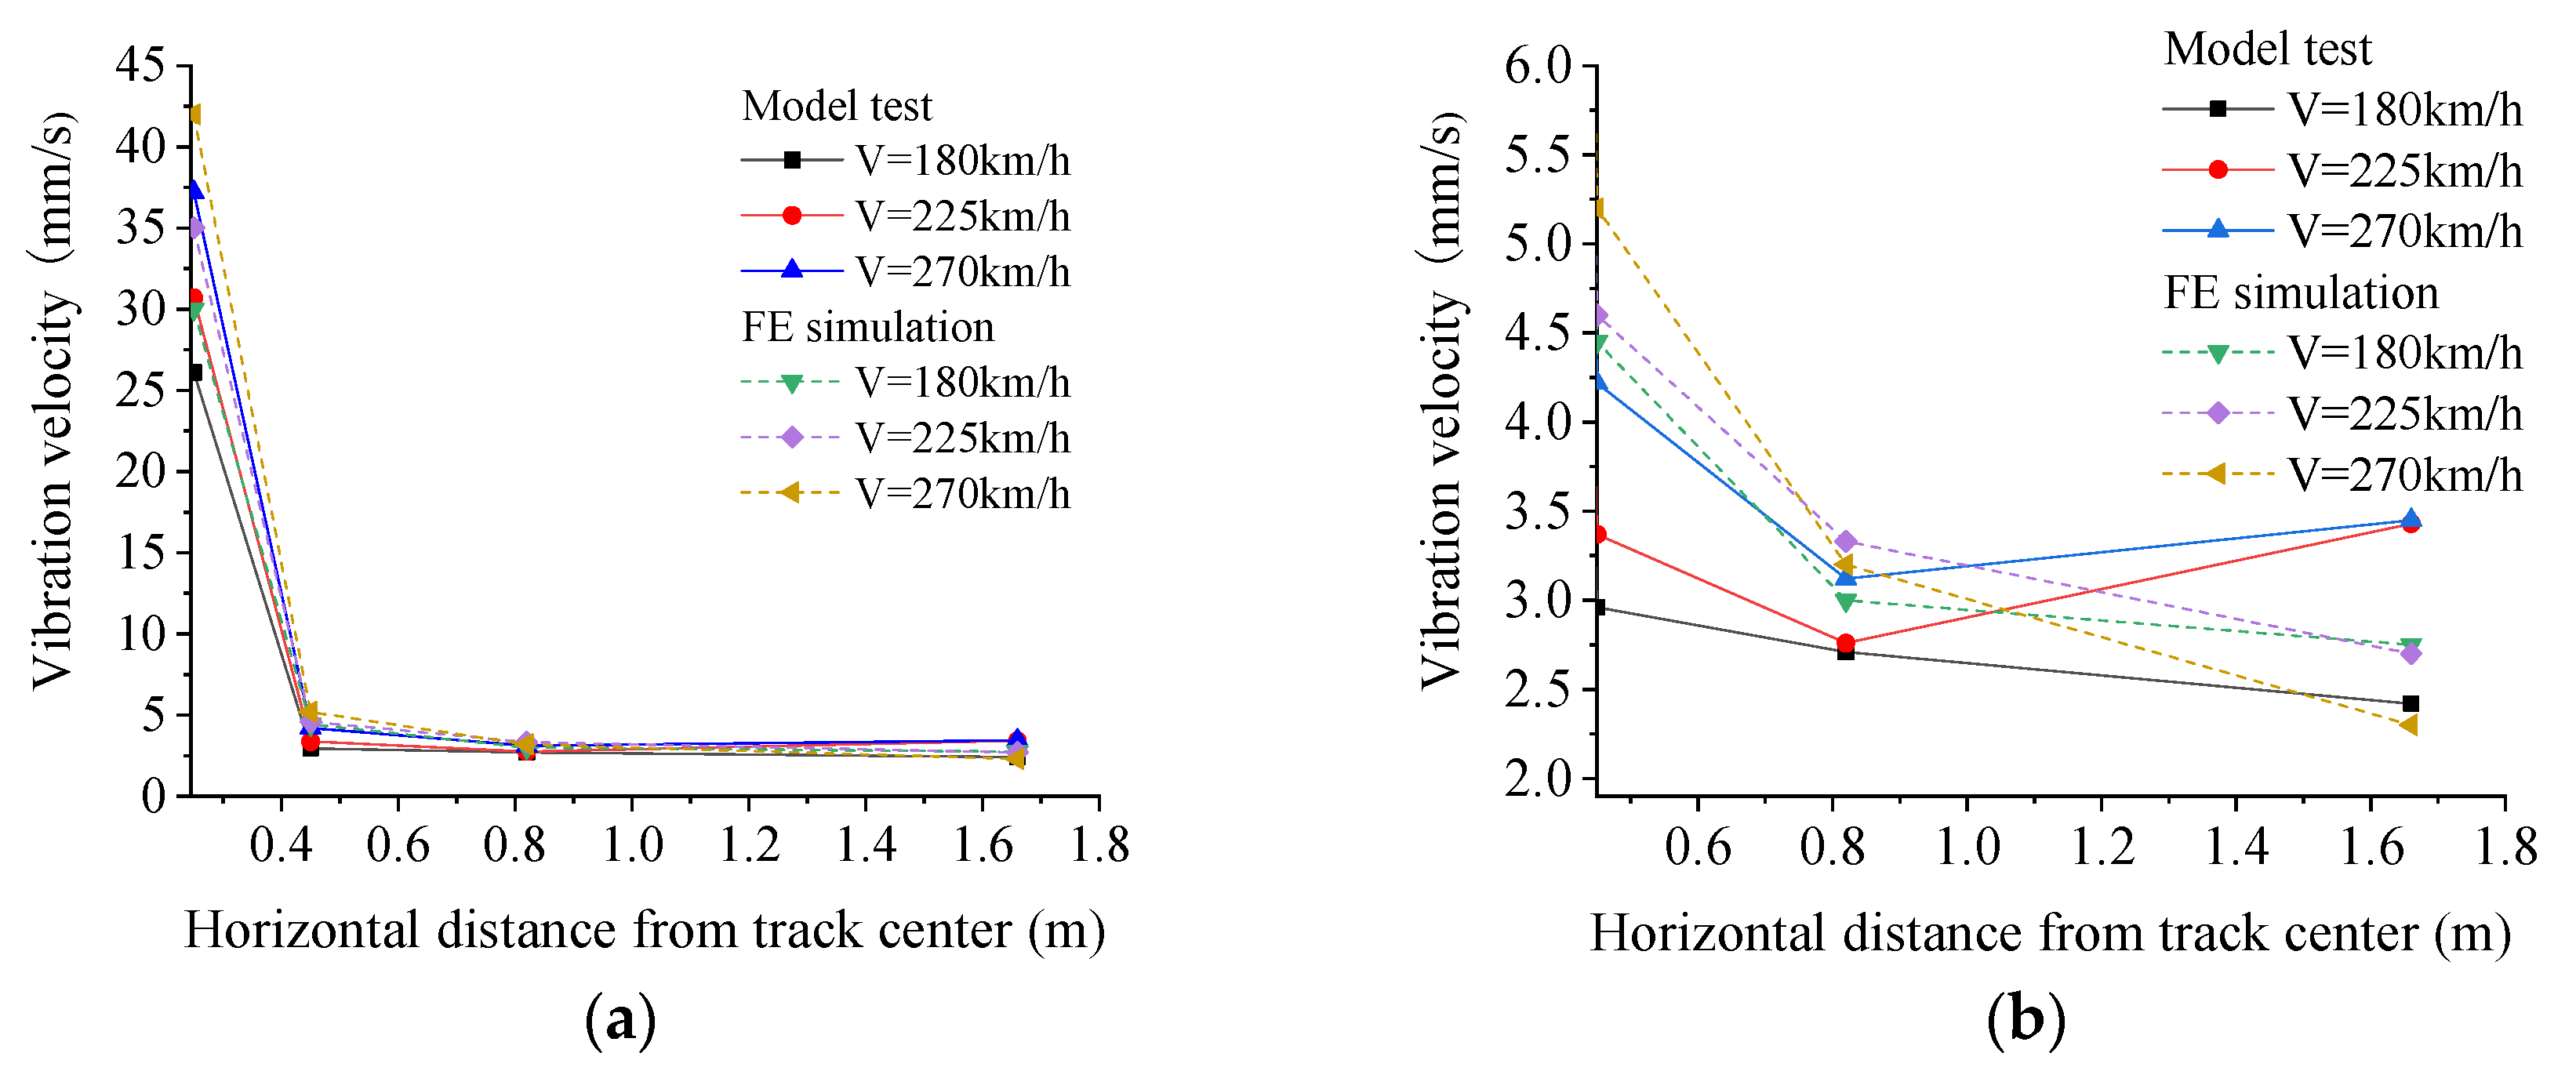
Figure 18.
Comparison of the vibration velocity attenuation along the horizontal direction. (a) V1–V4, (b) V2–V4.
Figure 18.
Comparison of the vibration velocity attenuation along the horizontal direction. (a) V1–V4, (b) V2–V4.
Figure 19.
Distribution of the vibration velocity along the depth from the roadbed.
Figure 19.
Distribution of the vibration velocity along the depth from the roadbed.
Table 1.
Physical properties and parameters of the geomaterials used.
Table 1.
Physical properties and parameters of the geomaterials used.
| Filling Materials | γ
(kN/m3) | w (%) | Dr (%) | Liquid Limit (%) | Plastic Limit (%) | Plastic Index | Cu | Cc |
|---|
| Silty soil | 18.6 | 27.8 | — | 31.0 | 24.1 | 6.9 | 2.76 | 1.71 |
| AB Granular | 21.9 | 5.35 | 63 | — | — | — | 6 | 2.89 |
| Gravel | 23.51 | 7.07 | 92 | — | — | — | 19.23 | 1.34 |
| Supporting layer | 19.43 | 25.5 | 69.5 | — | — | — | 2.42 | 0.93 |
Table 2.
Tested results of the embankment.
Table 2.
Tested results of the embankment.
| Parameters | K | K30/(MPa/m) | Evd (MPa/m) |
|---|
| Value | 0.97 | 243 | 98 |
Table 3.
Scale factors of the dynamic model test.
Table 3.
Scale factors of the dynamic model test.
| Geometry | Load | Stress | Volume | Frequency | Density | Velocity | Time | Length | Elastic Modulus |
|---|
| 1/5 | 1/25 | 1 | 1/125 | 5 | 1 | 1 | 1/5 | 1/5 | 1 |
Table 4.
Relationship between and different train speeds.
Table 4.
Relationship between and different train speeds.
| Train Speed V (km/h) | 45 | 90 | 135 | 180 | 225 | 270 |
|---|
| ω (rad/s) | 10.06 | 20.128 |
30.192 | 40.25 | 50.321 | 60.387 |
Table 5.
Characteristic parameter of the actuator loading time–history curve.
Table 5.
Characteristic parameter of the actuator loading time–history curve.
| Train Speed v (km/h) | 45 | 90 | 135 | 180 | 225 | 270 |
|---|
| Peak time T1 (s) | 0.2 | 0.1 | 0.0667 | 0.05 | 0.04 | 0.0333 |
| Cycle time T3 (s) | 2 | 1 | 0.667 | 0.5 | 0.4 | 0.3333 |
| Peak frequency (Hz) | 5 | 10 | 15 | 20 | 25 | 30 |
Table 6.
Data fitting results of peak velocities.
Table 6.
Data fitting results of peak velocities.
| Model | ExpDec1 |
|---|
| Equation | y = A1*exp(−x/t1) + y0 |
|---|
| Plot | v = 90 km/h | v = 180 km/h | v = 225 km/h | v = 270 km/h |
| y0 | 1.04 | 2.56 | 3.09 | 3.28 |
| A1 | 522.91 | 3890.77 | 8781.30 | 3080.76 |
| t1 | 0.065 | 0.048 | 0.0433 | 0.0555 |
| Reduced Chi-Sqr | 0.083 | 0.041 | 0.224 | 0.0548 |
| RSquare (COD) | 0.9991 | 0.9999 | 0.9996 | 0.9999 |
| Adjusted RSquare | 0.9973 | 0.9996 | 0.9988 | 0.9998 |
Table 7.
Vibration velocity attenuation rate in the horizontal direction.
Table 7.
Vibration velocity attenuation rate in the horizontal direction.
| Train Speed | v = 90 km/h | v = 180 km/h | v = 225 km/h | v = 270 km/h |
|---|
| Location | Rate | Rate | Rate | Rate |
|---|
| V1 | 0 | 0 | 0 | 0 |
| V2 | 87.36% | 88.66% | 89.02% | 88.75% |
| V3 | 90.00% | 89.62% | 91.01% | 91.68% |
| V4 | 93.28% | 90.73% | 88.83% | 90.80% |
Table 8.
Vibration attenuation rates of velocity along depth.
Table 8.
Vibration attenuation rates of velocity along depth.
| Train Speed | v = 90 km/h | v = 180 km/h | v = 225 km/h | v = 270 km/h |
|---|
| Depth/m | Rate | Rate | Rate | Rate |
|---|
| 0.15 (V5) | 62.03% | 30.74% | 33.53% | 0.47% |
| 0.5 (V6) | 63.29% | 33.11% | 35.61% | 39.57% |
| 0.7 (V7) | 69.62% | 57.43% | 60.24% | 62.56% |
| 1.7 (V8) | 75.95% | 63.51% | 66.17% | 64.45% |
| 2.9 (V9) | 84.18% | 74.66% | 67.95% | 68.01% |
| 4 (V10) | 89.87% | 78.04% | 79.82% | 73.22% |
| 5 (V11) | 94.94% | 85.84% | 87.33% | 89.34% |
Table 9.
Material parameters of the dynamic loading test.
Table 9.
Material parameters of the dynamic loading test.
| Structure Layer | Thickness (m) | Elastic Modulus E (MPa) | Mass Density (kg/m3) | Poisson’s Ratio | Damping Coefficient
(α, β) |
|---|
| Railway track | 0.03 | 210,000 | 78 | 0.2 | - |
| Track slab | 0.04 | 30,000 | 25 | 0.2 | - |
| Concrete base | 0.06 | 30,000 | 25 | 0.2 | - |
| Roadbed | 0.08 | 200 | 22 | 0.3 | - |
| Embankment | 0.46 | 120 | 20 | 0.3 | 1.2, 0.0004 |
| Concrete raft | 0.12 | 30,000 | 25 | 0.2 | - |
| Gravel | 0.06 | 200 | 20 | 0.3 | 1.2, 0.0004 |
| Silty soil | 4.3 | 20 | 15.6 | 0.35 | 1.66, 0.0033 |
| Supporting layer | 1.0 | 50 | 20 | 0.3 | - |
| Pile | 4.3 | 30,000 | 25 | 0.2 | - |
Table 10.
Vibration attenuation ratio of the velocity along depth.
Table 10.
Vibration attenuation ratio of the velocity along depth.
| Train Speed | v = 180 km/h | v = 225 km/h | v = 270 km/h |
|---|
| Depth/m | Model Test | FE Data | Model Test | FE Data | Model Test | FE Data |
|---|
| 0.15 | 30.74% | 31.46% | 33.53% | 30.43% | 0.47% | 35.58% |
| 0.5 | 33.11% | 35.96% | 35.61% | 36.52% | 39.57% | 43.65% |
| 0.7 | 57.43% | 38.20% | 60.24% | 38.04% | 62.56% | 39.42% |
| 1.7 | 63.51% | 34.83% | 66.17% | 37.17% | 64.45% | 37.50% |
| 2.9 | 74.66% | 38.65% | 67.95% | 39.13% | 68.01% | 49.62% |
| 4 | 78.04% | 62.47% | 79.82% | 60.87% | 73.22% | 65.00% |
| 5 | 85.84% | 69.66% | 87.33% | 69.13% | 89.34% | 69.81% |


