1. Introduction
The underground granary employs its natural environment, such as airtightness, low oxygen, constant temperature, and so on, to achieve advantages, such as inhibiting food pests and mildew and delaying food aging, and so on, which is an energy-saving, land-saving, and green ecological granary [
1,
2]. However, due to complex geological and hydrological conditions, the granary displacement and the soil deformation are extremely complex, and subjected to water buoyancy, resulting in the soil collapse and overall floating and even overturning of the underground granary, especially if the underground granary is empty, which is the most unfavorable condition [
3,
4]. The interaction between the granary and its surrounding soil under water buoyancy is the key to the safety and stability of the granary. However, the related research focuses on the mechanical properties of the granary under static load [
5,
6]. Microscopic displacement of soil particles during the granary movement subjected to water buoyancy has been not reported.
An underground granary is a hidden underground project, and it is difficult to observe the soil particle movement around the granary and the deformation of the granary [
7]. The available experimental technology is unable to meet the accuracy requirements because the measuring points of the invasive sensor are single and the sensor cannot be fixed for an object with a complex shape. In recent years, to overcome the shortcomings of invasive sensors, the non-contact measurement method with intuitive, efficient, convenient, and accurate characteristics has been widely used in experimental research [
8,
9,
10,
11,
12,
13,
14]. Dabous and Feroz [
8] comprehensively reviewed the non-contact testing (NCT) technology commonly used in the condition monitoring of concrete bridges, including defect detection, reinforcement corrosion, delamination, and cracking. Satapathy et al. [
9] used laser sensors designed in a laboratory to record the sensitivity of speckle signals measured at different distances. Chai et al. [
10] presented a non-contact optical measurement scheme, and, according to the cross-section data points obtained by the laser displacement sensor, the data points of the tooth top were separated, and the cross-section center was fitted. Wu et al. [
11] proposed a correlation-based image stitching method which was applied to these images, and an overlapping region minimization method and their corresponding displacement field and strain field were calculated based on digital image correlation (DIC). Xu et al. [
12] used non-contact video measurement technology to measure the displacement of the derrick model and compared the measurement results with the finite element analysis, and the results showed that the technology was an effective, low-cost, and low-artificial new method for derrick displacement measurement. Wang et al. [
13] obtained the full-field deformation distribution of sand sample surface by a plane strain experimental device and incremental reliability-guided digital image correlation (RG-DIC) technology, analyzed the evolution law of shear zone in sand, and determined the inclination angle and thickness of the shear zone, which showed that RG-DIC technology had good application effect in large deformation geotechnical experiment. Farfán-Cabrera et al. [
14] measured the Poisson’s ratio of three commonly used sealing elastomers by digital image correlation (DIC) and tested the mechanical properties of samples under three different constant stresses to understand the application prospect of DIC in mechanics. The accuracy of the non-contact video measurement method is verified to be satisfactory [
15,
16]. Therefore, the non-contact measurement technology is introduced into the underground granary, which can, in real time, record the trajectory of the granary, the position of the displacement mutation, and the whole process of unstable failure.
Currently, in geotechnical engineering, PIV technology has been used to study the observation of soil movement and the interaction between soil and structure [
17,
18,
19,
20,
21,
22,
23,
24]. White et al. [
19] applied PIV technology in geotechnical engineering experiment, which laid a foundation for the development of PIV technology in the geotechnical field. Jiang et al. [
20] developed small-scale physical modeling to investigate the bearing capacity of piles and the soil displacement around the pile using a transparent soil and particle image velocimetry (PIV) technique. Yuan et al. [
21] compared the stress–strain curves of transparent sand made of fused silica sand and natural sand, and found that the two are particularly similar, and the failure model of transparent sand was basically the same as that of standard sand. Yuan et al. [
22,
23,
24] studied the pile–soil interaction using PIV technology and transparent soil technology. Therefore, it is necessary to introduce the PIV technique to study the soil deformation around underground granaries and discuss the meso-motion law of soil particles around underground granaries.
In this paper, based on digital image correlation (DIC) technology and particle image velocity (PIV) technology, a non-contact experiment system is introduced to investigate the interaction between the underground granary and its surrounding soil. Firstly, a non-contact experiment system is prepared, and its accuracy is verified. Then, this system is employed to investigate the displacement of an underground granary and the deformation of the soil around the granary subjected to water buoyancy. Finally, the soil pressure theory regarding retaining walls is used to discuss the granary–soil interaction under the action of groundwater.
3. Results and Discussions
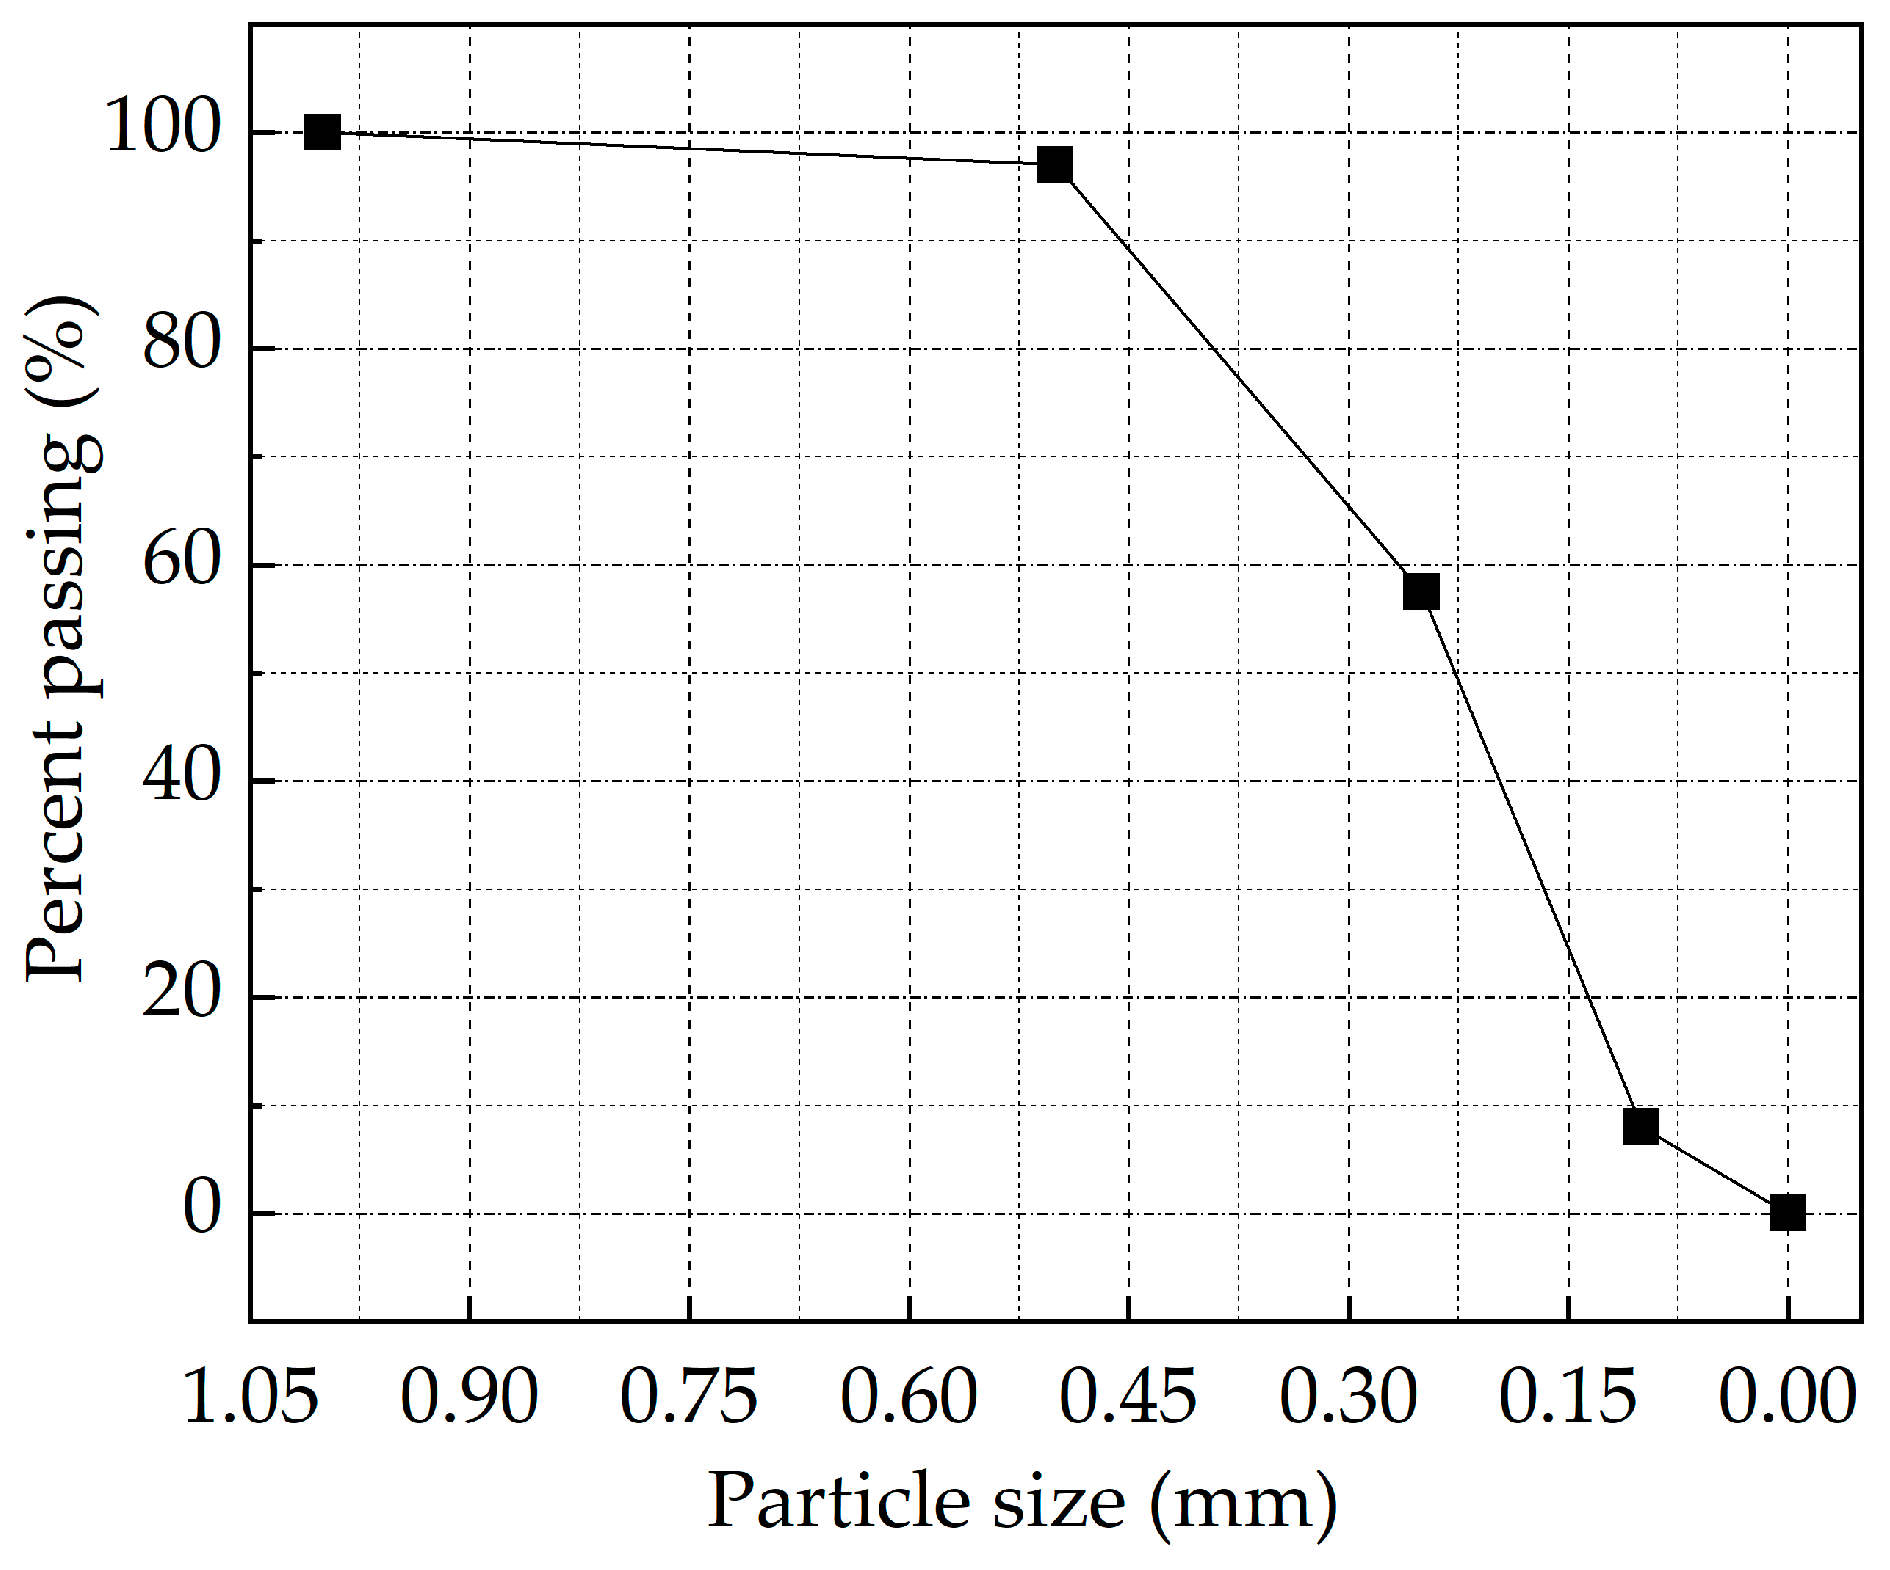
Loose sands, medium dense sands, and dense sands, as shown in
Table 2, were prepared as the soils around underground granary. The horizontal and vertical coordinates of the target point were recorded in real time by Video GaugeTM, and the trajectory of the granary was obtained based on the pixel equivalent conversion method and data collation. The sequence images of soil deformation under different working conditions were collected, and then the collected images were processed by MatPIV software [
28,
29]. The displacement cloud map and displacement vector map of the soil around the granary were obtained.
3.1. Displacement of Underground Granary
Figure 6 shows the displacement–time curves of the target points in the horizontal and vertical directions. When the soils around the granary are loose sands, the displacement trajectory of the granary is roughly divided into four stages named as the stability stage (before 152 s), floating stage (152 s to 170 s), inclined stage (170 s to 175 s), and unstable failure stage (after 175 s), respectively.
Before 152 s and 158 s, the granary does not move in vertical and horizontal directions, respectively. The reason is that the soil around the granary is not fully saturated, and the water buoyancy at the bottom of the granary is less than or equal to the sum of the gravity of the granary and the friction between the granary and the soil around the granary. After 152 s, with the increase of water supply pressure time, the vertical displacement of the granary increases nonlinearly. The gap between soil particles is filled with water, resulting in the soil reaching a fully saturated state. With the increase of pore water pressure, the friction between particles decreases, resulting in increasing the granary displacement. Therefore, 152 s is the time for the granary to float, and the corresponding water level is 32.5 cm, as shown in
Figure 7a. In the horizontal direction, after 158 s, the granary begins to shake around, and after 170 s, the granary tilts toward left. After 175 s, the horizontal displacement of the granary suddenly changes which indicates that the granary experiences instability failure, and the corresponding vertical displacement is about 45.0 mm.
When the soils around the granary are the medium dense sands, the displacement trajectory of the granary is roughly divided into four stages, named as the stability stage (before 242 s), floating stage (242 s to 262 s), inclined stage (262 s to 278 s), and instability stage (after 278 s). The floating time of the granary is 242 s, and the corresponding floating water level is 34 cm, as shown in
Figure 7b. In the floating stage, compared with the loose state, the time of resisting water buoyancy of the granary increases, and the displacement of the granary decreases significantly. With the increase of degree of compaction of the soil around the granary, the weight of soil in unit volume increases, and the mutual friction between particles increases, which increases the friction between the soil and granary wall. After 278 s, the horizontal displacement changes suddenly, which indicates that the granary experiences instability failure. The corresponding vertical displacement is about 37 mm, which is reduced by 17% compared with that of the loose sands around the granary.
When the soils around the granary are dense sands, with the increase of water supply pressure time, the vertical displacement trajectory of the granary shows a slow upward trend, and the horizontal displacement is small. The displacement trajectory of the granary is roughly divided into three stages, named as the relative stability stage (before 510 s), floating stage (510 s to 520 s), and inclined stage (520 s to 580 s). The maximum displacement of the granary in the horizontal direction is about 12 mm, and the granary does not experience unstable failure. The floating time point of the granary is 510 s, and the corresponding floating water level is 36 cm, as shown in
Figure 7c. In the floating stage, compared with the loose sands and medium dense sands, the compactness of the soil around the granary is greatly improved. The pores between the soil particles are compressed and the mutual embedded force is enhanced, which cause the lateral friction resistance on the granary wall to increase, resulting in the unit volume of soil limiting further displacement of the granary. From 520 s to 580 s, the granary experiences slight fluctuation. After 580 s, the granary begins to tilt until the water level of the model tank reaches the water level at the end of the experiment, resulting in unstable failure. In conclusion, because the soils around the granary are dense soils with high strength, its ability to resist unstable failure is strong, which is beneficial to the stability of the granary.
In summary, in the stability stage, the larger the degree of compaction of the soil around the granary is, the longer the time for the granary and the soil to coordinate and interact with each other to resist water buoyancy is. Water buoyancy at the bottom of the granary is less than or equal to the sum of the weight of the silo and the frictional resistance of the surrounding soil to the granary wall. In the floating stage, the floating water levels are 32.5 cm, 34 cm, and 36 cm for the loose sands, medium dense sands, and dense sands around the granary, respectively, which is increased by 10.77%. The reason is that with the increase of the degree of compaction, the mutual friction between soil particles and the friction resistance on the wall of the granary increase, the anti-floating ability of the granary increases, and the vertical displacement of the granary decreases under water buoyancy. In the inclined stage, with the increase of relative compactness of soil around the granary, the horizontal displacement of the granary decreases. The reason is that the embedding between soil particles is more compact, and the self-stability of the soil is improved. The soil particles per unit volume can resist larger horizontal displacement of the granary. In the unstable failure stage, with the increase of soil compactness around the granary, the time course of the granary from floating to critical failure increases. When the soils around the silo are medium dense sands, compared with loose sands, the vertical displacement of the granary at the critical point of unstable failure decreases by 17%. When the soils around the granary are dense sands, the granary does not experience instability failure. This is because the strength of the dense soil is high and its ability to resist instability failure is improved, which is conducive to the stability of the granary.
3.2. Deformation of the Soils around the Underground Granary
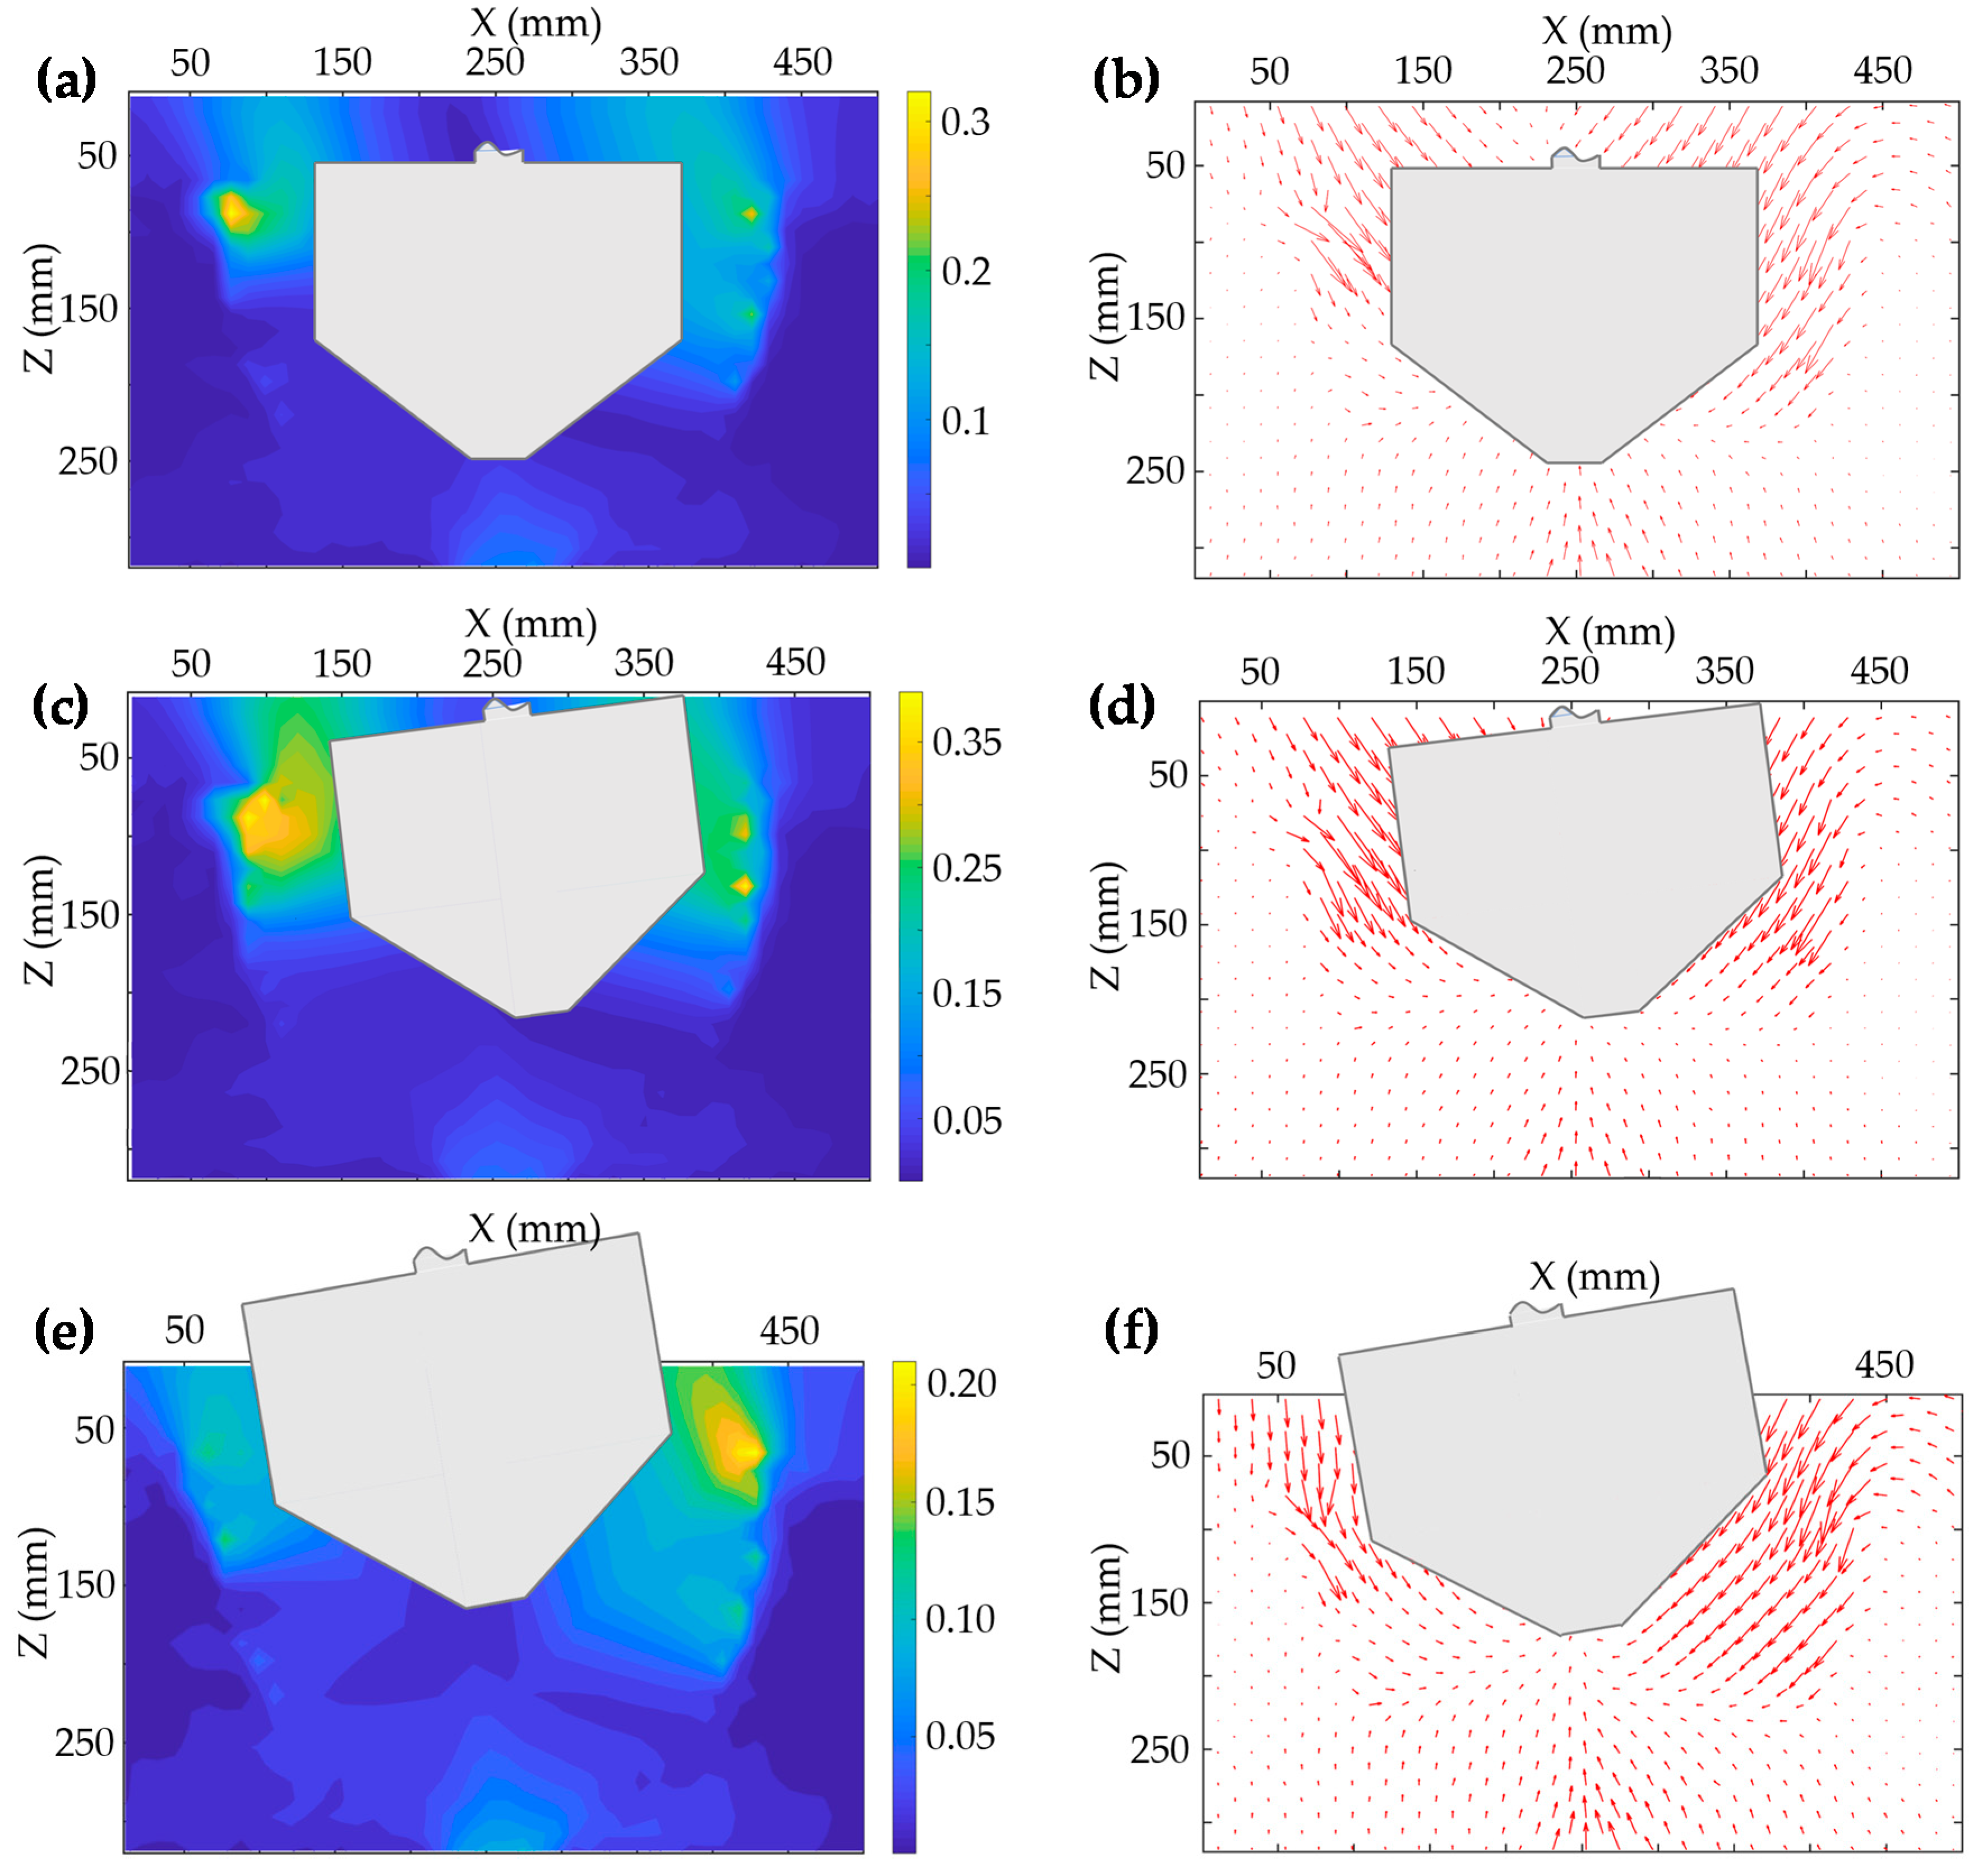
Particle image velocimetry (PIV) technology was used to collect the movement of soil particles around the granary during the experiment. Based on the MatPIV digital image processing technology, the collected sequence images were processed to obtain the displacement vector field and displacement cloud image of the soil around the granary subjected to water buoyancy. The displacement vector diagram and displacement cloud diagram of the surrounding soil in the floating stage, inclined stage, and unstable failure stage of the granary are shown in
Figure 8,
Figure 9 and
Figure 10.
When the soils around the granary are loose sands, as shown in
Figure 8, in the floating stage, the deformation of the soil at the bottom of the conical granary is small, and the deformation range of the soil around the granary wall and the top of the granary is large. The soil far away from the granary is disturbed and slightly deformed.
In the inclined stage, compared with the floating stage, with the increase of groundwater level, the disturbance range of soil around the granary increases and the local large deformation area appears. It indicates that the soil deformation and the displacement of granary are mutually affected. The water buoyancy on the granary and the soil around the granary increases, the effective stress in the soil decreases, and the self-stability of the soil around the granary decreases. It is difficult to resist the disturbance of the granary in the horizontal direction. Due to the rotation of the granary under the action of water buoyancy, the original equilibrium state of the granary–soil system is broken, and the soil around the granary experiences local deformation, which causes the granary to incline. With the increase of the inclination of the granary, the soil displacement increases continuously to reach the limit equilibrium state. The soil produces a continuous sliding surface and the soil near the top of the granary produces obvious subsidence. Due to the increase of the inclination of the granary, the bottom of the conical granary is empty, which causes the groundwater level to decrease. The excess pore water pressure of loose sand is reduced, and the surrounding soil develops obvious deformation. At this time, the soil expands from local deformation to overall deformation, and the granary–soil stability system is completely broken. Due to the increased inclination of the granary, the bottom of the conical granary is empty, which leads the groundwater level to decrease. The excess pore water pressure of loose sand is reduced, and the deformation of the surrounding soil is obvious. At this time, the soil around the granary expands from local deformation to overall deformation, the granary–soil stability system is completely broken, and the granary experiences unstable failure.
When the soils around the granary are medium dense sands, as shown in
Figure 9, in the floating stage, with the increase of relative density of soil, the deformation and deformation range of soil around the granary decrease, and there is no obvious soil displacement at the bottom and top of the granary. The reason is that the porosity between particles decreases, and the internal friction angle of particles increases, which increases the lateral friction resistance of the contact surface between sand particles and the granary body, limits the displacement of the granary body to a certain extent, reduces the movement between particles, and reduces the deformation and deformation range of the soil. The reason is that the porosity between soil particles decreases, and the internal friction angle of particles increases, which increases the lateral friction resistance of the contact surface between sand particles and the granary. Thus, the displacement of the granary is limited to a certain extent, resulting in the decrease in the deformation amount and deformation range of soil. In the inclined stage, the soil around the granary develops obvious asymmetric deformation. The local soil around the granary reaches the limit equilibrium state and moves downward along the granary wall. With the increase of the water buoyancy of the granary and the soil around the granary, the internal pores of the soil around the granary are filled with water, and the effective stress of the soil and the anti-slip ability of the unit volume are reduced, resulting in the increase of the deformation of the soil. The ultimate capacity of the soil around the granary to resist shear failure is reduced, and the granary–soil system is destroyed.
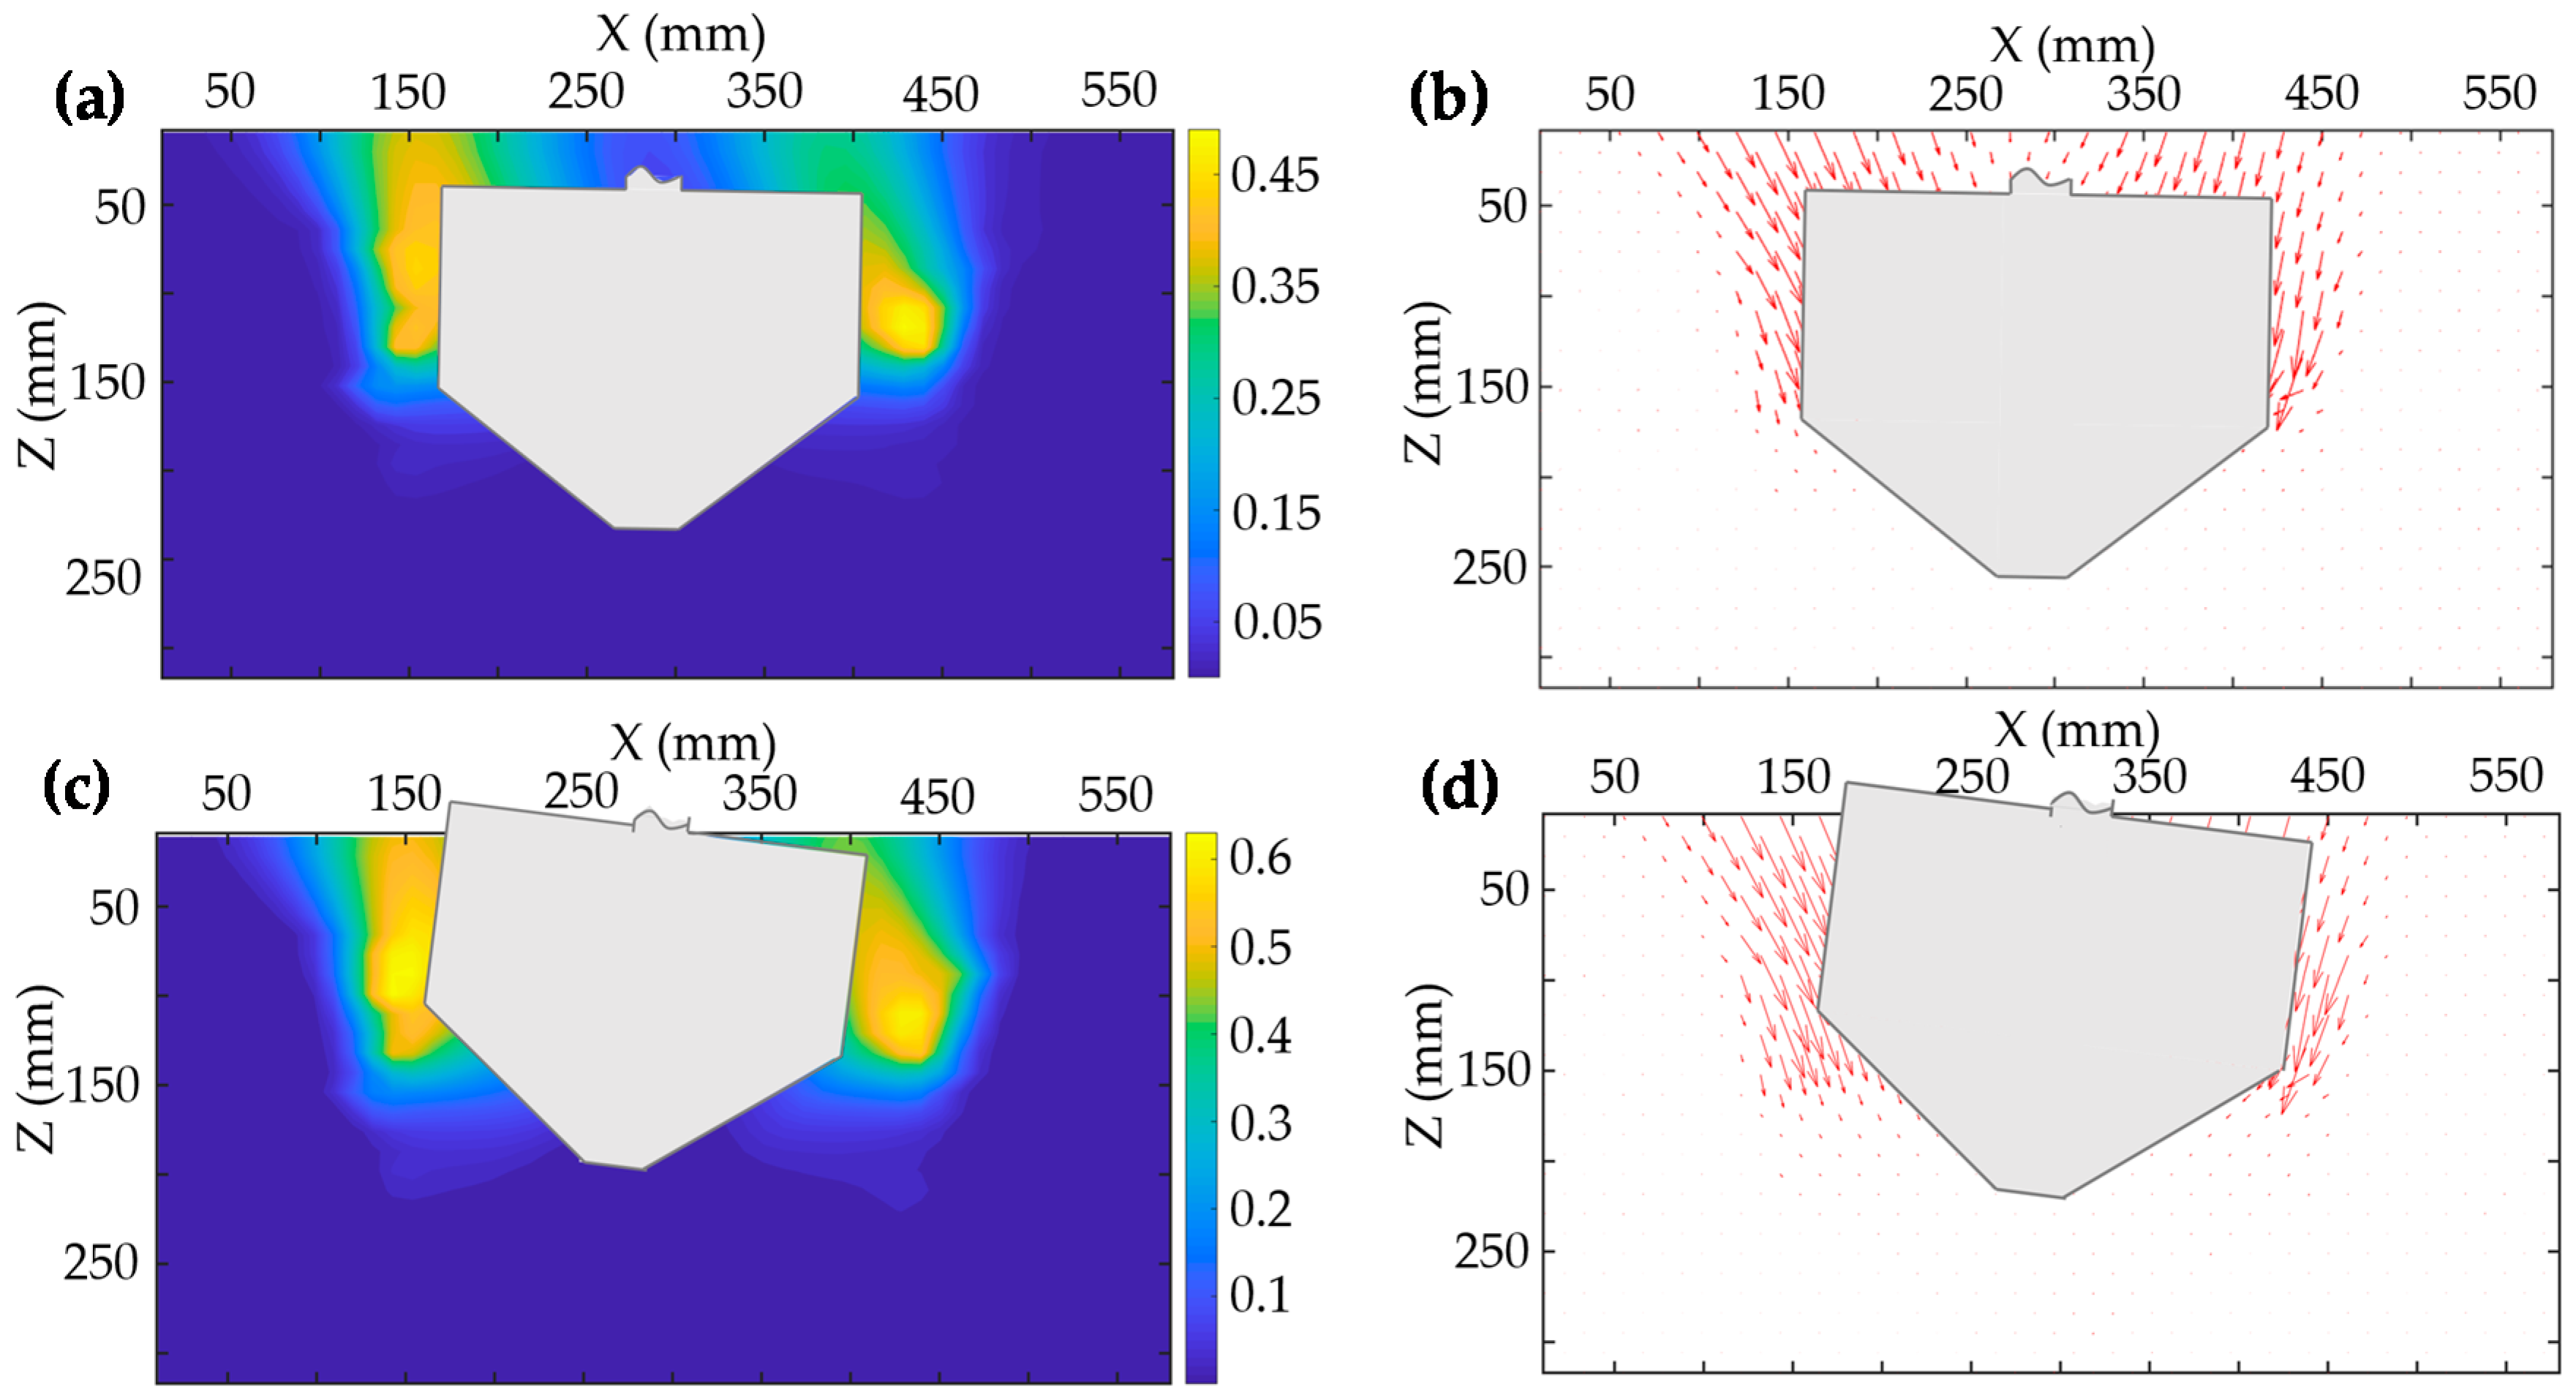
When the soils around the granary are dense sands, as shown in
Figure 10, the deformation amount and deformation area of the soil around the granary are significantly reduced. In the floating stage, there was no obvious soil displacement below the conical granary. It shows that with the increases of the relative density of soil and the internal friction angle between particles, the ultimate capacity of the soil around the granary to resist shear failure is enhanced. In the tilt stage, the direction of soil displacement along the wall downward did not show obvious tilt. The mutual embedded force between soil particles increases, which reduces the relative motion between particles, and further reduces the deformation range of soil around the granary.
3.3. Analysis of the Interaction between the Granary and Its Surrounding Soil
Taking the medium dense sands around the granary as an example, the earth pressure theory of retaining walls is used to explain the interaction between the granary and soil under groundwater buoyancy from the displacement of the granary and the stress state of the sands around the granary.
Figure 11 shows the collected images of the granary corresponding to eight time points during the experiment: Time 1, Time 2, and Time 3 are in the floating stage, Time 4, Time 5, and Time 6 are in the inclined stage, and Time 7 and Time 8 are in the unstable failure stage.
In the floating stage shown in
Figure 11a–c, the granary moves upward under the action of groundwater buoyancy, and the soils at the junction of the conical granary bottom and granary wall are squeezed to develop an upward uplift trend. At this stage, the junction of the conical granary bottom and granary wall bears passive water and soil pressure. With the increase of groundwater level, the granary displacement increases, as well as the soil deformation. The soils at the junction of the conical granary bottom and granary wall reach the limit equilibrium state, and the local soil around the granary develops shear failure. In the inclined stage, as shown in
Figure 11d–f, due to the cohesive force of the conical bottom, the relative motion of soil particles decreases. The hollowing under the conical granary bottom leads to the subsidence of the soil around the granary top. With the gradual increase of granary displacement, the original granary–soil relative stability system is broken. The soil at the junction of the conical granary bottom and granary wall is locally unstable and slips to the vacancy of the granary bottom, resulting in the shear failure of local soil around the granary.
In the unstable failure stages shown in
Figure 11g,h, with the increase of the inclination of the granary, the soil deviating from the inclination direction of the granary body passes its constraint and reaches the active limit state. At this point, the earth pressure acting on the inclined side of the granary is the minimum. The soils in the inclined direction of the granary are squeezed and the wall of the inclined side bears passive earth pressure. The displacement of the sands around the granary increase continuously to reach passive limit equilibrium state, and this produces continuous sliding. At this time, the soil around the granary expands from local deformation to overall deformation, the granary–soil stability system is completely broken, and the granary develops unstable failure. In summary, under the action of groundwater, the displacement of the granary is an important factor causing soil deformation and soil pressure change. The soil pressure acting on the granary cannot be separated from the displacement of the granary and the surrounding soil. For the stability of the granary–soil system, the granary and soil interact with, restrict, and influence each other.
4. Conclusions
In this paper, a non-contact test system was presented to obtain the displacement–time curves of the granary and the displacement vector map and displacement cloud map of soil around the granary under different working conditions. On this basis, the influences of relative density of the soil on the displacement of granary and the soil around the granary were analyzed. Finally, the soil pressure theory regarding retaining walls was used to discuss the granary–soil interaction under the action of groundwater. The following conclusions were obtained.
(1) The presented non-contact experiment system can overcome the shortcomings of traditional experiment methods, i.e., strain gauge cannot be accurately fixed, strain gauge failure, single measurement direction, and so on. It provides a new method for the study of soil–structure interaction under groundwater buoyancy.
(2) Under the action of groundwater buoyancy, the vertical displacement is large, and the horizontal displacement is small. With the increase of relative compactness of the soil around the granary, the uplift water level of the granary increased by 10.77%, and the vertical displacement of the granary at the critical point of the unstable failure decreased by 17%. Due to the soil around the granary from loose state to dense state, the mutual embedded force between soil particles increases, which reduces the relative motion and anti-slip ability between particles, resulting in reducing the deformation and disturbance range of soil around the granary.
(3) For the stability of the underground granary, its displacement subjected to water buoyancy is an important factor causing soil deformation and soil pressure to change. The earth pressure acting on the granary cannot exist independently from the granary and the surrounding soil, and they interact with, restrict, and influence each other. In engineering, the influence of the soil around the granary on the anti-floating property of the underground granary and the stability of the granary–soil system cannot be ignored.


