Article

Causal Models for the Result of Percutaneous Coronary Intervention in Coronary Chronic Total Occlusions

1
School of Informatics, Aristotle University of Thessaloniki, GR-54124 Thessaloniki, Greece
2
School of Medicine, Aristotle University of Thessaloniki, GR-54124 Thessaloniki, Greece
*
Author to whom correspondence should be addressed.
Appl. Sci. 2021, 11(19), 9258; https://doi.org/10.3390/app11199258
Submission received: 21 August 2021 / Revised: 28 September 2021 / Accepted: 1 October 2021 / Published: 5 October 2021
(This article belongs to the Special Issue Data-Driven Biomedical Research and Applications)

Abstract

:
Background: Patients undergoing coronary angiography very frequently exhibit coronary chronic total occlusions (CTOs). Over the last decade, there has been an increasing acceptance of the percutaneous coronary interventions (PCI) in CTOs due to, among else, rising operator experience and advances in technology. This study is an effort to address the problem of identifying important factors related to the success or failure of the PCI. Methods: The analysis is based on the EuroCTO Registry, which is the largest database available worldwide, consisting of 164 variables and 29,995 cases for the period 2008–2018. The aim is to assess the dynamics of causal models and causal discovery, using observational data, in predicting the result of the PCI. Causal models use graph structure to assess the cause–effect relationships between variables. In this study, the constrained-based algorithm PC was employed. The focus was to find the local causal structure around the PCI result and use it as a feature selection tool for building a predictive model. Results: The model developed was compared with other modeling approaches from the literature, and it was found to perform equally well or better. Conclusions: The analysis showcased the potential of employing local causal structure in predictive model development.

1. Introduction

Coronary chronic total occlusions (CTOs) are defined as occlusions with at least 3 months duration, and thrombolysis in myocardial infarction flow grade 0 (TIMI = 0) [1]. It is a very common condition for patients undergoing coronary angiography with approximately 20% of the patients exhibiting CTOs. They are considered the most complicated malfunctions of coronary arteries that a cardiologist might address. During the last decade, there has been an increasing acceptance of the percutaneous coronary interventions (PCI) in CTO, with an increasing success rate [1]. PCI is a nonsurgical procedure used to treat narrowing of the coronary arteries of the heart found in coronary artery disease. The process involves combining coronary angioplasty with stenting. The success rate of PCI has been increased by, among other reasons, operator experience and advances in technology, both having a positive impact in the success of the operation, and currently achieving levels of even 93%.
There exist several attempts in the literature to assess the impact of different predictor variables to the success or failure of the PCI, ranging in size of the dataset from a few hundred cases [2] to approximately 20,000 [3]. In most studies, the authors develop a scoring system that categorizes patients in risk groups relevant to the success of the operation [2,3,4,5,6,7]. The operation success ranges from 50% in the seminal paper of Morino et al. [2] to 93% in [5].
The current study is based on the largest database available worldwide (EuroCTO Registry), which consists of 29,995 cases referring to the period 2008–2018 (including demographic data, clinical, anatomic, procedure parameters, etc.). The motivation in this study was to assess the dynamics of causal models and causal discovery, using observational data, in predicting the result of the PCI. Causal models are used for the first time in this context to the best of our knowledge. Current approaches are mainly based on standard regression analysis and standard correlation assessment, to detect the most appropriate predictor variables for the response variable of interest. Causal models, on the other hand, aim to discover the cause–effect relationships between variables. The focus in this paper was to find and use the local causal structure around the response/target variable (i.e., operation result) to predict its outcome, particularly the so-called Markov blanket. By definition, the Markov blanket of a variable T is the minimal variable subset conditioned on which all other variables are probabilistically independent of T. The Markov blanket of T consists of the variables representing its parents, children, and other parents of its children in the graph (spouses). Using the Markov blanket of the response variable constitutes one of the emerging successful filtering approaches in variable selection [8].
In [9], the authors used causal models, particularly the probabilistic graphical models, to assess whether lung cancer prediction can be improved. The motivation in their approach was that the Markov blanket around a target variable contains, by definition, the most informative variables for the target variable. They found that their modeling approach, which was based on causal graphs, performed better than other competitive models in the literature. In [10], the authors used extensive simulations to assess the usage of Markov blanket as a feature selection tool compared to other methodological schemes. Particularly, they compared the predictive accuracy of eight logistic regression-based models, in which the set of predictors was selected with a different reasoning. Their results demonstrated empirically that the Markov blanket-based logistic regression model performed equal to or better than all its competitors. The authors argued that using causal models to identify the Markov blanket of a target variable might be a useful, efficient strategy to select predictors in clinical risk prediction models.
The aim of this study is to assess the dynamic of the Markov blanket as a feature selection tool for detecting predictors that are causally related with the result of the PCI, and therefore can be used as input for models predicting the PCI success or failure.

2. Materials and Methods

2.1. Patient Population

The EuroCTO club is a collaborative effort among high-volume CTO operators in 55 European centers aimed at sharing experiences and outcomes data. The EuroCTO registry is an electronic database, developed by EuroCTO club, including data since 2008, related to patients in whom chronic total occlusion (CTO) recanalization was attempted. In this database, multiple variables are recorded for every patient regarding preprocedural demographic and anatomical characteristics, procedural details, and postprocedural outcomes. It is the largest registry worldwide, including 29,995 cases. The data for this analysis refers to a 10 years’ time period starting in 2008.

2.2. Definitions

  • The degree of calcification was visually estimated on fluoroscopy, defined as moderate when one-half of the total CTO segment exhibited visible residues, and as severe when the extension of calcification was >50% of the segment.
  • Arterial tortuosity arises from abnormal elongation of the arteries and is characterized by blood vessel abnormalities, particularly abnormal twists and turns. The CTO was defined as straight if the pre-occlusive segment contained a bend of <70; moderate when a segment contained either two bends >70, or one bend >90; and as severe when it contained either two or more pre-occlusive bends of >90, or at least one bend of >120.
  • The length of coronary occlusions was visually estimated from angiographic projections with single- or dual-contrast injections.
  • Chronic obstructive pulmonary disease (COPD) is a chronic inflammatory lung disease that causes obstructed airflow from the lungs. It is characterized by long-term respiratory symptoms and airflow limitation.
  • The morphology of the vessel stump was characterized as tapered, blunt, or unseen, depending on its appearance on fluoroscopy. The angiographic assessment of collateral connections was made according to the Werner classification.
  • Dyslipidemia is present when an abnormally high amount of lipids is present.
  • Renal failure is a long-term condition of kidney malfunction.
  • Family history of coronary disease is present when one or more close relatives had early coronary artery disease (men <55 years, women <65 years).
  • Peripheral disease was defined when abnormal narrowing of arteries was present.
  • Segmental regional abnormalities were defined as regional abnormalities in contractile function.
  • Previous MI was defined as documented history of previous myocardial infarction.
  • In-stent CTO was defined when CTO inside a previous PCI existed.
  • CTO location represented the vessel in which the CTO is located.
  • Previous CABG corresponded to history of coronary artery bypass surgery.
  • Technical success was defined as a residual stenosis of <10% at the end of the procedure with TIMI flow grade three antegrade flow.
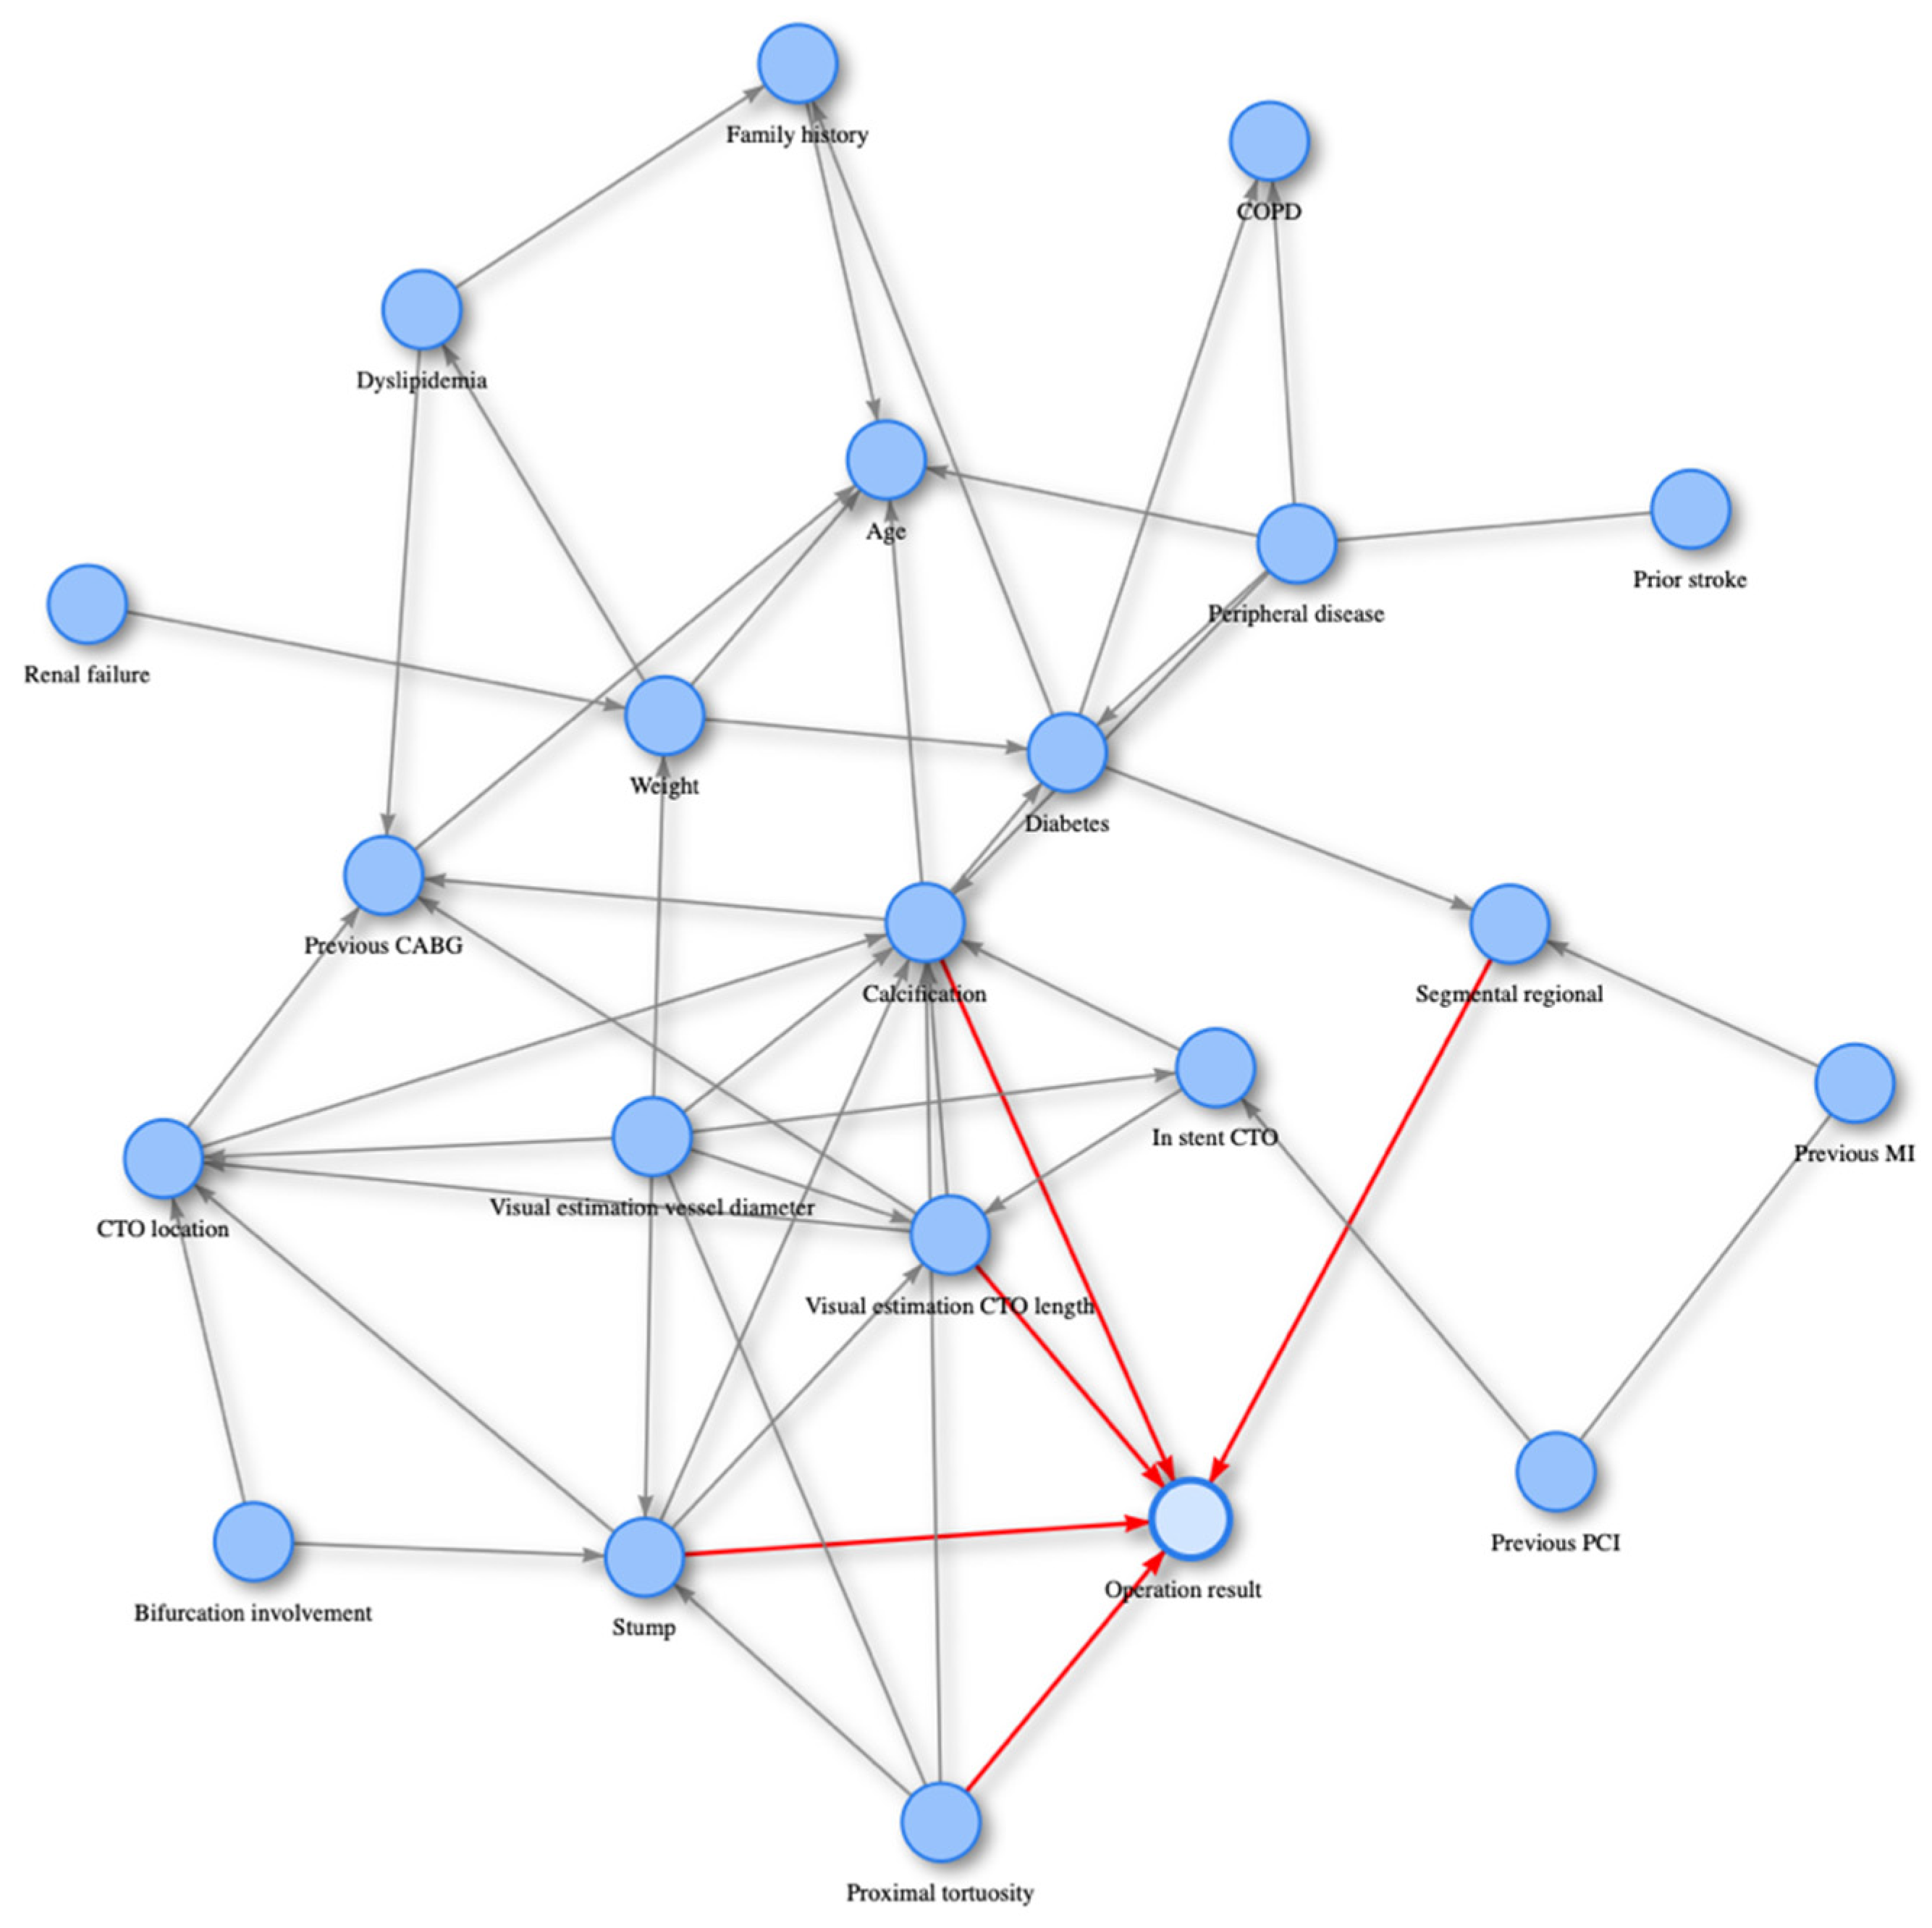
2.3. PC Algorithm

The PC algorithm [11,12] is a method commonly used to learn the structure of a causal Bayesian network. More specifically, for each pair of variables (X, Y) in a dataset, the PC algorithm tests their conditional independence given the remaining variables, and it claims the nonexistence of a causal relationship between X and Y, i.e., no edge to be drawn between X and Y in the corresponding graph, when X and Y are independent given some other variables. Practically, the PC algorithm assesses the association conditioning on all subsets of all variables other than X and Y, in order to determine whether there exists a persistent association between X and Y [13]. The relationship is causal when the association exists given each of the conditioning sets. A network with a structure consistent with the results of the tests of independence is returned. It is assumed that causal sufficiency [12], which is a typical condition for the aforementioned algorithm, holds. This condition requires that for every pair of measured variables, all their common direct causes are also measured. In other words, there are no hidden, unmeasured confounders for any pair of variables.

2.4. Statistical Analysis

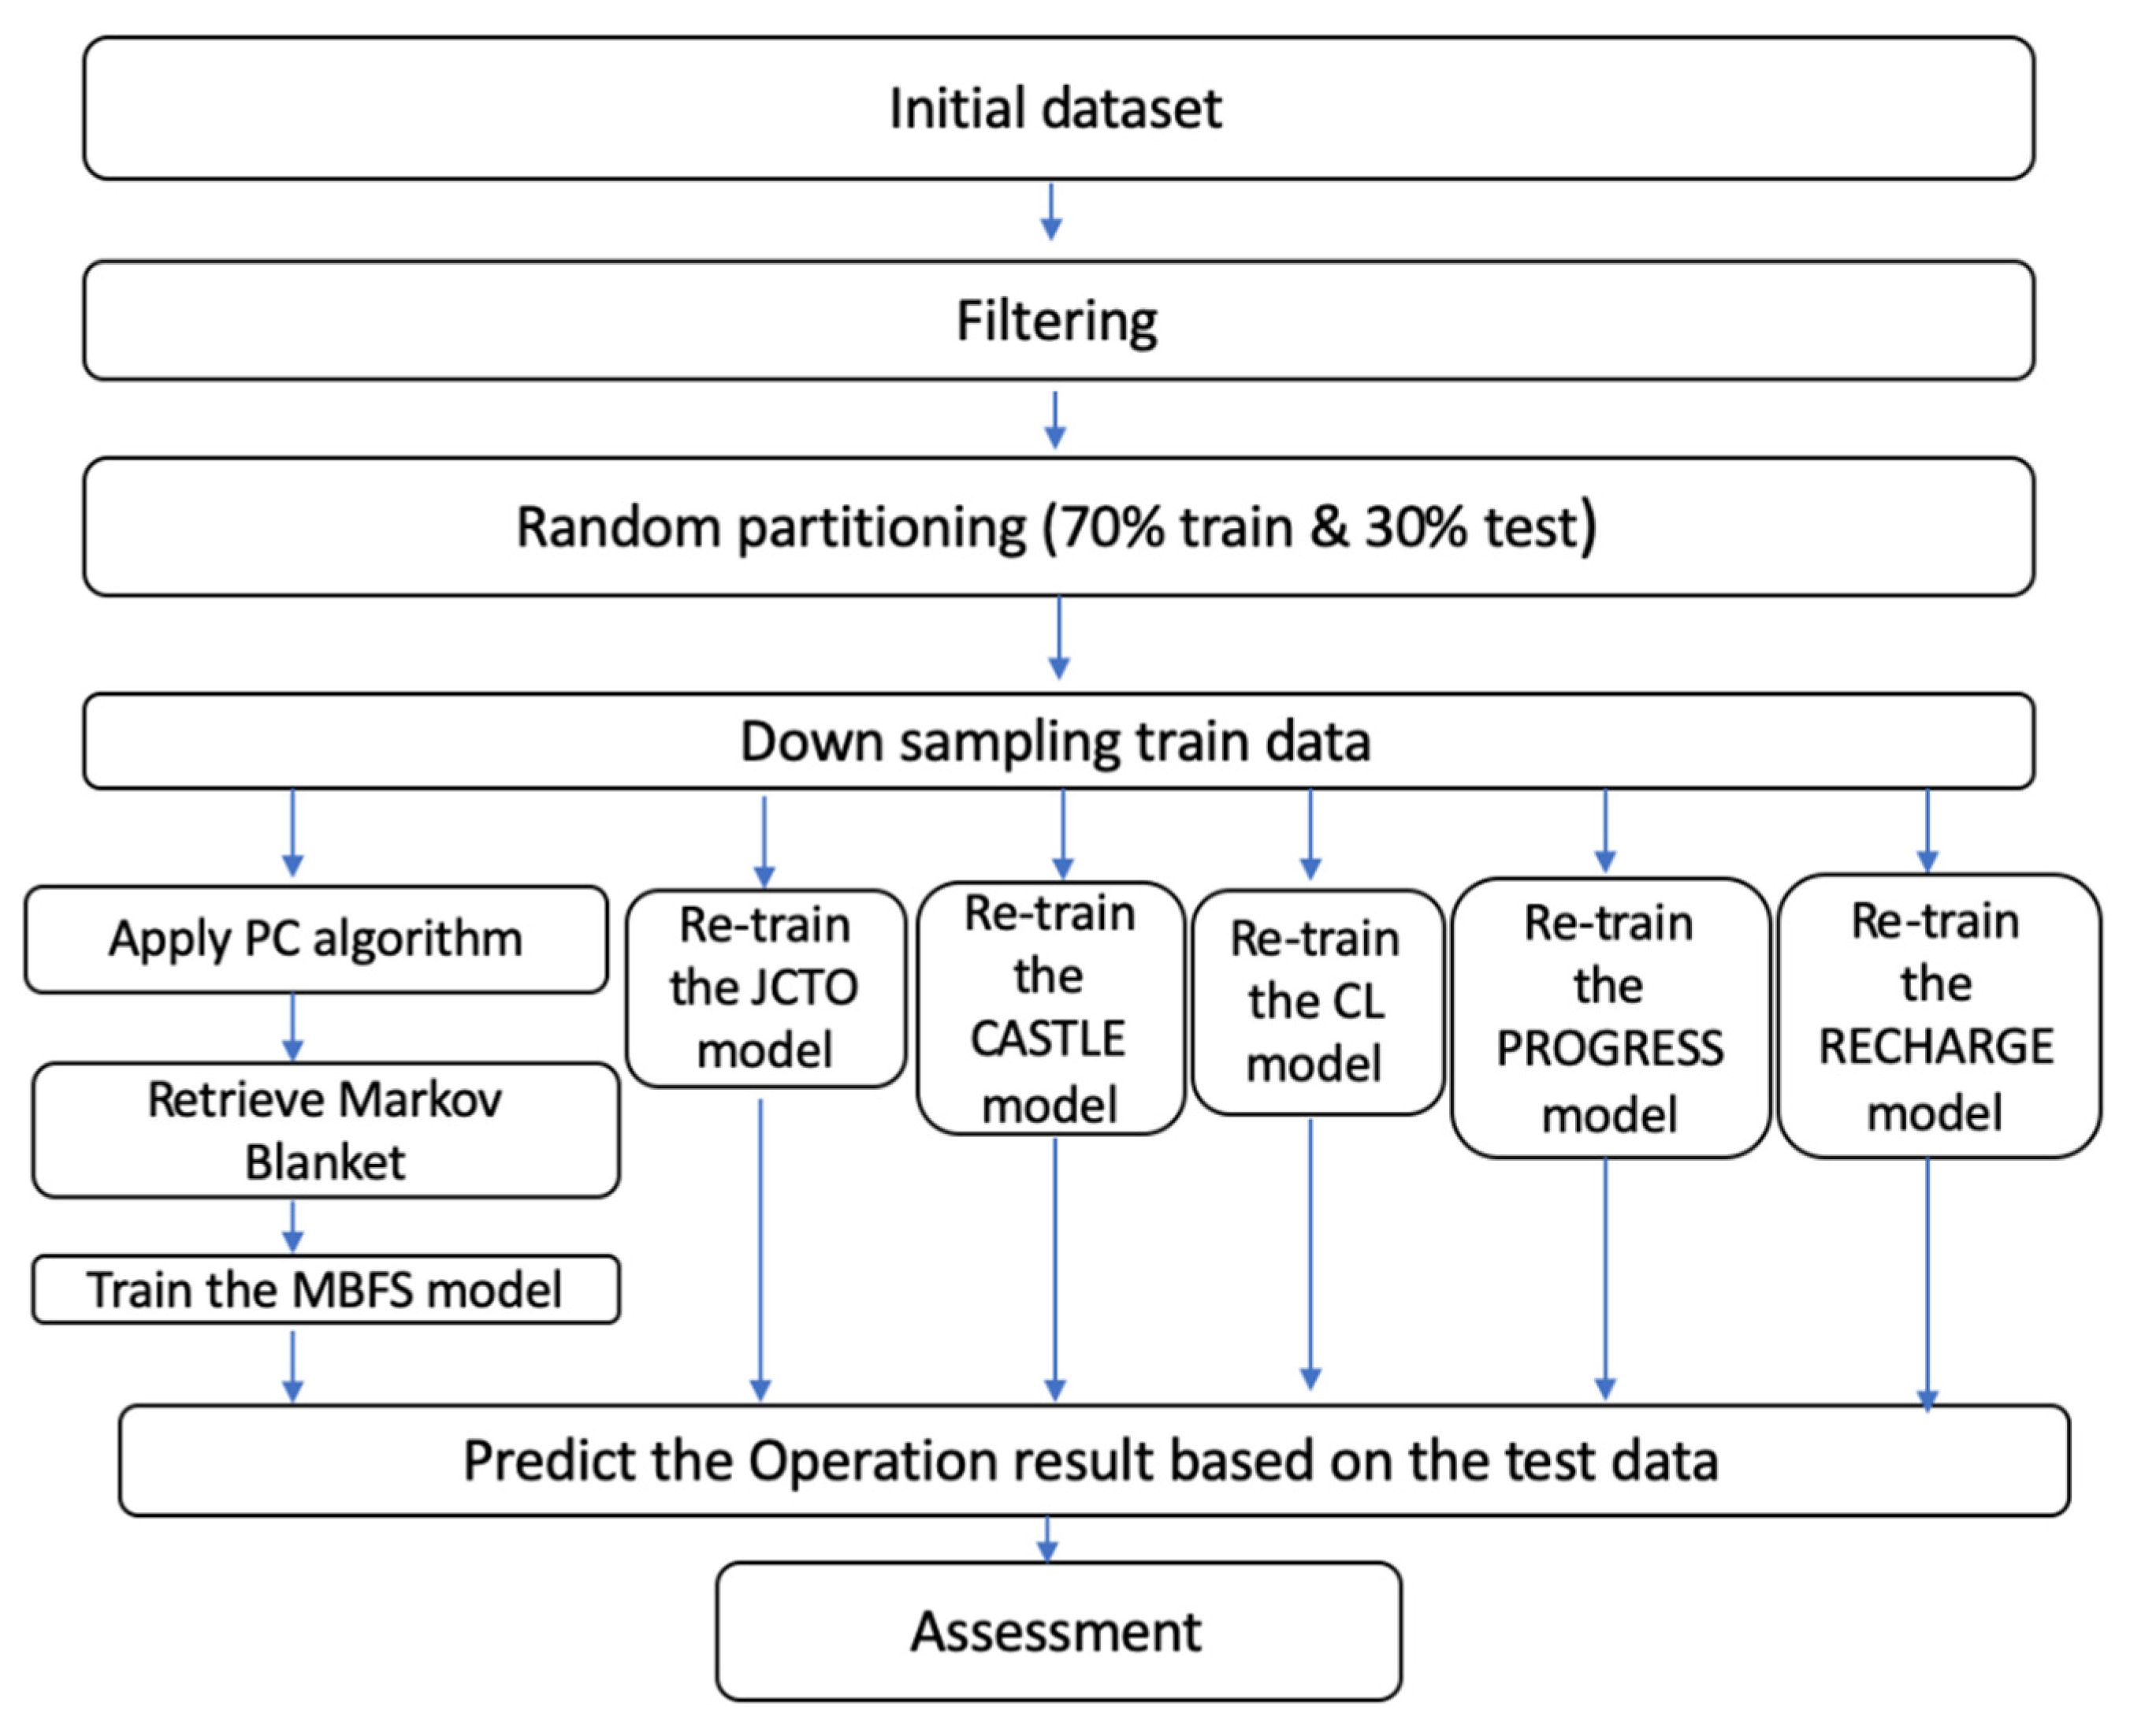
2.4.1. Preprocessing
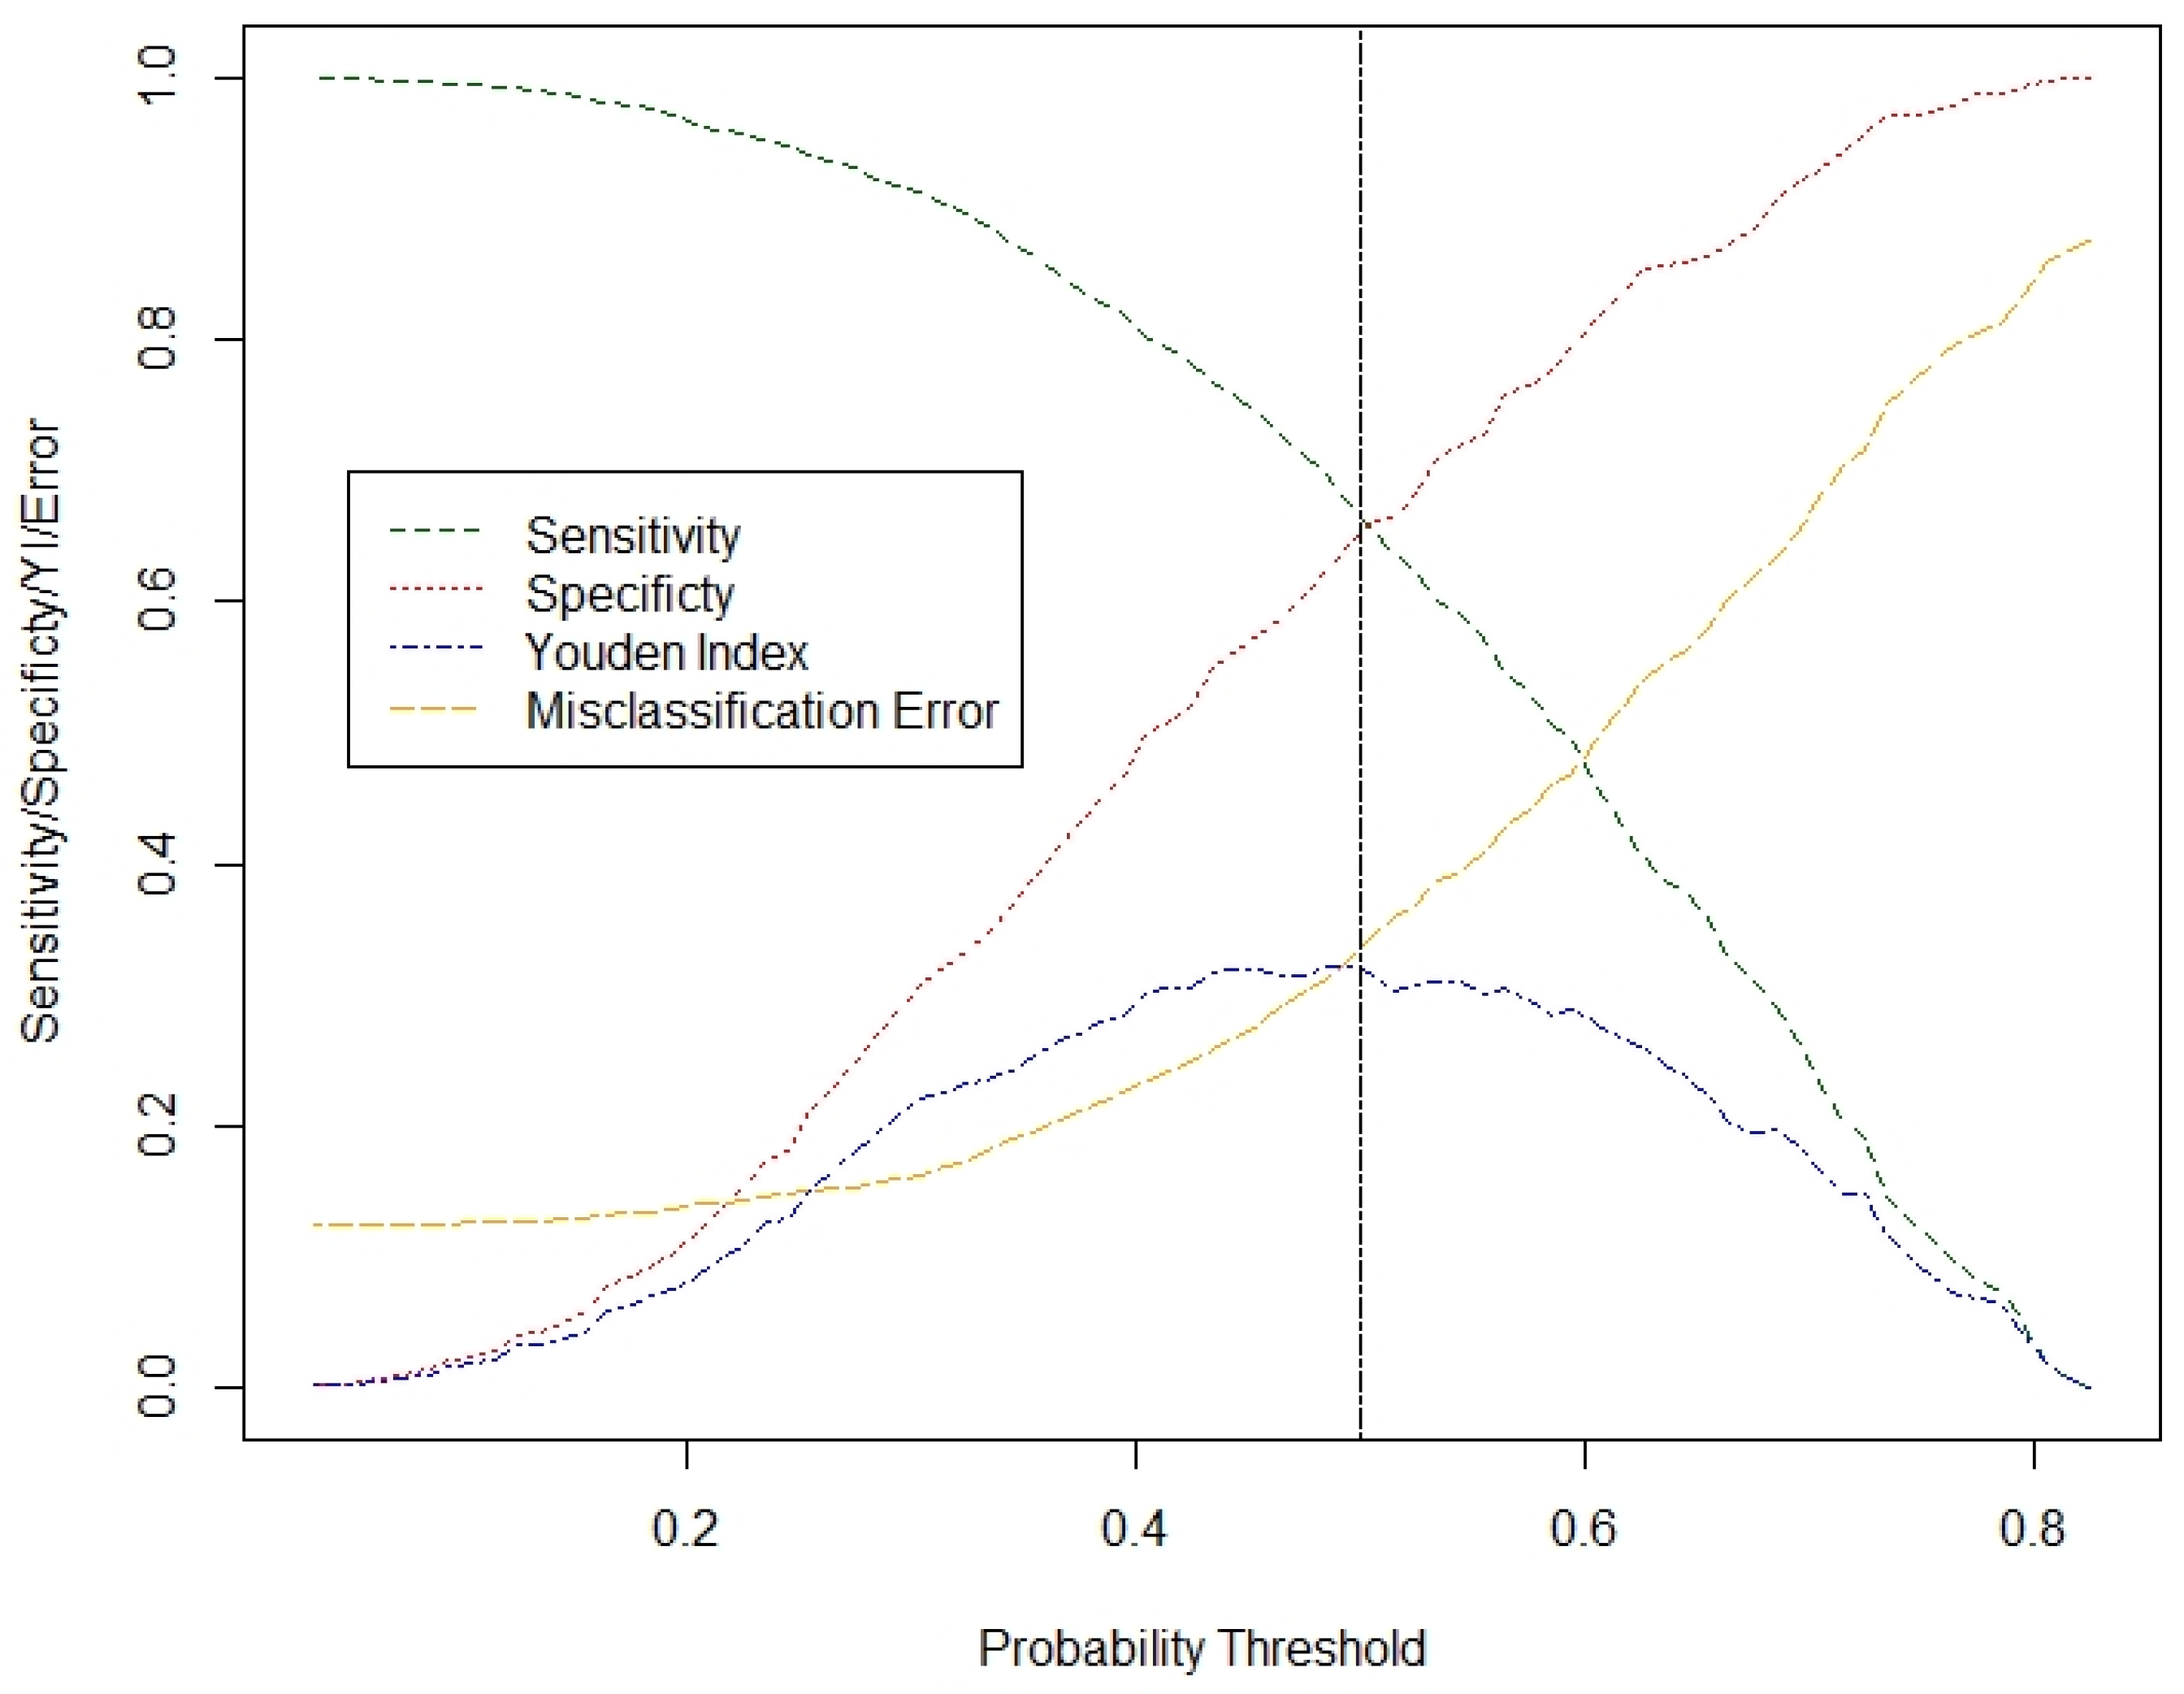
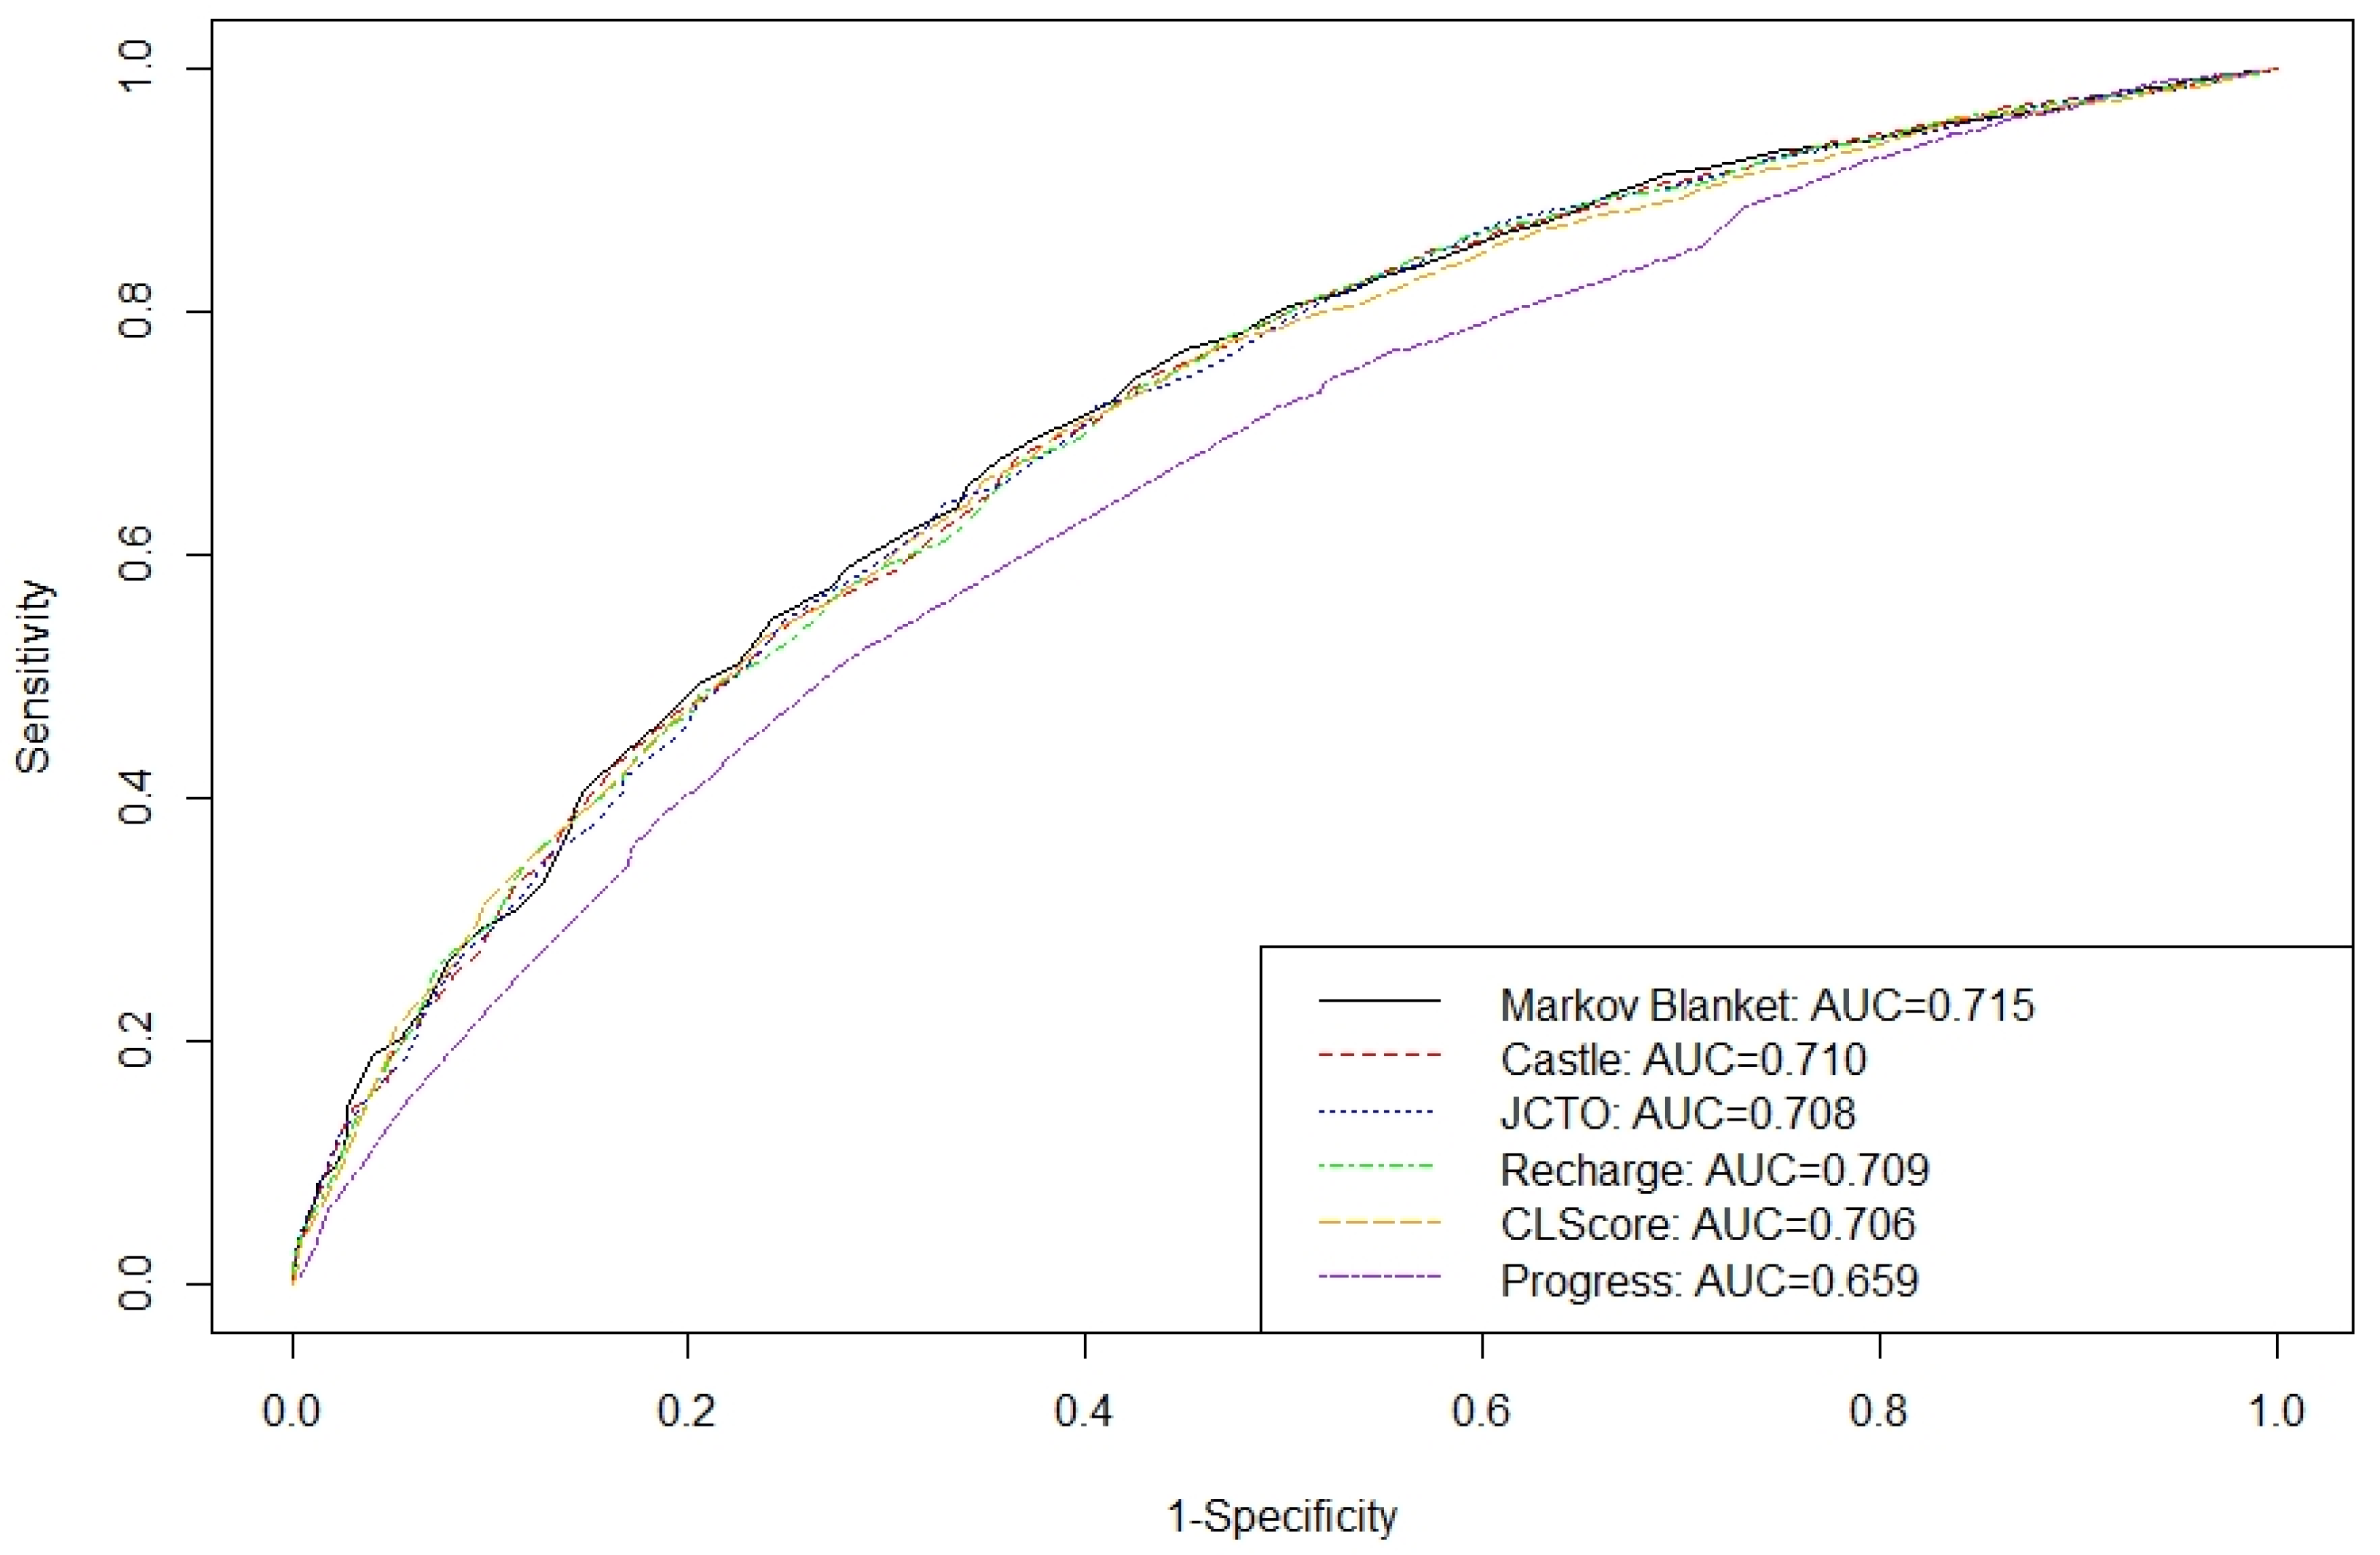
The initial dataset consisted of 29,995 cases and 164 variables. In order to focus on detecting predictors for the CTO PCI (response variable), conceptual (variables irrelevant to the result of the PCI were excluded), relevance (variables with weak association with the response were filtered out), and literature (variables considered important in the literature were included) criteria were used to filter the initial dataset and exclude a large number of variables. In addition, variables with missing values over 20% were not assessed. No imputation method for the missing values was considered, in order for the analysis to be based only on observed data. The association of the predictor variables with the response was separately assessed for each predictor variable with binary logistic regression analysis. Associations with a p-value > 0.05 resulted in excluding the corresponding variables from the dataset. The final dataset included 22 out of the 164 original variables with 17,370 complete cases.
This dataset was randomly partitioned into two sub-datasets, namely the training and the test datasets, which corresponded to 70% (n = 12,160) and 30% (n = 5210) of its cases, respectively. The training dataset was used for model development. The test dataset was used for model assessment. Since a strong class imbalance was observed between the two categories of the PCI result, failure and success, both in the initial dataset (n = 29,995 cases; 14% failure, 86% success) and in the filtered dataset (n = 17,370 cases; 12.4% failure, 87.6% success); the latter distribution remaining the same in the training dataset due to random partition, downsampling was applied. Particularly, the training dataset was randomly downsampled to address the class imbalance between the two classes of the response variable. The downsampling procedure employed randomly excluded cases with operation success until resulting in a dataset with equally sized classes (success and failure) for the response variable (n = 3026). Despite losing information, downsampling was selected, since it was assumed that it is of equal interest to correctly predict both the successful and unsuccessful operation results. In addition, by selecting downsampling compared to other approaches (e.g., upsampling), the likelihood of overfitting and consequent negative impact in the prediction model’s performance was avoided [14]. The above procedure is depicted in a flow chart (Figure 1).

2.4.2. Analysis

Standard descriptive analysis was performed both for the qualitative variables (frequencies, percentages) and for the quantitative variables (mean, standard deviation).
In the downsampled training dataset, the PC algorithm was used to develop the causal graph. Since both ordinal and continuous variables were included in the dataset, the constrained-based PC algorithm was used [12] with the R package “MXM” [15], which is appropriate for mixed data. In particular, the function “pc.skel” was used to produce the skeleton of the network, employing the "comb.mm" method (to assess the conditional independence for every pair of variables, each of the two variables is treated as response and the appropriate regression model is fitted. Next, two likelihood ratio tests are performed, and the two emerging p-values are combined in an overall p-value).
Next, the Markov blanket corresponding to the response variable was retrieved. All the variables that constituted the Markov blanket of the response were included as independent variables in a multivariate binary logistic regression model with the operation result as the dependent variable. This model was trained on the downsampled training dataset, resulting in the so-called Markov blanket for feature selection (MBFS) model.
The predictive accuracy of the MBFS model was assessed on the test dataset. Standard statistical accuracy measures were used, namely overall accuracy (overall proportion of true predictions), sensitivity (true predictions of successful operations over total number of successful operations), specificity (true predictions of unsuccessful operations over total number of unsuccessful operations), and the value of the area under the receiver operation characteristics (AUROC) curve [16].
Next, the predictive accuracy of the MBFS model was compared with five predictive models from the literature, namely, JCTO [2], CASTLE [3], RECHARGE [6], CL [4], and PROGRESS [5]. Particularly, the predictors included in each of these five models in the original manuscripts were included as independent variables in five multivariate binary logistic regression models, with the operation result as the target variable, respectively. For fairness, these five models were trained anew in the downsampled training dataset of this study, and new coefficient estimators were computed for the independent variables. Then, their predictive accuracy was assessed on the test dataset, and their performance was compared to the MBFS model. For the comparison, the Akaike information criterion (AIC) was computed after training each model on the downsampled training dataset, and the AUROC was computed while assessing each model on the test dataset.
In the RECHARGE model, the variable “Disease distal landing zone” was excluded since in the EuroCTO registry it exhibited a large number of missing values. Similarly, in the case of the PROGRESS model, the variable “No interventional collateral” was also excluded.
For all hypothesis tests, the level of statistical significance was set at a = 0.05. The analysis was performed with R version 4.1.0.

3. Results

The variable characteristics of the training and test datasets are shown in Supplemental Table A2 and Table A3 for all the 21 variables considered, separately for the cases with successful operation and unsuccessful operation. The results show that the training and test datasets are homogeneous regarding all variables considered. For completeness, the variable characteristics are shown as well for the downsampled training dataset (Supplemental Table A1), where the results are, as expected, different in general compared to the other two datasets.
The causal graph developed based on the PC algorithm is displayed in Figure 2. The graph revealed the complicated network structure of causal relations among factors that have effect on the operation result. Five variables appear to have a cause–effect relationship with the operation result, particularly the CTO length, proximal tortuosity, stump, calcification, and segmental regional are all direct causes of the operation result. The operation result does not have any effects/children in the graph; thus, the Markov blanket of the operation result is composed from its causes alone.
The five variables included in the Markov blanket were then included in a multivariate binary logistic regression model, and the results are shown in Table 1. All five variables were statistically significant in the multivariate model.
In Table 2, the assessment results of the MBFS model are shown. The overall accuracy of the MBFS model at a prediction probability threshold of 0.5 was 66.47%, with sensitivity at 66.62% (representing the percentage of correctly identifying cases with successful operation), and specificity at 65.43% (representing the percentage of correctly identifying cases with unsuccessful operation). The AUROC was 0.7145.
Figure 3 shows the tradeoff between sensitivity, specificity, Youden index (sum of sensitivity and specificity minus one), and misclassification error for different prediction probability thresholds. It is displayed that at the standard threshold of 0.5, the curves corresponding to sensitivity and specificity almost cross each other, thus resulting in very similar values (66.62% and 65.43%). At the same time, the Youden index approximately receives its maximum value (0.3205). On the other hand, the misclassification error is 33.44%, which is higher than its minimum value (12.44%), corresponding to prediction probability threshold equal to 0.035 (which is clearly, however, very close to zero). The reason for this is that in the test dataset, the class imbalance in operation success still exists, thus, decrease in sensitivity results in higher values of misclassification error, despite the larger increase in the specificity. Assuming that it is of equal interest to correctly predict both the successful and unsuccessful operation results, a slight increase of the misclassification error is acceptable provided that high values of specificity are achieved.
The results of the comparison among the MBFS model and the models JCTO, CASTLE, RECHARGE, CL, and PROGRESS are shown in Table 3 and Figure 4. In Table 3, the number of the features is displayed for each model, along with their specific names, the AIC value obtained based on the corresponding logistic regression model (downsampled training data), and the AUROC value (test data). The differences among the models are small, which has already been noted, among else, in [17]. The proposed MBFS model is the best one in terms of both the AIC (exhibited minimum value) and the AUROC (exhibited maximum value), compared to all the remaining models. Particularly, the MBFS model exhibited an AIC value of 3751.7, compared to (in increasing order) 3760.6 (JCTO), 3774 (CASTLE), 3774.1 (RECHARGE), 3841.7 (CL), and 3915.1 (PROGRESS). At the same time, the AUROC with the MBFS model was 0.715, compared to (in decreasing order) 0.710 (CASTLE), 0.709 (RECHARGE), 0.708 (JCTO), 0.706 (CL), and 0.659 (PROGRESS). Note that this is not a strict ranking of the above models, since the JCTO, CASTLE, RECHARGE, CL, and PROGRESS models are used in a different way than in the original articles, and mainly as feature selection tools in this study. In Figure 4, it is visually exhibited that the AUROC corresponding to the MBFS model surpasses all other models.

4. Discussion

CTO is a very common condition for patients that undergo coronary angiography. The increasing acceptance of PCI in CTO in recent years highlights the importance of efficiently detecting the factors that are strongly related with the result of the PCI for prediction model development. Several attempts are available in the literature that assess the impact of independent predictor variables to the PCI result. To the best of our knowledge in all previous attempts, the authors have used regression-based methodological procedures to select the predictor variables that will be included in their models. In this study, a new approach is proposed to select the most important predictor variables. This approach is based on exploiting the dynamics of cause–effect relationships between variables. The focus was on the local causal structure around the target variable, particularly on its Markov blanket. The Markov blanket of the operation result was used as a feature selection tool towards developing the prediction model for the result of the PCI. Essentially, variables detected to be causally related with the result of the PCI were included as independent factors in a prediction model for the result of the PCI (success/failure). A similar approach has been already successfully applied in [9], aiming in detecting the most informative variables in lung cancer.
The proposed prediction model, MBFS, included all five variables that constituted the Markov blanket of the operation result, namely, the CTO length, proximal tortuosity, stump, calcification, and segmental regional. The impact of proximal tortuosity, stump, calcification, and CTO length to the operation result (see Table 1) was found to be in agreement with the literature [2,3,4,5,6,7]. Particularly, it is known that the proximal tortuosity categories moderate and severe are compounding regarding the success of the operation compared to the straight class (odds ratio values 0.671, 0.355, respectively). Similarly, the classes moderate and severe of calcification are compounding regarding the success of the operation compared to the none/mild class (odds ratio values 0.697, 0.395, respectively). The CTO length negatively impacted the operation success, exhibiting odds ratio equal to 0.986. On the other hand, the stump categories tapered and blunt positively impacted the operation success compared to the no category (odds ratio values 3.247, 1.946, respectively). Interestingly, a new predictor variable was included in this model, namely the segmental regional. It was found that the category representing hypokinetic/akinetic/dyskinetic was compounding for operation success, compared to the category representing normal segmental regional, exhibiting an odds ratio equal to 0.674 (Table 1).
The MBFS model that is proposed in this study was assessed and compared to five well-known models from the literature. In the corresponding manuscripts of these five models [2,3,4,5,6], a multivariate binary logistic regression model was developed at first, and then a risk score was computed based on the magnitude of the coefficient estimates of the independent variables that were included in each model. Here, we were only interested in assessing the predictive ability of the binary logistic regression models themselves, which were all retrained in this dataset for fairness. Thus, the comparison is not a strict attempt to rank the MBFS and all five well-known models, but to also assess a novel approach that employs causality in detecting the most important predictor variables, compared to the standard approach that is mainly based on regression. The results of the assessment have not only shown that the MBFS model performed better than all its competitors, but a new important predictor factor emerged as well, namely, the segmental regional.
Building on this experience, a next step might be to further exploit the cause–effect relationships, not only with the target variable (here operation result), but between predictor variables as well. This could possibly assist in detecting yet unexplored variable relationships, and enrich the capacity of the final prediction model.

5. Conclusions

The above discussion highlights the strong potential of causality as a feature selection tool in prediction model development. Particularly, capitalizing on the dynamics of local causal structure and the Markov blanket resulted in a promising prediction model, and showcased the prospects of employing causal relationships in building prediction models.
Causal model development has yet to be thoroughly assessed as a prediction tool in different scientific fields. In this study, the usage of local causal structure as a feature selection tool for prediction regarding the result of PCI in CTO resulted in developing a very competitive model, thus, highlighting the potential of causal models for applications.

Author Contributions

Conceptualization, M.G., G.S. and L.A.; data curation, M.G.; methodology, M.G. and L.A.; software, M.G. and L.A.; validation, G.S. and L.A.; formal analysis, M.G. and L.A.; resources, G.S.; writing—original draft preparation, M.G. and I.K.; writing—review and editing, M.G., G.S. and L.A.; visualization, M.G.; supervision, G.S. and L.A.; project administration, M.G.; funding acquisition, M.G., I.K., G.S. and L.A. All authors have read and agreed to the published version of the manuscript.

Funding

This research is co-financed by Greece and the European Union (European Social Fund- ESF) through the Operational Programme ‘Support for Researchers with Emphasis on Young Researchers’ in the context of the project ‘EDBM103-Part B, 2020–2022’ (MIS: 5047860).

Institutional Review Board Statement

The study was conducted according to the guidelines of the Declaration of Helsinki and approved by the Institutional Review Board of each center.

Informed Consent Statement

Informed consent was obtained from all subjects involved in the study.

Data Availability Statement

The data will not be made available to other researchers for purposes of reproducing the results.

Conflicts of Interest

The authors declare no conflict of interest.

Appendix A

Table A1. Descriptive characteristics for the downsampled training dataset (n = 3026). For quantitative variables, the mean and standard deviation (in brackets) are displayed. For qualitative variables, the frequencies and corresponding percentages (in brackets) are displayed for each category.
VariableOperation Success
n = 1513
Operation Failure
n = 1513
Calcification (%)
   None/Mild (spots)
   Moderate(<=50% RLD)
   Severe (>50% RLD)

902 (59.6)
407 (26.9)
204 (13.5)

583 (38.5)
464 (30.7)
466 (30.8)
Segmental regional (%)
   Normal
   H/A/D

835 (55.2)
678 (44.8)

678 (44.8)
835 (55.2)
Age, mean (SD)64.12 (10.6)65.21 (10.1)
Weight, mean (SD)84.31 (16.5)84.47 (16.4)
Family history (%)
   No
   Yes

1059 (70.0)
454 (30.0)

1065 (70)
448 (29.6)
Dyslipidemia (%)
   No
   Yes

338 (22.3)
1175 (77.7)

303 (20.0)
1210 (80.0)
Diabetes (%)
   No
   Yes

1045 (69.1)
468 (30.9)

1025 (67.8)
488 (32.3)
Peripheral disease (%)
   No
   Yes

1369 (90.5)
144 (9.5)

1314 (88.8)
199 (13.2)
COPD (%)
   No
   Yes

1429 (94.4)
84 (5.5)

1411 (93.3)
102 (6.7)
Prior stroke (%)
   No
   Yes

1472 (97.3)
41 (2.7)

1456 (96.2)
57 (3.8)
Renal failure (%)
   No
   Yes

1495 (98.8)
18 (1.2)

1498 (99.0)
15 (1.0)
Previous MI (%)
   No
   Yes

940 (62.1)
573 (37.9)

901 (59.6)
612 (40.5)
Previous CABG (%)
   No
   Yes

1325 (87.6)
188 (12.4)

1239 (81.9)
274 (18.1)
Previous PCI (%)
   No
   Yes

795 (52.5)
718 (47.5)

730 (48.3)
783 (51.8)
CTO location (%)
   Ostial
   Proximal
   Mid
   Distal

156 (10.3)
649 (42.9)
607 (40.1)
101 (6.7)

219 (14.5)
638 (42.2)
571 (37.7)
85 (5.6)
In stent CTO (%)
   No
   Yes

1401 (92.6)
112 (7.4)

1409 (93.1)
104 (6.9)
Bifurcation involvement (%)
   No
   Yes

1217 (80.4)
296 (19.6)

1262 (83.4)
251 (16.6)
CTO length, mean (SD)28.28 (18.6)36.23 (22.1)
Vessel diameter, mean (SD)2.93 (0.4)2.90 (0.5)
Proximal tortuosity (%)
   Straight
   Moderate
   Severe

1098 (72.6)
336 (22.2)
79 (5.2)

822 (54.3)
463 (30.6)
228 (15.1)
Stump (%)
   No stump
   Tapered stump
   Blunt stump

171 (11.3)
745 (49.2)
597 (39.5)

358 (23.7)
413 (27.3)
742 (49.0)
Table A2. Descriptive characteristics for the training dataset (n = 12,160). For quantitative variables, the mean and standard deviation (in brackets) are displayed. For qualitative variables, the frequencies and corresponding percentages (in brackets) are displayed for each category.
VariableOperation Success
n = 10,647
Operation Failure
m = 1513
Calcification (%)
   None/Mild (spots)
   Moderate (<=50% RLD)
   Severe (>50% RLD)

6270 (58.9)
2877 (27.0)
1500 (14.1)

583 (38.5)
464 (30.7)
466 (30.8)
Segmental regional (%)
   Normal
   H/A/D

5658 (53.1)
4989 (46.9)

678 (44.8)
835 (55.2)
Age, mean (SD)64.06 (10.7)65.21 (10.1)
Weight, mean (SD)84.32 (16.3)84.47 (16.4)
Family history (%)
   No
   Yes

7379 (69.3)
3268 (30.7)

1065 (70.4)
448 (29.6)
Dyslipidemia (%)
   No
   Yes

2356 (22.1)
8291 (77.9)

303 (20.0)
1210 (80.0)
Diabetes (%)
   No
   Yes

7382 (69.3)
3265 (30.7)

1025 (67.8)
488 (32.3)
Peripheral disease (%)
    No
    Yes

9611 (90.3)
1036 (9.7)

1314 (88.8)
199 (13.2)
COPD (%)
    No
    Yes

10108 (94.9)
539 (5.1)

1411 (93.3)
102 (6.7)
Prior stroke (%)
   No
   Yes

10363 (97.3)
284 (2.7)

1456 (96.2)
57 (3.8)
Renal failure (%)
   No
   Yes

10536 (99.0)
111 (1.0)

1498 (99.0)
15 (1.0)
Previous MI (%)
   No
   Yes

6601 (62.0)
4046 (38.0)

901 (59.6)
612 (40.5)
Previous CABG (%)
   No
   Yes

9324 (87.6)
1323 (12.4)

1239 (81.9)
274 (18.1)
Previous PCI (%)
   No
   Yes

5591 (52.5)
5056 (47.5)

730 (48.3)
783 (51.8)
CTO location (%)
   Ostial
   Proximal
   Mid
   Distal

1018 (9.6)
4581 (43.0)
4311 (40.5)
737 (6.9)

219 (14.5)
638 (42.2)
571 (37.7)
85 (5.6)
In stent CTO (%)
   No
   Yes

9793 (92.0)
854 (8.0)

1409 (93.1)
104 (6.9)
Bifurcation involvement (%)
   No
   Yes

8526 (80.1)
2121 (19.9)

1262 (83.4)
251 (16.6)
CTO length, mean (SD)28.72 (18.8)36.23 (22.1)
Vessel diameter, mean (SD)2.94 (0.4)2.90 (0.5)
Proximal tortuosity (%)
   Straight
   Moderate
   Severe

7535(70.8)
2567(24.1)
545(5.1)

822 (54.3)
463 (30.6)
228 (15.1)
Stump (%)
   No stump
   Tapered stump
   Blunt stump

1219 (11.5)
5088 (47.8)
4340 (40.8)

358 (23.7)
413 (27.3)
742 (49.0)
Table A3. Descriptive characteristics for the test dataset (n = 5210). For quantitative variables, the mean and standard deviation (in brackets) are displayed. For qualitative variables, the frequencies and corresponding percentages (in brackets) are displayed for each category.
VariableOperation Success
n = 4562
Operation Failure
n = 648
Calcification (%)
   None/Mild (spots)
   Moderate (<=50% RLD)
   Severe (>50% RLD)

2714 (59.5)
1167 (25.6)
681 (14.9)

246 (38.0)
178 (27.5)
224 (34.6)
Segmental regional (%)
   Normal
   H/A/D

2430 (53.3)
2132 (46.7)

277 (42.8)
371 (57.3)
Age, mean (SD)63.98 (10.6)65.53 (10.5)
Weight, mean (SD)84.34 (16.1)85.89 (16.8)
Family history (%)
   No
   Yes

3132 (68.7)
1430 (31.4)

444 (68.5)
204 (31.5)
Dyslipidemia (%)
   No
   Yes

1027 (22.5)
3535 (77.5)

143 (22.1)
505 (77.9)
Diabetes (%)
   No
   Yes

3096 (67.9)
1466 (32.1)

411 (63.4)
237 (36.6)
Peripheral disease (%)
   No
   Yes

4106 (90.0)
456 (10.0)

543 (83.8)
105 (16.2)
COPD (%)
   No
   Yes

4339 (95.1)
223 (4.9)

594 (91.7)
54 (8.3)
Prior stroke (%)
   No
   Yes

4440 (97.3)
122 (2.7)

625 (96.5)
23 (3.6)
Renal failure (%)
   No
   Yes

4508 (98.8)
54 (1.2)

638 (98.5)
10 (1.5)
Previous MI (%)
   No
   Yes

2831 (62.1)
1731 (37.9)

365 (56.3)
283 (43.7)
Previous CABG (%)
   No
   Yes

3985 (87.4)
577 (12.7)

516 (79.6)
132 (20.4)
Previous PCI (%)
   No
   Yes

2357 (51.7)
2205 (48.3)

300 (46.3)
348 (53.7)
CTO location (%)
   Ostial
   Proximal
   Mid
   Distal

451 (9.9)
1985 (43.5)
1822 (39.9)
304 (6.7)

84 (13.0)
272 (42.0)
250 (38.6)
42 (6.5)
In stent CTO (%)
   No
   Yes

4144 (90.9)
418 (9.2)

614 (94.8)
34 (5.3)
Bifurcation involvement (%)
   No
   Yes

3653 (80.1)
909 (19.9)

516 (79.6)
132 (20.4)
CTO length, mean (SD)29.07 (19.7)37.27 (22.9)
Vessel diameter, mean (SD)2.94 (0.4)2.91 (0.4)
Proximal tortuosity (%)
   Straight
   Moderate
   Severe

3173 (69.6)
1161 (25.5)
228 (5.0)

369 (57.0)
200 (30.9)
79 (12.2)
Stump (%)
   No stump
   Tapered stump
   Blunt stump

538 (11.8)
2190 (48.0)
1834 (40.2)

151 (23.3)
171 (26.4)
326 (50.3)

References

  1. Konstantinidis, N.; Werner, G.; Deftereos, S.; Di Mario, C.; Galassi, A.; Buettner, J.; Avran, A.; Reifart, N.; Garbo, O.R.; Bufe, A.; et al. Temporal trends in chronic Total occlusion interventions in Europe: 17 626 procedures from the European registry of chronic Total occlusion. Circ. Cardiovasc. Interv. 2018, 11, e006229. [Google Scholar] [CrossRef] [PubMed]
  2. Morino, Y.; Abe, M.; Morimoto, T.; Kimura, T.; Hayashi, Y.; Muramatsu, T.; Ochiai, M.; Noguchi, Y.; Kato, K.; Shibata, Y.; et al. Predicting Successful Guidewire Crossing Through Chronic Total Occlusion of Native Coronary Lesions Within 30 Minutes: The J-CTO (Multicenter CTO Registry in Japan) Score as a Difficulty Grading and Time Assessment Tool. JACC Cardiovasc. Interv. 2011, 4, 213–221. [Google Scholar] [CrossRef] [PubMed] [Green Version]
  3. Szijgyarto, Z.; Rampat, R.; Werner, G.; Ho, C.; Reifart, N.; Lefevre, T.; Louvard, Y.; Avran, A.; Kambis, M.; Buettner, H.; et al. Derivation and validation of a chronic total coronary occlusion intervention procedural success score from the 20,000-patient EuroCTO registry: The EuroCTO (CASTLE) score. JACC Cardiovasc. Interv. 2019, 12, 335–342. [Google Scholar] [CrossRef] [PubMed]
  4. Alessandrino, G.; Chevalier, B.; Lefèvre, T.; Sanguineti, F.; Garot, P.; Unterseeh, T.; Hovasse, T.; Morice, M.-C.; Louvard, Y. A Clinical and Angiographic Scoring System to Predict the Probability of Successful First-Attempt Percutaneous Coronary Intervention in Patients with Total Chronic Coronary Occlusion. JACC Cardiovasc. Interv. 2015, 8, 1540–1548. [Google Scholar] [CrossRef] [PubMed] [Green Version]
  5. Christopoulos, G.; Kandzari, D.; Yeh, R.; Jaffer, F.; Karmpaliotis, D.; Wyman, M.; Alaswad, K.; Lombardi, W.; Grantham, J.; Moses, J.; et al. Development and validation of a novel scoring system for predicting technical success of chronic total occlusion percutaneous coronary interventions the PROGRESS CTO (Prospective Global Registry for the Study of Chronic Total Occlusion Intervention) score. JACC Cardiovasc. Interv. 2016, 9, 1–9. [Google Scholar] [CrossRef] [PubMed] [Green Version]
  6. Maeremans, J.; Spratt, J.; Knaapen, P.; Walsh, S.; Agostoni, P.; Wilson, W.; Avran, A.; Faurie, B.; Bressollette, E.; Kayaert, P.; et al. Towards a contemporary, comprehensive scoring system for determining technical outcomes of hybrid percutaneous chronic total occlusion treatment: The RECHARGE score. Catheter. Cardiovasc. Interv. 2018, 91, 192–202. [Google Scholar] [CrossRef] [PubMed]
  7. Galassi, A.; Boukhris, M.; Azzarelli, S.; Castaing, M.; Marzà, F.; Tomasello, S. Percutaneous coronary revascularization for chronic total occlusions: A novel predictive score of technical failure using advanced technologies. JACC Cardiovasc. Interv. 2016, 9, 911–922. [Google Scholar] [CrossRef] [PubMed]
  8. Aliferis, C.F.; Statnikov, A.; Tsamardinos, I.; Mani, S.; Koutsoukos, X.D. Local causal and Markov blanket induction for causal discovery and feature selection for classification part I: Algorithms and empirical evaluation. J. Mach. Learn. Res. 2010, 11, 171–234. [Google Scholar]
  9. Raghu, V.K.; Zhao, W.; Pu, J.; Leader, J.K.; Wang, R.; Herman, J.; Yuan, J.-M.; Benos, P.V.; O Wilson, D. Feasibility of lung cancer prediction from low-dose CT scan and smoking factors using causal models. Thorax 2019, 74, 643–649. [Google Scholar] [CrossRef] [PubMed] [Green Version]
  10. Piccininni, M.; Konigorski, S.; Rohmann, J.L.; Kurth, T. Directed acyclic graphs and causal thinking in clinical risk prediction modeling. BMC Med. Res. Methodol. 2020, 20, 1–9. [Google Scholar] [CrossRef] [PubMed]
  11. Neopolitan, R.E. Learning Bayesian Networks; Prentice Hall: Hoboken, NJ, USA, 2003. [Google Scholar]
  12. Spirtes, P.; Glymour, C.C.; Scheines, R. Causation, Prediction, and Search, 2nd ed.; The MIT Press: Cambridge, MA, USA, 2000. [Google Scholar]
  13. Li, J.; Liu, L.; Le, T.D. Practical Approaches to Causal Relationship Exploration; Springer: Berlin/Heidelberg, Germany, 2015. [Google Scholar]
  14. Fernández, A.; García, S.; Galar, M.; Prati, R.; Krawczyk, B.; Herrera, F. Learning from Imbalanced Data Sets; Springer: Berlin/Heidelberg, Germany, 2018; Volume 10, pp. 978–983. [Google Scholar]
  15. Tsagris, M.; Bordoudakis, G.; Lagani, V.; Tsamardinos, I. Constraint-based causal discovery with mixed data. Int. J. Data Sci. Anal. 2018, 6, 19–40. [Google Scholar] [CrossRef] [PubMed] [Green Version]
  16. Hajian-Tilaki, K. Receiver Operating Characteristic (ROC) Curve Analysis for Medical Diagnostic Test Evaluation. Casp. J. Intern. Med. 2013, 4, 627–635. [Google Scholar]
  17. Karatasakis, A.; Danek, B.A.; Karmpaliotis, D.; Alaswad, K.; Jaffer, F.A.; Yeh, R.W.; Patel, M.; Bahadorani, J.N.; Lombardi, W.L.; Wyman, R.M.; et al. Comparison of various scores for predicting success of chronic total occlusion percutaneous coronary intervention. Int. J. Cardiol. 2016, 224, 50–56. [Google Scholar] [CrossRef] [PubMed]
Figure 1. Flowchart depicting the methodological procedure of the analysis.
Applsci 11 09258 g001
Figure 2. The causal graph over the downsampled training dataset (n = 3026, 22 variables) is displayed. The five nodes/variables constituting the Markov blanket around the operation success exhibit a directed arrow towards operation success.
Applsci 11 09258 g002
Figure 3. Diagram of the sensitivity, specificity, Youden index, and misclassification error for the MBFS model across different prediction probability thresholds, based on the test dataset (n = 5210).
Applsci 11 09258 g003
Figure 4. Diagram of the area under the receiver operation characteristics (AUROC) curve of all six models, based on the test dataset (n = 5210).
Applsci 11 09258 g004
Table 1. Multivariate binary logistic regression analysis for success of the PCI. Estimates of the odds ratios (Exp(B)) and their 95% confidence intervals corresponding to the MBFS model based on the downsampled training dataset (n = 3026) are displayed, along with their p-values.
95% Confidence Interval for Exp (B)
VariablesExp (B)LowerUpperp-Value
(Intercept)1.5011.171.930.001
Calcification_None/Mild (spots)1.000
Calcification_Moderate (<=50% RLD)0.6970.580.84<0.001
Calcification_Severe (>50% RLD)0.3950.320.49<0.001
Segmental regional_Normal1.000
Segmental regional_H/A/D0.6740.580.79<0.001
CTO length0.9860.980.99<0.001
Proximal tortuosity_Straight1.000
Proximal tortuosity_Moderate0.6710.560.80<0.001
Proximal tortuosity_Severe0.3550.270.47<0.001
Stump_No1.000
Stump_Tapered3.2372.584.07<0.001
Stump_Blunt1.9461.562.43<0.001
Table 2. Accuracy measures for the MBFS model over the test dataset (n = 5210). The values of overall accuracy, sensitivity, specificity, and area under the receiver operation characteristics (AUROC) curve are displayed (the selected threshold for the predicted probabilities was set to 0.5).
Accuracy Measures MBFS
Overall Accuracy0.6647
Sensitivity0.6662
Specificity0.6543
AUROC0.7145
Table 3. Comparison of the six models. The number of the features is displayed for each model, along with their specific names, the Akaike information criterion (AIC) value obtained based on the corresponding logistic regression model (downsampled training dataset, n = 3026), and the area under the receiver operation characteristics (AUROC) value (test dataset, n = 5210).
Model Name# of FeaturesFEATURES USEDAICAUROC
MBFS5Segmental, Proximal tortuosity, Calcification, Stump, CTO length3751.70.715
CASTLE6Previous CABG, Age, Proximal tortuosity, Calcification, Stump, CTO length37740.710
JCTO5Proximal tortuosity, Calcification, Stump, CTO length, Previously failed lesion3760.60.708
RECHARGE5Previous CABG, Proximal tortuosity, Calcification, Stump, CTO length3774.10.709
CL6Previous CABG, Previous MI, Calcification, Stump, CTO length, n-LAD3841.70.706
PROGRESS4Previous PCI, Proximal tortuosity, Stump, CTO artery3915.10.659
Publisher’s Note: MDPI stays neutral with regard to jurisdictional claims in published maps and institutional affiliations.

